1. Introduction
Urban public spaces play a crucial role in the urban fabric [
1,
2] with their nature shaped by factors such as history, geography, and political context. Planned events in these spaces alter their regular use, creating opportunities to make cities more dynamic and responsive while enhancing cultural and economic value [
3,
4,
5,
6]. The increasing number of events in cities [
7,
8,
9] highlights the urgent need to rethink the planning and design of urban events to accommodate the multifunctional use of public spaces. However, despite their significant impact on urban public space, events in urban spaces often consider urban design criteria poorly or not at all [
10,
11,
12]. In response, Karachalis [
13], for instance, has suggested a participatory tool approach as a means to achieve better temporary event interventions in public space. As a counterpoint to this approach, we describe below our technology-enabled approach, aimed, more specifically, at designers of spatial event layouts.
This study builds directly upon the findings of research reported by Behmanesh and Brown [
14], which highlighted the lack of robust integration of urban design principles in the planning of temporary urban events and the resulting micro-urban challenges within public spaces. That research emphasised the need for a functioning and practical process to guide city event designers and planners in addressing commonly overlooked spatial and experiential factors. But it also identified that the urban design principles embodied in any tool or framework should be comprehensible and applicable by those who are not expert in urban design principles. In response, a design-based criteria framework was proposed as a conceptual foundation for such a process. This framework is powerful enough to enable very useful decision-making but also simple enough for non-experts to apply. The current study operationalises that framework by developing a digital tool, intended not as a fully fledged technological innovation in itself, but as a medium through which the earlier research outcomes can be applied and tested in real-world participatory planning contexts. By providing visual and interactive support to non-expert users, the tool aims to bridge the gap between theoretical urban design principles and practical event layout planning.
Given these insights, confirmed by interviews with event designers [
14] there are clear potential benefits in having a dedicated tool that supports the integration of appropriate urban design principles into the planning of temporary urban events. Current planning practices often overlook the spatial, social, and functional impacts of temporary infrastructure, especially regarding user experience and the overall quality of public spaces. A tool that improves the design process, particularly for non-expert users, can help address these gaps and ensure that temporary urban events are not only well-organised but also contribute positively to the urban environment.
Expanding on those insights, the present paper introduces a digital design and evaluation tool aimed at operationalising these criteria for non-expert users, including event planners/designers and other stakeholders. By comparing immersive technologies namely Virtual Reality (VR), Augmented Reality (AR), and Mixed Reality (MR), and developing a user-friendly interface in tandem, this research proposes a novel approach to improving the integration of core urban design principles in the early phases of event layout planning.
2. Research Approach and Methods
Designed for non-expert users, the tool outlined above aims to support more spatially responsive and inclusive event planning. The research follows a three-stage process:
Stage 1: Evaluate previous event layouts against selected design-based criteria.
Stage 2: Compare different spatial representation methods to develop a design and evaluation tool for use in the event design process.
Stage 3: Develop the resulting tool and assess its effectiveness in the event design and evaluation process through a survey method.
Stage 1 evaluated event layouts against classical and fundamental design-based criteria [
14] to identify neglected or under-considered aspects in the event design process. The following criteria were identified as the primary considerations, and ones that a non-professional designer might usefully be able to employ the following:
The application of these criteria was tested against a frequently used urban space for events, with its layout assessed in three different scenarios:
Existing Situation: The space in its regular use without an event, offering insights into its potentials and limitations as an event venue.
Evaluation: The space with a conventionally planned event, highlighting the impact of the event on the urban space. While events are intended to enhance public space usage, the evaluation examined the impact on effectiveness and quality of the intervention.
Design: The space with an event layout designed by considering design-based criteria, demonstrating how incorporating these criteria could improve the space’s quality.
In Stage 2, four different representation methods were explored to illustrate design-based criteria for non-expert users:
Analogue Representation (Device: Hand-drawn sketches).
User-Modified Virtual Reality Representation (Device: HTC Vive headset).
Augmented Reality Representation (Device: Adobe Aero).
Mixed Reality Representation (Device: Microsoft HoloLens).
Comparative analysis suggested that Virtual Reality and Mixed Reality were the most applicable methods for use in the event design process. These insights guided the development of the design tool.
Stage 3 involved conducting an experiment session and a survey to assess the tool’s effectiveness. Event designers were invited to test the tool in a hands-on session and provide feedback on its usability and impact on the event design process. Thematic analysis strategy has been used for the purpose of analysis of collected data in the last part of this research. Thematic analysis is a method that relies on constant comparative analysis processes [
15]. Braun and Clarke [
16] define thematic analysis as ‘a method for systematically identifying, organising, and offering insight into patterns of meaning (themes) across a data set’. Establishing qualitative coding protocols and extract themes from the interview transcripts or texts are part of the thematic analysis process.
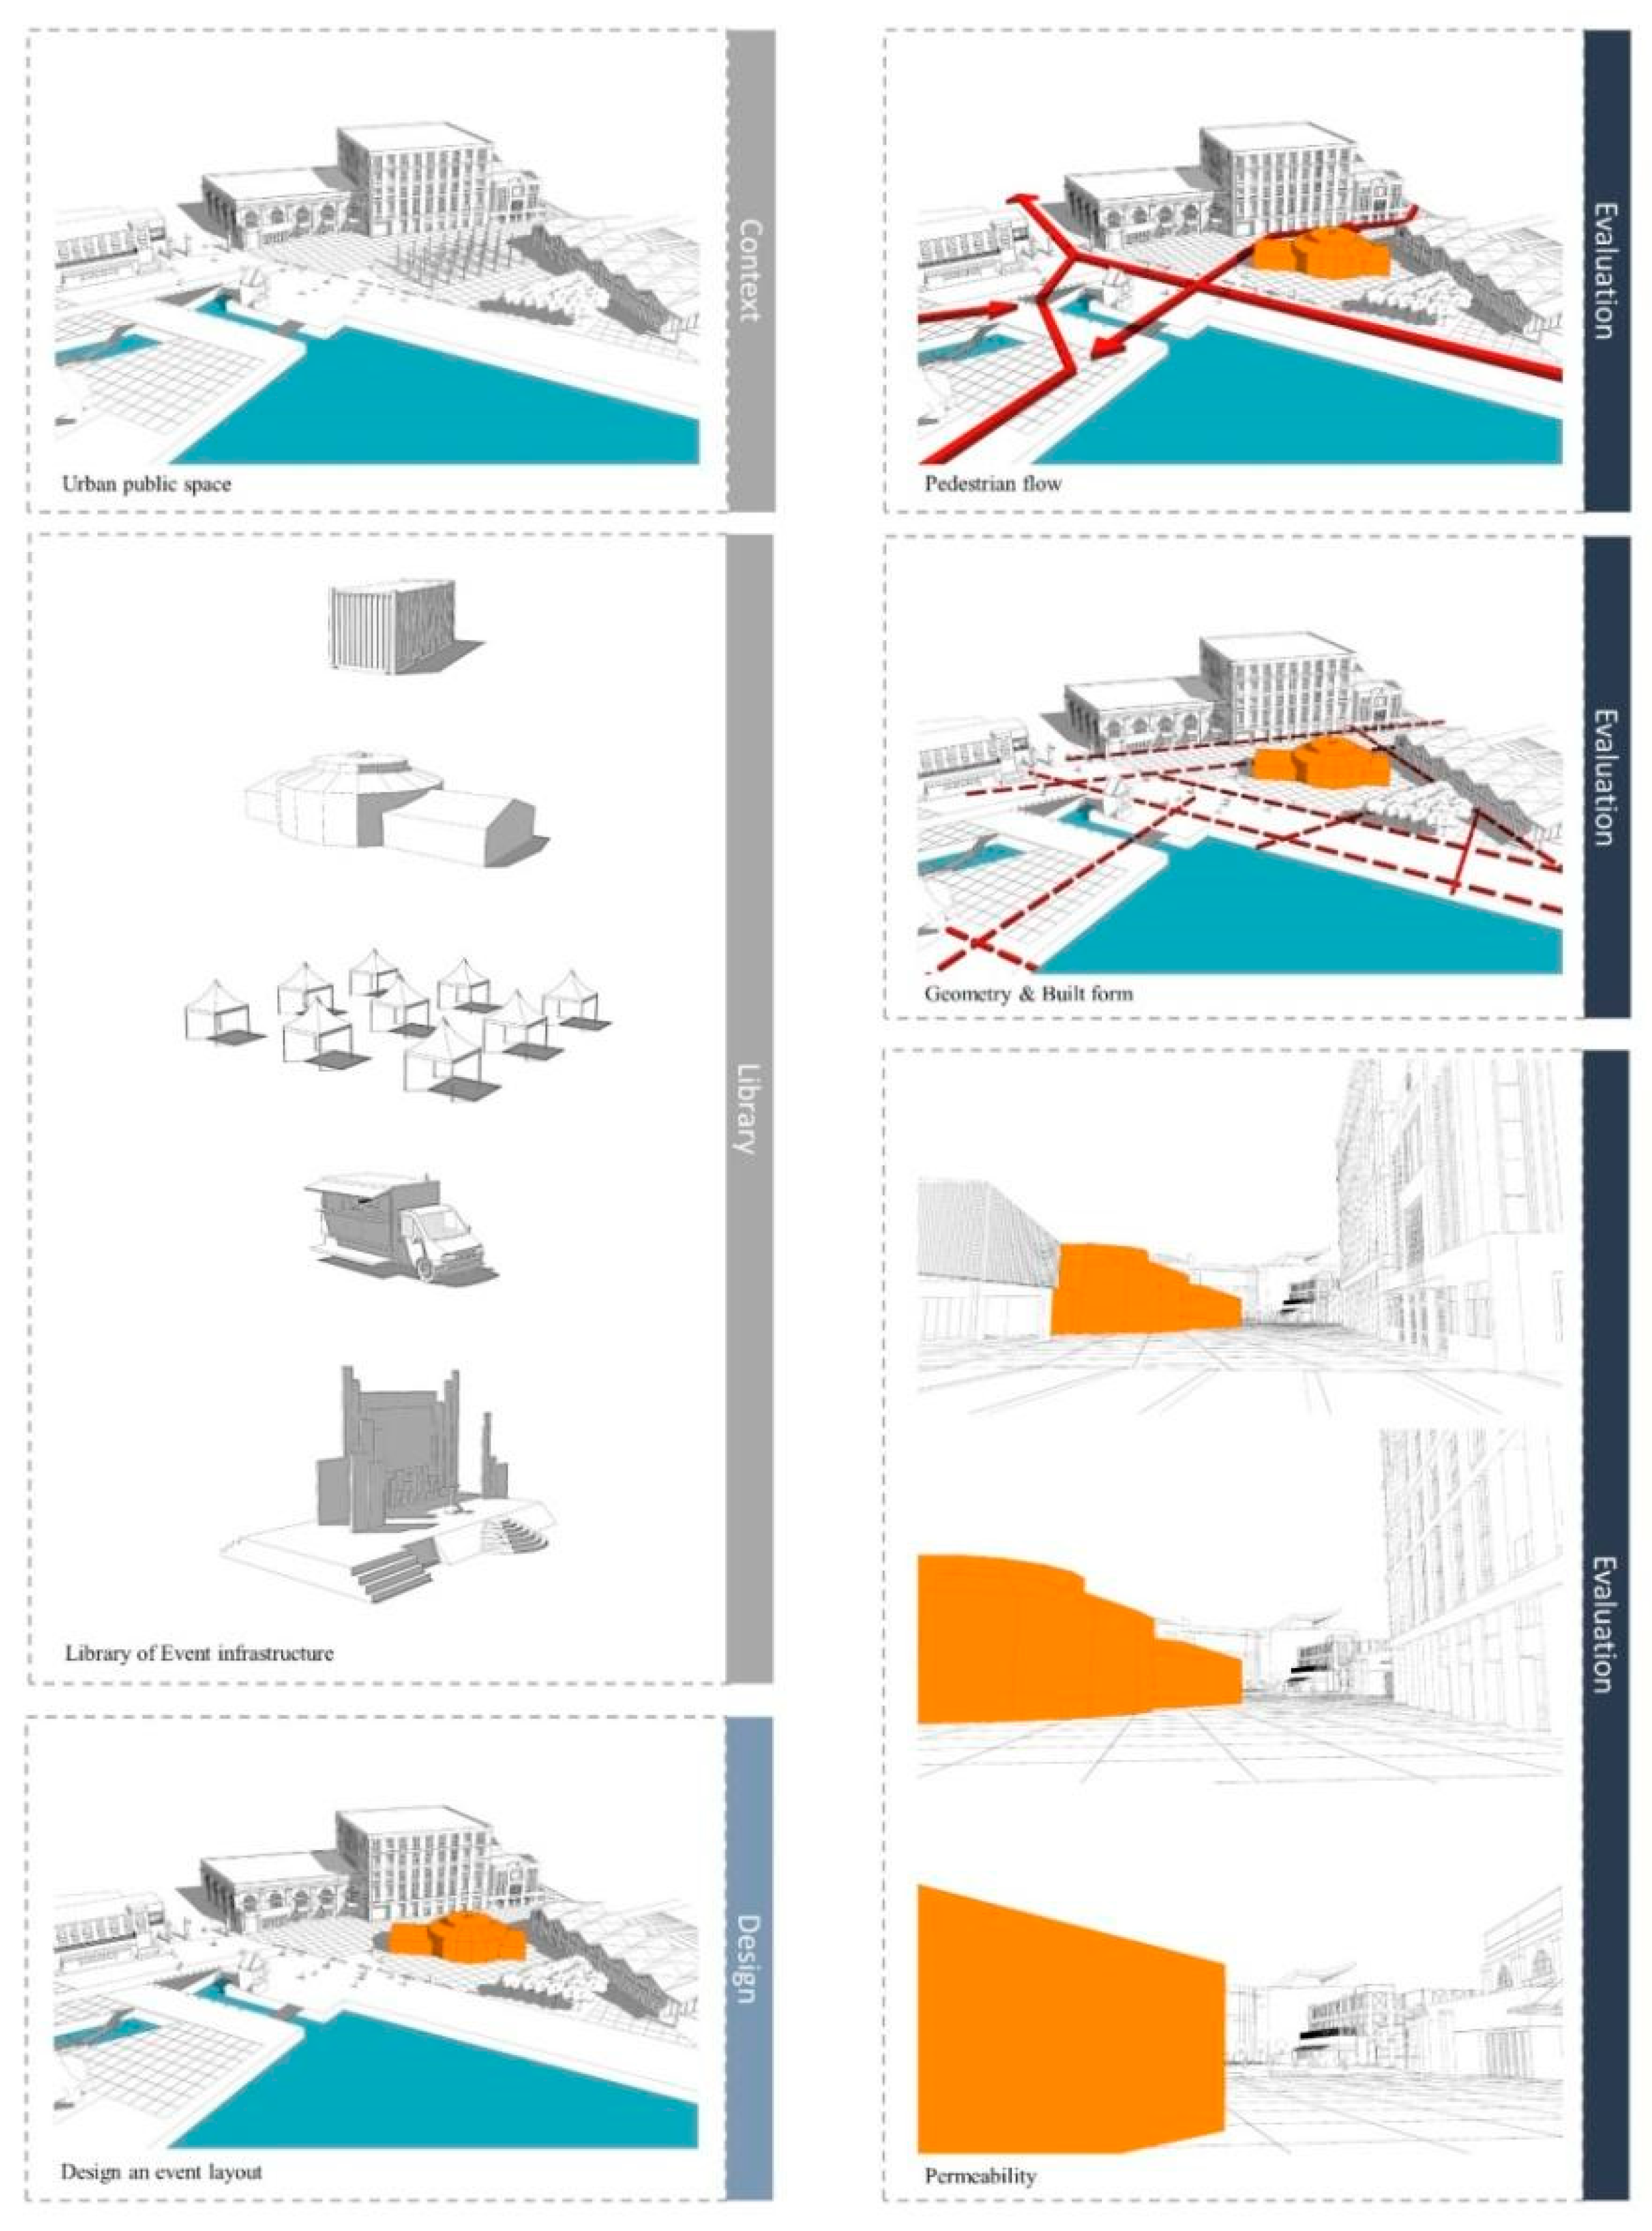
Figure 1 shows the overview of the research tools and approach.
3. Selected Design-Based Criteria
In this stage, poorly considered criteria in the event design process were used to evaluate the layout of the urban space:
These criteria were originally derived from a comprehensive study of event planning guides and event planner interviews by Behmanesh and Brown [
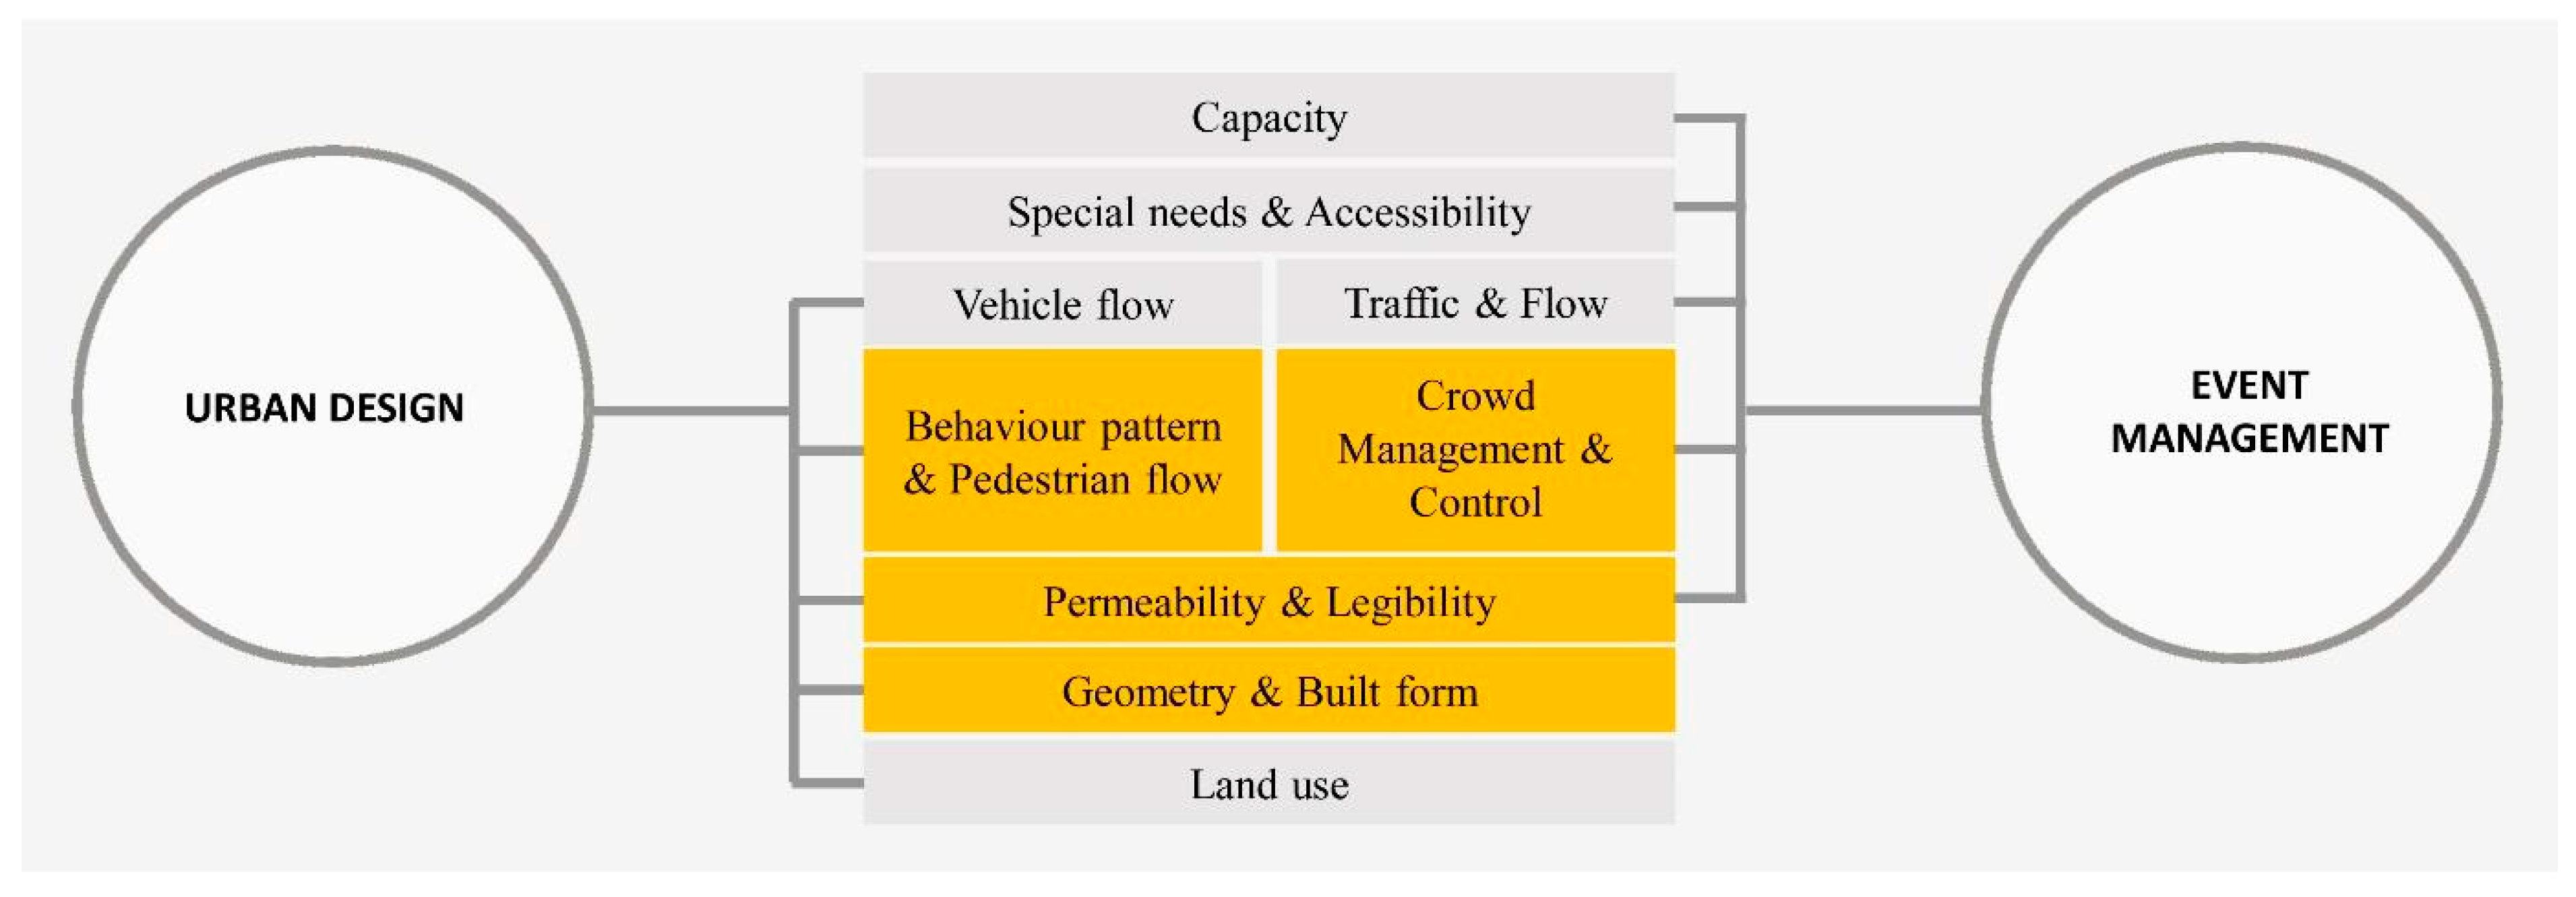
14]. This identified that key urban design dimensions such as pedestrian flow, permeability, and geometry and built form are frequently overlooked in the planning of temporary events. This then demonstrated the potential for simple yet powerful spatial evaluation tools to support better event layout decisions that merge core urban design criteria with event management needs (
Figure 2).
In order for event planners to apply the criteria in
Figure 2, analytical diagrams were conceived as an important enabler. Analytical diagrams are a common communication tool among urban design experts, enabling the visualisation of concepts and the emphasis on specific aspects of urban phenomena. Since various variables influence the use of urban space, analytical diagrams are widely used to study particular aspects in a focused manner and to convey design alternatives in a simplified visual form. These diagrams can be developed in two-dimensional or three-dimensional formats depending on the nature of the criteria being analysed. Before applying the three selected criteria to the case study, their importance and the methods used for analysis are discussed in detail.
3.1. Pedestrian Flow
The tool being developed was aimed at those without design or urban design training. Consequently, to keep the tool comprehensible the criteria were taken from classical studies such as Montgomery [
17] and Punter [
18]. Pedestrian movement is a primary and critical factor in the analysis of urban spaces in these classical studies and later works [
19,
20]. Understanding behaviour patterns can significantly improve pedestrian flow analysis. Due to the characteristics of urban spaces like plazas, higher levels of optional and social activities are expected. However, urban spaces should also accommodate necessary activities. These different types of activities generate various pedestrian flow patterns:
People passing through the urban space (pathway).
People attending an event (destination).
People visiting the space for leisure (destination).
The most effective way to map pedestrian flow is through direct observation on different days of the week and at various times of the day. For example, on working days (especially during rush hours), people are more likely to use the space as a shortcut to their workplace (necessary activities). In contrast, on weekends, the space is used more for optional and social activities, with visitors entering from different access points to spend time in the space.
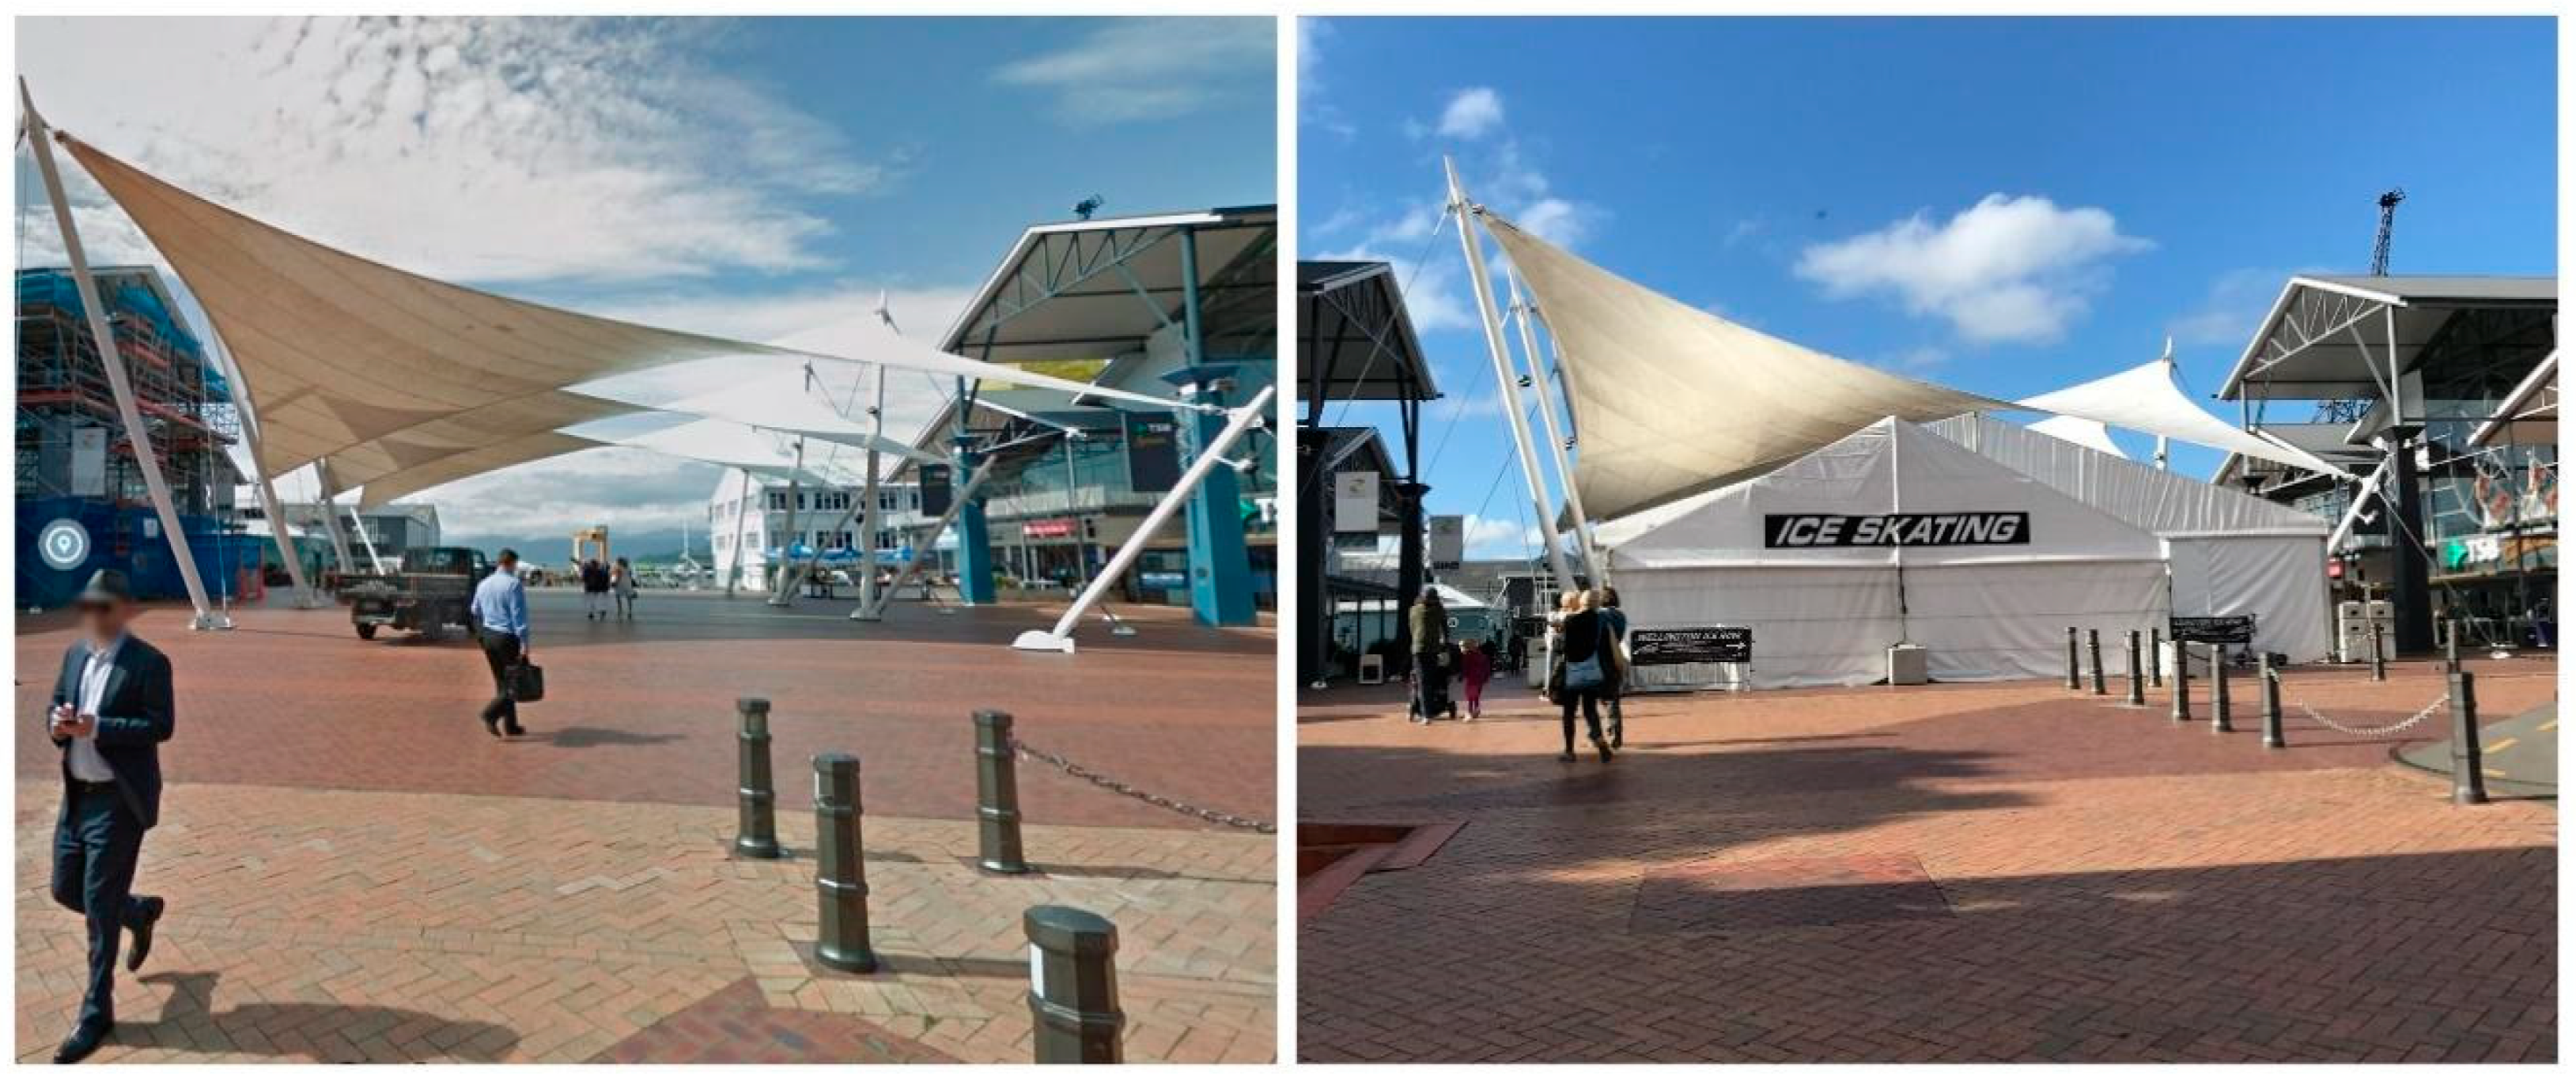
The event layout should not obstruct or reduce the use of urban space as a pedestrian access route. For instance,
Figure 3 shows a temporary ice-skating rink that maintains pedestrian flow without blocking access. If event organisers overlook this function, people may become less inclined to pass through the urban space. Additionally, the internal circulation of people within the event venue should be aligned with the surrounding pedestrian flow structure. Considering both external and internal pedestrian circulation is crucial, as it can enhance the overall accessibility and facilitate the use of the space.
3.2. Geometry and Built Form
Again, classical studies recognise that built form and geometry of urban spaces play a significant role in their design and use [
18,
20,
21,
22]. One of the most noticeable interventions of events in urban spaces is the temporary alteration of their built form. Events introduce new spatial edges, create sub-spaces, and modify the proportion of the space for a limited time, which can significantly affect users’ perception of the space.
The relationship between existing buildings and temporary event infrastructure must be carefully considered during event planning. This can be analysed by studying changes in spatial proportions both in plan and section. Since people primarily experience the built environment through visual perception, it is essential to evaluate the space’s geometry in both two-dimensional plans and three-dimensional views. Moreover, even in non-ticketed events, the density of crowds can alter the spatial proportion, impacting the human scale and legibility of the space.
3.3. Permeability and Legibility
Permeability is also a key aspect of successful urban space, and is closely related to more recent research on urban morphology [
23]. The degree of permeability indicates to what extent people have different choices for movement through the urban structure. Permeability can be categorised as follows:
Legibility is widely recognised as a critical indicator of urban quality. Lynch [
25] defines a legible cityscape as one that presents a coherent pattern with recognisable symbols. An urban space is considered legible when people can easily understand their location within the space and how it is arranged [
26]. Carmona et al. [
24] highlight that legibility has been consistently identified as a key aspect of urban design by prominent authors such as Bentley [
27], Burton et al. [
28], CABE [
29], Jacobs [
30], McGlynn and Murrain [
31], and Montgomery [
17].
It is important to distinguish legibility from simplicity. While legible spaces are easy to navigate, they can still contain degrees of complexity and mystery [
32]. Koseoglu and Onder [
33] suggest that legibility can be assessed based on:
Mahdzar and Safari [
34] studied the correlation between geometry and legibility. Their research using Space Syntax demonstrated that basic geometric forms such as circles, triangles, rectangles, and squares can improve integration, accessibility, and legibility in urban spaces.
The concept of serial vision, introduced by Cullen [
35], provides a method to evaluate the legibility of urban spaces in three dimensions. Cullen [
35] proposed mapping sequences of visual experiences from the observer’s point of view. Oliveira [
36] summarises this idea:
Cullen argues that if we would design our towns from the point of view of the moving person, the whole city would become a plastic experience, a journey through pressures and vacuums, a sequence of exposures and enclosures. This method offers a powerful tool for analysing the spatial-visual features of urban environments [
37].
4. Selection of the Case Study
To study the selected criteria, a case study approach was chosen. The right case study must exemplify the criteria and offer enough complexity for generalisation. The case study should meet the following requirements:
An urban public space primarily used for events.
Accessible for data collection.
Complex pedestrian flow and geometry.
Critical view shafts in the urban fabric.
City council websites and online ticket platforms were used to identify urban public spaces in Wellington and Auckland used for events. The following options (
Figure 4) were considered:
Aotea Square (AS), Auckland.
Civic Square (CS), Wellington.
Odlins Plaza (OP), Wellington.
Waitangi Park (WP), Wellington.
Aotea Square, located in Auckland’s CBD along Queen Street, is bordered by the Auckland Town Hall, Auckland Civic Theatre, and The Edge performance arts and convention centre. Primarily used as an event venue, the square is well-integrated with surrounding buildings, though it lacks direct connectivity to Queen Street.
Civic Square in Wellington is a public event venue, surrounded by the Wellington Public Library, City Gallery Wellington, and a cascade. The cascade links the square to a pedestrian bridge connecting the CBD to the waterfront. The square is often paved with green turf and experiences significant pedestrian flow. However, due to ongoing earthquake strengthening work on the library, its use for events has decreased.
Odlin’s Plaza, part of the Wellington waterfront, serves as an event venue. It has a strong connection to the waterfront, with pedestrian traffic along its top-right edge. The bottom-left is defined by a bar and café, while the top-left features a function centre and a small green space. A steam crane, Hikitia, adds character to the plaza.
Waitangi Park, located near Wellington’s waterfront, features a skate park, play area, and a large lawn used for events. Despite its proximity to the waterfront, it is separated by a six-story residential building and a parking area. The park has no active edges and is surrounded by streets and parking lots.
Table 1 shows how each potential case study (Aotea Square (AS), Civic Square (CS), Odlins Plaza (OP), Waitangi Park (WP)) meets the criteria for selecting an appropriate case study for this research. After comparing the options, Odlins Plaza in Wellington was selected for the study as it tested key criteria particularly well. Although Civic Square was also a potential candidate, the closure of the adjacent library for structural strengthening made it inaccessible for research purposes.
5. Stage 1-Odlins Plaza (Case Study)
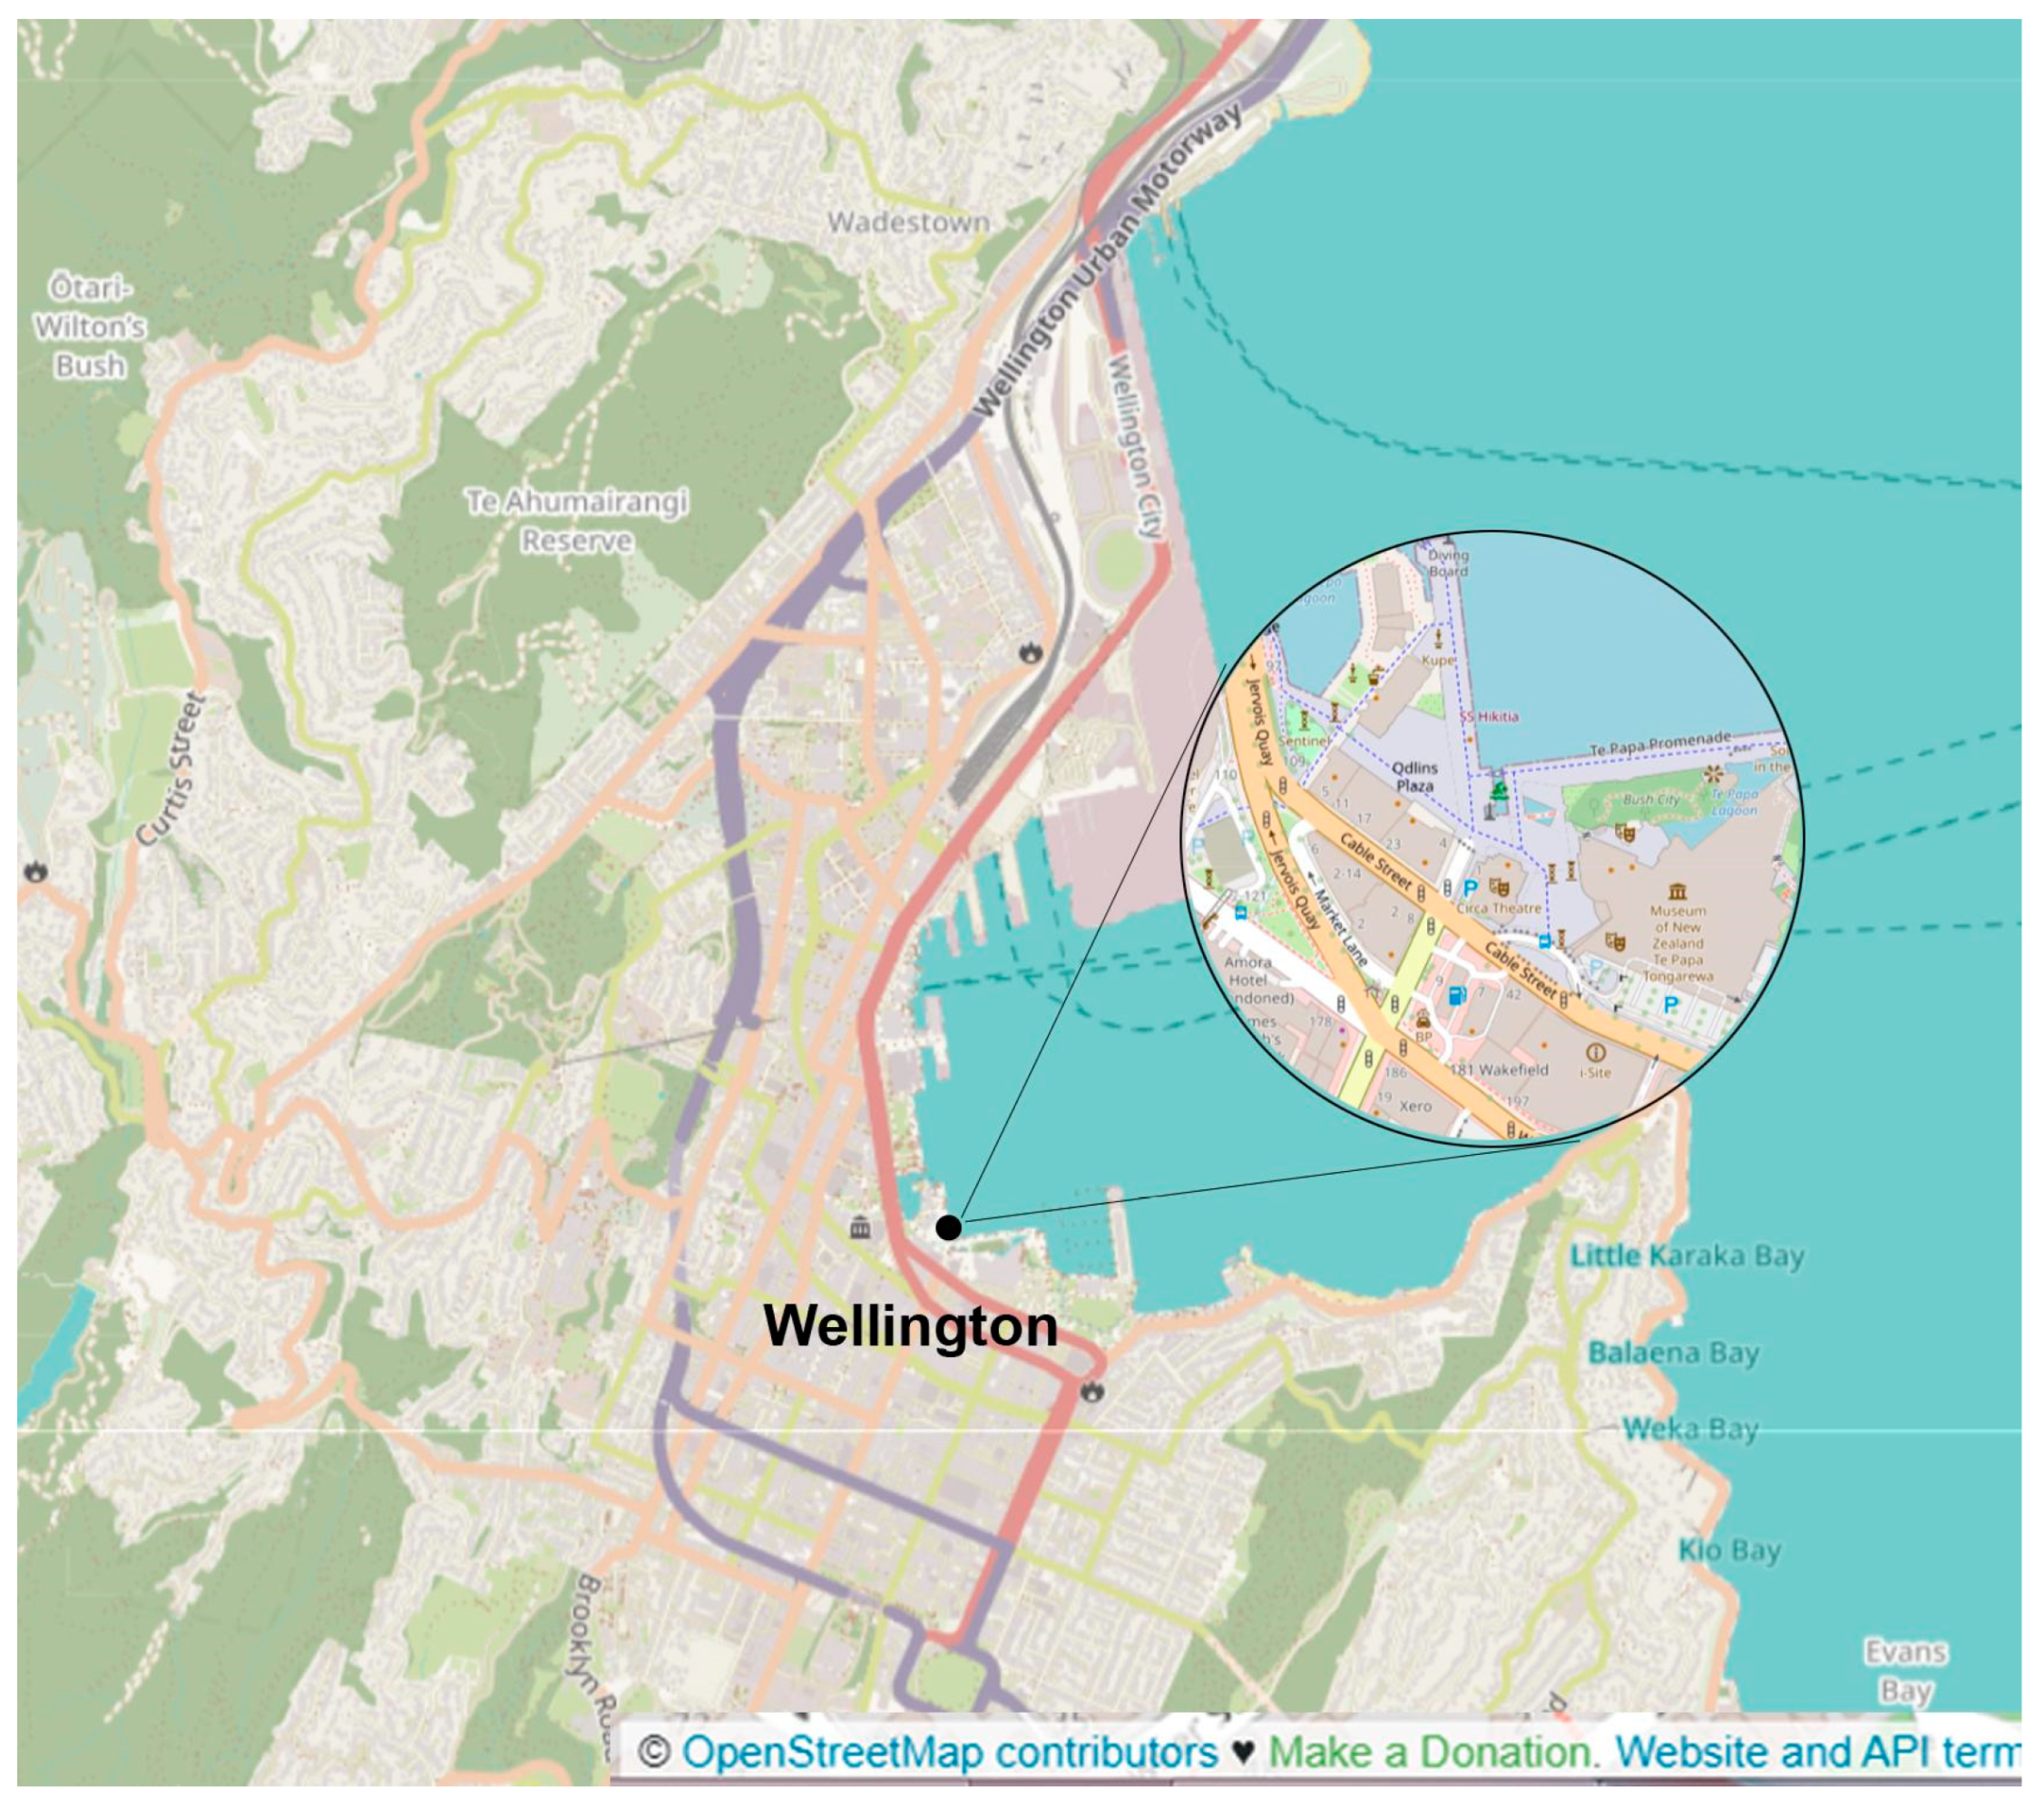
Odlins Plaza is an urban public space located in the central part of Wellington (
Figure 5), within the Wellington Waterfront district. Recognised by Wellington City Council as an event venue, it features the Wellington Functions building (a two-story multi-functional space) to the west, a small triangular green space to the north, and Mac’s Brewbar pub (a two-story building) and Odlin’s building (a four-story office building) to the south. The plaza opens to the waterfront on the east, adjacent to the waterfront walkway.
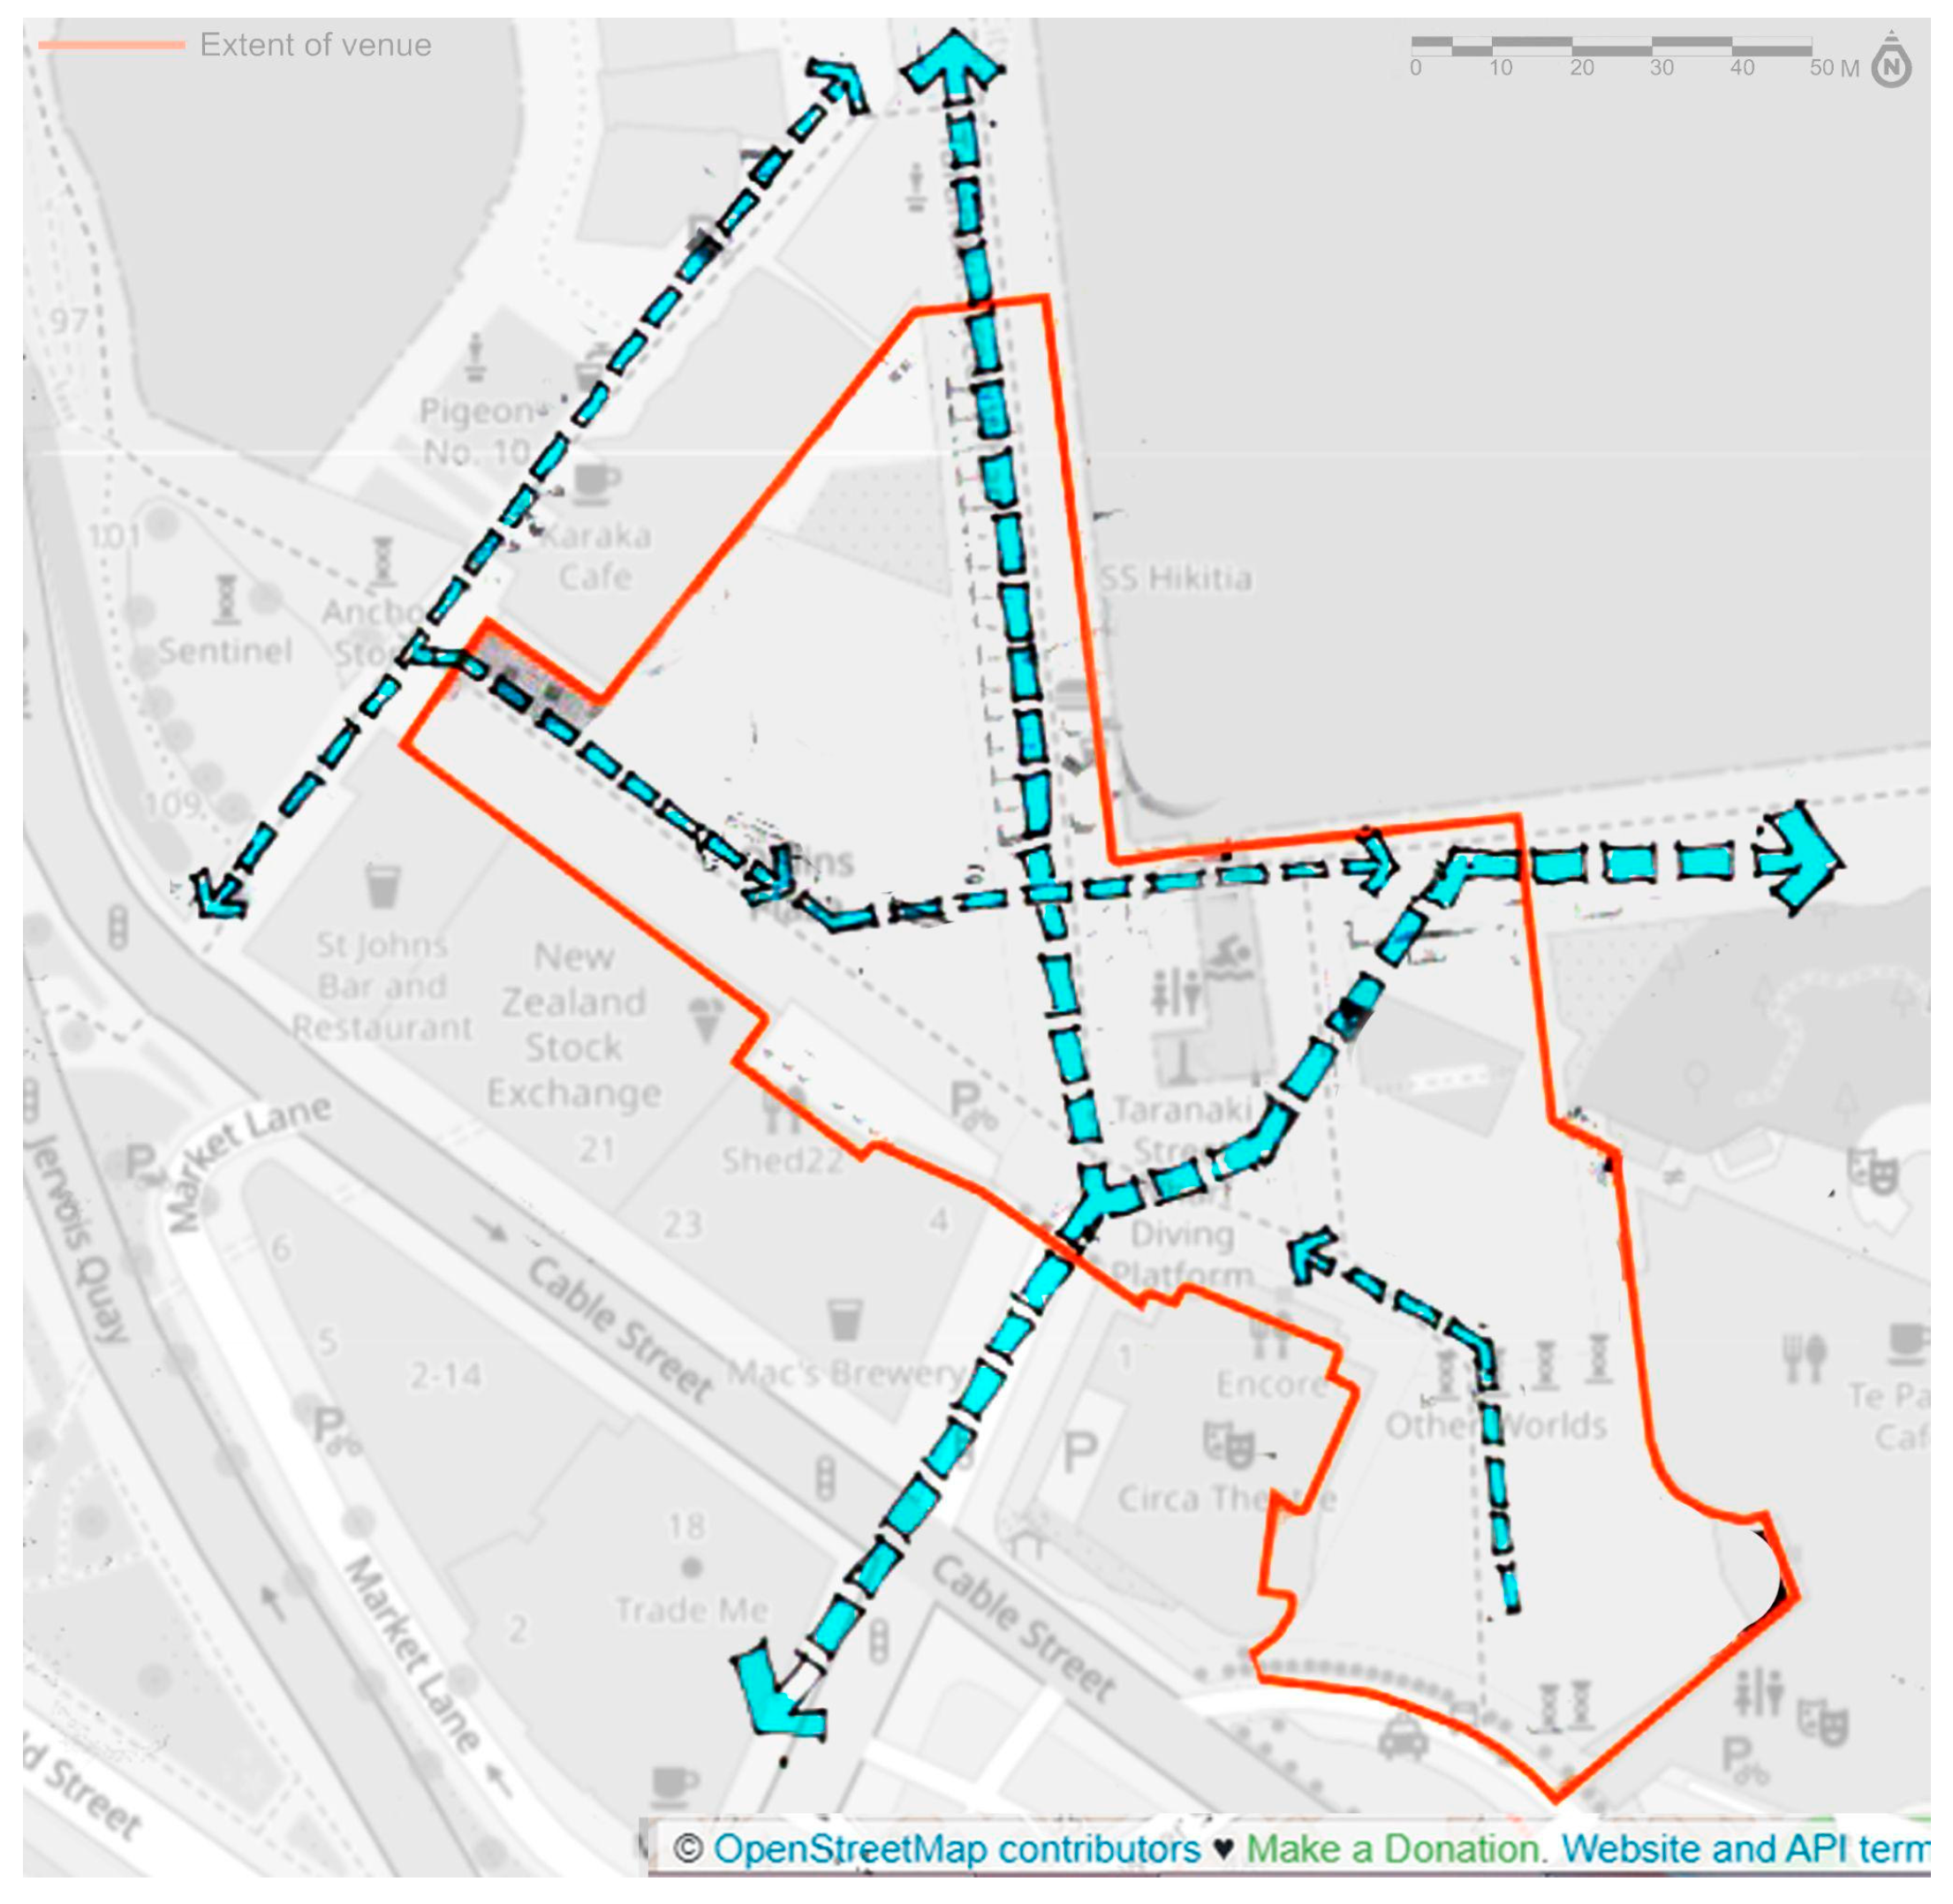
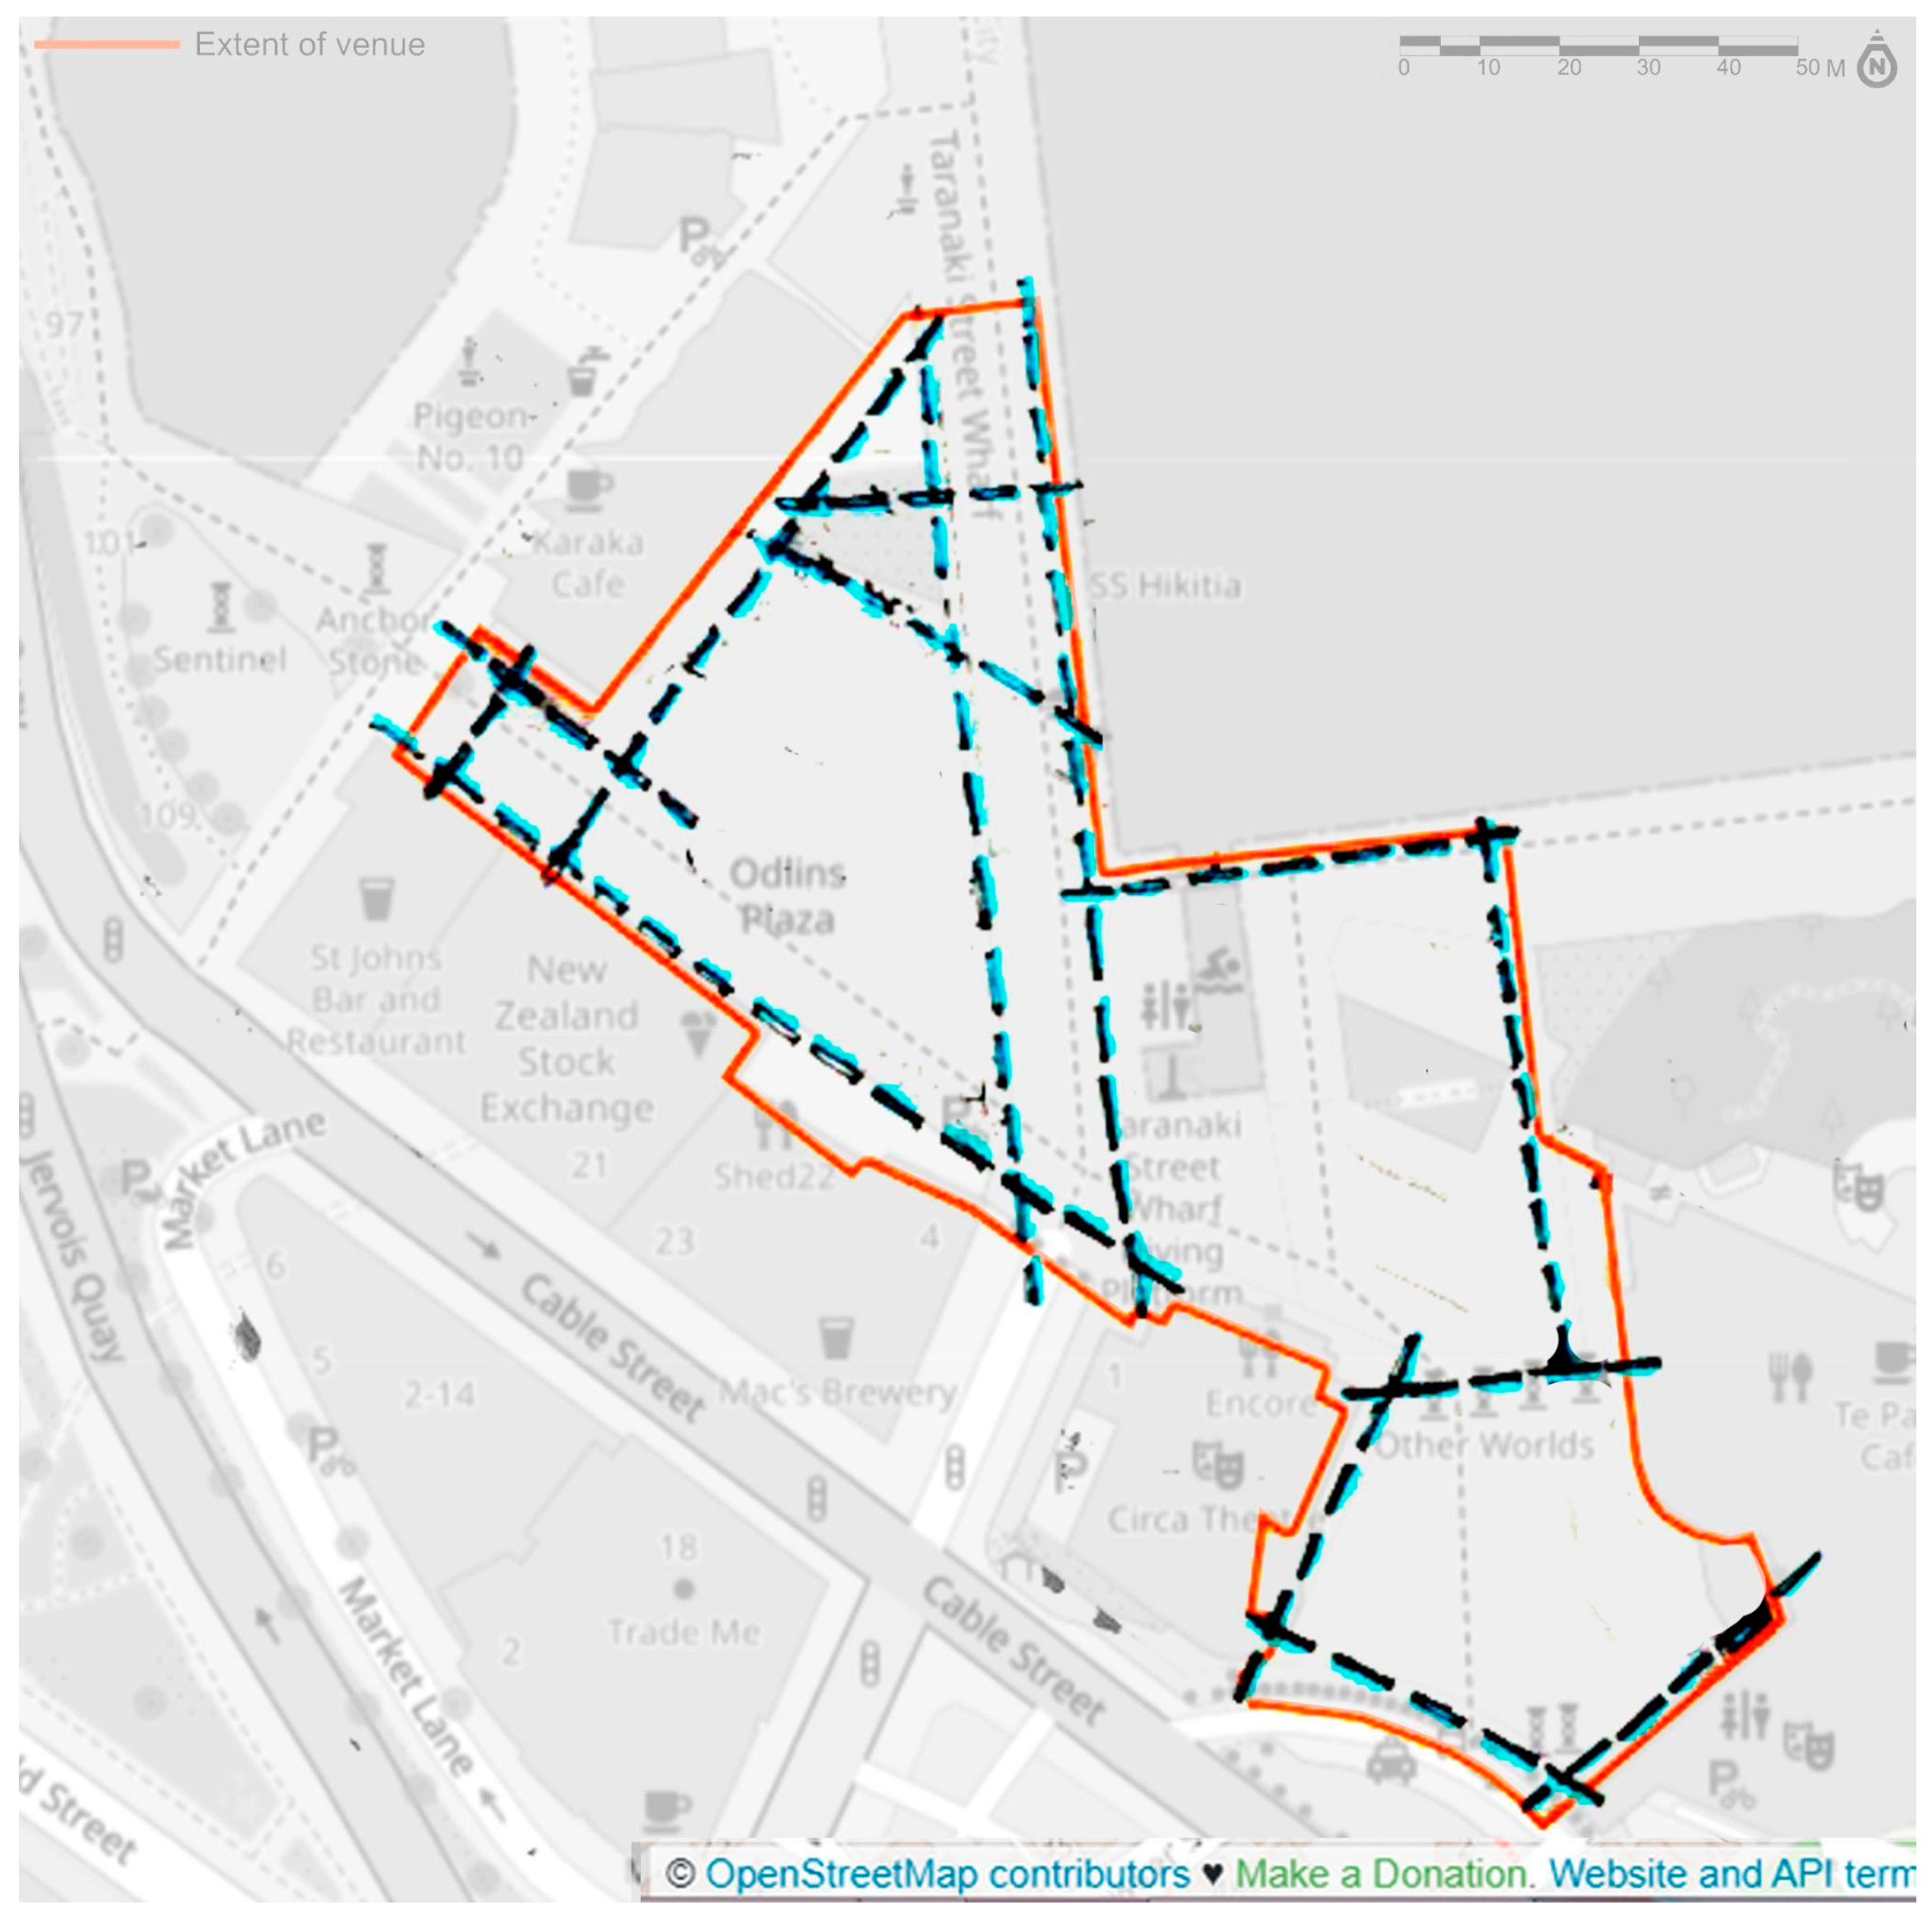
Figure 6 outlines the case study area, which also includes the open space in front of Te Papa Museum, as it is occasionally used for events.
The development of Wellington’s central waterfront district began in September 2000 with the Waterfront Leadership Group’s planning efforts. The framework aimed to transform a working port into a vibrant social space, considering themes like open space, diversity, promenade, waterfront connection, and cultural integration. The area in front of Odlin’s building was considered for redevelopment as part of this framework.
Case study research can be explanatory, offering insights into a phenomenon within a specific context. Groat and Wang [
38] reference Jane Jacobs’
The Death and Life of American Cities as an example of exploratory and explanatory case study research. For this study, an explanatory approach is applied to evaluate the selected criteria within this context. Yin [
39] stresses the importance of clear data collection and analysis when designing a case study.
This section applies the selected design-based criteria to the case study, focusing on:
Pedestrian flow and geometry were mapped using analytical diagrams (
Figure 7 and
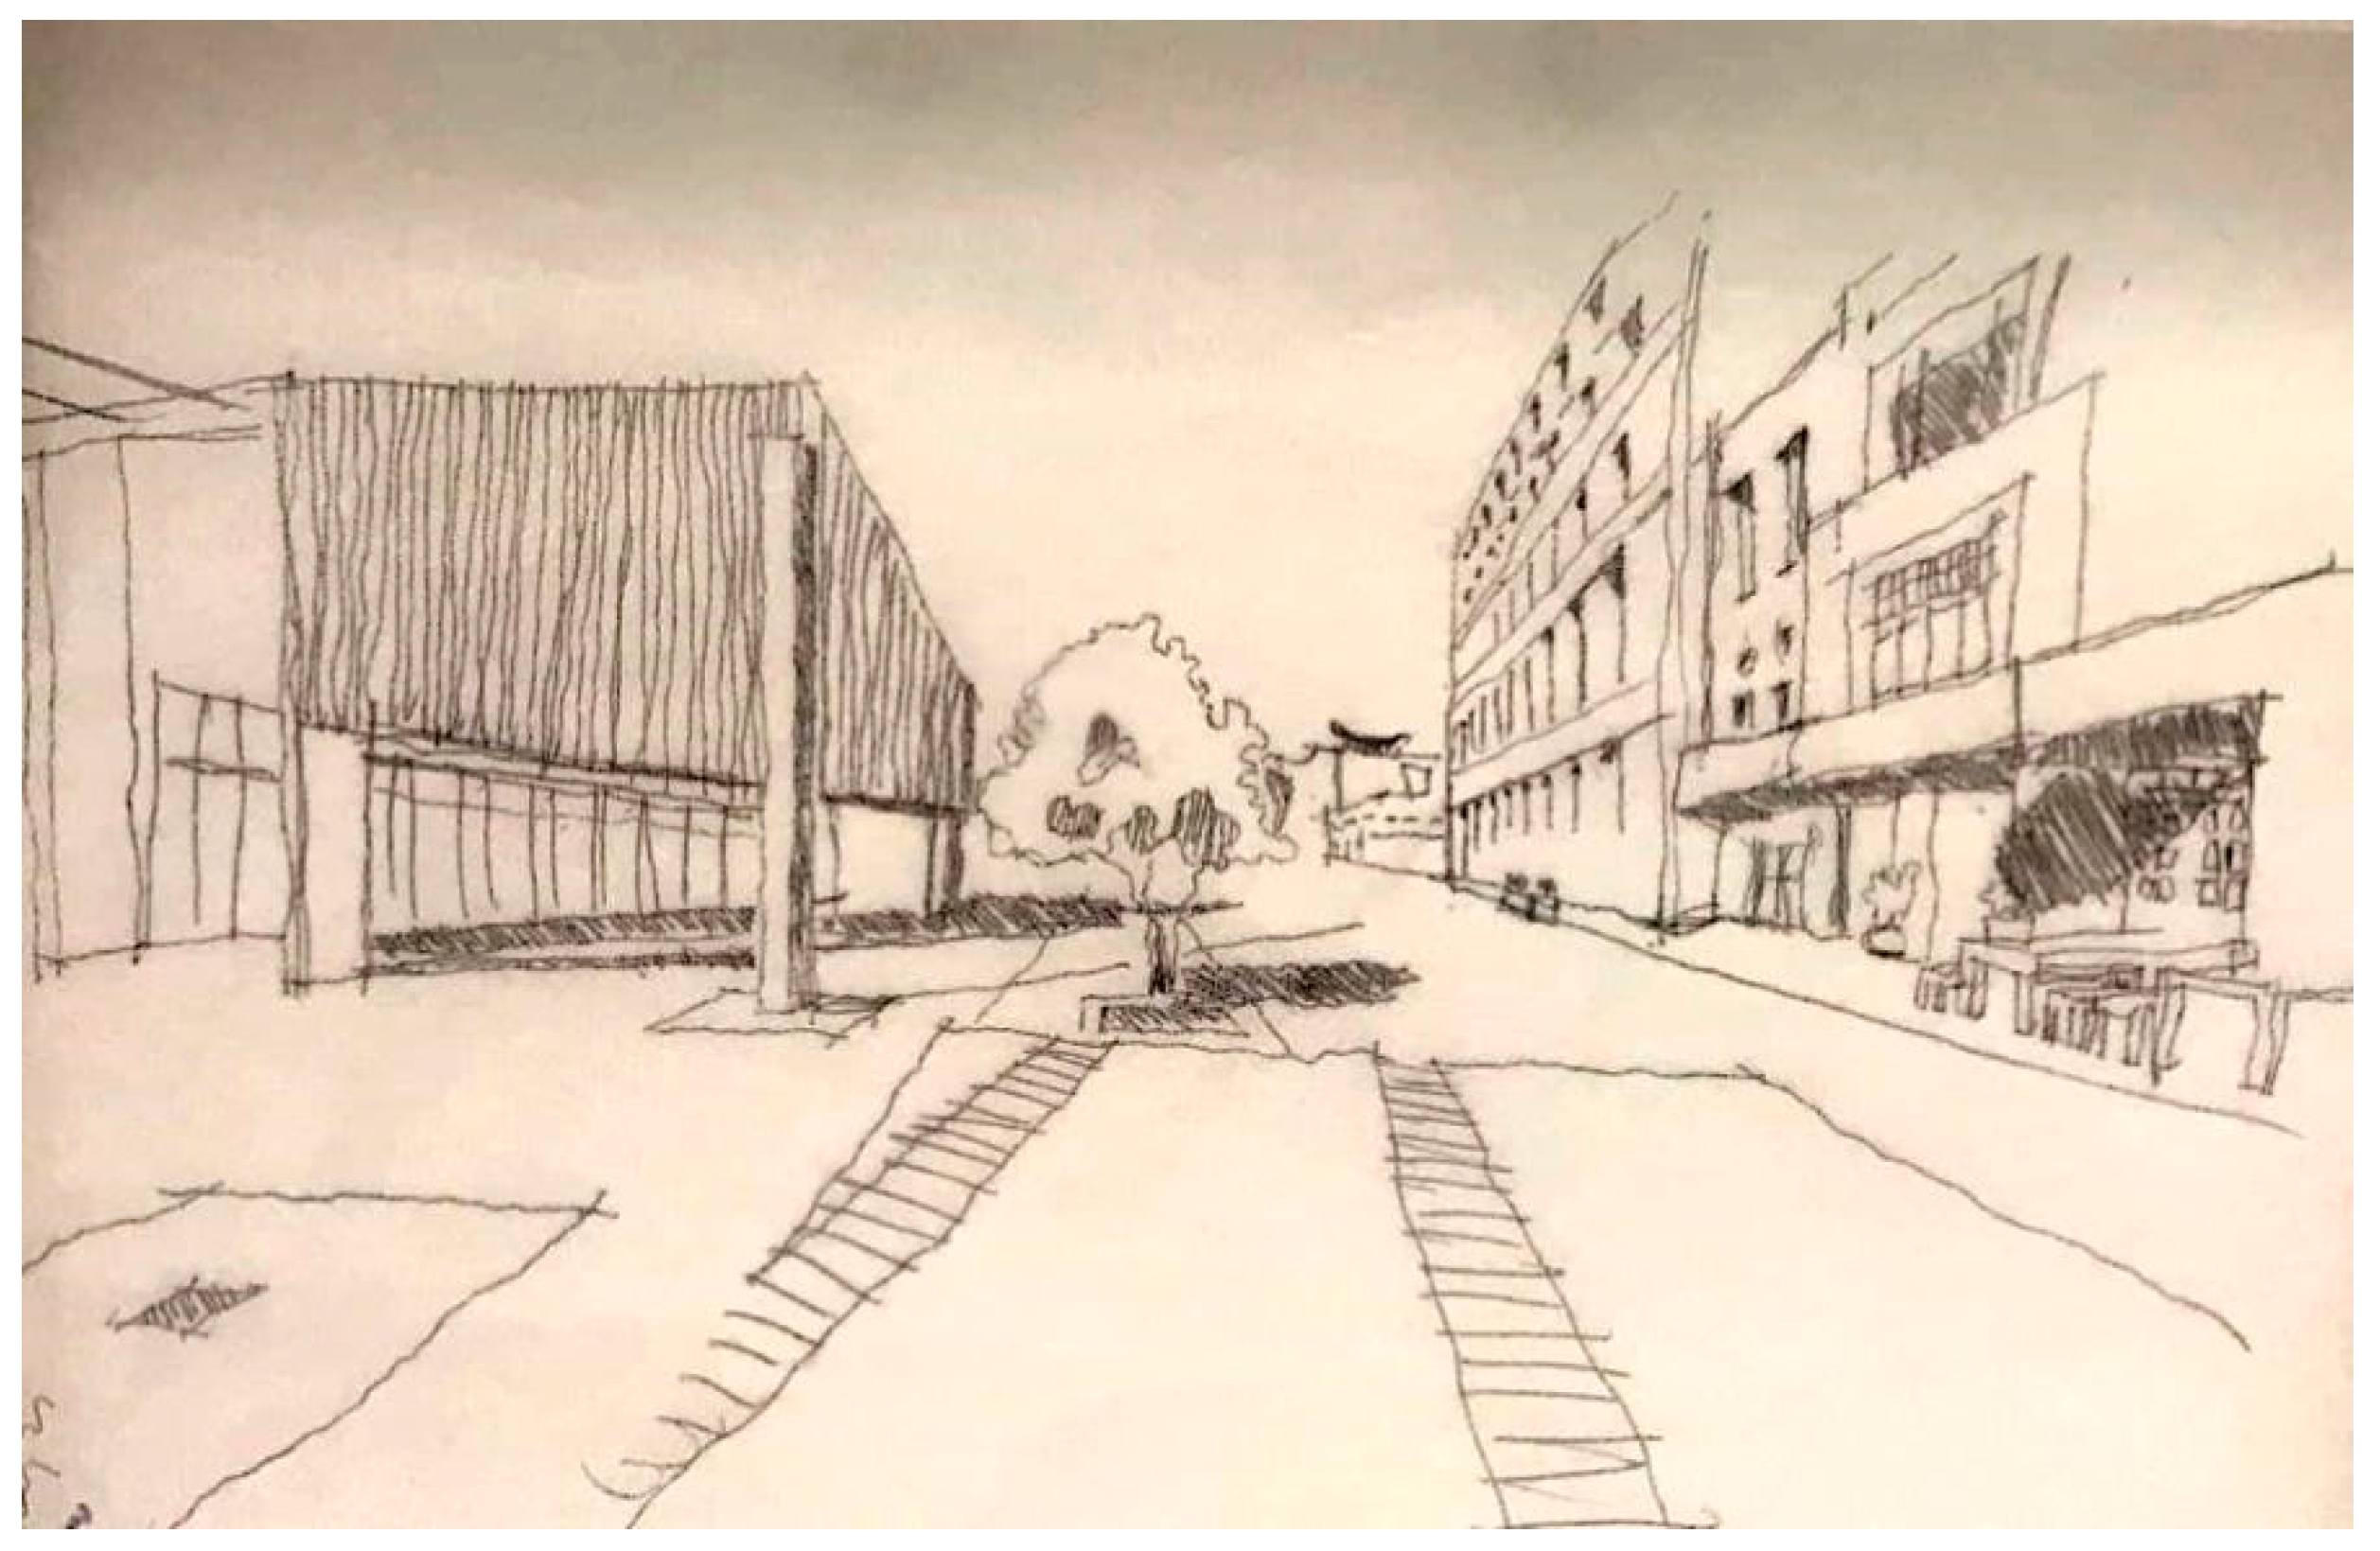
Figure 8), while permeability was assessed by sketching the visual experience of the space in three main sequences (
Figure 9). The next step involved evaluating previously staged event layouts against the mapped criteria. The event layout was then modified, or a new layout proposed, based on the design-based criteria. The process included the following steps:
Map the selected criteria in the urban public space.
Evaluate the event layout against the mapped criteria.
Modify or design a new event layout based on the criteria.
This approach examines the impact of planned events on urban public space from an urban design perspective. While three criteria are discussed here, other factors should also be explored. It is also essential to know that there is a need to undertake a specific method and technique to evaluate each criterion.
5.1. Pedestrian Flow
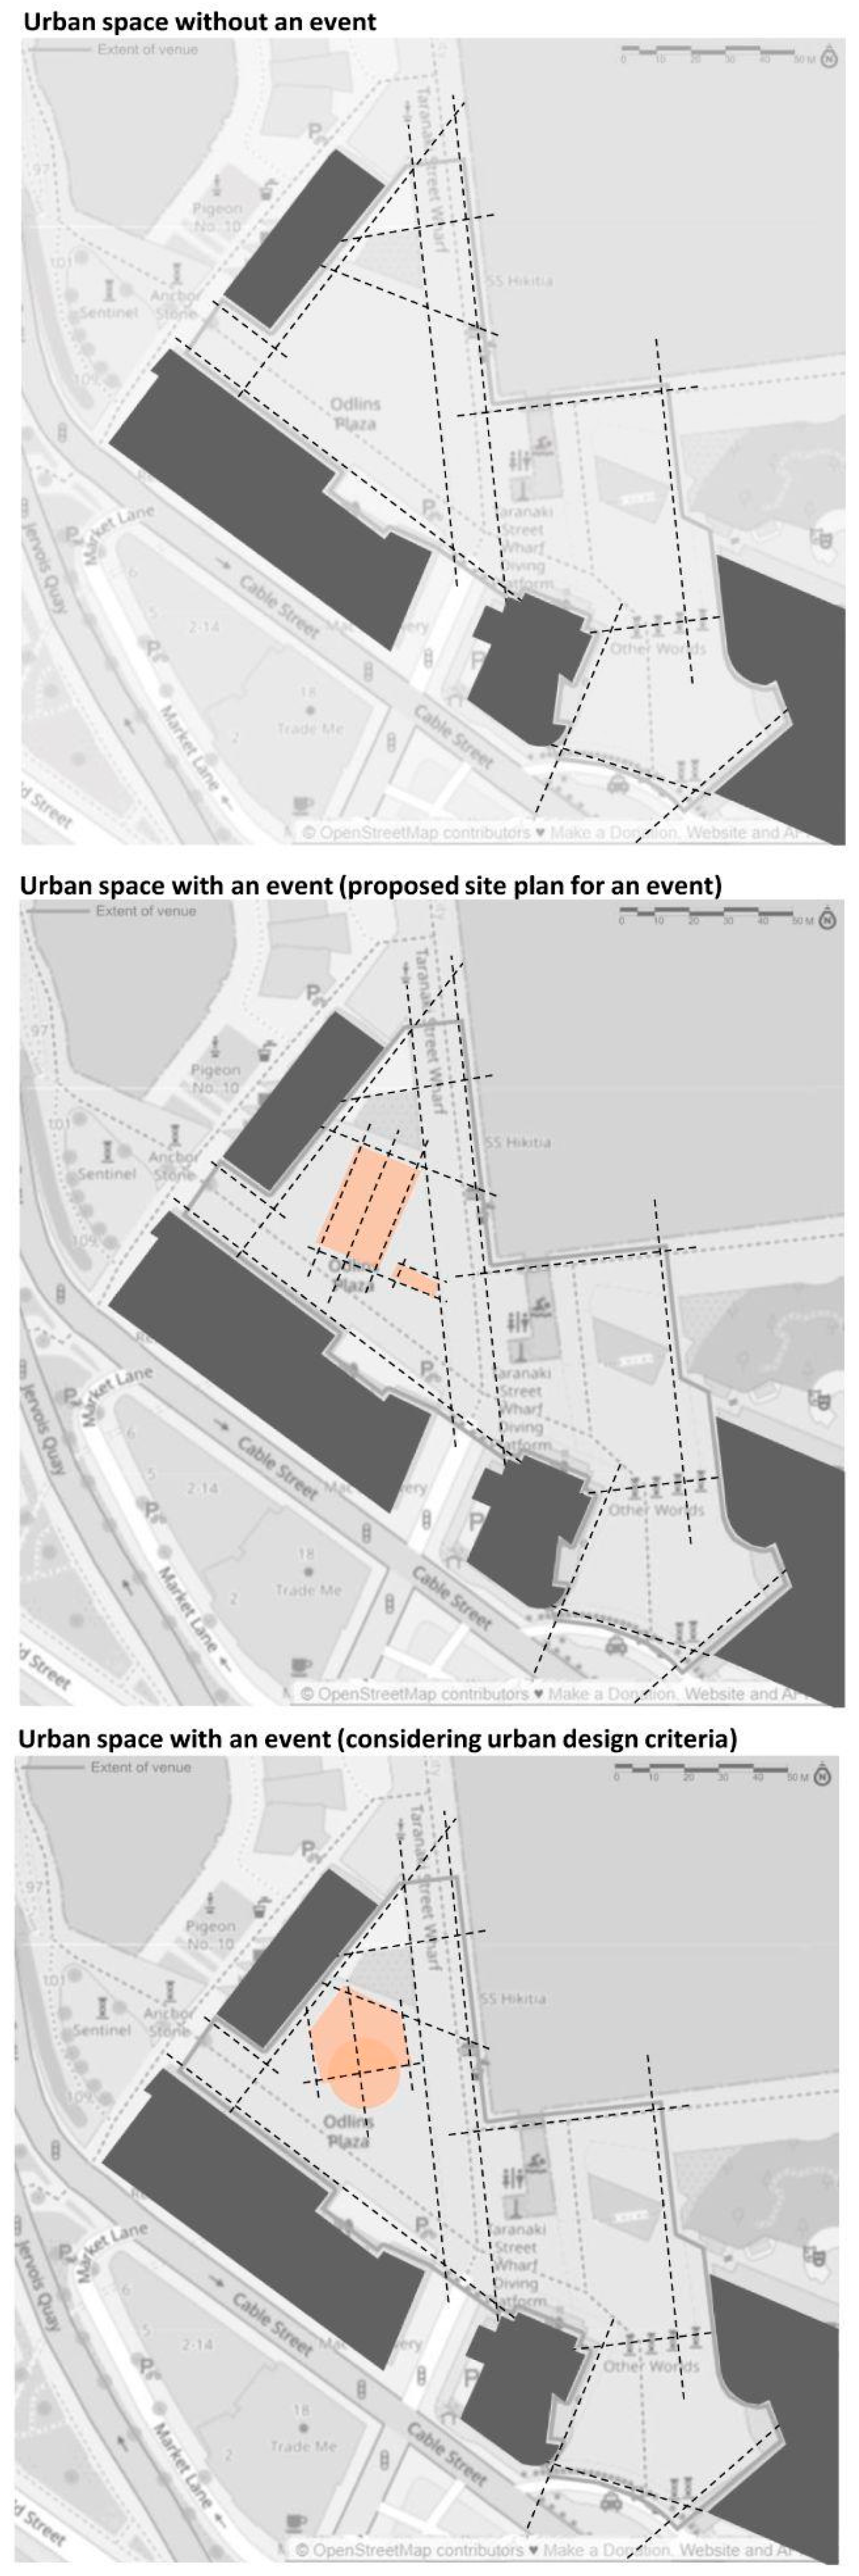
Odlins Plaza has two primary pedestrian flows on its southern side: one connecting Civic Square and Cuba Street to Te Papa Museum, and the other leading toward Waitangi Park. Maintaining these connections without obstruction is critical for ensuring continuous movement through the plaza.
As can be seen in (
Figure 10, The second diagram), temporary event structures currently block access to the eastern route, disrupting this movement. To resolve this, the event layout needs adjustment to restore these key connections.
The final diagram demonstrates a modification where the small rectangular tent is rotated. This rotation creates a wider, unobstructed corridor along the main pedestrian paths, reducing bottlenecks and improving circulation between Te Papa, Waitangi Park, and Civic Square.
5.2. Geometry and Built Form
Odlins Plaza is a part of a triangular open space with a small green space (a grove of karaka trees) at its northern extremity. The geometry of this urban space indicates a gathering, multi-functional space. The space without an event is a unified urban space while having an event on that it divides into sub-spaces. Sub-spaces should not be residual; rather, they should support the main space. As it can be seen in
Figure 11, the second diagram, the previously staged event infrastructures were not perfectly sat in the space.
The orientation of the buildings surrounding Odlins Plaza can inform the directional layout of event infrastructure. The height of temporary structures, such as tents, should be designed with consideration for human scale. Additionally, negative spaces must be clearly defined, whether they serve as circulation paths or areas for gathering and rest.
Figure 11. The third diagram presents a proposed event layout that aligns well with the selected geometry criteria.
5.3. Permeability and Legibility
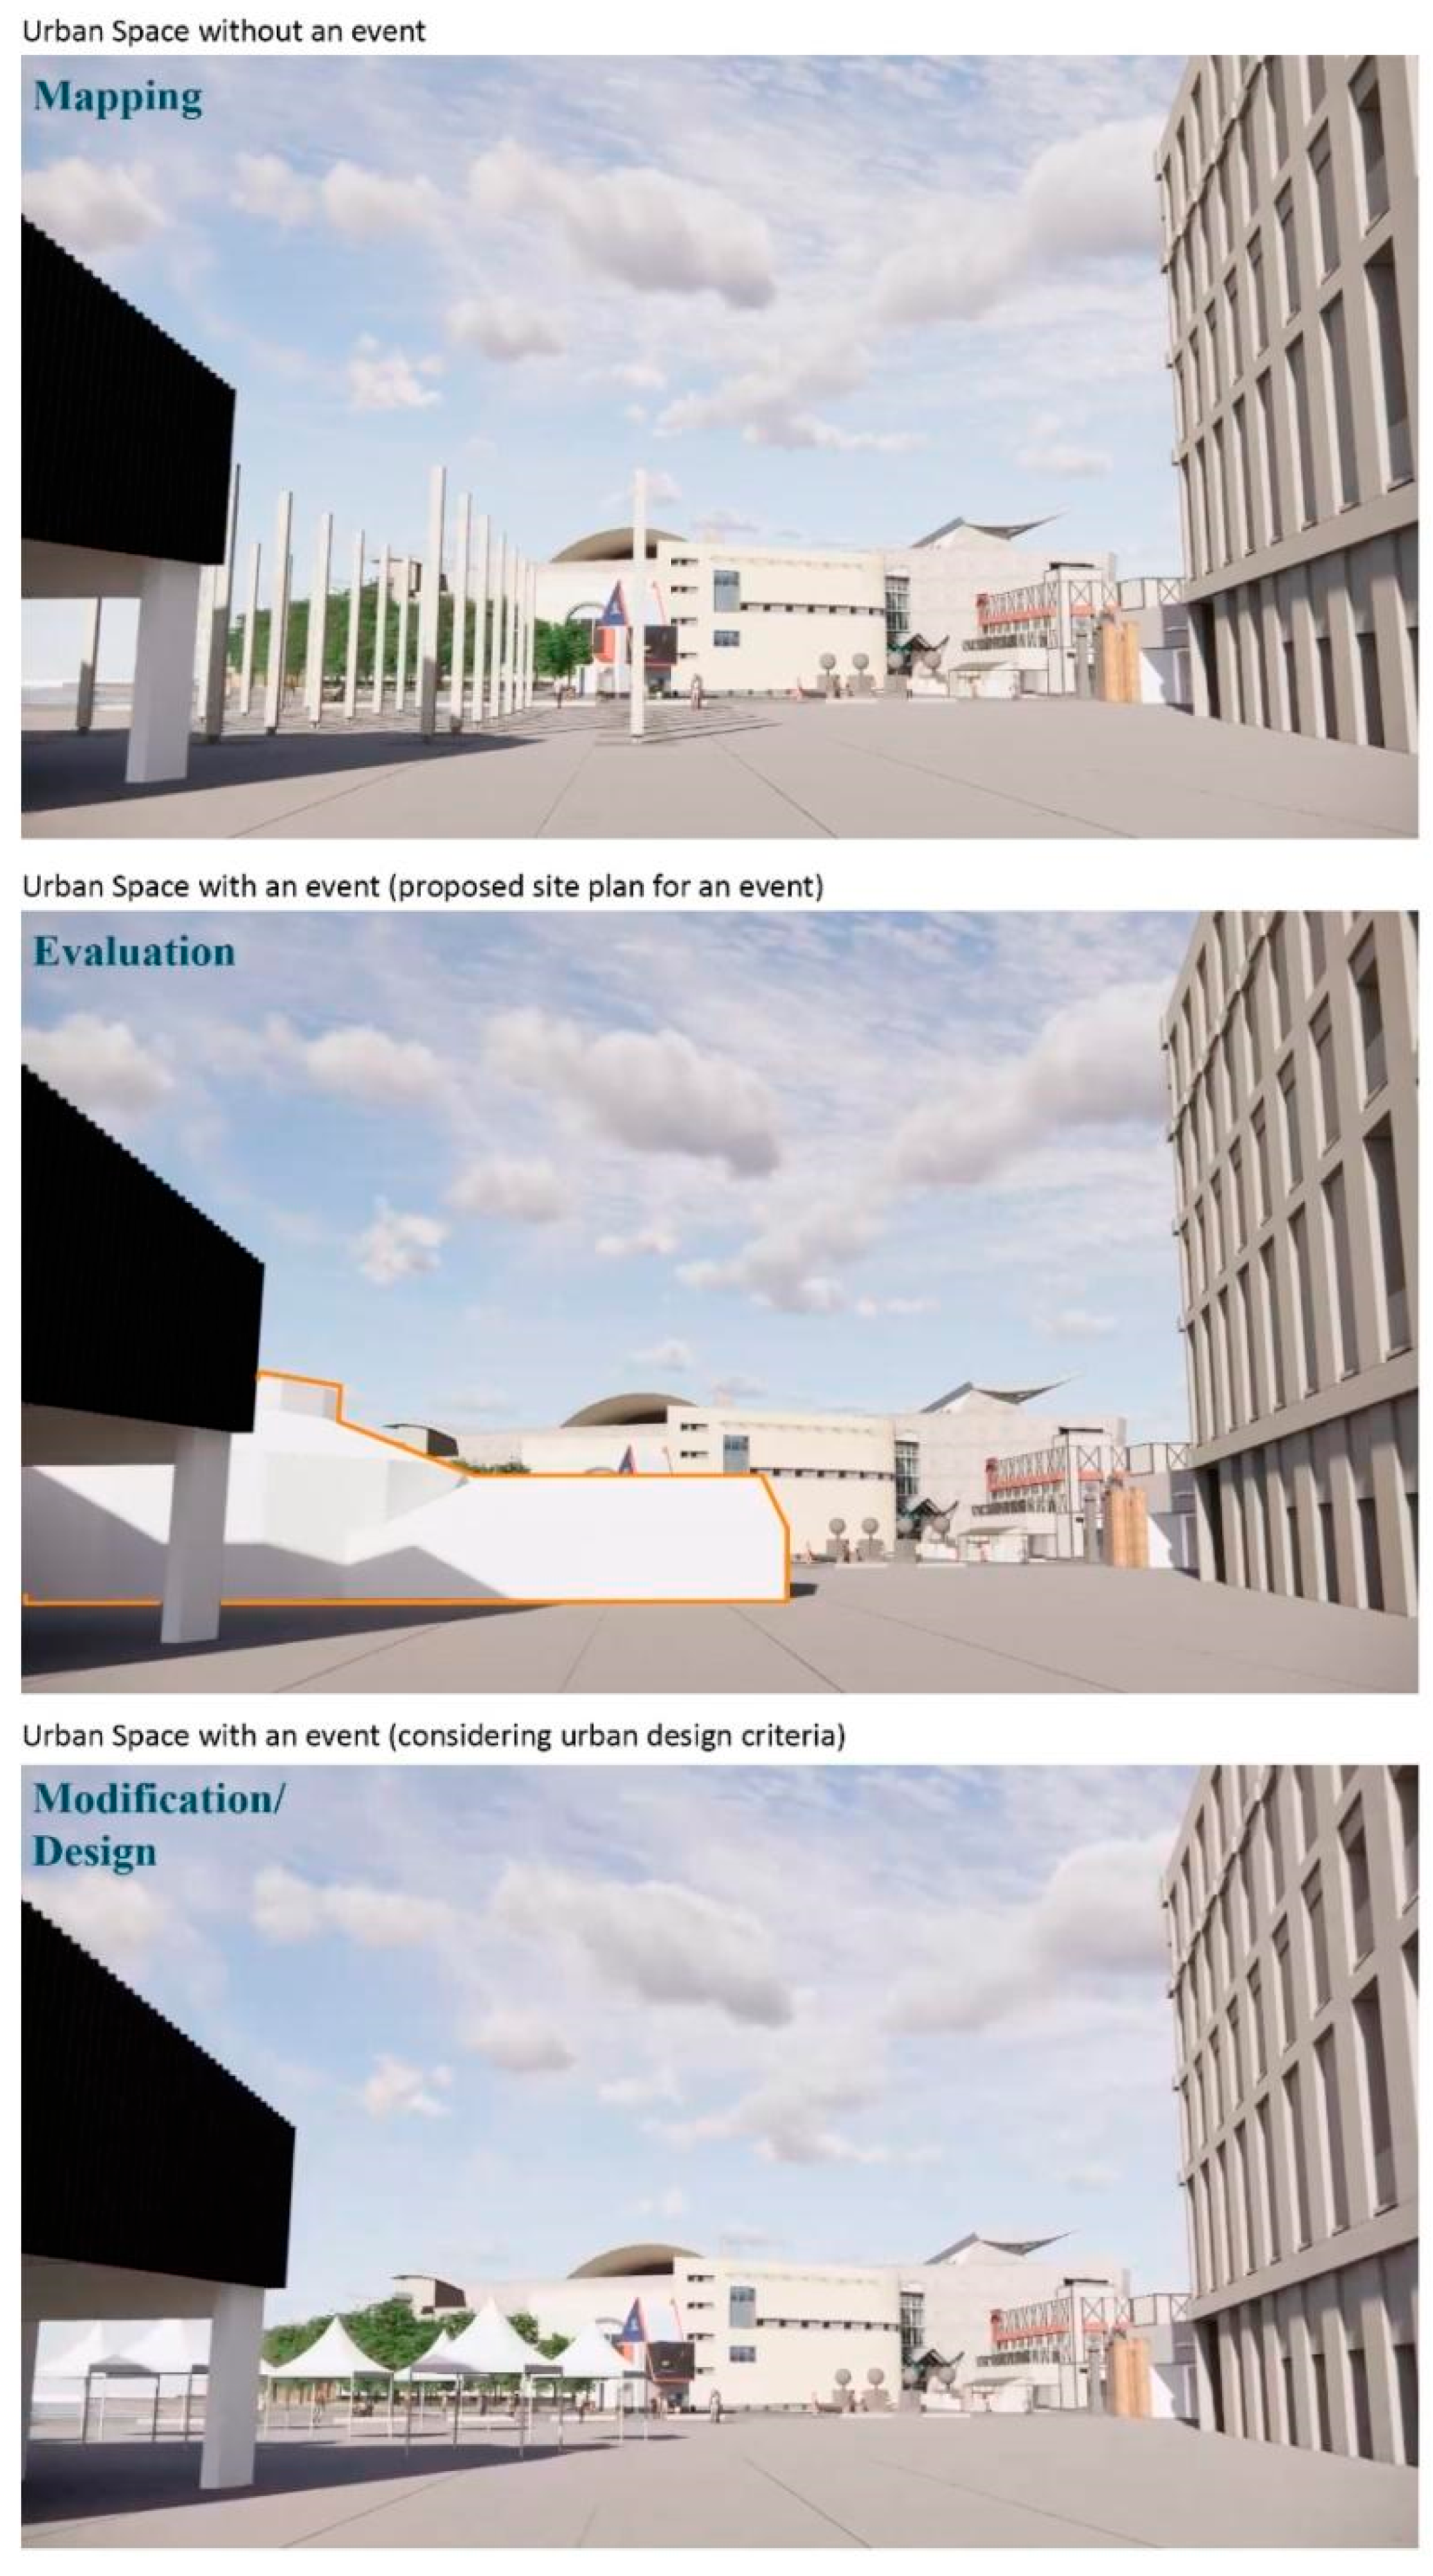
To evaluate visual permeability, it is necessary to examine the event layout in a three-dimensional view. At Odlins Plaza, visual permeability is particularly important in relation to key view shafts. Maintaining visibility toward critical landmarks, such as the sea view and the Te Papa Museum, is essential to preserving the spatial quality within the plaza (
Figure 12).
6. Stage 2-Representation Methods
Planned events temporarily transform urban spaces, altering the built environment to host festivals or gatherings. Like landscape architects and urban designers, event designers need to present and evaluate their ideas to councils, stakeholders, and funders. Traditionally, sketches and physical models were used to visualise designs. Today, computer-aided architectural design (CAAD) tools not only enhance visualisation but also support performance evaluation. This section explores how CAAD and digital representational tools can facilitate the planned event design process.
While Stage 1 involved applying selected criteria to the case study, this stage examines and compares common representation methods to identify the most suitable one for the event design process. The ultimate goal of this research is to examine how digital tools can improve the event design process. Specifically, it explores how these tools can visually translate design criteria for non-experts (event designers) to use in the process of designing and planning events. Testing and comparing various representation methods helps identify the most effective solution to improve the event design process. The following representation methods are examined:
Analogue Representation.
User-Modified Virtual Reality Representation.
Augmented Reality Representation.
Mixed Reality Representation.
For each of the aforementioned representational methods, the following devices were used in this research:
Hand-drawn sketches for Analogue Representation.
HTC Vive headset for User-Modified Virtual Reality Representation.
Adobe Aero for Augmented Reality Representation.
Microsoft HoloLens for Mixed Reality Representation.
The outputs of Stage 1 served as the basis to test and compare different representational methods using the appropriate devices. The pros and cons of each method in the planned event design process were then compared.
6.1. Analogue Representation
Analogue representation was one of the most common ways of preparing design drawings for many years. Architects, landscape architects, and urban designers have traditionally represented their ideas using pen, ink, and markers [
40]. This form of visual communication provides an immediate response to convey designers’ thoughts. Nowadays, with advancements in technology, a variety of representational techniques have emerged. However, hand-drawn sketches remain a common language among designers in the early stages of design.
In Stage 1, analytical diagrams were created using analogue representation techniques. Pedestrian flow and spatial geometry were illustrated in the plan view, while visual permeability was conveyed through hand-drawn perspective sketches.
6.2. Virtual Reality, Augmented Reality, and Mixed Reality
Before discussing each digital representation mode, it is essential to distinguish between key terms in this field. Virtual Reality (VR), Augmented Reality (AR), and Mixed Reality (MR) are the three representation methods used in this research. Although these methods have been extensively discussed in the body of knowledge, there is no shared understanding of their definitions among researchers and professionals. For the sake of clarity and to avoid confusion, this study does not aim to engage in the profound meanings of each term. However, broadly accepted definitions relevant to this research will be reviewed.
Zheng, Chan, and Gibson [
41] define Virtual Reality as “
…an advanced, human-computer interface that simulates a realistic environment.” Rendering is the process of creating virtual environment scenes, consisting of two steps. The first step, representation, considers how the virtual world should appear. The second step involves displaying the virtual world to users using appropriate hardware and software [
42]. Farshid, Paschen, Eriksson, and Kietzmann [
43] describe Virtual Reality as a three-dimensional virtual representation of the actual world or objects within it.
Wang, Kim, Love, and Kang [
44] define Augmented Reality as creating an environment where digital information is inserted into the real world. While VR fully immerses the user in a synthetic environment, preventing them from seeing the real world, AR allows users to see both the real world and virtual objects simultaneously [
45].
Although the distinction between VR and AR is clear, some researchers consider Mixed Reality (MR) synonymous with AR. However, the definition most relevant to this study differentiates MR from AR. Mixed Reality “enables walking into, and manipulating, a scene, whereas AR does not” [
46].
6.3. Immersive Technologies in Urban Design and Planning
Immersive technologies such as VR are increasingly recognised as valuable tools in urban design and planning. For example, Shakibamanesh et al. [
47] explored the use of VR in participatory urban policy-making, highlighting its potential for facilitating more effective citizen engagement. Despite challenges such as technological limitations, user constraints, ethical considerations, and privacy or legal issues, their findings demonstrate that VR has strong potential to support participatory urban processes. Similar to our aims, Mehan and Mostafavi [
48] conducted a comparative study focusing on the application of AR and XR technologies with the aim to make urban design more interactive and accessible to non-designers. By enabling stakeholders to experience and interact with spatial scenarios at a one-to-one scale, they were able to show that these technologies make complex urban concepts more accessible and understandable to non-experts. These two research projects show that when carefully implemented, immersive technologies can enhance dialogue between planners, designers, and communities, fostering more transparent, collaborative, and responsive approaches to shaping urban environments.
6.4. User-Modified Virtual Reality Representation
Using head-mounted display devices (HMDs), immersive Virtual Reality (VR) allows users to perceive computer-generated scenes [
49,
50,
51]. Recently, immersive VR has been widely adopted across various industries, from space exploration and entertainment to education and scientific visualisation. Architecture, landscape architecture, and urban design have also benefited from VR, using it to represent proposed designs to clients and within design teams. VR technology enables users to experience space at a real-world scale. The primary difference between displaying a virtual environment on a monitor and through an HMD is that the latter allows users to walk around and interact with virtual objects and spaces.
Fuzor, a VR tool widely used in AEC (Architecture, Engineering, and Construction) design coordination, was employed in this study to assess the potential of user-modified VR in event planning. The process began by modelling the existing conditions of Odlins Plaza to create a virtual environment (VE) navigable via a head-mounted display (HMD). Two event layouts, a large tent and a series of stalls, were also modelled and added to the system’s menu, enabling users to switch between them using a controller for comparative evaluation (
Figure 13, QR code 1).
While toggling between event layouts in the virtual environment was useful, the researcher aimed to make the tool more interactive. Since design is an iterative process, the next step was to allow users to modify layouts directly. To support this, movable elements, such as tents, containers, and food trucks, were placed in the VE. Users could grab, reposition, and arrange these components with a controller, enabling real-time layout design and impact assessment.
6.5. Augmented Reality Representation
Adobe Aero is an AR tool that allows users to place virtual models into real-world settings via mobile or tablet screens. A key benefit of AR is its ability to visualise the visual impact of temporary event structures from the user’s perspective.
As with the VR setup, two event layouts, a large tent and a series of stalls, were modelled and uploaded to Adobe Aero. Unlike VR, AR does not require modelling the entire site; users experience the real environment in real time. At Odlins Plaza, both layouts were deployed at full scale on separate occasions, enabling users to walk through the site and assess the visual impact of each design directly on location (
Figure 14, QR code 2).
6.6. Mixed Reality Representation
Microsoft HoloLens is a pair of mixed reality (MR) smart glasses that project holograms (virtual models) into the real environment. In addition to visualising holograms, users can interact with them through hand gestures. One key advantage of Microsoft HoloLens is that it provides a hands-free AR experience using a head-mounted display (HMD).
The same two event layouts used in previous representation modes were deployed on Microsoft HoloLens to experience MR representation in the planned event design process: one layout featuring a large tent and the other an arrangement of stalls. The user could view each layout through the HMD while simultaneously perceiving the real-world environment. Additionally, interactive functions such as rotation, scaling, and movement of virtual elements were available through hand gestures.
While there are similarities between MR and AR representations, MR offers the added capability of direct interaction with virtual models. This feature allows event designers to manipulate virtual tents or stalls and evaluate the visual impact of different event layouts on the venue. From this perspective, MR representation is similar to user-modified VR representation. However, unlike VR, MR enables users to perceive the real environment (Odlins Plaza) without requiring the venue to be modelled in the virtual environment.
6.7. Assessing the Effectiveness of Different Tools
As discussed, we have tested and compared various tools for use in the planned event design process. The advantages and disadvantages of each tool are summarised in
Table 2 and
Table 3. Based on the needs of the planned event process and the comparison of four tools, this section suggests the HTC Vive headset and Microsoft HoloLens as the most competitive devices. The ability to interact with virtual models makes these two technologies more advantageous compared to the others. With this capability, event designers can modify their layouts in real-time and assess their impact on urban public spaces.
Furthermore, the opportunity to experience the event venue with projected structures such as tents and marquees, at a one-to-one scale, allows event designers to test the visual impact of the event layout on the venue. This offers an additional layer of evaluation that enhances the planned event design process from an urban design perspective. Event designers can perceive the scale and size of each temporary event element while seeing them in the context of the real environment through these devices. However, to fully integrate these tools into the planned event design process, further development and customisation are required. Stage 3 will detail how these tools can be adapted and refined for use in the planned event design process.
7. Stage 3–Event Design Tool
While Stage 1 introduces techniques for evaluating event layouts against selected design-based criteria, Stage 2 explores different representation methods that can be used in the event design process. In Stage 3, we first developed an application for designing and evaluating event layouts. Next, the application was tested by event organisers in VR/MR sessions, and their feedback was collected on its effectiveness in the event planning and design process.
The ability to create three-dimensional models in CAAD programmes enables designers to represent their designs more easily and communicate with clients more effectively [
52]. Three-dimensional representation not only aids in presentation but also helps assess design alternatives against criteria such as visual permeability and legibility. Additionally, the use of Virtual Reality (VR) headsets has ushered in a new era in the design process [
52]. VR allows users to experience the designed space at a one-to-one scale, offering a unique immersive experience. Unlike CAAD programmes, which primarily provide two- and three-dimensional representations on a screen, VR enables users to walk through and experience the proposed design as if it were a real physical environment. This makes VR especially valuable in user-centric design.
7.1. Tool Development
Before developing the event design and evaluation system, similar software in the fields of event and urban design was reviewed. An overview of existing event design and planning software helps understand the extent of development in this field, while urban design applications provide insights into the latest techniques for designing and evaluating urban criteria. Three event design software tools were identified:
SmartDraw is a web-based flowchart tool that includes an event planning feature. Event designers can create event plans with scaled layouts, similar to CAD drawings, and access a library of elements and seating arrangements. However, it only offers 2D event layout drawings.
3DEVENTdesigner is another event design tool that allows users to create layouts using library elements in a 3D environment. The tool offers high-resolution visuals with materials and colours and includes templates for event venues.
Vivien is an event design application that operates in both 2D and 3D environments. It provides highly accurate, scaled CAD drawings and a library of elements for event design. Vivien also produces high-resolution 3D images.
These applications highlight the importance of producing accurate plans and 3D models before hosting an event. However, most are designed for indoor events. While they support event design, they do not evaluate layouts against specific criteria.
As discussed in Stage 2, virtual reality (VR) and mixed reality (MR) are found to be more applicable in the event design process. Chowdhury and Schnabel [
53] developed a platform for laypeople’s participation in neighbourhood design, enabling users to engage in the design process through a virtual environment (VE) using VR headsets and controllers. This immersive tool allows participants to interactively create 3D forms in the VE. Another study by de Klerk et al. [
54] allows users to model and walk through 3D elements, adjusting the scale from 1:5 to 1:1. This feature provides the user with the ability to modify the model using controllers.
To develop a tool for event design and planning, it must have two main functions. First, it should allow users to design the event venue by selecting structures (e.g., tents, marquees, fences) from a library and arranging them in a pre-modelled space. Second, it should enable users to evaluate the event layout against design criteria, such as pedestrian flow diagrams. Additionally, the tool should let event designers view the proposed layouts at a 1:1 scale, helping them assess the experience from an event-goer’s perspective. This aligns with the user-centric approach to event design.
As discussed in Stage 1, pedestrian flow, permeability, legibility, and geometry and built form were chosen as the assessment criteria. The application needs to enable event designers to first design an event layout and second, evaluate it against these criteria. Thus, the implementation of tool required two primary components to be developed:
- (i)
Modelling the Context.
- (ii)
Designing User Interactions.
For ‘Modelling the Context’, the selected case study (Odlins Plaza) was detailed in SketchUp, including surrounding buildings and green areas. The 3D model provides the digital context for design and evaluation. Additionally, regular event infrastructures, like marquees, stages, and tents were modelled in SketchUp for use in designing event layouts. Analytical diagrams, such as pedestrian flow and geometry, were also modelled in 3D to represent the criteria in context. The elements defining the physical elements and describing the context included the following items:
Urban public space as the event venue and context.
Temporary infrastructure library, such as marquees and food trucks.
Diagrams representing criteria, like pedestrian flow and geometry.
In terms of ‘Designing user Interactions’, while the application needs to be interactive, various interactions have been defined for the user to communicate with the system. C# scripting with Visual Studio and the Unity game engine were used to design and develop interactions in the VE. Unity (
www.unity.com) is a powerful game engine with high-quality graphics. The system developed in Unity can be deployed on multiple platforms, including VR and MR. These advantages make Unity one of the most popular game engines used in AEC and urban design research, see [
55].
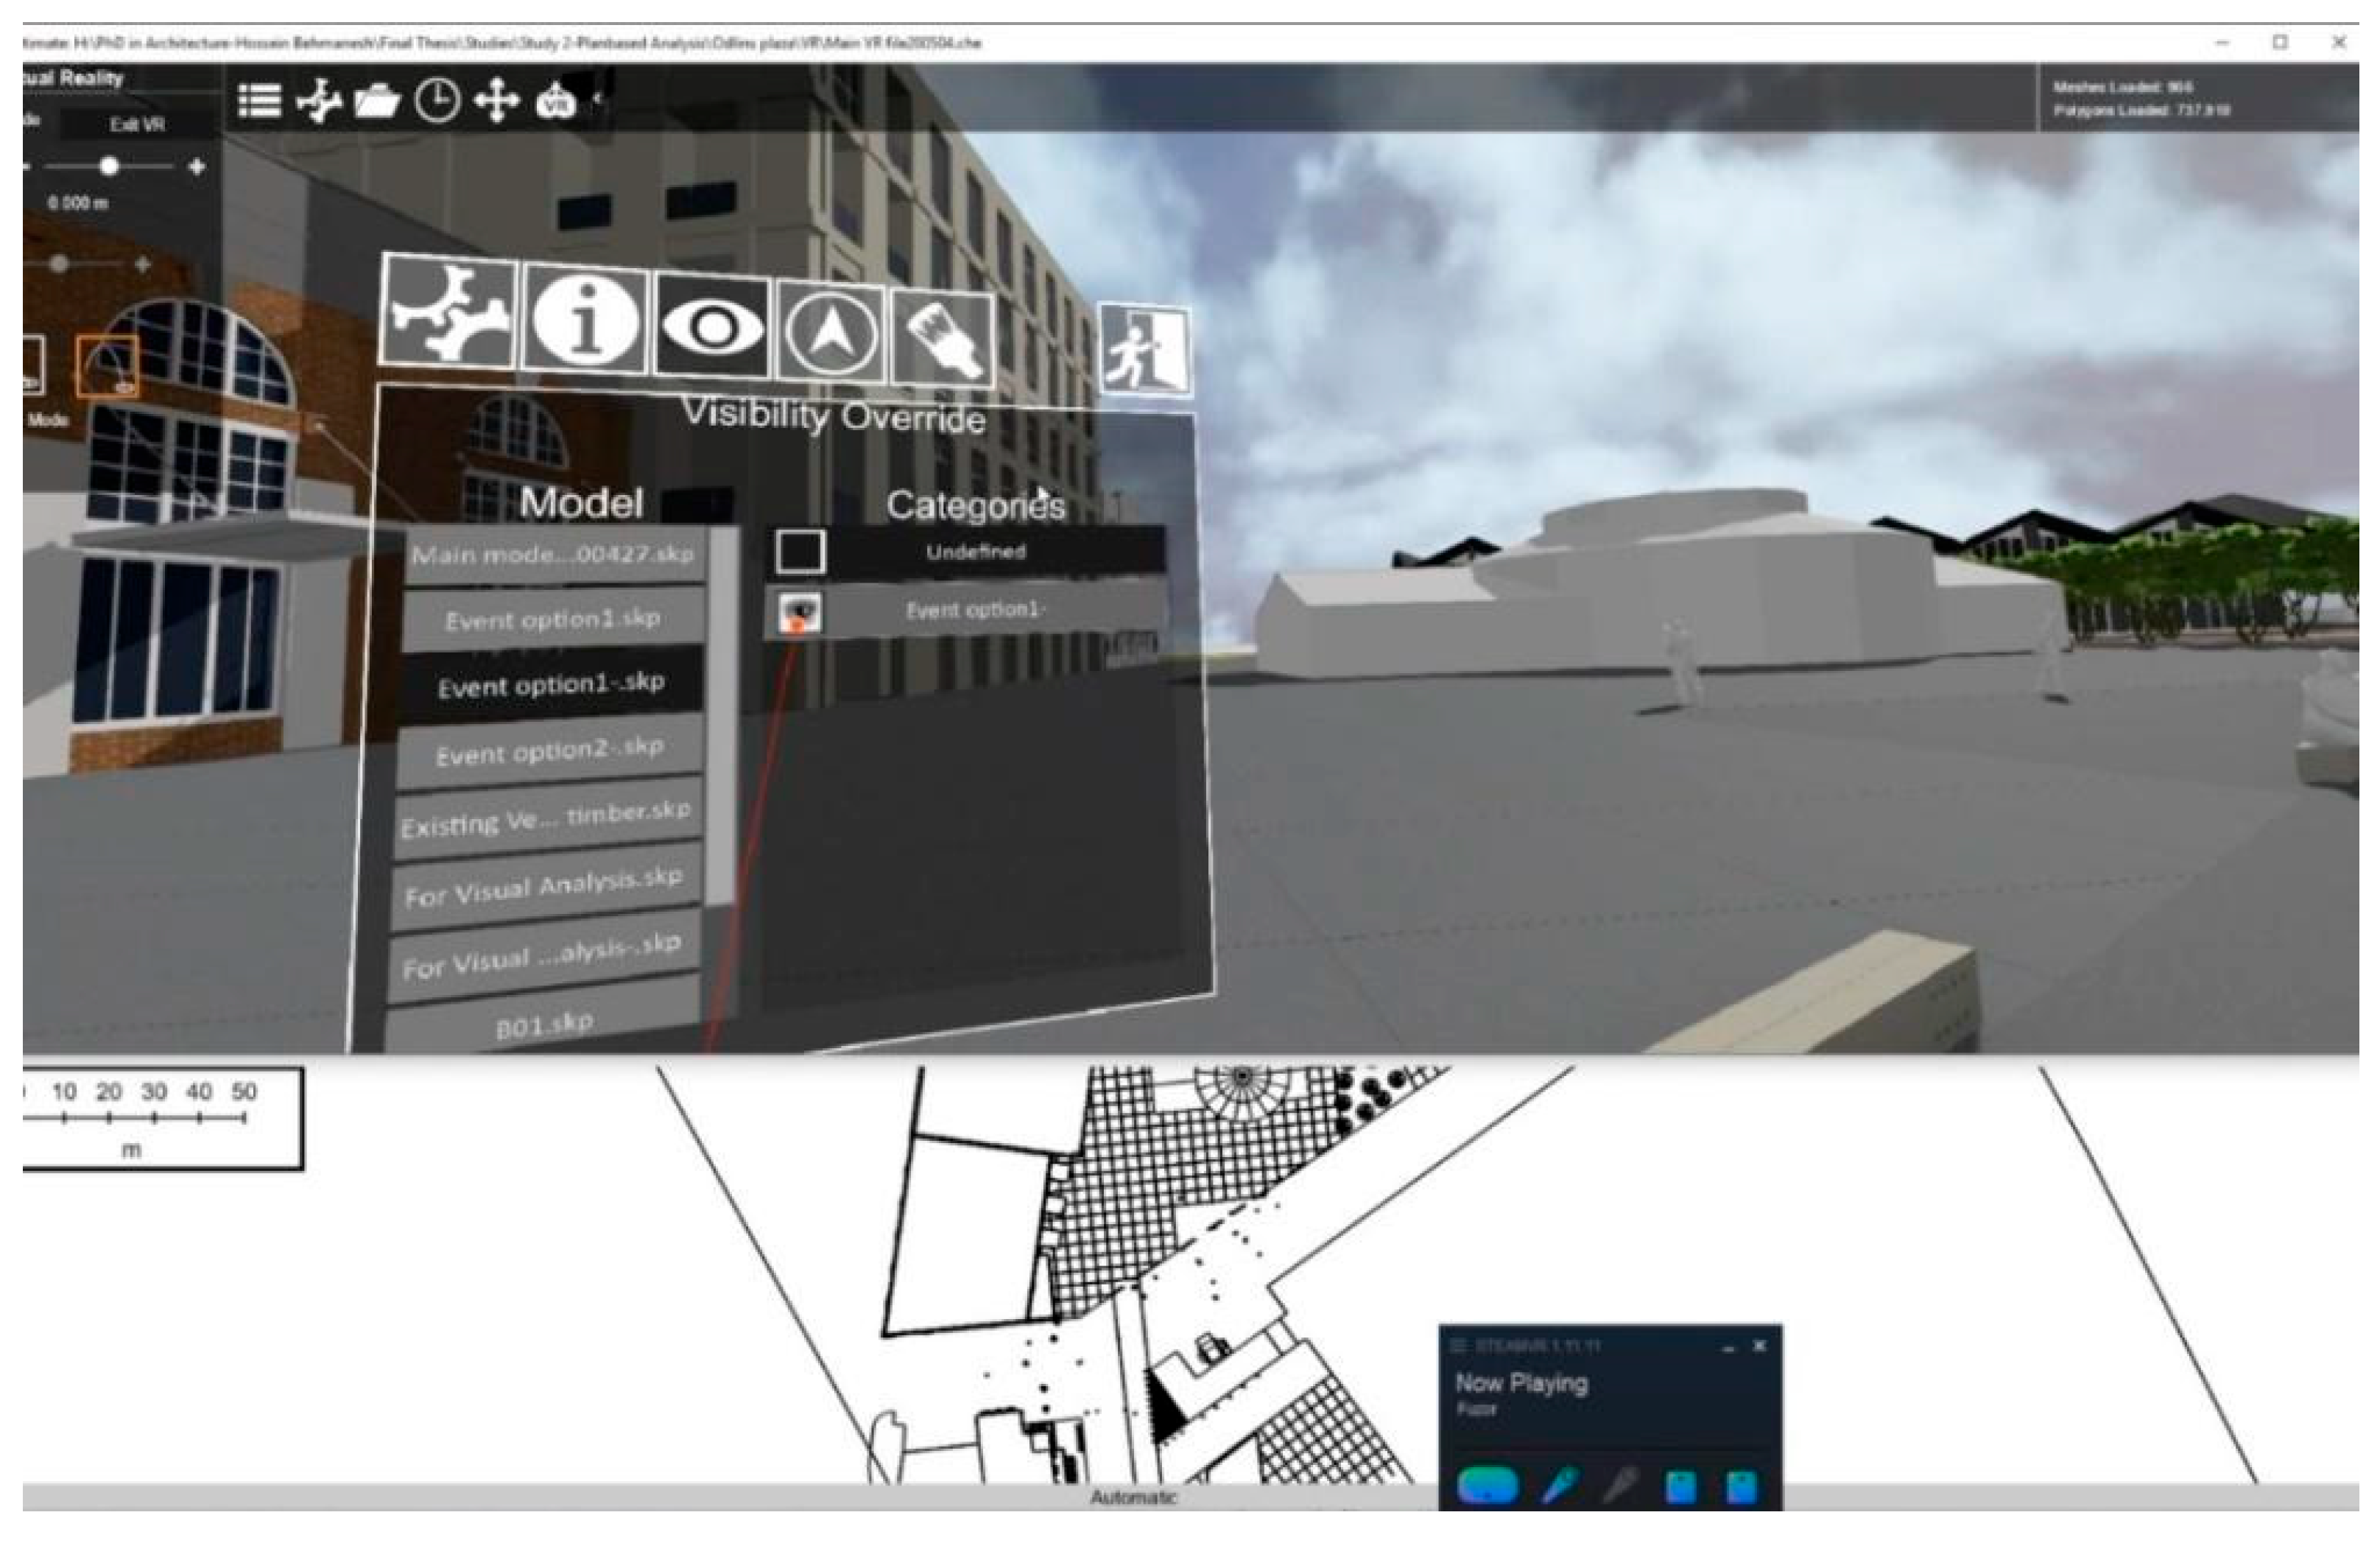
After importing the 3D models into Unity, interactions were designed using C# scripting in Visual Studio. The primary interaction allows the user to grab, move, and rotate library objects in 3D mode. With this, users can interact with the model using the controller. While these interactions enable event design, it is also necessary to assess the layout against selected criteria. A menu was designed to toggle different layers of assessments on and off (see
Figure 15).
The tool has been run and tested in two following devices that suggested in Stage 2:
HTC Vive headset, Manufactured by HTC Corporation, New Taipei City, Taiwan.
Microsoft HoloLens, Manufactured by Microsoft Corporation, edmond, Washington, USA
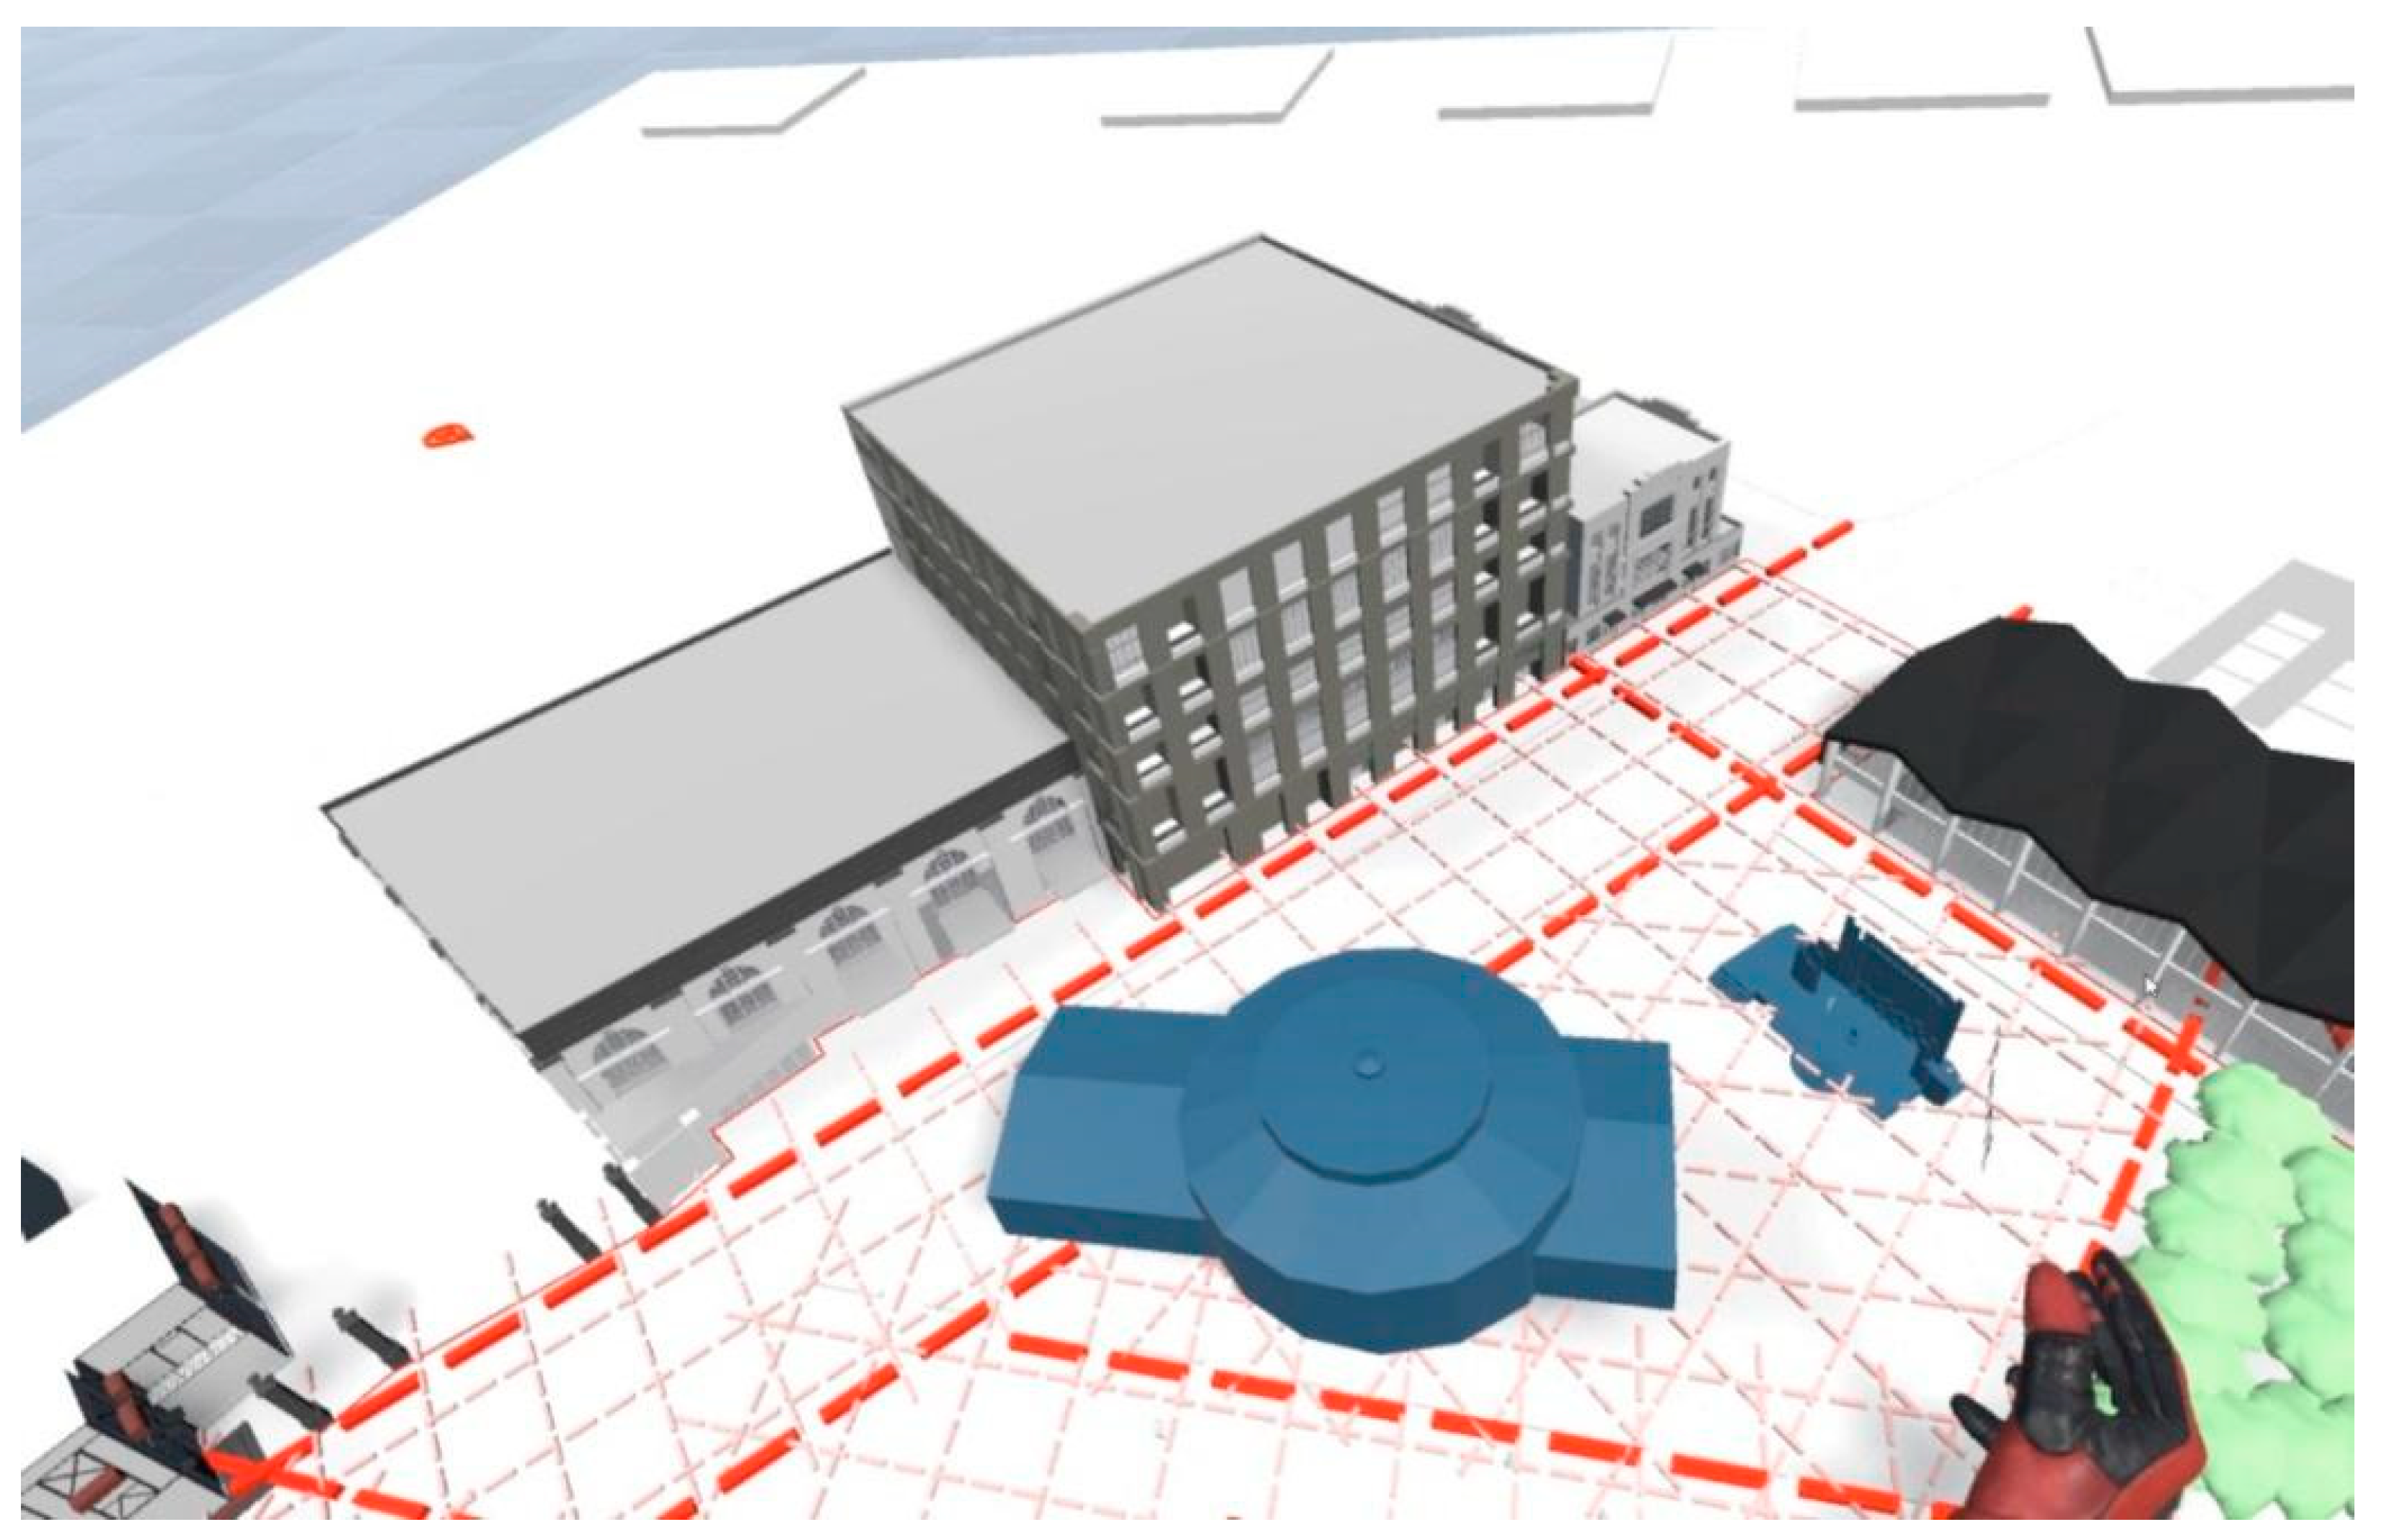
The case study modelled in the VE and the library of event infrastructures like an arrangement of tents, and marquees has been modelled to provide design capability to event designers. The availability of analytical diagrams facilitates a structured and informed evaluation process. So, the user can evaluate the designed event layout against selected criteria by turning analytical diagrams on. In addition, users can visually experience the event layout in three modes of representation within the VE: top view, model view, and one-to-one scale view and it does not need to detach the VR headset to see, for example, the top view (plan). This could facilitate the design and evaluation process, while it needs forwards and backward steps (see
Figure 16 and
Figure 17).
7.2. Experiment Session and Survey
To assess the effectiveness of the newly introduced event design tool, we invited event experts to participate in a VR/MR experiment session. Experts were identified through LinkedIn using keywords such as “event producer,” “event designer,” and “event organiser.” Since the case study was based in Wellington, local experts were targeted. An invitation email was sent to ten experts, and three agreed to participate in the experiment session and survey.
Before conducting the main experiment, a pilot study was carried out to evaluate the ease of using the controller for designing event layouts and to identify tool limitations for further refinement. Three PhD students in urban design participated in the pilot study. They used the tool in a virtual environment and provided feedback. Their interactions were observed and recorded, and they were asked for oral feedback during and after the session.
The pilot study showed that most functions, such as grabbing objects, teleporting, and using analytical diagrams, worked well. However, some issues arose when users attempted to change the scale. Based on participant feedback, modifications were made to improve the tool.
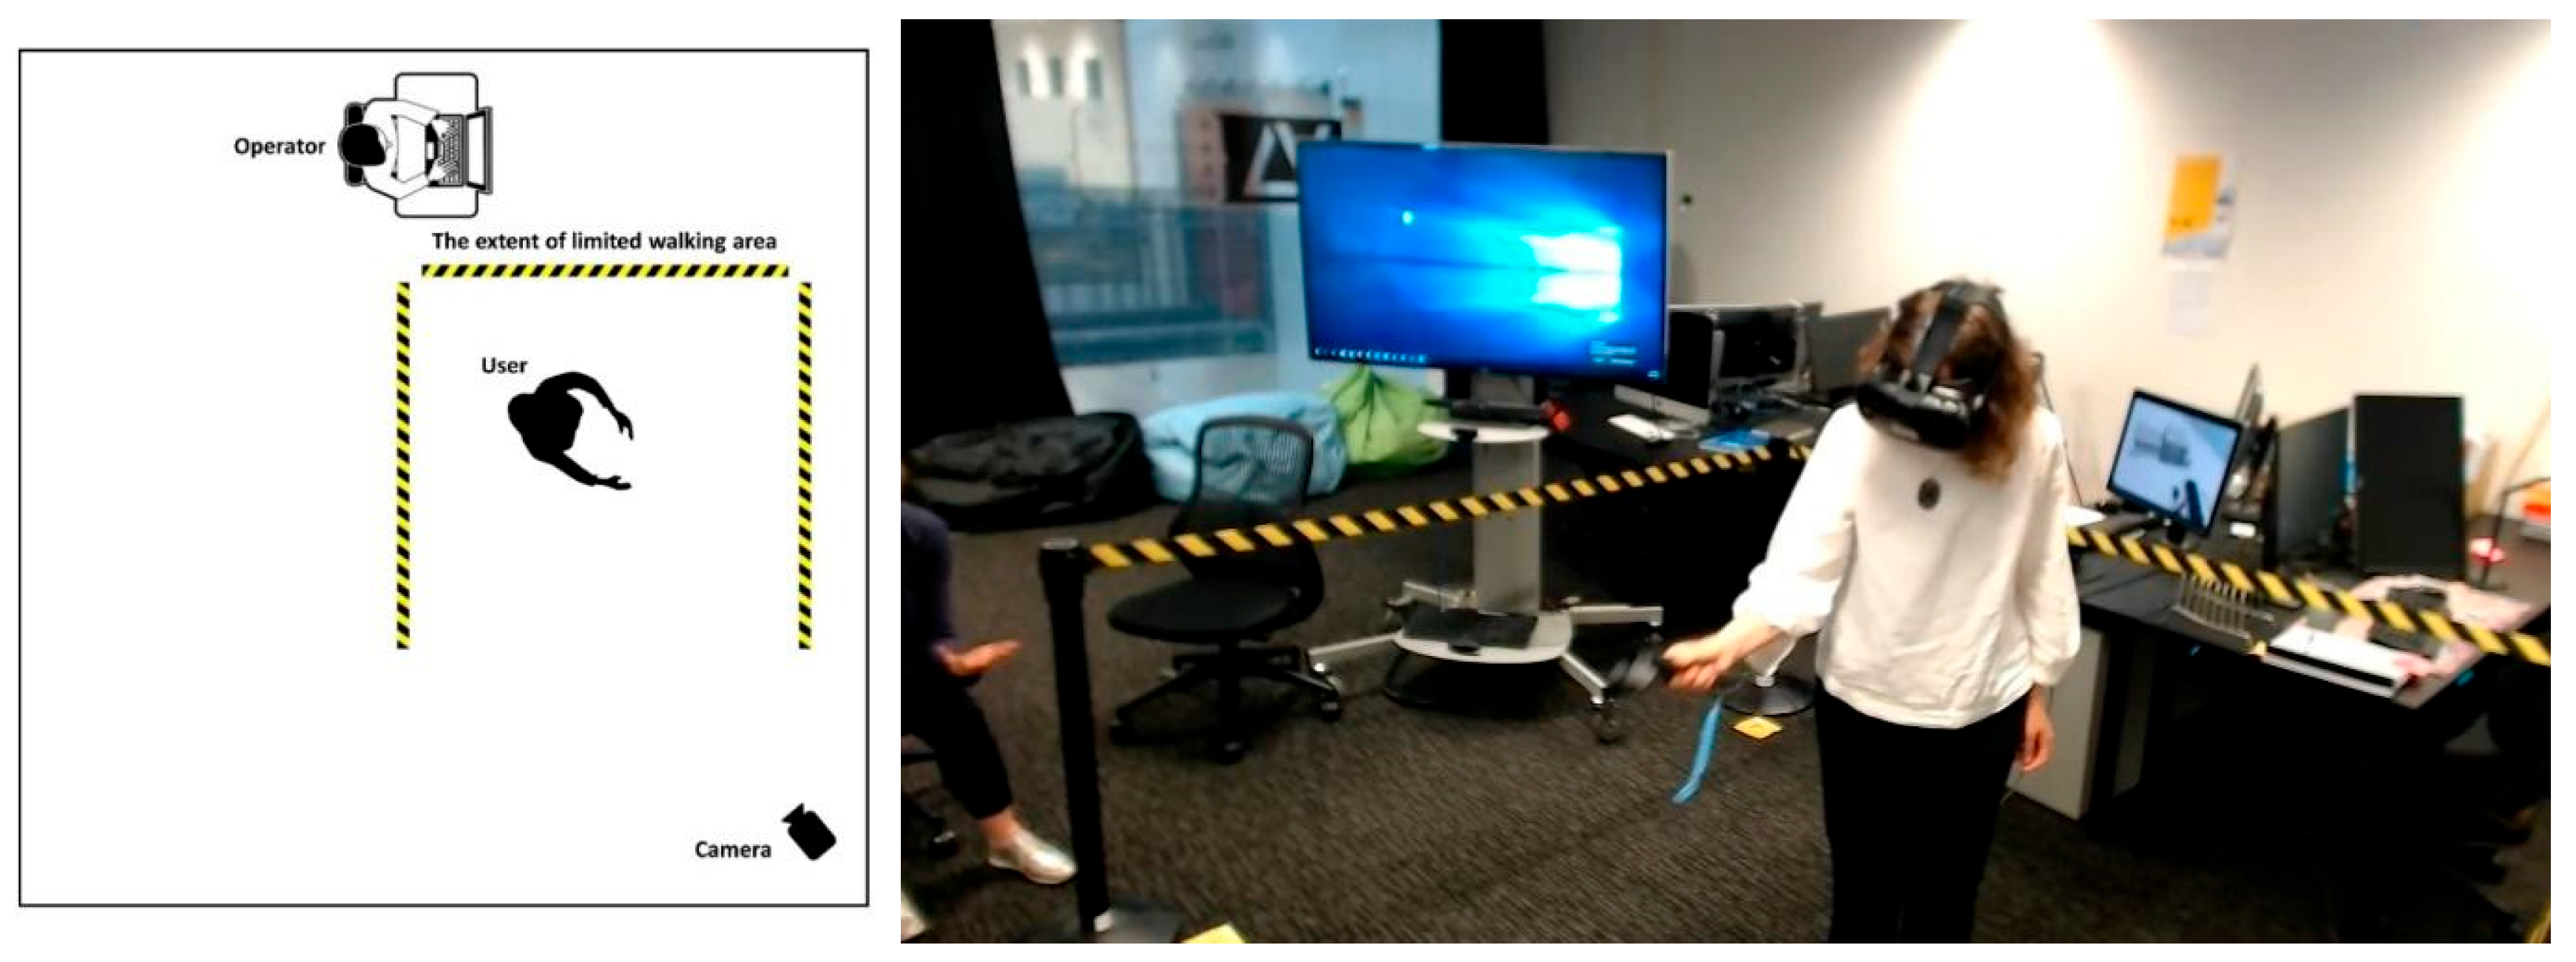
Figure 18 shows the experiment session setup and a participant experimenting the tool using the VR headset.
Five survey questions were designed to gather feedback from event designers on the tool’s effectiveness in the event design process. The first question asked if the tool could lead to better outcomes for the event industry and what its positive points were. The second question explored the tool’s application in different phases of event design. Participants were asked to describe its potential role in each phase. The third question focused on comparing devices to determine which was more user-friendly (HTC Vive headset or Microsoft HoloLens) for running the application. Finally, the last two questions addressed the tool’s limitations and potential improvements for future development.
The tool was tested on HTC Vive headset and Microsoft HoloLens 2. Each experiment session lasted approximately 90 min. After a brief introduction to the project and the tool’s functions, participants spent around ten minutes designing and modifying an event layout. They then answered the survey questions. All sessions were video recorded, and participants provided written feedback. The virtual environment was mirrored on a screen and recorded while users interacted with the application.
8. Results
The survey results showed that all participants agreed the tool improves the event design process. Two participants highlighted that the tool facilitates communication with the public, particularly permanent tenants of buildings around the event venue. The third participant found the tool useful for conveying layout information to suppliers and other stakeholders. When comparing the tool to current event design methods, participants identified several advantages:
Testing different ideas efficiently.
Identifying potential issues in advance.
Providing pre-visualisation, which improves knowledge for all parties and reduces adjustments on the event day.
Communicating plans realistically and understandably.
Acting as a valuable tool for site managers and event organisers.
Enabling collaborative design between event designers and place managers.
Participants were asked where the tool could be implemented in the event design process and suggested improvements:
A shared communication tool between event organisers, urban designers, property developers, and funders.
A way to test the event-goer’s experience.
A platform for community engagement in event planning.
An instrument for checking logistics, such as surface load capacities, building entrances, and delivery routes.
Regarding the devices, two participants found both the VR headset and HoloLens helpful, while one participant preferred the VR headset for its intuitive interaction. However, the ability to see the physical environment was considered an advantage of the HoloLens. For future development, participants pointed out some limitations:
Menu navigation and object manipulation could be challenging at first, but easier with practice.
Mobile use of the tool on-site would be beneficial.
Simplifying the tool could make it more accessible to a wider range of age groups.
While the event designers had not previously used VR/MR, it is common for first-time users to experience some difficulty with these mediums. Interestingly, after the first attempt they reported feeling more comfortable with the tool, including navigating the menu and manipulating objects in the VR/MR environment. This suggests that, like many new technologies, users need time to experiment and familiarise themselves with the system before fully engaging with its capabilities.
In addition to the survey, a protocol analysis of the verbal conversion between event designers and the researcher during the VR tool experiment session was conducted. Protocol analysis could be used as an effective way to understand the extent of user involvement in the design process [
56].
The ultimate aim of the VR experiment sessions was to understand the effectiveness of the prototype in practice. As discussed, the tool has two primary functions (design and evaluation). The degree that a user is involved in each of these activities influences the degree of effectiveness of the tool. Also, we could see to what extent there is a need for a user to understand how to use the tool effectively. The recorded VR experiment sessions were transcribed carefully and coded based on the coding system as below:
Designing Event Layout [DEL] refers to instances where users discussed their proposed event layouts while using the tool. Evaluating Event Layout [EEL] captures moments when users commented on the assessment of those layouts. Another key area, Discussing the Potentials of the Tool [DPT], includes users’ reflections on how the tool could be applied within the broader event design process. Additionally, insights that contributed to the development of the prototype emerged from users’ questions about the tool’s functionality. These interactions were coded as [QAW] on How the Tool Works during the analysis of the VR experiment session transcripts (
Table 4).
Figure 19 shows that approximately 20% of the conversations in each session focused on designing an event layout. In two sessions, discussions around the potential application of the tool in the event design and evaluation process were dominant, comprising around 50% of the dialogue. This suggests that users were actively considering the tool’s practical use. In Session III, about 50% of the conversation revolved around how to operate the tool, indicating a potential need for a training session prior to use. Conversations related to evaluating event layouts accounted for less than 20% in each session, possibly due to the absence of fully developed layouts for assessment. However, in Sessions I and II, the benefits of experiencing the design at a one-to-one scale were discussed in depth.
Overall, this research suggested a novel VR/MR tool be used to design and evaluate designs for event proposals as part of the event design process. The tool allows event designers to design and edit different event layouts in VE. A library of event structures including tents, marquees, and food trucks is provided to see how event layouts look before events are staged in urban public space. The results of the survey showed all event designers found the tool effective for the design and evaluation of planned events.
The results of this study highlight the dual role of immersive technologies in both supporting a more effective design process than is possible with traditional tools, and enhancing stakeholder engagement. Participants recognised the value of the tool not only for testing and visualising event layouts, but also for communicating ideas to diverse audiences, from tenants and event infrastructure suppliers to site managers and the wider community. This indicates that VR/MR tools can act as a bridge between technical planning and public understanding, helping to make urban event design more transparent, collaborative, and responsive to different stakeholder needs. By offering an interactive, one-to-one scale experience, the tool has the potential to democratise event planning processes and strengthen participatory practices.
We believe that the tool developed is unique in targeting the needs of event designers in cities around the world. It enables those from a non-design background to have the support of a tool that has needs-focussed design intelligence that is specifically developed to be comprehensible but usable by non-design experts.
9. Concluding Remarks
As discussed, this study builds upon the findings of a previous investigation by Behmanesh and Brown [
14], that identified the fact that those involved in temporary event design tend to have no format training in urban design or related areas.
In response to the issues identified our research introduced and tested a novel VR/MR-based tool designed to support the event planning and design process. This tool offers two key practical benefits.
- (i)
First, it enables event designers to create and modify various planned event layouts within a virtual environment (VE). The ability to move 3D elements in virtual space was accomplished relatively easily and gave non-designers a better understanding of the consequences than, for instance, simple 2D sketches.
- (ii)
Second, it allows users to evaluate those layouts against selected design-based criteria by using analytical diagrams and multiple modes of spatial representation. The system gives automatic feedback when good practice guidelines such as proximity to existing buildings is violated.
To the best of our knowledge, no other VR/MR-based event design and planning tools currently exist in practice. The tool developed in this study offers three integrated modes of representation within the VE:
Given the non-linear and three-dimensional nature of the event design process, designers require easy access to these different views, along with the ability to switch between them efficiently. The tool developed enables such functionality without requiring the user to remove the VR headset, significantly streamlining the workflow. By allowing designers to easily shift between representational modes, the tool enhances the iterative process of temporary event design. This indicates that the approach could also be adapted for broader use in other design-based software applications across the AEC sector to improve design outcomes and user interaction.
Although this study examined three criteria, Pedestrian Flow, Geometry, and Permeability, future research could extend this by integrating additional criteria like Land Use, Capacity, or Vehicle Flow. Each may require tailored analytical approaches but would contribute to making the tool more comprehensive. Testing would establish whether the increased complexity was counter-productive when used by those without urban design training.
This tool is primarily designed to assist non-expert users in the design and planning of public events, but its underlying rationale and workflow have broader potential applicability. While the use of digital tools in participatory design is not a new concept, the development process of this tool provides a unique approach for enabling co-design and engaging citizens in the creation of temporary event, and other interventions in public spaces. By making the design process and principles more accessible, the tool encourages broader participation, fostering more inclusive and responsive urban environments.
Moreover, the methodology and technological approach used here can be extended to other types of urban event venues, such as streets, parks, and public plazas, and could integrate real-time data streams to further test and refine the tool. An additional promising direction lies in the use of VR/MR environments to support collaborative design processes. This also opens an avenue for future research, particularly in examining how different demographic groups, such as age cohorts, particular stakeholders or genders, interact with the tool, perceive its usability, and influence design outcomes through their participation.

