Article

Building Smart Urban Areas: Case Study in Pleiku City, Vietnam

1
Department of Geodesy and Cartography, Faculty of Natural Resources and Environment, Vietnam National University of Agriculture, Hanoi 100000, Vietnam
2
Department of Agroecology, Faculty of Natural Resources and Environment, Vietnam National University of Agriculture, Hanoi 100000, Vietnam
3
Faculty of Real Estate and Resources Economics, National Economics University, 207 Giai Phong, Hanoi 113068, Vietnam
*
Author to whom correspondence should be addressed.
Urban Sci. 2024, 8(4), 232; https://doi.org/10.3390/urbansci8040232
Submission received: 30 July 2024 / Revised: 18 November 2024 / Accepted: 20 November 2024 / Published: 28 November 2024

Abstract

:
Constructing smart cities is currently a pressing concern in many nations in an effort to address issues including environmental pollution, climate change, and the growing urban population. This study aims to understand the factors that influence the development of smart urban areas in a Vietnamese class I city. We collected research data by conducting a survey with 200 representative samples from Pleiku City. Research results have shown that the group of organizational and implementation factors has the greatest influence on smart urban construction in Pleiku City, with a rate of 30.23%. The human resource factor group has a rate of 27.77%, and the policy mechanism group has a rate of 23.36%. Finally, the planning factor group has a contribution rate of 18.65%. Policymakers can use this research result as a guide to implement smart urban construction projects in other cities in Vietnam. We also highlight some policy implications for various solutions, including human resources, finance, policy mechanisms, and planning.

1. Introduction

A United Nations report states that 3.6 billion people, or 54.6% of the world’s population, reside in metropolitan areas. More than 70% of people on the planet will live in cities by 2050 (of which 64.1% will do so in developing nations and 85.9% in developed ones) [1]. Population growth will have a significant impact on city development due to environmental pollution [2] and a lack of resources such as clean water [3], land [4], and energy [5]. In other words, for city planners, this shift in the population presents serious difficulties. It is up to them to come up with plans for the expanding urban population’s sustainable living standards. In this context, some developed countries have begun to learn and research core technologies and information technology for urban planning [6]. The goal is to develop solutions to control difficult problems that arise during the development of a modern city. Therefore, smart urban construction is expected to help solve the problems that urban areas and urban consequences encounter in order to bring a better life to urban residents [7].
The phrase “smart city” initially arose in the 1990s, primarily referring to the incorporation of Information and Communication Technology (ICT) and infrastructure inside urban areas [8]. Since then, researchers have conducted numerous studies and reviews to better define and understand the concepts involved [9,10,11]. Smart cities are defined as cities with invested human and social capital [12]. A smart city is one that has a developed economy and an interconnected transportation network supported by ICT [13]. It is also recognized as an urban area characterized by sustainable economic development, a high quality of life, and well-managed environmental resources, managed by a government apparatus that allows citizens to participate in referendums [14]. Along with promoting traits like a smart economy, environment, lifestyle, and management, smart cities also combine technology, governance, and society [15,16]. In other words, smart cities are cities for people, creating many opportunities to exploit human potential and encourage innovation.
In Vietnam, urban regions account for 70% of the country’s GDP. Despite making up only 2.9% of the total territory and roughly 22% of the people, these five centrally managed cities provided 46.8% of the nation’s GDP in 2020 [17]. As of September 2022, Vietnam has 888 urban areas, and the urbanization rate is 41.5% [18]. However, as urban areas develop, they gradually encounter limitations, particularly when their development lacks sustainability [19]. To solve this problem, cities need to research, choose, and change development directions to ensure urban connectivity. From there, cities can solve urban problems such as environmental pollution, flooding, air quality, and traffic congestion [20]. Therefore, building smart cities is considered an important method towards sustainable development in the current context in Vietnam [21]. Smart urban development is one of the important driving forces to realize the goal of turning Vietnam into a modern, high-income industrial country by 2045 [22].
Currently, there are not many studies in Vietnam that deeply address the issue of building smart cities. However, according to those that do, the biggest challenge is the attention and awareness of leaders at all levels, as well as people and businesses [23,24]. The perception of smart cities is also being understood in many different ways. There is a question as to whether building smart cities is just a way to deploy the model or develop services [25]. In simpler terms, it involves enhancing the use of information technology in administration and management. The above questions make it difficult to implement smart urban projects in Vietnam. Therefore, studying some factors affecting smart urban construction will help make smart urban construction projects in Vietnam more feasible. It will also contribute to increased interaction between people and the government, as well as improving the quality of life for sustainable development. Pleiku City, a class I urban area and the second largest city in the Central Highlands, will host this research. The research findings will add to the body of knowledge on smart cities. Policymakers can use them as a reference to implement smart urban construction projects in other Vietnamese cities, particularly in class I cities with significant development potential. This study aimed to determine the relationship between policy mechanisms, human resources, planning, and implementation organization in the context of the Central Highlands, which is a unique area in Vietnam.

2. Some Factors Affecting the Construction of Smart Cities: A Literature Review

The construction of smart cities is important for regional economic development [26,27], and it is influenced by many factors [28,29]. Numerous studies have examined various factors and their impact on the development of smart urban areas. Meijer and Boloviar’s demonstrated that the construction of a smart city hinges on three key elements: smart technology, people, and governance [30]. Smart mobility, environment, economics, people, and governance are all indicators of a successful smart city [31]. Other reports have expressed similar views regarding these factors [32,33]. Al Nuaimi also identified some similar factors in their study [34]. Recently, the research team has pointed out a number of important factors in building smart cities through the definition of smart cities, such as human and social factors, life activities, and physical infrastructure [35].
Building smart cities also involves making smarter policies for transparent governance [36], co-creating innovation [37], and encouraging citizen participation [38]. Li et al. (2022) also pointed out the importance of factors related to policy mechanisms in forming a smart city [39]. The research team made three policy recommendations to accelerate smart city development. The implementation of smart city construction policies significantly impacts the level of urban innovation, especially in medium-sized cities [40]. However, the indirect effects of policy implementation are larger than the direct effects [41]. The effectiveness of smart urban policies will be greater in cities with excellent financial conditions and a strong digital economy [42].
Additionally, the nature of planning is to determine urban development models and methods of moving and operating in urban areas [43]. As a result, planning ensures effective land use suitable for production methods and the culture of the people [44]. In each historical period, many urban development models were proposed and implemented. These included the garden city model [45], the vertical urban model [46], and some other modern models [47,48]. In particular, smart urban planning has its own unique implementation method. Smart urban planning starts with surveying and evaluating real-world human problems and needs. The planning process will then provide practical solutions. Planners accurately create forecasting models and test their effectiveness before deciding on the most optimal planning option based on the collected data. To put it another way, planning a smart city entails the deployment of a variety of ICT resources to collect, analyze, visualize, and act on the collected data [49].
Based on a limited number of studies and the research context in Vietnam, we have categorized the factors that influence the construction of smart cities into distinct groups. These include policy mechanisms, human resources, planning, and implementation organization. Figure 1 shows our research model. It was suggested that to overcome the above limitation, this study should apply exploratory factor analysis (EFA) to identify the five groups of factors affecting land use planning in the Dan Phuong district, including the groups of politics (Po), economy (Ec), society (Soc), environment (En), and other (Ot) [27].

3. Research Location and Methods

3.1. Research Location

Pleiku City is located in the north of the Central Highlands, with a total area of 26,076.86 ha. This is the second-largest city in the Central Highlands in terms of population and urban area. Pleiku City is divided into 22 commune-level administrative units, including 14 wards—Chi Lang, Dien Hong, Dong Da, Hoa Lu, Hoi Phu, Hoi Thuong, Ia Kring, Phu Dong, Tay Son, Thang Loi, Thong Nhat, Tra Ba, Yen Do, and Yen The—and 8 communes—An Phu, Bien Ho, Chu A, Dien Phu, Gao, Ia Kenh, Tan Son, and Tra Da. Pleiku City offers several benefits and prospects for the development of green urban areas and infrastructure due to the region’s typical terrain and various landscape values. Furthermore, the city benefits from arranging its urban structure in accordance with topographic and landscape characteristics, resulting in the creation of significant and distinctive areas. In 2023, the average rate of economic growth was 12%. The average annual income per person reached VND 52 million, with the services sector increasing by 12.8%, the industry–construction sector increasing by 18.92%, and the agriculture–forestry sector increasing by 4.65% [50]. Pleiku’s metropolis is gradually catching up to the requirements of a modern, civilized metropolis.
In accordance with the Provincial People’s Committee’s decision to approve the Project “Building Pleiku city towards a smart urban period 2020–2025, with an orientation to 2030”, the city has proactively constructed and developed a Smart Operations Center and related applications, with urban residents serving as the focal point. From there, the city aims to enable all sectors of society to enjoy the benefits and participate in investment in construction, supervision, and smart urban management. Essential infrastructure investment projects must include research and analysis content to consider and supplement application items, such as connecting to the Internet of Things (IoT), sensor integration, and digital technology applications. The application of information technology and IoT infrastructure development must ensure efficiency in urban management and construction. Infrastructure development also needs to avoid duplicate investments in accordance with the National Digital Transformation Program, with a focus on 2030.

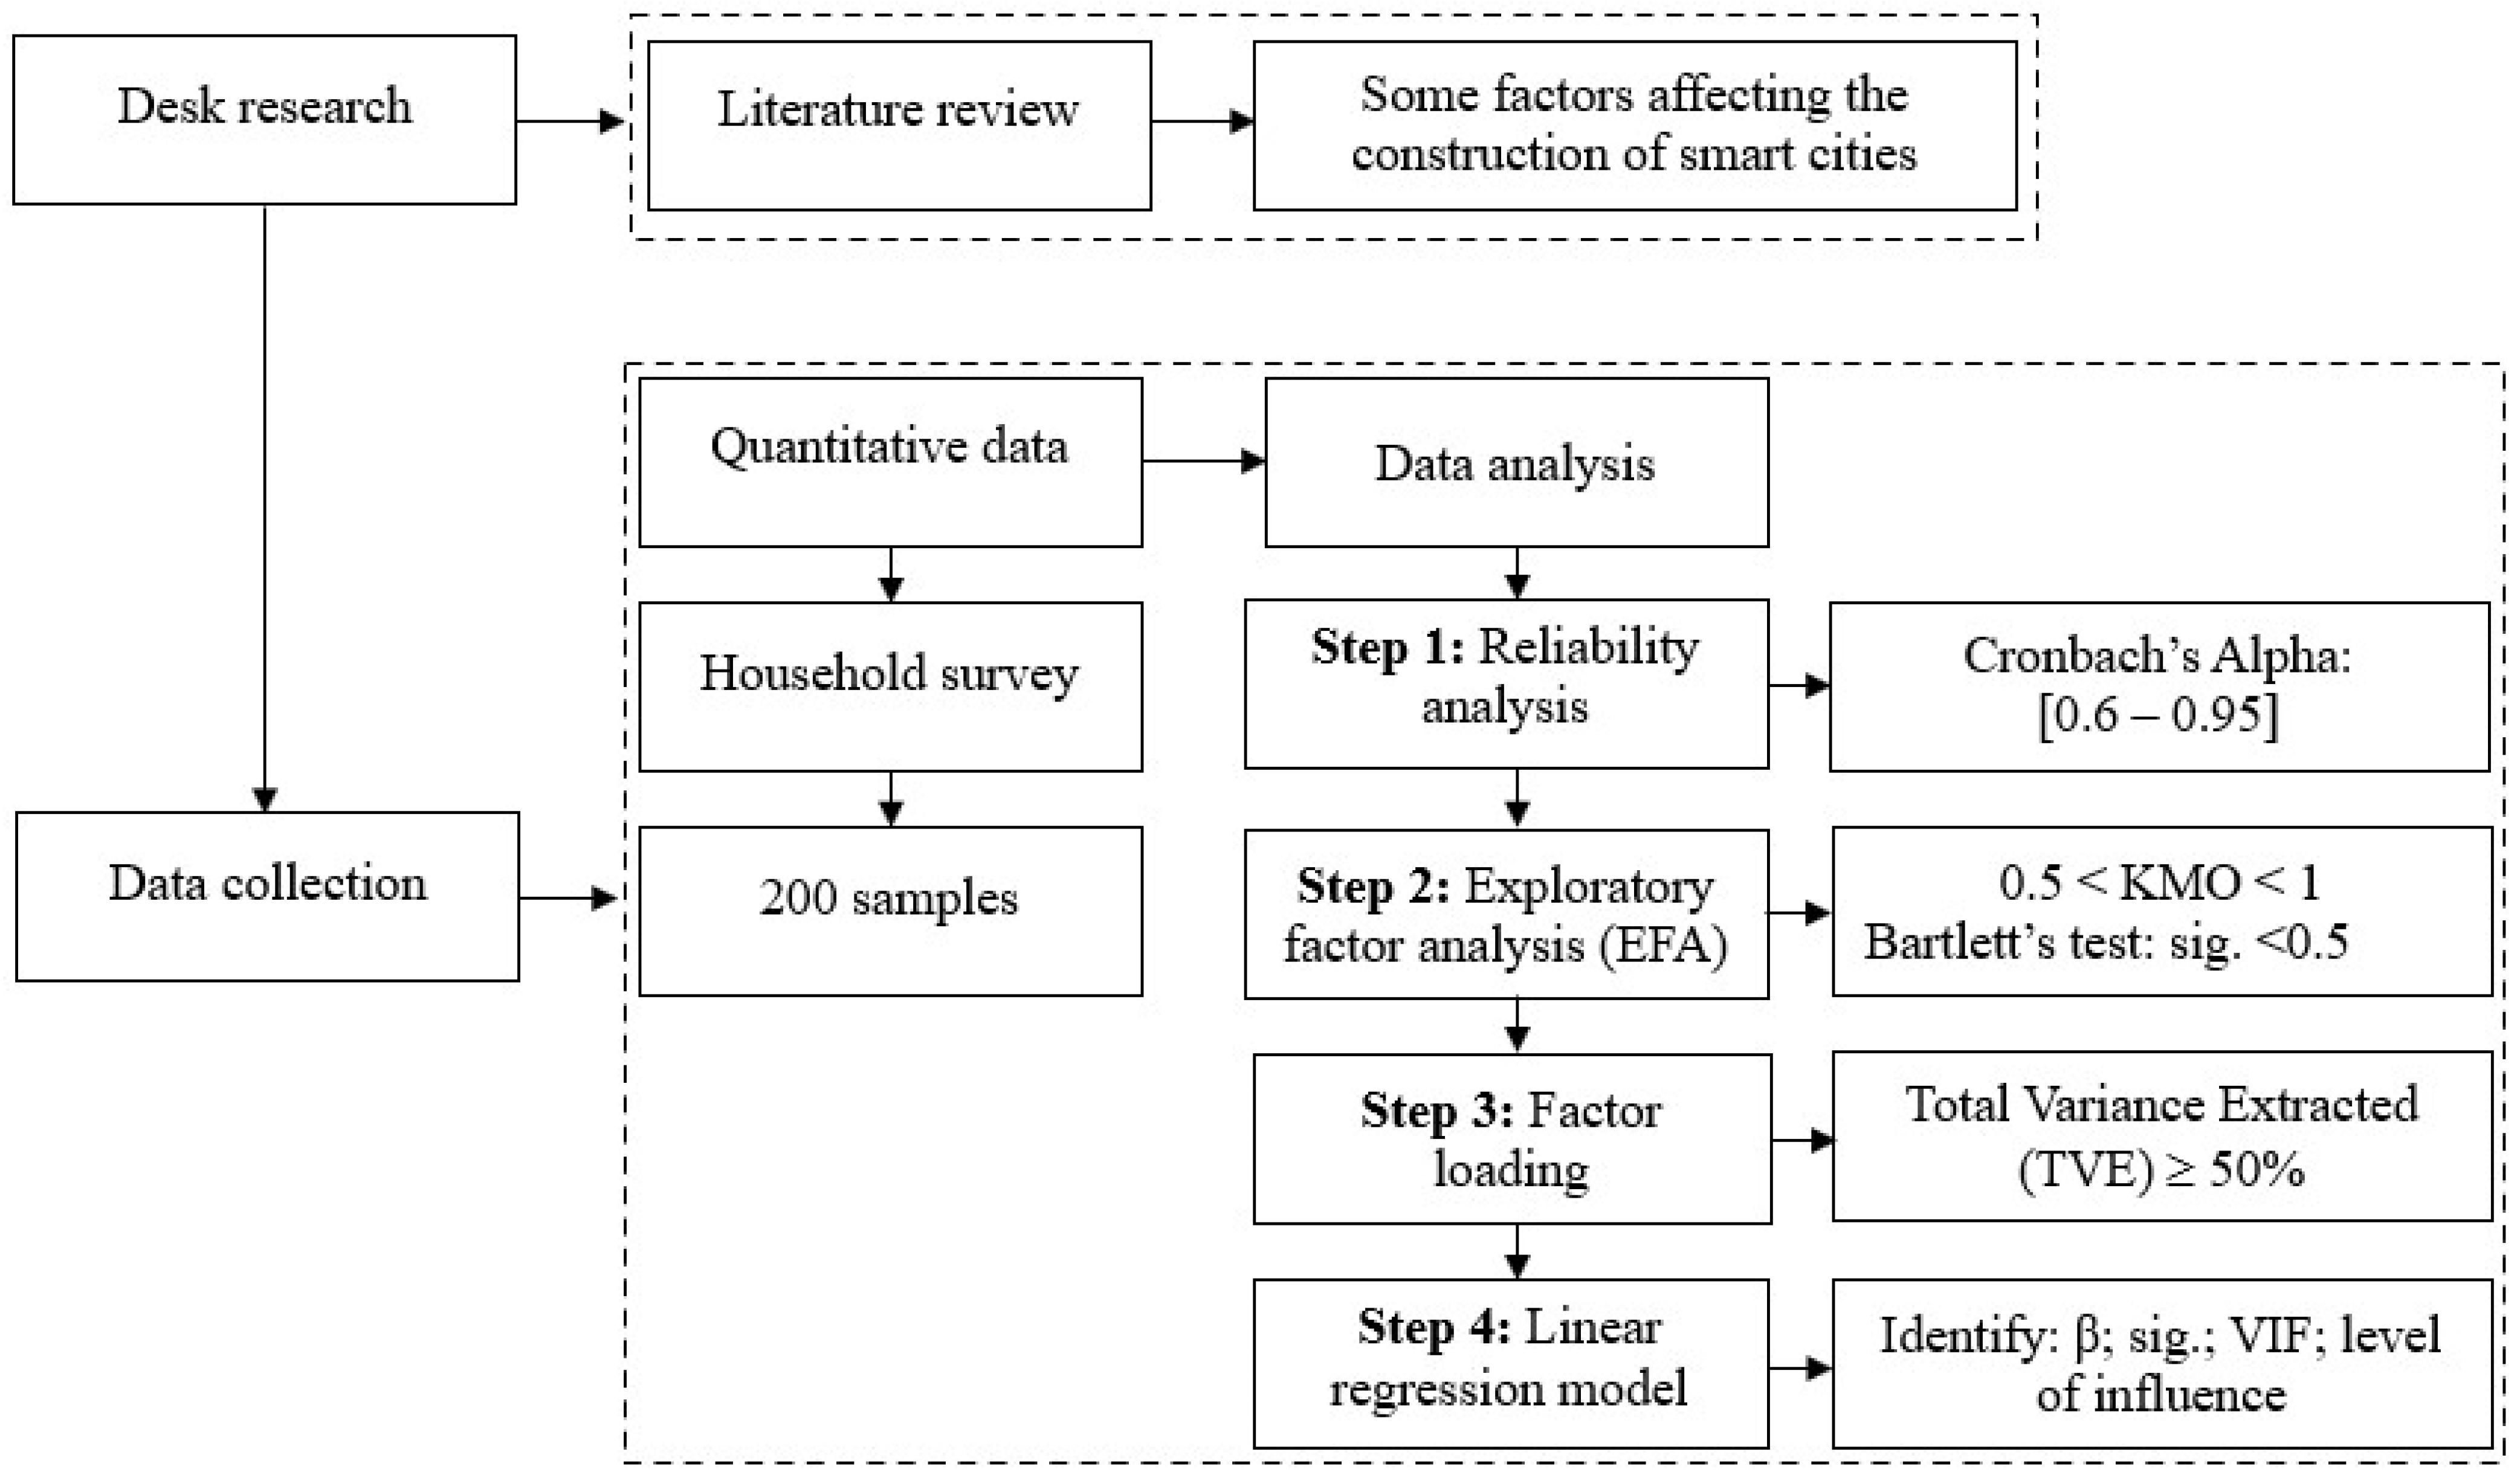
3.2. Research Model and Data Analysis

The survey direction prioritized selecting households living along urban streets in the core urban area, suburban areas, and outlying areas. Households on these streets are involved in business, trade, and local civil servants. With a sample size of 235, the survey method was stratified and random. After screening and eliminating some incomplete and unsatisfactory questionnaires, the remaining sample size was 200. Using available survey forms to randomly survey 200 households and individuals, the survey direction prioritized selecting households living along urban streets in the urban core, the urban fringe, and areas far from the urban center; households on these streets are involved in business, trading, the real estate market, the civil service, the public sector, etc., according to the level of urban development and the main streets. The survey gathered 80 forms from the urban core sub-region in the Tay Son and Dien Hong wards (according to urban residential areas along the central streets passing through these 2 wards), 60 forms from the urban fringe area in the Tra Ba and Thang Loi wards (according to urban residential areas along the central streets passing through these 2 wards), and 60 forms in the area far from the urban center in the An Phu and Dien Phu communes (according to urban residential areas along the central streets passing through these 2 communes). Part 2 of the survey, based on the results of the literature review and the research model, focused on four factors. These factors were evaluated using a 5-point Likert scale, which was used to assess the level of influence of the factors on smart urban construction in Pleiku City. During the survey, the authors also encountered some difficulties, especially in approaching the survey participants. The survey participants exhibited varying levels of education. People accessing and contributing ideas for the implementation of smart urban construction still faced many difficulties due to a lack of uniform understanding.
The data analysis of the survey questionnaires followed five steps (Figure 2).
Step 1. Compile and input data from 200 survey forms into Excel, filling in numbers according to each response from residents based on the specified point scale: (1 point) very little impact, (2 points) little impact, (3 points) moderate impact, (4 points) significant impact, (5 points) very significant impact.
Step 2. Reliability analysis: Use Cronbach’s Alpha coefficient to test the reliability of the scale. If the Cronbach’s Alpha coefficient is not within [0.6–0.95], eliminate the variable; next, examine the item–total correlation coefficient. If the item–total correlation coefficient is ≤0.30, eliminate the variable.
Step 3. Exploratory factor analysis: If the KMO (Kaiser–Meyer–Olkin) coefficient is not within the following range: 0.5 < KMO < 1, then the factors are to be eliminated and considered insignificant. Check if Bartlett’s test has a sig. value > 0.05; if so, then the model is insignificant.
Step 4. Factor loading of the rotated matrix: If the extracted variance of the independent variable is ≤50%, the variable is insignificant. This step contributes to the stratification between factors and the degree of influence of each factor.
Step 5. Linear regression analysis to determine the standardized regression coefficient (β), standard error (Sig.), and VIF, forming the regression equation. Use the standardized regression coefficient (β) to evaluate the % level of influence of each factor.
After collecting the survey data, the authors entered data from 200 questionnaires into Excel. The authors scored each survey participant’s responses based on the degree of influence of various factors on smart urban construction. We entered the data into Excel and then transferred it to SPSS 22 software, which processed it through four steps, as illustrated in Figure 2. Finally, the regression equation took the following form:
Yi = β0 + β1X1 + … + βnXn + Ei
where Yi demonstrates smart urban construction; X1, …, Xn represent factors affecting the construction of smart cities; β0 is a constant and takes the value of Y when all values of X = 0; β1 is the regression coefficient; and Ei is the standard error.

4. Research Results

4.1. Reliability of Factors

Researchers look for Cronbach’s Alpha as a means of determining whether or not a scale is reliable, and they use the variable–total correlation coefficient to weed out irrelevant factors. The findings demonstrate that the Cronbach’s Alpha coefficients for each group of components range from [0.6–0.95]. This demonstrates how reliability is ensured by study data. The 15 observed variables all exhibit total variable correlation coefficients larger than 0.3, satisfying reliability standards and being eligible for additional study, according to the results of the total variable correlation coefficient analysis (Table 1).
In the process of approaching citizens to participate in the survey, there may have been some uncertainties. The level of public awareness is uneven. Citizens still face many challenges in accessing and contributing opinions for the implementation of smart city development due to inconsistent understanding (smart refers to the application of digital technology in management, operation, application, and implementation). Smart city development involves developing digital data infrastructure, digital technology, and digital transformation, which are essential measures that help “smarten” other technical and socio-economic infrastructures depending on the application of technology based on the approved general urban planning of Pleiku City.

4.2. Factors Influencing Smart Urban Construction

Instead of focusing on 15 individual factors that influence smart urban construction, this study examined four major groups of factors. Each of these large groups of factors exhibited correlations with small factors. This helps save time and funding when researching. The results in Table 2 show that the coefficient KMO = 0.895, so EFA is suitable for real data. Barlett’s test is valued at sig. = 0.001. As a result, we can see that the observed variables have a linear relationship with the representative factor, and thus the real data agree with the EFA analysis.

4.3. Factor Loading

Table 3 displays the evaluation results for the level of explanation of the observed variables in the model with the outcome factor. The independent variable’s total variance explained (TVE) is 67,547, so the EFA analysis meets the requirements. The data reveal that the model’s factors (variables) account for 67.547% of the change in the outcome factor. To be more precise, the study’s observed variables accounted for 67.547% of the variance in the factors impacting smart urban construction in Pleiku.
Table 4 displays the results of the rotation matrix that determined the factor loading. The results reveal that the original order does not apply to the four groups of factors with 15 observed variables. Every variable’s loading factor has a value > 0.5. Therefore, we can confirm the correlation between each factor and its component, indicating the practical significance of EFA analysis.
Thus, EFA exploratory factor analysis introduces all four groups of factors into regression analysis.

4.4. Multivariate Regression Analysis Determines the Influence of Factors on Smart Urban Construction

Regarding the multivariate regression analysis, the coefficient Sig. = 0.00 is displayed in Table 5. As a result, the independent variables impact the dependent variable (Y), making the regression model relevant. There is no multicollinearity in the research model because the VIF of every variable is less than 2. In Table 5, the coefficient (β) exhibits a positive value, signifying the significance of factor groups in the study model. This demonstrates that there is a linear relationship between each of the four sets of characteristics and the development of smart urban zones in Pleiku City.
The shape of the regression equation was ascertained from the standardized regression coefficient: Y = −0.038 + 0.238 × CS + 0.283 × NL + 0.190 × QH + 0.308 × TH + Ei.
The factors of the standardized regression coefficient can be converted to percentage form and sorted in order of priority from high to low as follows. The TH factor group has the greatest influence on smart urban construction in Pleiku City with a rate of 30.23%. Next is the NL factor group at 27.77%, followed by the CS factor group at 23.36%. Finally, there is the group of QH factors with a contribution rate of 18.65%.

5. Discussion

Building smart urban areas in Pleiku City contributes to improving people’s quality of life and streamlines urban management. This construction also aims to protect the environment and improve competitiveness with other urban areas. It ensures that all people enjoy convenient public services, enhances security, and promotes social order and safety. However, some reports have shown that building smart urban areas still faces some difficulties in Vietnam in general and Pleiku City in particular [51,52]. Planning and implementation issues are worth mentioning. The legal corridor lacks clarity, especially in procedures related to investment in and hiring of information technology services. Because there is no connection standard, data processing is difficult. Moreover, urban management has not yet caught up with the latest trends in urban development. The absence of landscape architecture management regulations and strict urban environmental management has hindered the implementation of technical infrastructure and urban space articulation. Research shows that 15 main factors play an important role in building smart cities. We divide these factors into four groups based on their importance: implementation organization, human resources, policy mechanism, and planning. The authors will delve deeper into the effects of these factor groups below.
The first aspect to consider is the connection between implementing organizations and the construction of smart cities. This implementation brings together smart solutions based on factors such as smart management, living, economy, environment, and technology. The ability to deploy the combination of these factors in the city space is a complex form of transformation and requires a certain rigor [53]. When combined, these factors will contribute to sustainable economic development and improve operational efficiency and quality of life in urban areas [54,55]. They also help improve interactions between city governments, businesses, and citizens [56]. Effective resource management and use helps minimize impacts on environmental issues.
Second, the study also highlights the relationship between human resources and smart cities. Technology is not the only factor that creates a smart city. More important is the role of human capital. In other words, human resources and education play an important role in building and developing smart cities [57]. Research reveals that Vietnam’s urban management staff lacks proper training [58]. Furthermore, awareness of urban management content is not unified, so smart urban management requires management staff to have high capacity and skills [59]. Smart cities always prioritize the human factor [60]. Smart cities are not solely shaped by advanced technology, but also by the innovative ways in which people apply this technology. It takes time to train high-quality human resources who can master technology, especially leaders, and elevate the intellectual level of urban residents.
Thirdly, government support and governance policies serve as the foundation for the implementation of smart city initiatives [61]. To enable smart city initiatives, policy institutions need to be transparent and strategic. Smarter governments will do more than just control the products of social and economic structures [62]. For mechanisms to promote growth, innovation, and advancement, they must establish connections with enterprises, communities, and citizens [63]. This not only gives citizens access to knowledge about decisions that impact their lives, but it also helps to manage resources more effectively. In Vietnam today, smart urban policies mainly prioritize solving urgent problems without paying attention to long-term orientations [64]. This can reduce the efficiency and sustainability of smart urban projects. At the same time, it also affects residents’ quality of life and ability to adapt to climate change.
Fourth, in this study, planning is the factor with the lowest impact on smart urban construction in Pleiku, but it is indispensable. A smart city cannot develop with patchy and ineffective planning. However, this is a significant issue that Vietnamese urban areas are currently grappling with [65]. Reality shows that most localities are focusing heavily on smart urban services without paying attention to the development of urban technical infrastructure [66]. If the Vietnamese government solely concentrates on the development of smart urban services, it will only address the surface of the urban development issue, failing to address the underlying issues. Vietnam must thoroughly resolve basic urban problems like traffic, environment, energy, waste, and flooding to lay the groundwork for implementing smart urban construction.

6. Conclusions and Policy Implications

The goal of building a smart urban area in Pleiku City is to foster comprehensive development, collaborate with the flower industry, and modernize in a sustainable manner. This study aims to understand some factors affecting the construction of smart urban areas in Pleiku City. The authors classify these influencing factors into four groups: policy mechanisms, human resources, planning, and implementation organizations. The results of this research can help make smart urban construction projects in Vietnam more feasible. The study utilizes data from a survey conducted among households in Pleiku City using a random sampling method. Next, SPSS software processes the data and determines the regression equation for the influencing factors. The analysis of influencing factors using the linear regression function confirms the acceptance of all research hypotheses in the theoretical model, resulting in a regression equation of the following form:
Based on the standardized regression coefficient, the factor groups are arranged in order of priority from high to low as follows. The group of organizational and implementation factors has the greatest influence on smart urban construction in Pleiku City with a rate of 30.23%. The human resource factor group has a rate of 27.77%, and the policy mechanism group has a rate of 23.36%. Finally, there is the group of planning factors with a contribution rate of 18.65%.
Based on the research results and discussion, the authors propose a few suggestions to improve the quality of smart urban construction in Pleiku City. Firstly, in terms of human resources, local authorities need to train and foster management staff to meet the requirements of implementing smart urban construction plans. This training should be based on the concentration of resources in the city’s education sector. Furthermore, local authorities must strengthen the inspection and supervision of content implementation within the responsibilities of officials and civil servants related to smart urban construction. The second solution involves financial issues. It is necessary to ensure that capital from the city budget is available for investment in technology development. For technology infrastructure projects, the city should also deploy information technology services. Third is the policy mechanism solution. It is necessary to propose policy mechanisms for implementing smart education plans. Regulations on building connection standards are needed to guarantee the sharing and integration of data with the city’s overall data. The fourth solution is about propaganda. It is also necessary to promote propaganda and mobilization efforts, creating consensus in society so that all people support and share responsibility for investing in urban infrastructure. Recognizing the urgency and importance of building and developing Pleiku City into a smart urban area is also one of the goals of this solution. The final and crucial solution involves effective planning. The government must expedite the process of finalizing the adjustments and preparations for the general planning of Pleiku City, aiming to complete it by 2030, while maintaining a long-term vision for 2050. In addition, the government should complete the technical infrastructure system of the old urban center in an open manner, with the goal of developing new urban areas within the existing urban areas, as this could contribute to a large social impact in the Central Highlands.

Author Contributions

Conceptualization, N.T.T. and T.D.V.; methodology, T.T.P.; software, T.T.P.; validation, T.T.P. and N.T.T.; formal analysis, T.T.P.; investigation, T.D.V.; resources, N.T.T.; data curation, T.T.P.; writing—original draft preparation, T.T.P.; writing—review and editing, N.T.T.; visualization, T.D.V.; supervision, T.D.V.; project administration, T.T.P.; funding acquisition, T.T.P. All authors have read and agreed to the published version of the manuscript.

Funding

This research received no external funding.

Data Availability Statement

Data are contained within the article.

Acknowledgments

To complete this research, the authors would like to thank the Pleiku City People’s Committee along with the households who supported the authors in collecting the research data.

Conflicts of Interest

The authors declare no conflicts of interest.

References

  1. UN. 68% of the World Population Projected to Live in Urban Areas by 2050, Says UN. 2018. Available online: https://www.un.org/uk/desa/68-world-population-projected-live-urban-areas-2050-says-un (accessed on 14 April 2024).
  2. Weber, H.; Sciubba, J.D. The Effect of Population Growth on the Environment: Evidence from European Regions. Eur. J. Popul. 2019, 35, 379–402. [Google Scholar] [CrossRef] [PubMed]
  3. Shammout, M.W.; Shatanawi, K.; Abualhaija, M.M. Influence of Population Growth on Supply, Demand, and Quality Issues of Water Resources in the Yarmouk River Basin in Jordan. J. Exp. Biol. Agric. Sci. 2023, 11, 171–178. [Google Scholar] [CrossRef]
  4. Tong, Q.; Qiu, F. Population growth and land development: Investigating the bi-directional interactions. Ecol. Econ. 2020, 169, 106505. [Google Scholar] [CrossRef]
  5. Avtar, R.; Tripathi, S.; Aggarwal, A.K.; Kumar, P. Population-Urbanization-Energy Nexus: A Review. Resources 2019, 8, 136. [Google Scholar] [CrossRef]
  6. Son, T.H.; Weedon, Z.; Yigitcanlar, T.; Sanchez, T.; Corchado, J.M.; Mehmood, R. Algorithmic urban planning for smart and sustainable development: Systematic review of the literature. Sustain. Cities Soc. 2023, 94, 104562. [Google Scholar] [CrossRef]
  7. Basiri, M.; Azim, A.Z.; Farrokhi, M. Smart City Solution for Sustainable Urban Development. Eur. J. Sustain. Dev. 2017, 6, 71–84. [Google Scholar] [CrossRef]
  8. Alawadhi, S.; Aldama-Nalda, A.; Chourabi, H.; Gil-Garcia, J.R.; Leung, S.; Mellouli, S.; Nam, T.; Pardo, T.A.; Scholl, H.J.; Walker, S. Building Understanding of Smart City Initiatives. In Electronic Government. EGOV 2012. Lecture Notes in Computer Science; Scholl, H.J., Janssen, M., Wimmer, M.A., Moe, C.E., Flak, L.S., Eds.; Springer: Berlin/Heidelberg, Germany, 2012; Volume 7443. [Google Scholar] [CrossRef]
  9. Zhu, J.; Gianoli, A.; Noori, N.; de Jong, M.; Edelenbos, J. How different can smart cities be? A typology of smart cities in China. Cities 2024, 149, 104992. [Google Scholar] [CrossRef]
  10. Albino, V.; Berardi, U.; Dangelico, R.M. Smart Cities: Definitions, Dimensions, Performance, and Initiatives. J. Urban Technol. 2015, 22, 3–21. [Google Scholar] [CrossRef]
  11. Jankowicz, B. The concept of smart city development in the context of the COVID-19 pandemic on the example of Kraków and Barcelona—Cities combining tradition with modernity. Geomat. Land Manag. Landsc. 2022, 4, 81–94. [Google Scholar] [CrossRef]
  12. Caragliu, A.; Del Bo, C.; Nijkamp, P. Smart Citites in Europe. J. Urban Technol. 2011, 18, 65–82. [Google Scholar] [CrossRef]
  13. Ullah, Z.; Al-Turjman, F.; Mostarda, L.; Gagliardi, R. Applications of Artificial Intelligence and Machine learning in smart cities. Comput. Commun. 2020, 154, 313–323. [Google Scholar] [CrossRef]
  14. Kozlowski, W.; Suwar, K. Smart City: Definitions, Dimensions, and Initiatives. Eur. Res. Stud. J. 2021, 24, 509–520. [Google Scholar] [CrossRef]
  15. Lee, J.; Babcock, J.; Pham, T.S.; Bui, T.H.; Kang, M. Smart city as a social transition towards inclusive development through technology: A tale of four smart cities. Int. J. Urban Sci. 2022, 27, 75–100. [Google Scholar] [CrossRef]
  16. Younes, M.B.; Aljunaedi, B.Z. Smart city and e-government components. Int. J. Eng. Technol. 2018, 7, 3941–3945. [Google Scholar] [CrossRef]
  17. Duan, V. Các đô thị Đóng Góp 70% GDP cả Nước (Urban Areas Contribute 70% of the Country’s GDP). Người lao động. 2022. Available online: https://nld.com.vn/thoi-su/cac-do-thi-dong-gop-70-gdp-ca-nuoc-20221130210204807.htm (accessed on 15 April 2024).
  18. Huong, D.T. Di cư và đô thị hóa tại Việt Nam—Góc nhìn từ những con số (Migration and Urbanization in Vietnam—A Perspective from the Numbers). Tạp chí con số sự kiện. 2023. Available online: https://consosukien.vn/di-cu-va-do-thi-hoa-tai-viet-nam-goc-nhin-tu-nhung-con-so.htm (accessed on 15 May 2024).
  19. Tuan, N.T. Measuring urban growth dynamics: A study in Hue city, Vietnam. Open Geosci. 2024, 16, 20220640. [Google Scholar] [CrossRef]
  20. Nguyen, T.C.; Nguyen, H.D.; Le, H.T.; Kanedo, S. Residents’ preferred measures and willingness-to-pay for improving urban air quality: A case study of Hanoi city, Vietnam. J. Econ. Dev. 2022, 24, 262–275. [Google Scholar] [CrossRef]
  21. Nga, N.Q.; Ly, C.T.K.; Hau, N.V.; Phuong, D.T.T. Building and Developing Smart Cities in Ho Chi Minh City, Vietnam—Current Situation and Solutions. Int. J. Relig. 2024, 5, 714–721. [Google Scholar] [CrossRef]
  22. Dung, N.T.K.; Phuong, N.T.L.; Minh, N.J.; Hung, N.H. Smart city management and development by applying technology. Sci. J. Archit. Constr. 2023, 51, 31–37. [Google Scholar]
  23. Viet Bach, K.H.; Kim, S.-K. Towards Evaluation the Cornerstone of Smart City Development: Case Study in Dalat City, Vietnam. Smart Cities 2019, 3, 1–16. [Google Scholar] [CrossRef]
  24. Thai, H.M.H.; Khuat, H.T.; Kim, H.M. Chapter 8—Urban form, the use of ICT and smart cities in Vietnam. In Smart Cities for Technological and Social Innovation: Case Studies, Current Trends, and Future Steps; Academic Press: Cambridge, MA, USA, 2021; pp. 137–156. [Google Scholar] [CrossRef]
  25. Thuat, P.T. Challenges and Solutions for Hanoi to Become a Smart City. Urban Reg. Plan. 2020, 5, 11–14. [Google Scholar] [CrossRef]
  26. Jiang, X.; Han, X.; Xue, L.; Yu, Z.; Wei, S.; Xu, H. How smart city building improved corporate performance: Empirical evidence of China’s a-share listed companies. Humanit. Soc. Sci. Commun. 2023, 10, 917. [Google Scholar] [CrossRef]
  27. Phuong, T.T.; Vien, T.D.; Son, C.T.; Thuy, D.T.; Duong, N.H.; Wolfgang, S. Analysing Factors Influencing Land Use Planning for Sustainable Land Resource Management in Vietnam: A Case Study of Dan Phuong District in Hanoi City. Sustainability 2023, 15, 16557. [Google Scholar] [CrossRef]
  28. Apanaviciene, R.; Shahrabani, M. Key Factors Affecting Smart Building Integration into Smart City: Technological Aspects. Smart Cities 2023, 6, 1832–1857. [Google Scholar] [CrossRef]
  29. Fan, H.; Zhang, N.; Su, H. The effects of smart city construction on urban green total factor productivity: Evidence from China. Econ. Res.—Ekon. Istraživanja 2023, 36, 2181840. [Google Scholar] [CrossRef]
  30. Meijer, A.; Bolívar, M. Governing the smart city: A review of the literature on smart urban governance. Int. Rev. Adm. Sci. 2016, 82, 392–408. [Google Scholar] [CrossRef]
  31. Tok, E.; McSparren, J.J.; Al Merekhi, M.; Elghaish, H.; Ali, F.M. Crafting smart cities in the Gulf region: A comparison of Masdar and Lusail. In Handbook of Research on Digital Media and Creative Technologies; Harrison, D., Ed.; IGI Global: Hershey, PA, USA, 2015; pp. 448–460. [Google Scholar] [CrossRef]
  32. Arroub, A.; Zahi, B.; Sabir, E.; Sadik, M. A literature review on Smart Cities: Paradigms, opportunities and open problems. In Proceedings of the 2016 International Conference on Wireless Networks and Mobile Communications (WINCOM), Fez, Morrocco, 26–29 October 2016; pp. 180–186. [Google Scholar] [CrossRef]
  33. Joshi, M.; Vaidya, A.; Deshmukh, M. Sustainable Transport Solutions for the Concept of Smart City. In Sustainable Energy and Transportation. Energy, Environment, and Sustainability; Gautam, A., De, S., Dhar, A., Gupta, J., Pandey, A., Eds.; Springer: Singapore, 2018. [Google Scholar] [CrossRef]
  34. Al Nuaimi, E.; Al Neyadi, H.; Mohamed, N.; Al-Jaroodi, J. Applications of big data to smart cities. J. Internet Serv. Appl. 2015, 6, 25. [Google Scholar] [CrossRef]
  35. Nam, P.P.; Phuong, T.T. Factors affecting commercial housing prices in Vietnam. Int. Hous. Mark. Anal. 2022, 15, 1019–1032. [Google Scholar] [CrossRef]
  36. Brauneis, R.; Goodman, E. Algorithmic transparency for the smart city. Yale J. Law Technol. 2018, 20, 103. [Google Scholar] [CrossRef]
  37. Cho, S.; Mossberger, K.; Swindell, D.; Selby, J. Experimenting with public engagement platforms in local government. Urban Aff. Rev. 2021, 57, 763–793. [Google Scholar] [CrossRef]
  38. Desouza, K.; Bhagwatwar, A. Citizen apps to solve complex urban problems. J. Urban Technol. 2012, 21, 25–50. [Google Scholar] [CrossRef]
  39. Li, L.; Taeihagh, A.; Tan, S.Y. What factors drive policy transfer in smart city development? Insights from a Delphi study. Sustain. Cities Soc. 2022, 84, 104008. [Google Scholar] [CrossRef]
  40. Wang, J.; Deng, K. Impact and mechanism analysis of smart city policy on urban innovation: Evidence from China. Econ. Anal. Policy 2022, 73, 574–587. [Google Scholar] [CrossRef]
  41. Song, M.; Xiao, Y.; Zhou, Y. How Does the Smart City Policy Influence Digital Infrastructure? Spatial Evidence from China. Land 2023, 12, 1381. [Google Scholar] [CrossRef]
  42. Lv, R.; Gao, H. Effects of smart city construction on employment: Mechanism and evidence from China. Empir. Econ. 2023, 65, 2393–2425. [Google Scholar] [CrossRef] [PubMed]
  43. Duvall, P.; Lennon, M.; Scott, M. The ‘natures’ of planning: Evolving conceptualizations of nature as expressed in urban planning theory and practice. Eur. Plan. Stud. 2018, 26, 480–501. [Google Scholar] [CrossRef]
  44. Adam, A.G. Systematic review of the changing land to people relationship and co-evolution of land administration. Heliyon 2023, 9, e20637. [Google Scholar] [CrossRef]
  45. Vernett, N.; Coste, A. Garden Cities of the 21st Century: A Sustainable Path to Suburban Reform. Urban Plan. 2017, 2, 45–60. [Google Scholar] [CrossRef]
  46. Rodríguez-Loza, J.-A.; Rosado, A.; Navas-Carrillo, D. Le Corbusier’s Urban Planning as a Cultural Legacy. Approach Case Chandigarh. Des. 2021, 5, 44. [Google Scholar] [CrossRef]
  47. Nieuwenhuijsen, M.J. New urban models for more sustainable, liveable and healthier cities post covid19; reducing air pollution, noise and heat island effects and increasing green space and physical activity. Environ. Int. 2021, 157, 106850. [Google Scholar] [CrossRef]
  48. Wang, J.; Li, G.; Lu, H.; Wu, Z. Urban models: Progress and perspective. Sustain. Futures 2024, 7, 100181. [Google Scholar] [CrossRef]
  49. Hashem, I.; Chang, V.; Anuar, N.; Adewole, K.; Yaqoob, I.; Gani, A.; Chiroma, H. The role of big data in smart city. Int. J. Inf. Manag. 2016, 36, 748–758. [Google Scholar] [CrossRef]
  50. Thuy, P. Tình hình kinh tế—Xã hội thành phố Pleiku năm 2023 (Socio-Economic Situation of Pleiku City in 2023). Cổng thông tin điện tử thành phố Pleiku, tỉnh Gia Lai. 2023. Available online: https://pleiku.gialai.gov.vn/chuyen-muc/Cong-tac-xay-dung-%C4%90ang-bo-thanh-pho/Tinh-hinh-kinh-te-xa-hoi-thanh-pho-Pleiku-nam-2023.aspx (accessed on 15 April 2024).
  51. Hoa, V. Smart city development faces challenges. Vietnam News, 2023. Available online: https://vietnamnews.vn/economy/1637259/smart-city-development-faces-challenges.html (accessed on 18 November 2024).
  52. Binh, T. Smart urban development in Vietnam facing lack of legal framework. Saigon Giai Phong News, 2023. Available online: https://en.sggp.org.vn/smart-urban-development-in-vietnam-facing-lack-of-legal-framework-post106635.html (accessed on 24 June 2024).
  53. Guenduez, A.A.; Mergel, I. The role of dynamic managerial capabilities and organizational readiness in smart city transformation. Cities 2022, 129, 103791. [Google Scholar] [CrossRef]
  54. Gracias, J.S.; Parnell, G.S.; Specking, E.; Pohl, E.A.; Buchanan, R. Smart Cities—A Structured Literature Review. Smart Cities 2023, 6, 1719–1743. [Google Scholar] [CrossRef]
  55. Yang, R.; Zhen, F. Smart city development Models: A cross-cultural regional analysis from theory to practice. Res. Glob. 2024, 8, 100221. [Google Scholar] [CrossRef]
  56. Saqib, M.; Zarine, R.; Noor, Z. The smart city imperatives—Achieving smart city and Sustainable future. J. Posit. Sch. Psychol. 2022, 6, 675–684. [Google Scholar]
  57. Ferraris, A.; Belyaeva, Z.; Bresciani, S. The role of universities in the Smart City innovation: Multistakeholder integration and engagement perspectives. J. Bus. Res. 2020, 119, 163–171. [Google Scholar] [CrossRef]
  58. Viet, T.Q. Education, Training, and the Quality of Vietnamese Public Servants. Educ. Adm. Theory Pract. 2024, 30, 1369–1375. [Google Scholar] [CrossRef]
  59. Michelucci, F.V.; Marco, A.D.; Tanda, A. Defining the Role of the Smart-City Manager: An Analysis of Responsibilities and Skills. J. Urban Technol. 2016, 23, 23–42. [Google Scholar] [CrossRef]
  60. Ahmad, K.; Maabreh, M.; Ghaly, M.; Khan, K.; Qadir, J.; Al-Fuqaha, A. Developing future human-centered smart cities: Critical analysis of smart city security, Data management, and Ethical challenges. Comput. Sci. Rev. 2022, 43, 100452. [Google Scholar] [CrossRef]
  61. Gohari, S.; Ahlers, D.; Nielsen, B.F.; Junker, E. The Governance Approach of Smart City Initiatives. Evidence from Trondheim, Bergen, and Bodø. Infrastructure 2020, 5, 31. [Google Scholar] [CrossRef]
  62. Pereira, G.V.; Parycek, P.; Falco, E.; Kleinhans, R. Smart governance in the context of smart cities: A literature review. Inf. Polity 2018, 23, 143–162. [Google Scholar] [CrossRef]
  63. Zhu, H.; Shen, L.; Ren, Y. How can smart city shape a happier life? The mechanism for developing a Happiness Driven Smart City. Sustain. Cities Soc. 2022, 80, 103791. [Google Scholar] [CrossRef]
  64. Tuong, N.T. Sustainable smart city construction in Da Nang city, Vietnam. Int. J. Mech. Eng. 2022, 7, 1737–1744. [Google Scholar]
  65. Lan, B.T.N. GIS in Smart urban planning and management: Lessons learned for Vietnam. Sci. J. Archit. Constr. 2023, 51, 94–100. [Google Scholar]
  66. Thuy, B. Vietnam Must Follow smart City Inclinations. Vietnam Investment Review. 2024. Available online: https://vir.com.vn/vietnam-must-follow-smart-city-inclinations-108789.html (accessed on 18 July 2024).
Figure 1. Some factors affecting the construction of smart cities. Source: Authors’ compilation and adopted from [27,30,31,32,36,39,40,44,45,46,47,48].
Urbansci 08 00232 g001
Figure 2. Research model. Notes: β: Standardized regression coefficient; VIF: Variance inflation factor; Sig.: Significance level; KMO: Kaiser–Meyer–Olkin. Source: Authors’ compilation, 2024.
Urbansci 08 00232 g002
Table 1. Reliability analysis.
No.FactorsCorrected Item–Total CorrelationCronbach’s Alpha
ICS 0.787
1CS10.5430.758
2CS20.6660.814
3CS30.6490.818
IINL 0.852
4NL10.5990.845
5NL20.6620.801
6NL30.6680.867
7NL40.4860.823
IIIQH 0.797
8QH10.4350.815
9QH20.4280.728
10QH30.5260.787
IVTH 0.825
11TH10.5930.753
12TH20.5310.748
13TH30.5660.835
14TH40.6360.802
15TH50.4580.867
Source: Authors’ calculations, 2024.
Table 2. KMO and Bartlett’s test.
No.TargetsValue
1KMO0.895
2Bartlett’s TestApprox. Chi-Square2542.248
Df200
Sig.0.001
Source: Authors’ calculations, 2024.
Table 3. TVE and eigenvalues.
FactorsEigenvaluesTVE
TotalVariance (%)Cumulative (%)TotalVariance (%)Cumulative (%)
18.486339.00439.0043.09212.36712.367
22.81512.93851.9433.06112.24624.612
31.7718.14060.0823.03412.13536.747
41.6247.46467.5472.97411.89548.642
51.2985.96673.512
61.125.14878.660
70.7673.52582.185
80.7373.38785.573
90.6583.02488.597
100.6282.88691.483
110.5922.72194.204
120.5572.56096.764
130.3031.39398.157
140.2160.99399.150
150.1850.850100.000
Source: Authors’ calculations, 2024.
Table 4. Rotated component matrix.
No.VariableComponents
1234
1TH10.805
2TH30.728
3TH20.697
4TH50.696
5TH40.688
6NL3 0.846
7NL2 0.807
8NL4 0.788
9NL1 0.780
10CS2 0.715
11CS1 0.692
12CS3 0.672
13QH1 0.783
14QH3 0.741
15QH2 0.722
Source: Authors’ calculations, 2024.
Table 5. Linear regression analysis.
Groups of FactorsβtMulticollinearity StatisticsInfluence Rate (%)Order of Influence
Sig.VIF
Constant−0.038−0.221
CS0.2383.4460.0011.61823.363
NL0.28350,1750.0001.38327.772
QH0.1903.7430.0001.40518.654
TH0.3086.0140.0001.26130.231
Source: Authors’ calculations, 2024.
Disclaimer/Publisher’s Note: The statements, opinions and data contained in all publications are solely those of the individual author(s) and contributor(s) and not of MDPI and/or the editor(s). MDPI and/or the editor(s) disclaim responsibility for any injury to people or property resulting from any ideas, methods, instructions or products referred to in the content.

