Article

Validating the Construct of Environmental Attitude in Urban Nepal Using the Two-Dimensional Model of Ecological Values

1
Department of Forestry and Environmental Technology, South-Eastern Finland University of Applied Sciences, 50100 Mikkeli, Finland
2
College of Education, The University of Arizona, Tucson, AZ 85721, USA
*
Author to whom correspondence should be addressed.
Urban Sci. 2024, 8(4), 231; https://doi.org/10.3390/urbansci8040231
Submission received: 2 November 2024 / Revised: 23 November 2024 / Accepted: 26 November 2024 / Published: 28 November 2024

Abstract

:
The Two-Dimensional Model of Ecological Values (2-MEV) explores the environmental values and attitudes of adolescents, typically 11–16 years old. The 2-MEV has two higher-order factors (values), Preservation and Utilisation, and primary factors (attitudes) under each value. The 2-MEV Scale has been validated in several industrialised countries, showing a negative but weak to moderate correlation between the two values. When in a previous study the scale was tested in rural Nepal, a non-industrialised country, the relationship between the two values was also negative but much stronger. The aim of the present study was to test this unusual relationship using the scale in urban Nepal. Five hundred forty-seven adolescents responded to the 25 items, which were reduced to 19 items after exploratory and confirmatory factor analyses. The model used in the urban setting resulted in a weak, negative corelation between the two values, which is similar to the structure that has been found in industrialised countries. However, the characteristics of environmental attitudes of adolescents in urban Nepal showed a strong similarity to the characteristics found in the previous study in rural Nepal. Therefore, the construct or structure of environmental attitude does not appear to be dependent on the socioeconomic status of a country/community. The results also showed slightly higher pro-environmental attitudes in adolescents in the urban community compared to the rural community of Nepal.

1. Introduction

The year 2019 saw more than 1.6 million school children and adolescents protesting as a part of the Climate Strike [1]. The focus of the strike was to raise awareness, express views, and pressure policy makers. The Climate Strike started in Stockholm but spiralled to other parts of Europe and the world soon after. The teenage demographic was mainly mobilised by the interest and expressions of peers who wanted to promote their future-oriented interest in environmental protection [1]. The result was a protest series named Fridays for Future (FFF). Spiralling from the urban centres of Europe to North America and then to developing nations, the official record of FFF shows the highest number of protest events were in Europe (86) followed by Asia (67), North America (65), Africa (59), Central and South America (14), and Australia/New Zealand (10) [2]. However, the unrecorded FFF-motivated events in developing countries are estimated to be even higher. In the case of Europe, 45% of the participants were in the 14–19 age group [1]. The FFF series clearly demonstrates the interest, expression, and viewpoint of adolescents toward environmental protection with a specific focus on climate change. In the European context, almost all participants agreed that politicians must fulfil promises to stop global warming, but 49.1% of the participants believed the demonstrations of FFF will not be enough to accomplish that goal [1]. Although the FFF participants do not represent children’s and adolescents’ voices from all urban regions, the observations hint at the strong concern that adolescents have about the climate crisis and their desire for change in environmental behaviours and policies.
One of the substantial predictors of behaviour is attitude, as reported initially by Ajzen and Fishbein [3]. Their systematic review of 109 studies highlights that the relationship between attitude and behaviour strengthens when there is an alignment between the target (what the trait is about) and action (the actual behaviour) [3]. For example, dealing with attitudes about wildfire in a population is more relevant when the proximal environment is prone to wildfires. In addition, recent bodies of work also verify environmental attitudes as major indicators of environmental behaviour [4,5,6]. A meta-analysis of variables from environmental psychology studies from 1971 to 1987 showed that attitude is a crucial variable influencing behaviour [7]. A continuation of this meta-analysis comprising studies from 1995 to 2006 reported self-interest and pro-social motivation (attitude is one of the factors) as an indicators of pro-environmental behaviour [8]. Furthermore, recent studies have demonstrated the relationship between attitude and behaviour when moderated by environmental knowledge [9,10]. Roczen, et al. [10] show that pro-environmental behaviour is most strongly influenced by attitude toward nature, followed by action-related knowledge. The knowledge–attitude–behaviour relationship regarding environmental concerns has been demonstrated in different socioeconomic and geographic settings [4,10].
In tandem with the urban adolescent’s demand for pro-environmental behaviour, the natural and built features of the urban environment also highlight the policy and behavioural traits that are known to influence adolescents’ mental and physical wellbeing [1,11]. The planning of urban regions emerged to address sanitary issues, but the increasing population places great importance on the social and physical construction of a place, which determines the environmental conditions [11,12]. These conditions drive the target–action relevance of environmental attitude and behaviour. The United Nations reported that more than 55% of the world’s population was living in urban areas in 2018, out of which 27% were children [13]. The urbanites’ proportion was 30% in 1950, and it is estimated to reach around 68% by 2050 [13]. Moreover, urban environmental pollution is associated with children’s human rights violation as per the United Nations Convention on the Rights of the Child. The United Nations define children as anyone below 18 years old [12,14]. The World Health Organization defines adolescents as 10–19 years old, and the same term “adolescents” is used in this study to refer to the study population [15]. These interrelations between the urban environment, adolescents, and environmental behaviour associated with environmental attitude direct this study to explore the environmental attitudes of adolescents living in urban centres in Nepal.
Attitude toward the environment is an important psychometric construct that uses traits and behaviours to understand one’s pro-environmental behaviour level [5]. Over the years, the construct of attitude toward the environment has been shown to consist of utilitarian and preservative values [5,16,17,18]. In general, preservative environmental attitudes suggest altruistic/appreciative–preservative behaviours, while utilitarian environmental attitudes suggest egoistic–utilitarian behaviours [16,17,18]. Early examination of environmental attitude (hereafter, attitude) relied on a one-dimensional construct [9], ranging from an ecocentric worldview to an anthropocentric worldview, including, for example, the New Environmental Paradigm [19]. Later, new hypotheses and testing of more dimensions of attitude followed [20,21]. Building onto the bi-dimensional construct proposed by Byrne [21], a new series of tests and means of verifying environmental attitude’s multi-dimensional constructs started in Western Europe.
Bogner and colleagues extended the new tests of attitude in the late 1990s and the early 2000s to propose a Two-Dimensional Model of Ecological Values (2-MEV) [22,23,24]. They verified two higher-order factors named Preservation and Utilisation. The higher-order factors have a set of primary factors, with three under Preservation and two under Utilisation [25]. The higher-order factors are values (traits), while the primary factors are attitudes (types of traits) [22,23,24,25]. Examples of attitudes are Intent to Support Environmental Protection, Enjoying Nature, and Care with Resources for the value of Preservation, and Altering Nature and Human Dominance for the value of Utilisation [25]. Interestingly, the initial 2-MEV studies reported a lack of strong correlations between two values, which Bogner and colleagues interpret as evidence that a person can hold both of the values at the same time. This contrasts with earlier attitude scales, as mentioned earlier, which were one-dimensional. These findings reflect the discussion around sustainable development, which stresses development using natural resources for today without destroying them for tomorrow [26]. Here, the goal is to work together with Preservation and Utilisation, and the 2-MEV Scale captures both.
The 2-MEV Scale, which is a scale of items (a questionnaire), has been tested and validated in different (both rural and urban) socioeconomic and geographic settings using revised or new items to fit the local context, including Germany [27], Belgium [28], New Zealand [5], and the United States [16]. For example, in many lower-income areas, asking about supporting environmental causes by donating money might not be appropriate; in this case, the item is modified to volunteering to support the environment to be more contextual. Here, being contextual increases correspondence between target and action elements to investigate attitude’s ability to predict behaviour [3]. In previous studies, there were weak to moderate negative correlations between the higher-order factors of Preservation and Utilisation. The theoretical construct of 2-MEV has also been cross-validated to rule out possible discrepancies by Milfont and Duckitt [29], who examined the orthogonal dimensions of environmental values, the unbalanced distribution of attitudes under values, the bias of probability of traits, and the deduction of primary factors from greater to smaller numbers. Milfont and Duckitt [29] confirmed the validity of the 2-MEV Scale’s construct, as did an eight-year longitudinal study conducted in the United States by Bogner et al. [17]. Major advantages of the 2-MEV Scale include its flexibility regarding the use of items in the scale that fit the local context and the use of multiple dimensions of attitude, contributing to the higher-order factors.
The question remains whether this two-dimensional construct and the 2-MEV Scale are relevant in non-industrialised communities compared to earlier applications in Western Europe, New Zealand, and the United States. Milfont and Duckitt [29] hypothesised that due to economic conditions, the relationship between Preservation and Utilisation in non-industrialised communities could be non-negative or opposite to what is being observed in industrialised communities. Regmi et al. [18] modified the 2-MEV Scale for use with adolescents in rural Nepal and found the same two value dimensions, Preservation and Utilisation. Rural Nepal represents a non-industrialised community with a different socioeconomic situation compared to traditional 2-MEV test locations. While most previous studies of the 2-MEV Scale have found a weak to moderate negative correlation between Preservation and Utilisation ranging from −0.1 to −0.45 [16,24], Regmi, et al. [18] found that the negative relationship between Preservation and Utilisation was much stronger, with a correlation coefficient of −0.93. In the only other study to find a similarly strong negative correlation (−0.72), the authors, Milfont and Duckitt [29], attribute this result to the negative wording of some of the items; that was clearly not the case in rural Nepal. Regmi and colleagues suggest that it could reflect environmental attitudes in rural areas in a developing country. Attitudes in industrialised countries indicate that people can possess both preservative and utilitarian values at the same time, while in rural Nepal’s study, people seem to hold either one of those values but not both.
The construct of environmental attitude in industrialised nations is clearly different than that of Nepal’s rural community. Nepal is a non-industrialised and least-developed nation [30]. The unusual result found in rural Nepal has raised a question regarding whether this difference is due to the non-industrialisation of the community, as hypothesised by Mifont and Duckitt [29], or not. To address this problem, the present study was designed to further investigate this relationship within one non-industrialised country, Nepal, through use of the 2-MEV in urban areas of the country. Against this background, the objective of this study is to examine the nature of environmental values in urban areas of a non-industrialised country to determine the construct of environmental attitude using the 2-MEV Scale. This will help to highlight the impact of the socioeconomic background (urban and rural) of a non-industrialised region in the construct of environmental attitude.
Mostly, the 2-MEV Scale has been applied to explore and test the construct of environmental attitude’s relationship with environmental behaviour, perception, and educational programs [9,31]. By focusing on the impact of an urban setting on the construct of environmental attitudes in a yet to be tested region, while comparing the findings with a previous rural setting study using 2-MEV, this study adds a different perspective on the socioeconomic and geographic context of environmental attitudes. Moreover, urban areas across the world are growing rapidly [13]. Those interested in issues related to urban life identify education as a critical issue to address the environmental crises we face, and environmental attitude is a key construct to be included in such education [9,10,32]. This sort of education, however, is sadly lacking in most urban areas [6,32,33,34]. Advocates for including environmental attitude as a part of a solution to environmental crises must be found not just among educators but also from others who address different aspects of urban life. In the context of Nepal, urban areas are defined as municipalities or metropolitan cities and rural areas as rural municipalities. The classification is performed based on the population ceiling, land area, cultural density, geographic accessibility, natural resources, institutional infrastructure, and income/expenditure per year [35]. Currently, there are 293 municipalities/metropolitan cities and 460 rural municipalities in Nepal [35]. In the global context, similar parameters are used to determine the classification of urban or rural areas, which are specifically based on the population and housing density [36,37,38].
The structure of this paper follows a standard format, with an introduction including the literature, the problem statement, and the objective, followed by the methodology, which includes details regarding the study site and the study processes. Based on the objective and the methodology, the results are presented and then compared with the literature in the discussion, and the final section includes the main findings of the study related to the objective of the study.

2. Methods

The study objective is addressed by following the standard process and analysis practice of previous 2-MEV models and environmental value and attitude studies [5,16,23,25,27,29,31,39]. The steps of the used method are summarised below, and they are elaborated in the sub-sections of this Methods section.
(a)
Development of the scale: The scale was formulated by utilising previously used and validated 2-MEV Scale items to represent the study site and the population.
(b)
Administration of the scale: Participants completed the survey, keeping in mind that the validation of the scale requires at least 400 survey participants.
(c)
Testing the structure: Survey data were randomly divided in half; the first half was used for the exploratory factor analysis, and the second half was used for the confirmatory factor analysis.
(d)
Confirmation of the structure: The results of both factor analyses confirmed the final construct of environmental values and attitudes, along with valid items to use in the scale.
(e)
Analyses of the data: Considering only the valid items, the descriptive statistics and the analysis of variance were performed to analyse the data.
(f)
Interpretation of the results: The interpretation was performed based on the correlation of environmental attitudes, including the descriptive statistics and the analysis of variance of attitude scores.

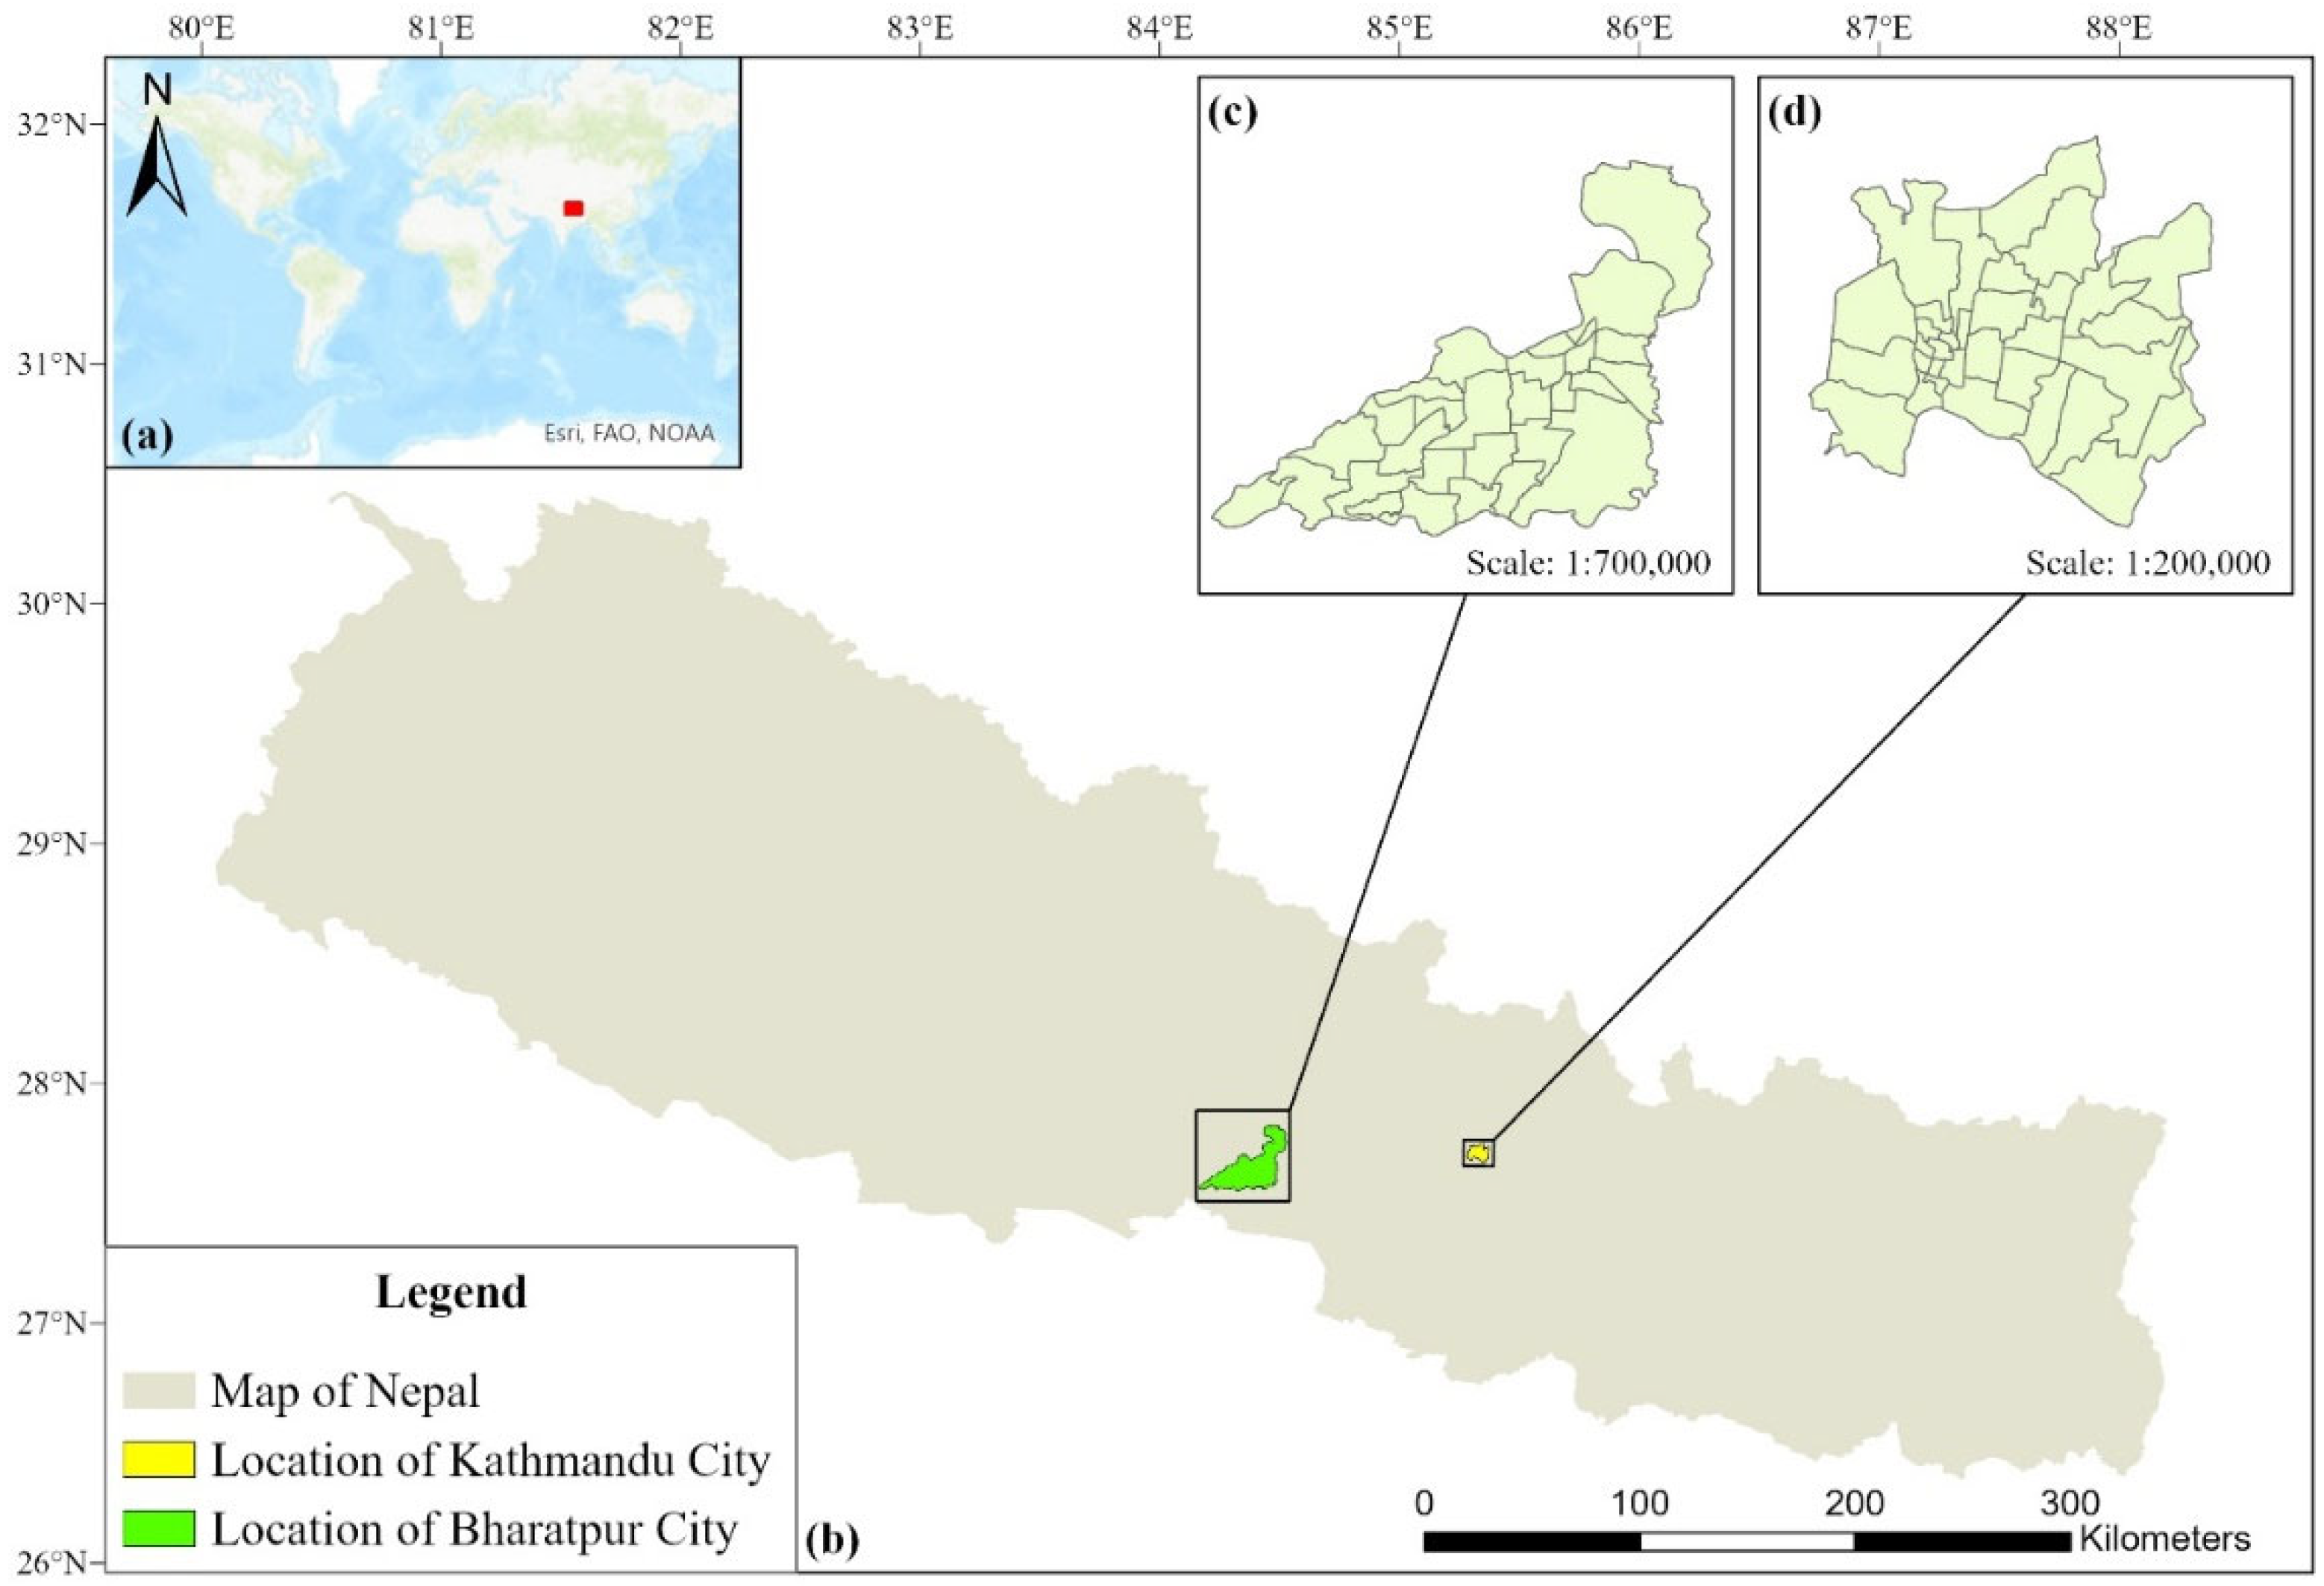
2.1. Study Design and Participants

The study site includes urban areas of Nepal, specifically the cities of Kathmandu and Bharatpur. Kathmandu is the major urban centre of Nepal and the capital city of the country. Bharatpur is a comparatively new city in the central–south part of the country. More than 80% of the study samples were from Kathmandu, making it the focus urban area in this study. Kathmandu is the largest city and Bharatpur is the fifth largest city in Nepal based on population [40]. Kathmandu and Bharatpur were declared metropolitan cities in 1995 and 2017, respectively [41,42]. Figure 1 shows the location of the study site in Nepal.
Participants were school-going adolescents of Kathmandu and Bharatpur. The responses were collected between May 2020 and December 2021 amidst the COVID-19 pandemic. Therefore, the survey used Google forms and was distributed to schools that were selected based on the socioeconomic background of the student population. Approximately 85% of the total population in the capital city are lower- and upper-middle-income populations with income ranges of NPR 13,000 to 30,000 and NPR 30,000 to 60,000, respectively (NPR 134 = USD 1 as of 23 October 2024) [43]. For higher sample representativeness, the schools with middle-income students were selected. Out of the total schools in Nepal, 18.9% are private schools, but in the context of Kathmandu, the share of private schools is 73% [44,45]. The high proportion of private schools in Kathmandu clearly shows the importance of private schools, which are the primary preference for schooling for the middle-income population of cities of Nepal [44]. Therefore, private schools were selected as sample schools in this study, which represent the wider adolescent population of urban Nepal. In addition to private schools, there are also public schools, which are mostly associated with lower-income populations, and expensive private schools associated with higher-income populations, which were not included in this study [44,45,46]. The private schools were randomly selected based on their willingness to volunteer for this study. The education provided in private schools follows the national curriculum and is uniform throughout the country [46].
The threshold number of participants in the study was determined by the requirements of the study method along with the availability of the respondents from suitable schools, as per the criteria elaborated above. Firstly, the methods utilised in the study were the following. Exploratory factor analysis and confirmatory factor analysis provided the best result with sample sizes of at least 200 [16]. Secondly, exploratory factor analysis requires 3–20 respondents per survey item to ensure the analysis’s validity [25]. After providing information about the study to various schools meeting the criteria above, 21 schools volunteered with their students to complete the survey. Our goal was to survey at least 500 participants to allow us to split the data in half (randomly), with one half for exploratory factory analysis and the other half for confirmatory factor analysis, elaborated in detail in Section 2.4. A total of 547 students responded, with 10.96 respondents per item for the exploratory factor analysis part. Compared to 63,700 adolescents between the ages of 10 and 19 in Kathmandu (41.25% female) and 31,242 in Bharatpur (55.07% female), the sample of 547 does not significantly represent the total population [47]. However, addressing the total population is beyond the scope of this study, and the method’s threshold is also met to explore for the first time the urban adolescent population’s environmental values and attitudes in Nepal, a non-industrialised country, to meet the study objectives.
A total of 547 students from 21 different schools responded to the survey. One student was 19 years old and one student was 11 years old, thirteen were 17 years old, and the rest were between 12 and 16 (mean age 14.7 ± 1.03 standard deviation). The typical age group for the 2-MEV Scale is 11 to 16 years old [22]. Most of the respondents were students from grades 8, 9, and 10, while one each were from grades 6 and 7, and eight were from grade 11. Out of the total students, 47.35% were female. Of the 547 students, 104 were from one private school in Bharatpur city. The students from Bharatpur were between grades 8 and 10 and aged between 12 and 17 years (mean age 14.4 ± 1.04 standard deviation), and 53.8% were female students. All 547 students completed the scale survey, and the data are available as a reference material [48]. Data privacy assurance was provided and agreed to by the respondents, and the schools’ details cannot be published.

2.2. 2-MEV Scale for Urban Nepal

The 2-MEV Scale provided a standard scale to analyse attitude, with flexibility regarding modification of items to match the local context [16,31]. The multi-dimensional continuum, allowing for different attitudes to contribute to the values of Preservation and Utilisation, is a major advantage because it allows for exploration of the dimensions while addressing the contemporary questions of measuring environmental attitude [16,24,27]. Specifically, Bogner [34] showed in a study of 289 Irish students that attitude could also include another dimension named Appreciation. Typically, Appreciation is a part of Preservation, and it showed positive correlation with Preservation, but a specific focus on Appreciation as a different dimension highlights the need for pedagogical intervention using appreciative content rather than negative content. Furthermore, the flexibility regarding the number of dimensions in the 2-MEV was again demonstrated [39].
Versions of the 2-MEV exist for urban and rural centres of industrialised nations and only for rural Nepal. Moreover, the items inside of the scale must consider cognitive, affective, enactive, and behavioural values while focusing on the correspondence between action and target of the respondents [3,31]. The items developed for rural Nepal meet these conditions, as elaborated by Regmi et al. [18], and they match with the socioeconomic and educational background of the current study site. Likewise, the study objective is to explore the nature of environmental attitudes in urban Nepal to understand their differences compared to the previous study in rural Nepal, which is not in alignment with the earlier findings of 2-MEV. Therefore, for the comparison of rural and urban Nepal, scales using the same items are justifiable. However, not all items from rural Nepal match the context of urban Nepal. To address this, items used in previous urban-based 2-MEV Scales suitable for urban Nepal’s context were used from the sources cited in Table 1. No items were created for the sole purpose of this study, and only previously validated contextual items were used. The items were firstly used to test and then validate the scale to determine attitude’s construct. The items used for the 2-MEV Scale (referred to as the scale henceforth) for urban Nepal are listed in Table 1.
The 2-MEV Scale for urban Nepal as shown in Table 1 includes items related to Preservation, Appreciation, and Utilisation determined from source scales and the theme of the items as well as findings of a previous 2-MEV Scale [34]. Traditionally, Appreciation has been part of Preservation; thus, the question persists as to whether in urban Nepal Appreciation is a different dimension or if it fits within Preservation, as was the case in rural Nepal [18].
As mentioned above, the items listed in Table 1 were adopted from the previous 2-MEV studies conducted in Western Europe, the United States, Mexico, Ireland, and rural Nepal. Considering items from rural Nepal (for example, 2, 3, 17, and 18) was also important because they highlight the socioeconomic and environmental context of Nepal. Regarding items 2 and 3, afforestation and cleaning campaigns are common activities in school curricula. Likewise, items 17 and 18 are visible examples in the environment of Nepal and highly discussed issues in the school curriculum [18]. Originally, in the rural Nepal study, items 17 and 18 were worded as preservation items. Interestingly, the students responded in a negative manner, forcing the items to load in the Utilisation value with negative principal component loadings. Therefore, these items were converted to Utilitarian items, which was later verified through confirmatory factor analysis [18]. The same version was used in this study because the education curriculum and the environmental reality in rural and urban areas are similar in the context of these items. Overall, all 25 items reflect behavioural values with a focus on the action, target, and context of the respondents.

2.3. Translation and Procedure

The flexibility of this scale is highly associated with adapting to the local context, and this not only means the nature of the items but also the language of items. Currently, the 2-MEV Scale has been used in more than 30 different languages worldwide [34]. In addition to the usage of Nepal-related scale items, the items were translated to the Nepali language. The Nepali language is written in the Devanagari script, and it is the official as well as the most widely used language in Nepal. The details of the rural Nepal 2-MEV Scale’s translation to the Nepali language were explained by Regmi et al. [18], and the same process was adopted in this study for the translation of the urban Nepal 2-MEV Scale. The major focus was not losing the essence of the items and translation with an emphasis on literal meaning as well as cultural applicability. In general, a conventional procedure of translation including back-translation was performed. The scale was first translated to Nepali from English, and then the item was back-translated to English and compared with the original item. The translation and back-translation processes involved different experts from a similar field of scientific enquiry as that described by Regmi et al. [18]. Moreover, the translated items were cross-verified with the teachers from the sample schools selected for this study.
Responses were collected through a worded Likert-type scale because this was simpler for the respondent students to understand than a numerical Likert scale [49]. The same worded responses were also used in the rural Nepal study. In addition to the five options of a Likert scale, a sixth option, “Did not understand/do not know”, was also used to omit any forced response to the items. The data were cleaned by removing incomplete or invalid responses. For example, there was a response from a Bachelor’s-level student, and another respondent input their grade and age as 1. Likewise, the responses with the sixth option “Did not understand/do not know” were left as blank so that they did not influence the analyses.

2.4. Data Analyses

The analysis process followed a traditional 2-MEV Scale methodology, starting with an exploratory factor analysis (EFA) and followed by a confirmatory factor analysis (CFA) to finalise the scale [16,18,27,29]. EFA and CFA are common methods for analysing the structure of environmental attitude [24,29,31]. Our decision to use both draws on several important studies associated with the 2-MEV model and environmental psychometric studies [23,27,29]. This allows for initial analysis with the EFA, which is more commonly used, with a randomly selected half of the dataset, followed by confirming the emerging structure with the CFA [16,25]. This is promoted by some as a best practice for factor analyses [23,24,27,29,31].
The total of 547 responses was randomly split into two parts (274 responses in random sample 1 and 273 responses in random sample 2) [16]. Random sample 1 was used for the EFA, and random sample 2 was used for the CFA. EFA was used to explore and identify the number of factors influencing the variables and which variables (or items) were related to each other and could be grouped under one factor. For the EFA, Principal Axis Factoring (PAF) was used. PAF is a factor extraction method for EFA, and it is used when it is likely that all variables relate to each other [50]. In other words, it is used when there is a high likelihood of correlation between the items. The PAF estimates the best fit of items and separates them into factors while considering the latent variables, which are unobservable direct impacts of the items in its factors [51]. The validity of items for PAF was determined by cross-validating the recommended items’ determinant score of correlation matrix (>0.00001) to ensure the absence of multicollinearity and then performing Bartlett’s Test of Sphericity (<0.05) and using the Kaiser Meyen Olkin Measure (KMO) (>0.5) [50]. After completing this validity test, the factor rotation and the eigen value of unity were utilised to interpret the number of factors. The rotation of factors is important because in this process each item is tested repeatedly to determine whether it fits on the first factor, the second factor, or the third. Based on these iterative tests, the highest factor loading of the item is determined [50]. The higher the factor loading of an item, the stronger its association with the factor. In this study, we used Direct Oblimin rotation for PAF because it reduces a larger dataset to a simpler structure. Furthermore, Direct Oblimin is an Oblique rotation method, which is used when the variables are correlated with each other [50]. The details regarding the number of factors are elaborated in the Section 3.1. The PAF calculation was performed using SPSS software (version 26).
Based on the results of the PAF, items with low factor loadings and items that did not load under any factors were removed. After this process, a CFA was conducted using the remaining items. The CFA was used to confirm whether the variables or items fit under the hypothesised factors based on the indices of goodness of fit [29], elaborated in Section 3.2. The CFA also considers underlying latent variables because it is also a factor analysis method, and it tests its relationship with observed indicators [51]. The end goal of the CFA is to finalise a model using a set of variables or items based on the observed data. The confirmed model consists of the verified number and set of items for the urban Nepal scale. Moreover, the final CFA model also validates the construct of environmental attitude, whether it is a bi-dimensional construct or more than two dimensions, in this study of adolescents in urban Nepal. The CFA was calculated using the AMOS extension of SPSS software (version 26). Finally, based on the validated set of items, a descriptive analysis of environmental attitudes and values using all 547 responses of the urban population was conducted.

3. Results

3.1. Explorative Factor Analysis (EFA)

EFA was conducted with a randomly selected half of the total responses. The first EFA was unconstrained as to the number of factors, with an eigen value of 1 set to determine the number. The EFA cross-validation met the recommended values of 0.001 for the correlation matrix determinant score. Bartlett’s Test of Sphericity value was significant at 0.00, and the KMO was 0.723. Eight factors emerged from Oblimin rotation with Kaiser normalisation, accounting for 61.4% of the variance. Examination of the item loadings revealed that several of the factors contained only one or two items. The first factor contained 14 items, consisting of both Preservation and Appreciation items, although 2 of the items also loaded similarly on factor three and 2 other items on factor four. The second factor consisted of five Utilisation items. Two Preservation items and one Utilisation item did not fit strongly into any of the eight factors, while three Utilisation items only fit strongly in one factor, and each was the only item in that factor. These results indicate that five of the nine Utilisation items fit well together in one factor. Preservation and Appreciation items were mixed in factors one and three, raising the question as to whether the items are measuring one or two values.
To investigate these findings further, three more EFAs were conducted, constrained to two, three, and four factors. The detailed factor loadings of unconstrained EFA and constrained EFAs with two, three, and four factors are presented in Table 2. The factor loadings below ±0.32 were suppressed, as in the rural Nepal study. The names of attitudes (primary factors) from the original 2-MEV study, including Intent to Support (I), Care with Resources (C), and Enjoyment of Nature (which is Appreciation), are contributing to the value Preservation [23]. In Table 2, these names of the attitudes are used to mark where the Preservation- and Appreciation-related items load in the constrained three- and four-factored EFA.
The two-factor EFA accounted for 28.9% of variance, which was substantially lower than the original EFA. Factor one contained the same 14 Preservation and Appreciation items that were found in factor one in the unconstrained EFA, and factor two consisted of the same 5 Utilisation items as in the unconstrained EFA. To further investigate whether the Preservation and Appreciation items should be considered as one or more factors, an EFA constrained to three factors was conducted, accounting for 35.7% of variance. While five of the eight Preservation items load only on factor one, three others also loaded strongly on factor three. Two of the eight Appreciation items loaded only onto factor three, but three others loaded onto both factors one and three. The other three Appreciation items did not load strongly onto any of the three factors.
The EFAs were not conclusive regarding whether Preservation and Appreciation should be considered as separate values as in one of the latest models of the 2-MEV [34] or whether they should be considered together as the value of Preservation, as in the earlier models of the 2-MEV [16,18]. This was a question to be answered through the confirmatory factor analyses. However, the constrained two factors show that the items intended for Preservation and Appreciation fall under the Preservation value, and all of the items intended for Utilisation fall under that value.
In the EFAs, some items consistently did not fall into any of the factors, indicating that participant responses to these items differed from their responses to other items. Participants might have perceived the items differently and therefore responded in ways that did not match how they responded to other items that were intended to tap into the same ideas; it might also be that the items were not understood by participants. While the EFAs were inconclusive, they provided valuable information about items that should be eliminated from further analyses.

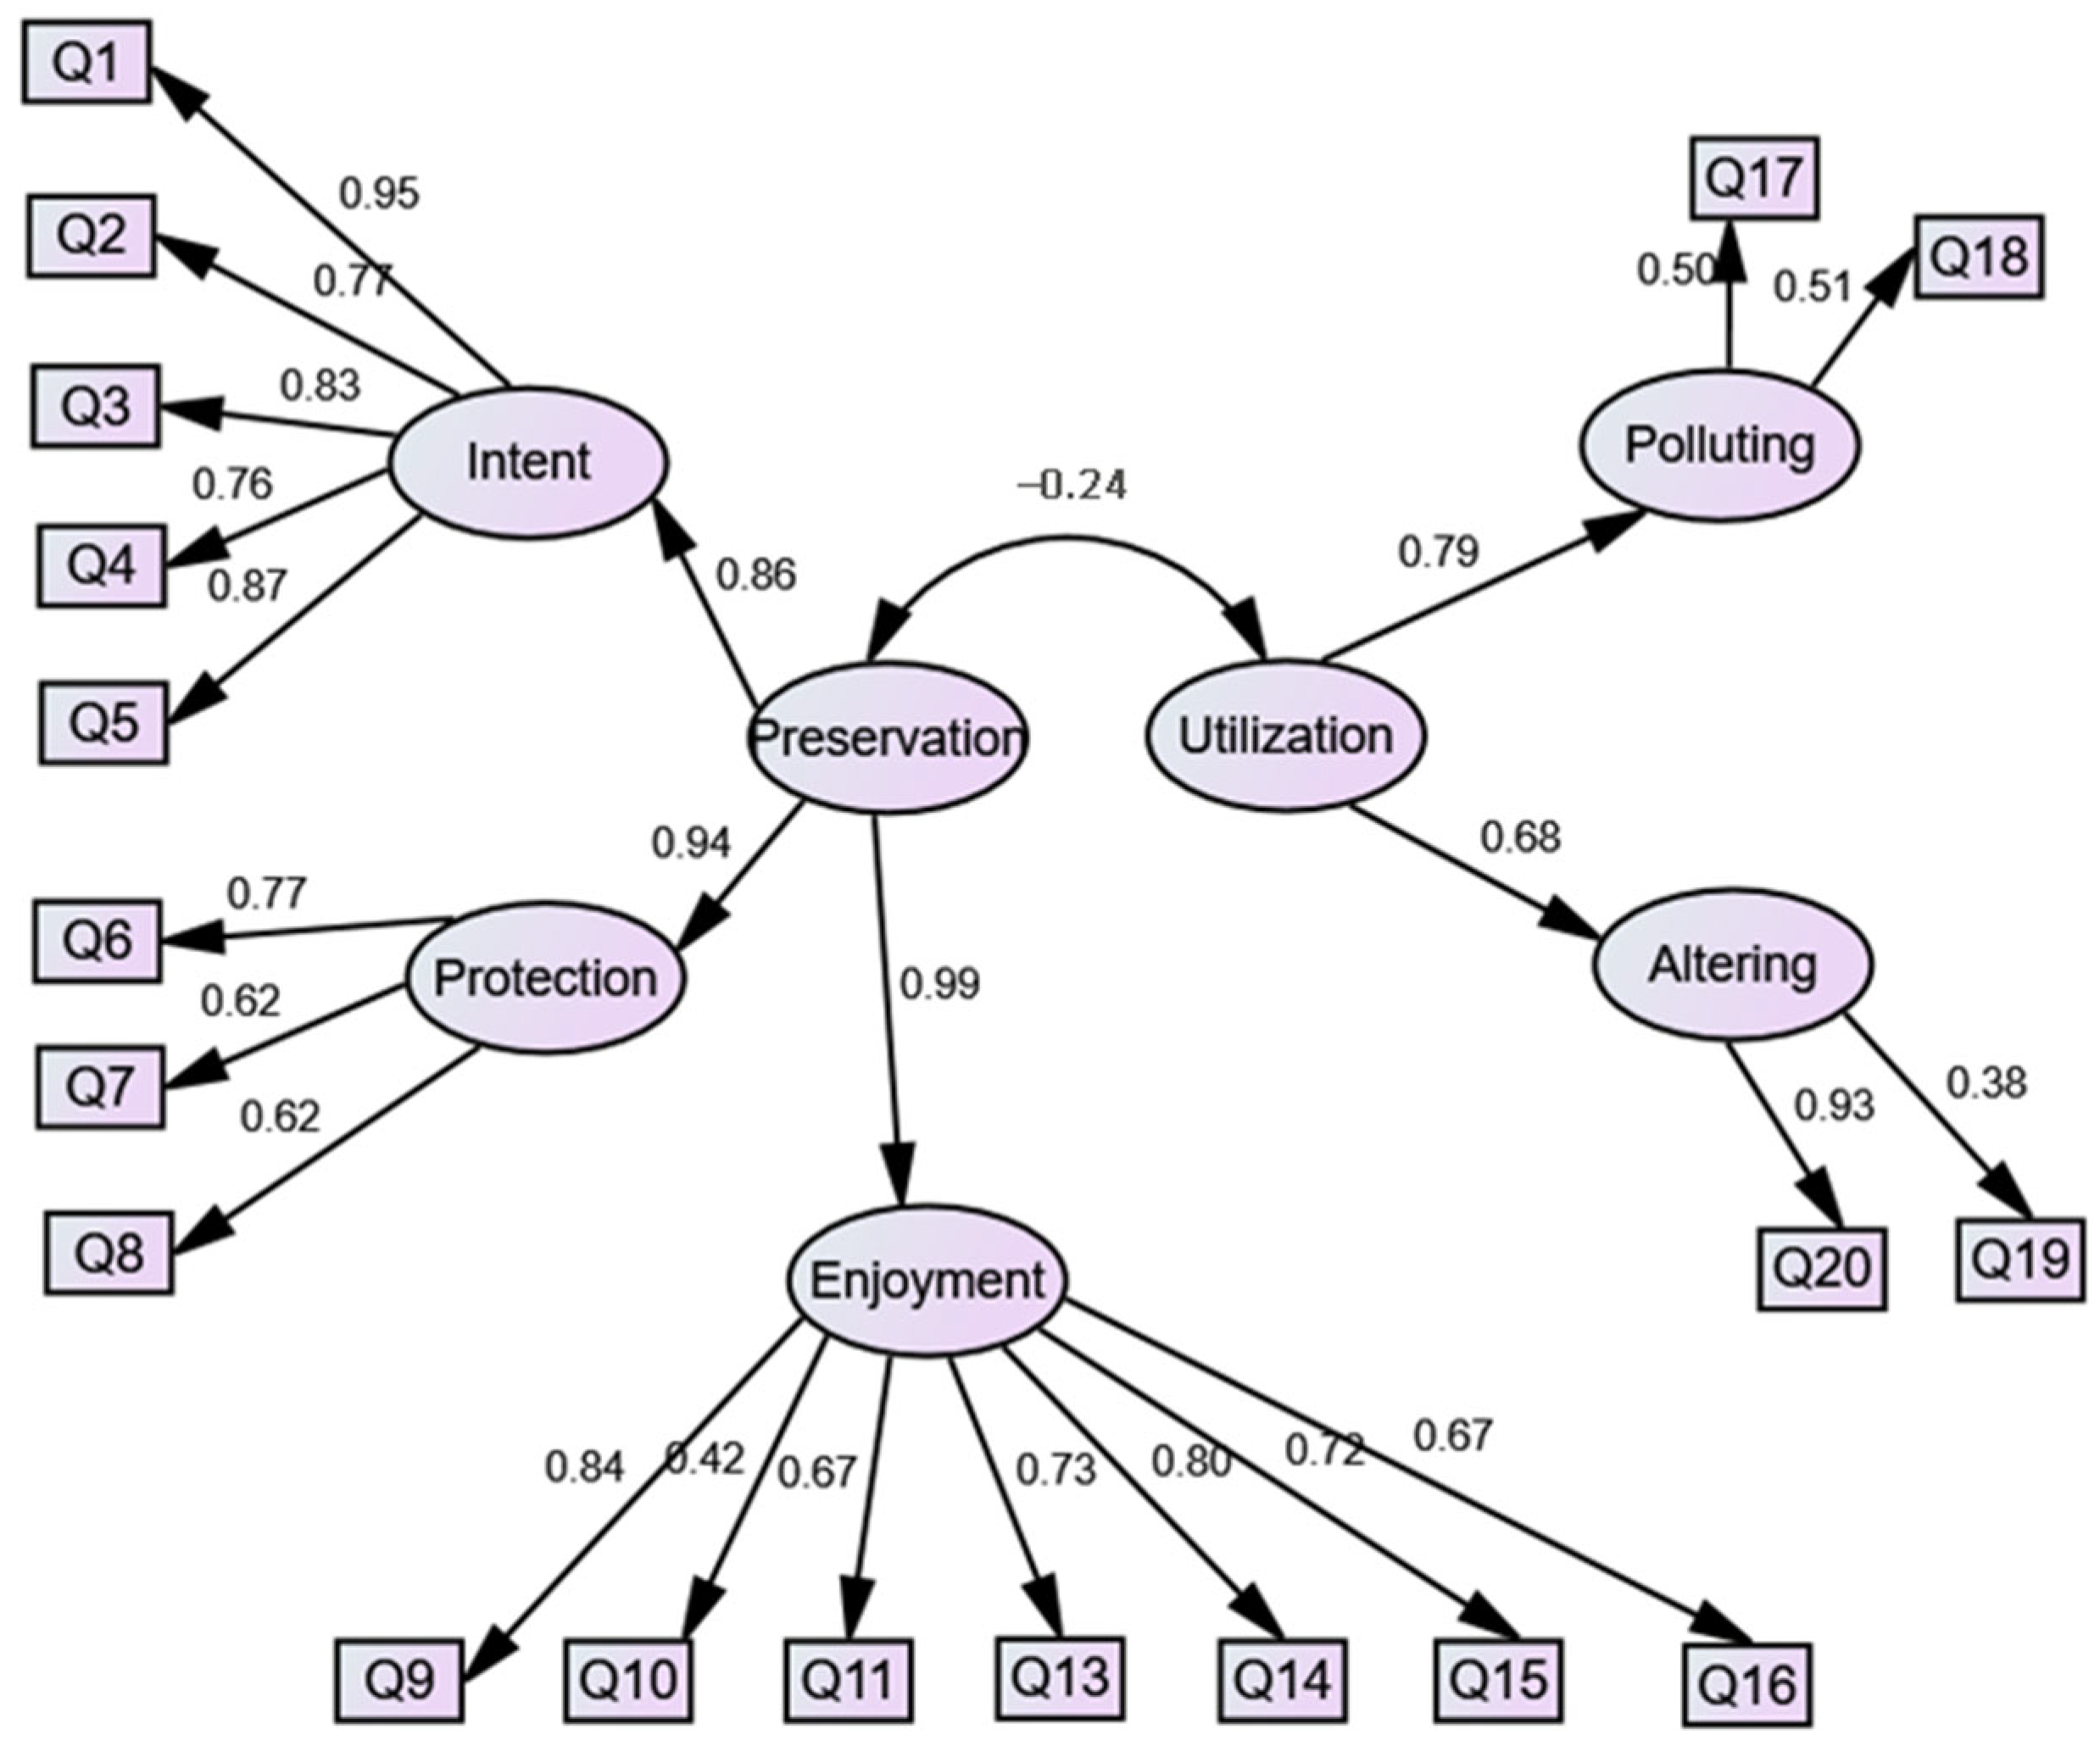
3.2. Confirmatory Factor Analysis (CFA)

CFAs were conducted with the other randomly selected half of the data. Several CFA models were employed using maximum likelihood estimates. First, 6 items unidentified in the EFAs were eliminated from the analyses, leaving 19 of the original 25 items. Then, different hypotheses of values and attitude combinations were tested using the item responses.
The first CFA model was based on the two values (Preservation and Utilisation) in the scale. Fit statistics were compared with the recommended thresholds to indicate good fit of the data to the model. Chi2/df ratio = 2.119 was below the commonly used maximum of 5.0, but CFI = 0.891 and TLI = 0.863 were below the commonly used minimum of 0.90 [21], and RMSEA was right at the commonly used maximum cut-offs of 0.06 or 0.07, as per the recommendations [52,53].
The second CFA model consisted of three values (Preservation, Appreciation, and Utilisation) found in one of the recent versions of the 2-MEV Scale [34]. The new value of Appreciation consists of items initially in the Enjoyment of Nature attitude within Preservation. Fit statistics for this model were better than in the initial model, but they could still be improved: Chi2/df ratio = 1.885; CFI = 0.908, TLI = 0.885; RMSEA = 0.057.
Because the model with three values did not fit the data as well as expected, the next model returned to the original 2-MEV, as confirmed in the authors’ previous study in rural Nepal [18]. In this model, the higher-order value of Preservation is derived from three primary factor attitudes: Intent of Support, Protection of Nature, and Enjoyment of Nature. Appreciation is not a separate value but is instead an attitude (Enjoyment of Nature) within the value of Preservation. The higher-order value of Utilisation is derived from two primary factor attitudes: Polluting Nature and Altering Nature for Utilisation. Fit statistics for this model (see Figure 2) were improved, indicating good fit of the data to the model: Chi2/df ratio = 2.102; CFI = 0.894, TLI = 0.863; RMSEA = 0.064. After correlating some of the error terms for items within the same attitude because similar items can have similar errors, fit statistics were further improved: Chi2/df ratio = 1.792; CFI = 0.932, TLI = 0.901; RMSEA = 0.054.
As seen in Figure 2, the attitudes of Intent of Support, Protection of Nature, and Enjoyment of Nature contribute similarly to the value of Preservation. For the value of Utilisation, both Attitudes (Polluting Nature and Altering Nature) contribute strongly to the Values of Utilisation, although Polluting Nature contributes more than Altering Nature. The intercorrelation of the values of Preservation and Utilisation is negative, as expected; however, the relationship is not strong.
It is important to note that item number 17 (Q17) was not loaded in the EFA and was initially not included in the CFA analyses. However, when testing different hypotheses of the CFA model along with a model similar to the rural Nepal study, the inclusion of Q17 led to a higher fit to the CFA model. Therefore, this further demonstrates that the EFA was inconclusive, and the verification achieved using the CFA is important to validate the 2-MEV Scale. Moreover, it is critical to note that Q17 was developed in the rural Nepal scale due to the local socioeconomic, educational, and environmental context of Nepal. The inclusion of Q17 in the urban Nepal scale further shows that adapting 2-MEV to the local context to increase its representativeness of the region is important.

3.3. Values and Attitudes Scores

Based on the final CFA model, scores for the two values and their five corresponding attitudes were calculated for all of the respondents. Means were compared for age and gender. Likewise, the means of the urban scale and the previously studied rural scale [18] of 2-MEV for Nepal were also compared. Mean values above 3 for Preservation and below 3 for Utilisation values and their corresponding attitudes are pro-environmental based on the structure of the worded Likert-type scale used for this study survey.
The comparison of means does not show any significant tendency of variation in the Environmental Values and Attitudes based on children’s age and grade. The only statistically significant difference at the 95% confidence level was for the value of Utilisation. The mean values of Utilisation for 14- and 16-year-olds were lower (more pro-environmental) than the means of other ages. There were no other statistically significant differences in the means of other ages. Table 3 shows the variation of means of values and attitudes for different ages, except ages 11 and 19, which had only one respondent each.
The gender-based comparison of mean values shows that for Preservation and all three of its attitudes, females had higher (more pro-environmental) mean scores than did males. All of these differences are statistically significant. These findings fit what previous 2-MEV studies have commonly found [31,33]. For Utilisation and its attitude of Polluting Nature, there was not a statistically significant difference between the genders. However, males had a statistically significant lower (more pro-environmental) mean score than did females for the attitude of Altering Nature. Table 4 shows the details of the gender-based means and their statistical significance at the 95% confidence level, shown as the p-value. The age-based and gender-based mean values of Bharatpur city with 104 respondents also follow a similar pattern, as seen in the total respondents’ result. Although the statistical significance of the mean differences was not calculated for the sub-sample of Bharatpur city, the tendency of the mean values was similar.
The comparison of means (no statistical significance test; only tendency and differences of mean values) between the urban and the rural Nepal 2-MEV Scales shows that the urban population was more pro-environmental than the rural population on the attitudes Protection of Nature (a very large difference) and Enjoyment of Nature (a small difference). However, the rural population was more pro-environmental regarding the Intent of Support Attitude, with a moderate difference. Overall, the mean of the Preservation value was also slightly higher in the urban study compared to the rural study. The details of the mean values of urban and rural studies are shown in Table 5.
Similarly, the urban population was more pro-environmental than the rural population on the Polluting Nature attitude, with a relatively larger difference, and the same relationship exists in the overall Utilisation value. Finally, the rural and urban populations have the same mean values on the Altering Nature attitude.

4. Discussion

The urban Nepal scale explores the two facets of the 2-MEV Scale’s advantages. The first explored advantage is the localisation of the scale. The validated urban scale uses traditional items from the scales validated in urbanised and industrialised communities [16,27,29]. In the same scale, items developed, validated, and used in rural Nepal are also used [18]. The possibility of mixing items originating in different contexts further demonstrates an advantage of the 2-MEV Scale. Similarly, it also shows the importance of local context-related items in increasing the fit of the scale to the study area. It is important to note that the attitude “Polluting Nature” under the Utilisation value and the attitude “Protection of Nature” under the Preservation value are present only in the context of rural or urban Nepal [18]. In the scales from industrialised countries, these attitudes are commonly replaced by the attitudes “Human Dominance” and “Care with Resources” [16,23].
The Preservation and Utilisation values had a very strong, negative correlation of −0.93 in the rural Nepal scale [18]. Results from studies in industrialised countries showed negative but much smaller correlations between the two values [16,24]. An earlier study comparing urban and rural populations in Germany shows no significant difference between them [22], but this study shows observable differences compared to the rural Nepal findings of 2-MEV. Table 6 elaborates the compared and discussed aspects of this study, the rural Nepal study, and relevant previous 2-MEV studies conducted in industrialised regions. In the present study, the urban scale shows a similarity with the industrialised country’s findings regarding the relationship between the two values. However, the urban scale shows a higher similarity with the rural Nepal scale regarding the attitudes that contribute to the values of Preservation. The fact that the urban Nepal scale has a weaker but negative correlation (−0.24) between the two values but fits with the structure of attitudes present in the rural Nepal scale further demonstrates the flexibility and localisation of the 2-MEV to capture the essence of the study area in socioeconomic, environmental, and educational contexts.
The presence of the “Polluting Nature” attitude in both Nepal scales shows that the issue of pollution is more important than that of human dominance over the environment, which is highly associated with industrialised countries’ scales. Although the items related to human dominance were present in the initial items list, those items were not verified by the factor analyses. Pollution is a major challenge in Nepal, with air and water quality levels continuously decreasing; this also holds an important space in the subject of environmental education in Nepal [46,54]. School-going adolescents are highly exposed to the concepts of pollution and its impacts on the environment; this could be a reason for the validation of the Polluting Nature attitude. Regardless, this study found that including this attitude is essential to reflect the study area, which also represents geographical zones of similar socioeconomic and environmental status.
Likewise, the second advantage of the 2-MEV Scale explored in this study was the construct of the environmental attitude. Traditionally, the construct has been of two dimensions—Preservation and Utilisation [5,16,27,28]. However, the usage of Appreciation as a third dimension has also emerged recently [34,39]. We found that in urban Nepal, the 2-MEV Scale fits more precisely with two dimensions rather than three, and the dimension of Appreciation best fits as an attitude of Preservation, namely Enjoyment of Nature. The concept of Appreciation as a third dimension was envisioned with the prospect that analysing environmental values and attitudes not only from the domain of exploitative utilisation but also from the domain of positive utilisation might increase the inclusiveness of the scale to capture progressive appreciation values of an individual [34]. The nature of progressive appreciation, which promotes pro-environmental behaviour, is strongly related to preservation, and studies show similar results of positive correlations among them [34,39]. Furthermore, nature connectedness is postulated to be a trait of a pro-environmental attitude [55]. Therefore, including Appreciation as a different dimension is intended to promote or identify better bonding with nature, which in turn is hypothesised to improve positive attitude toward the nature. An important point raised by Bogner [34] is that if appreciative content is used in teaching, rather than teaching with bad examples of environmental destruction, it helps to improve and promote pro-environmental attitudes. Although the urban Nepal scale shows that Appreciation is better mixed within Preservation as a separate attitude (Enjoyment of Nature), the inclusion of more items related to this attitude is in alignment with the point raised by Bogner [34] to capture the level of progressive appreciation. The two-dimensional construct of environmental attitude identified in the urban Nepal scale captures the essence of Preservation as a higher-order factor, which includes Appreciation as one of its primary factors, and Utilisation as the second higher-order factor.
The urban results in this study found higher (more pro-environmental) mean values than the previously conducted rural Nepal study [18]. Similarly, the mean value of Protection of Nature was also higher in urban areas compared to the rural study. These points hint that urban adolescents with fewer natural elements in the city emphasise nature’s protection. This is also supported by the mean value of the Polluting Nature attitude in the urban study, which is lower (more pro-environmental) that in the rural study. Pollution of the environment and the need to protect and enjoy nature seem to be more felt by the urban adolescents, which may represent the lack of natural areas and high levels of pollution in the cities.
On the other hand, rural adolescents showed greater intent to support environmental causes. This could be because environmental and natural components are omnipresent in rural settings, evoking motivation to support them before their destruction. Overall, the pro-environmental values were higher in the urban areas regarding both the mean values of Preservation and Utilisation. Nonetheless, it is important to note that attitude is also influenced by environmental education, and this factor has not been considered in this study [9].
The age factor, which is associated with education level, was analysed in this study, and it showed no statistically significant variations based on age. The discourse around environmental topics in popular culture and in schools could be a reason for such a uniform nature of environmental attitudes across all the ages and grades. In general, the pro-environmental values and attitudes were held by each age and grade group. However, the rural Nepalese adolescents showed some tendency toward improving levels of environmental values and attitudes in different grades but not with age [18]. Furthermore, the female population showed higher preservative values and attitudes than the males, while the males had more pro-environmental Altering Nature attitudes. There were no significant differences between the genders in the Utilisation value and the Polluting Nature attitude.
In the rural Nepal study, it was seen that the individualistic or communal natures of the questionnaire items were influencing the mean values’ standard deviations of the attitudes [18]. There was a hint that items related to individuals resulted in a lower standard deviation from the mean, while items related to communities resulted in a higher standard deviation from the mean [18]. The same variation is observed in the urban Nepal scale. The attitudes with highly individual items, such as Intent of Support and Enjoyment of Nature, comparatively have a lower standard deviation. The Protection of Nature attitude has a mixture of individual and communal items, with a slightly higher standard deviation compared to the other two attitudes. However, the attitudes Polluting Nature and Altering Nature have a higher standard deviation from the mean, and their items are also communal in nature. In the rural Nepal study, it was highlighted that the adolescents have higher confidence when answering items concerning them directly, while their level of confidence drops down when they are answering items that directly impact the communities around them [18]. The same has been observed in the urban Nepal scale, suggesting that the nature of items and whether they are individualistic or communalistic impact how adolescents are able to respond to such items. The fact that adolescents are mostly left out from community/adult participation events could be one explanation for why they show a greater deviation from the mean [11,56]. This observation aligns with the United Nations Convention on the Rights of the Child, which stresses the need to respect the views of the child in the worlds of adults [14].
This study also tries to explore how the relationship between Preservation and Utilisation might mirror or differ from the results of the previously conducted rural Nepal study [18]. Milfont and Duckitt [29] emphasised that a negative but weak correlation between the two values in industrialised communities might be completely altered to a positive correlation in non-industrialised communities. Regmi et al. [18] found that the relationship between these values was different, but not as hypothesised by Milfont and Duckitt [29]. Instead, the rural Nepal scale also showed a negative but very strong correlation [18]. Therefore, it was important to understand whether this negative yet stronger relationship in rural Nepal was a case of a different attitude structure in rural communities or a different structure in Nepal as a whole, being a non-industrialised country. The findings of this study demonstrate that the construct of environmental attitude and the relationship between its values in urban Nepal are similar to those of industrialised communities differing from the structure in rural Nepal.
It is important to note that Nepal is a least-developed, non-industrialised country, but the construct of the urban Nepalese environmental attitude is close to that of the industrialised nations’ attitude. This could be because these urban areas of Nepal are encapsulated by the concept of globalisation (influenced by industrialised communities) and due to similarities in the psychosocial construct of the industrialised communities. On the other hand, it could also be because the rural Nepalese community is different regarding socioeconomic activities, natural resources’ availability/pollution, and formal/informal educational exposure compared to the urban parts of Nepal. The influence of these three points is evident based on the arguments raised in this discussion comparing previous studies and the rural Nepal study with the results of the urban Nepal study.
This study confirms that the construct of environmental attitude is not solely dependent on the industrialisation or economic situation of the society. The urban Nepal scale and previous scales from industrialised communities have similar constructs of environmental attitude. On the other hand, the rural Nepal scale represents a very different relationship between the values of Preservation and Utilisation [18]. Is this difference only due to ruralness, or is it due to other factors? Although the educational curriculum is the same in rural and urban Nepal, the exposure to wider information/knowledge regarding environmental issues as well as immediate experience with environmental degradation could be important factors shaping the construct of attitudes, which is still to be explored. The evidence that willingness to adopt pro-environmental behaviour increases according to exposure to environmental crises also supports this proposition [57,58,59]. However, there are also some differences in the construct of attitudes between urban Nepalese society and industrialised country’s communities; the latter showed Appreciation as a third dimension, and urban Nepal only showed two dimensions. This fact raises further questions about the extent to which the level, structure, and type of education impact the dimensions of attitudes. There are several studies showing that attitude is improved by education [9,33], but the relationship between education and the structure of attitude is still a question to explore. Furthermore, the attitudes associated with individualised items showed lower standard deviation, while communalised items showed higher standard deviation. Interestingly, the items with higher standard deviation were in the Utilisation value, while those with lower standard deviation were in the Preservation value. Therefore, another question to explore is whether the standard deviation variance is influenced by the nature of the items or the nature of the attitude.
The evidence from this study compared to the rural Nepal study also points to the importance of education in the construction of environmental attitudes. Nepal follows a centralised curriculum for school education, and the environmental education content is the same in urban and rural Nepal [60,61]. Various studies clearly indicate that environmental attitude is influenced by environmental knowledge [9,10]. Given this context, the construct and variations in environmental attitude between urban and rural Nepal should also be similar. However, this is not the case, as elaborated above, due to multiple possibilities of exposure to information and experience. Importantly, knowledge alone does not change attitudes/values; rather, the method of knowledge acquisition is critical, which is more related to experience [10]. In education programs, it is important to include attitudes/values as essential components rather than assuming that they will change because the program teaches knowledge [9,10]. Environmental attitudes/values are more affected through direct experience with natural and realistic settings than by reading or watching films. Specifically, action-related knowledge, which deals with knowing how to be environmentally friendly, influences environmental attitude rather than knowing what (system knowledge) and which (effectiveness knowledge) regarding environmental issues [10]. Therefore, education programs should strive to incorporate direct experiences or action-related knowledge in natural/realistic settings, which helps to develop a realistic view of the environment, including both Preservation and Utilisation, in line with the concepts of sustainable development [10,26].

5. Conclusions

This study was conducted in urban centres in Nepal, and more than 80% of the 547 respondents came from the largest urban area of Nepal, the capital city of Kathmandu. The 2-MEV Scale for urban Nepal was developed using existing scale items from previous studies in industrialised urban communities as well as items from the previously studied rural Nepal scale to match the local context. A total of 25 items were used and then validated using exploratory factor analyses and confirmatory factor analyses. The 2-MEV Scale for urban Nepal confirmed a two-dimensional construct of environmental attitude, with 19 items separated between the values of Preservation and Utilisation. The two values have a small, negative correlation of −0.24. This suggests that the adolescents can hold both the values of Preservation and Utilisation at the same time, in contrast with −0.93 of adolescents in rural Nepal between the same values. The key conclusions of the findings are listed below.
  • In rural Nepal, there is a strong negative correlation between Preservation and Utilisation values, but this was not observed in urban Nepal. Instead, urban Nepal’s correlation resembles that of industrialised countries.
  • The study identified three attitudes under Preservation (Intent to Support, Protection of Nature, and Enjoyment of Nature) and two under Utilisation (Polluting Nature and Altering Nature). These attitudes were consistent across both rural and urban Nepal.
  • Overall, the respondents showed pro-environmental values and attitudes, but urban adolescents generally showed higher pro-environmental values compared to rural adolescents, except in the Intent to Support attitude, where rural adolescents scored higher, and the Altering Nature attitude was the same for both urban and rural adolescents.
  • Females exhibited higher preservative values and attitudes, while males showed more pro-environmental traits only in the Altering Nature attitude. There were no significant gender differences in the Utilisation and Polluting Nature attitudes.
  • The study suggests that items focusing on individual concerns might provide a better understanding of attitudes, as there was more variation in community-related items in both rural and urban scenarios.
There are important limitations to consider. First, the study was conducted in Nepal. The findings may not be applicable to other countries and cultures. Second, while the urban sample came from two different major urban areas of Nepal, the rural sample was from only one area that is not representative of the different rural areas and cultures in Nepal. Moreover, the sample size used in this study might not completely represent the urban adolescent population but only a part of it; hence, it should not be used for generalisation. Future research in other rural and urban areas of Nepal and similar socioeconomic status regions are needed. Specifically, a comparison of the structure of environmental attitude between urban and rural areas of other non-industrialised countries would help to further validate the findings of this study.
One implication of this study follows from the finding that the adolescents in rural Nepal with high Utilisation values seem to have low Preservation values. Education programs in areas where this is the case should consider helping the youth to see that it is possible to value utilising and preserving nature at the same time. Likewise, the observed differences between urban and rural Nepal indicated socioeconomic discrepancies, differences in natural resource availability, and differences in exposure to pollution and formal or informal (experiential) knowledge. Therefore, it is worth exploring whether these points of wider availability or structure of information/knowledge and the status of environmental quality led to the difference between rural and urban environmental values. Taking future steps on these topics would further aid in understanding the construct of environmental attitude and justifying the flexibility of the 2-MEV Scale to be adapted to different socioeconomic and environmental contexts for specific and localised study purposes.

Author Contributions

Conceptualisation, S.R.; Methodology, S.R. and B.J.; Software, S.R. and B.J.; Validation, S.R. and B.J.; Formal Analysis, S.R. and B.J.; Investigation, S.R. and B.J.; Resources, S.R.; Data Curation, S.R.; Writing—Original Draft Preparation, S.R. and B.J.; Writing—Review and Editing, S.R. and B.J.; Visualisation, S.R. and B.J. All authors have read and agreed to the published version of the manuscript.

Funding

This research received no external funding.

Institutional Review Board Statement

Not applicable.

Informed Consent Statement

Informed consent was obtained from all subjects involved in the study.

Data Availability Statement

The data collected and used for this research are provided in Mendeley Data. The reference to the data is as follows: [48].

Acknowledgments

The authors express their gratitude to Bed Mani Dahal from Kathmandu University, Nepal for connecting with various schools in Nepal to collect and use the data for this research. Furthermore, the authors also express their gratitude to all of the schools and the students who wilfully agreed to provide data for this research.

Conflicts of Interest

The authors declare no conflicts of interest.

References

  1. Protest for a Future: Composition, Mobilization and Motives of the Participants in Fridays for Future Climate Protests on 15 March, 2019 in 13 European Cities. 2019. Available online: https://www.researchgate.net/publication/334745801_Protest_for_a_future_Composition_mobilization_and_motives_of_the_participants_in_Fridays_For_Future_climate_protests_on_15_March_2019_in_13_European_cities (accessed on 5 March 2023).
  2. Fridays for Future Map of Fridays for Future Activities. Fridays for Future 2020. Available online: https://fridaysforfuture.org/action-map/map/ (accessed on 5 March 2023).
  3. Ajzen, I.; Fishbein, M. Attitude-Behavior Relations: A Theoretical Analysis and Review of Empirical Research. Psychol. Bull. 1977, 84, 888–918. [Google Scholar] [CrossRef]
  4. Kaiser, F.G.; Oerke, B.; Bogner, F.X. Behavior-Based Environmental Attitude: Development of an Instrument for Adolescents. J. Environ. Psychol. 2007, 27, 242–251. [Google Scholar] [CrossRef]
  5. Milfont, T.L.; Duckitt, J. The Environmental Attitudes Inventory: A Valid and Reliable Measure to Assess the Structure of Environmental Attitudes. J. Environ. Psychol. 2010, 30, 80–94. [Google Scholar] [CrossRef]
  6. Kibbe, A.; Bogner, F.X.; Kaiser, F.G. Exploitative vs. Appreciative Use of Nature—Two Interpretations of Utilization and Their Relevance for Environmental Education. Stud. Educ. Eval. 2014, 41, 106–112. [Google Scholar] [CrossRef]
  7. Hines, J.M.; Hungerford, H.R.; Tomera, A.N. Analysis and Synthesis of Research on Responsible Environmental Behavior: A Meta-Analysis. J. Environ. Educ. 1987, 18, 1–8. [Google Scholar] [CrossRef]
  8. Bamberg, S.; Möser, G. Twenty Years after Hines, Hungerford, and Tomera: A New Meta-Analysis of Psycho-Social Determinants of pro-Environmental Behaviour. J. Environ. Psychol. 2007, 27, 14–25. [Google Scholar] [CrossRef]
  9. Meinhold, J.L.; Malkus, A.J. Adolescent Environmental Behaviors: Can Knowledge, Attitudes, and Self-Efficacy Make a Difference? Environ. Behav. 2005, 37, 511–532. [Google Scholar] [CrossRef]
  10. Roczen, N.; Kaiser, F.G.; Bogner, F.X.; Wilson, M. A Competence Model for Environmental Education. Environ. Behav. 2014, 46, 972–992. [Google Scholar] [CrossRef]
  11. Buttazzoni, A.; Doherty, S.; Minaker, L. How Do Urban Environments Affect Young People’s Mental Health? A Novel Conceptual Framework to Bridge Public Health, Planning, and Neurourbanism. Public Health Rep. 2022, 137, 48–61. [Google Scholar] [CrossRef]
  12. Gemmell, E.; Adjei-Boadi, D.; Sarkar, A.; Shoari, N.; White, K.; Zdero, S.; Kassem, H.; Pujara, T.; Brauer, M. “In Small Places, Close to Home”: Urban Environmental Impacts on Child Rights across Four Global Cities. Health Place 2023, 83, 103081. [Google Scholar] [CrossRef]
  13. United Nations Department of Economic and Social Affairs. World Urbanization Prospects: The 2018 Revision; United Nations; Erscheinungsort Nicht Ermittelbar: New York, NY, USA, 2019; ISBN 978-92-1-004314-4. [Google Scholar]
  14. United Nations. Convention on the Rights of the Child; United Nations: New York, NY, USA, 1990. [Google Scholar]
  15. World Health Organization. Adolescents Health; World Health Organization: Geneva, Switzerland, 2019. [Google Scholar]
  16. Johnson, B.; Manoli, C.C. The 2-MEV Scale in the United States: A Measure of Children’s Environmental Attitudes Based on the Theory of Ecological Attitude. J. Environ. Educ. 2010, 42, 84–97. [Google Scholar] [CrossRef]
  17. Bogner, F.X.; Johnson, B.; Buxner, S.; Felix, L. The 2-MEV Model: Constancy of Adolescent Environmental Values within an 8-Year Time Frame. Int. J. Sci. Educ. 2015, 37, 1938–1952. [Google Scholar] [CrossRef]
  18. Regmi, S.; Johnson, B.; Dahal, B.M. Analysing the Environmental Values and Attitudes of Rural Nepalese Children by Validating the 2-MEV Model. Sustainability 2020, 12, 164. [Google Scholar] [CrossRef]
  19. Dunlap, R.E.; Van Liere, K.D. The “New Environmental Paradigm”. J. Environ. Educ. 1978, 9, 10–19. [Google Scholar] [CrossRef]
  20. Blaikie, N.W.H. The Nature and Origins of Ecological World Views: An Australian Study. Soc. Sci. Q. 1992, 73, 144–165. [Google Scholar]
  21. Byrne, B.M. One Application of Structural Equation Modeling from Two Perspectives: Exploring the EQS and LISREL Strategies. In Structural Equation Modeling: Concepts, Issues, and Applications; Sage Publications, Inc.: Thousand Oaks, CA, USA, 1995; pp. 138–157. ISBN 978-0-8039-5317-8. [Google Scholar]
  22. Bogner, F.X.; Wiseman, M. Environmental Perception of Rural and Urban Pupils. J. Environ. Psychol. 1997, 17, 111–122. [Google Scholar] [CrossRef]
  23. Bogner, F.X.; Wiseman, M. Toward Measuring Adolescent Environmental Perception. Eur. Psychol. 1999, 4, 139–151. [Google Scholar] [CrossRef]
  24. Wiseman, M.; Bogner, F.X. A Higher-Order Model of Ecological Values and Its Relationship to Personality. Personal. Individ. Differ. 2003, 34, 783–794. [Google Scholar] [CrossRef]
  25. Johnson, B.; Manoli, C.C. Using Bogner and Wiseman’s Model of Ecological Values to Measure the Impact of an Earth Education Programme on Children’s Environmental Perceptions. Environ. Educ. Res. 2008, 14, 115–127. [Google Scholar] [CrossRef]
  26. United Nations. Agenda 21: Programme of Action for Sustainable Development; UN Department of Public Information: New York, NY, USA, 1992. [Google Scholar]
  27. Bogner, F.X.; Wiseman, M. Adolescents’ Attitudes towards Nature and Environment: Quantifying the 2-MEV Model. Environmentalist 2006, 26, 247–254. [Google Scholar] [CrossRef]
  28. Boeve-de Pauw, J.; Van Petegem, P. A Cross-National Perspective on Youth Environmental Attitudes. Environmentalist 2010, 30, 133–144. [Google Scholar] [CrossRef]
  29. Milfont, T.L.; Duckitt, J. The Structure of Environmental Attitudes: A First- and Second-Order Confirmatory Factor Analysis. J. Environ. Psychol. 2004, 24, 289–303. [Google Scholar] [CrossRef]
  30. United Nations. Least Developed Country Category; United Nations: New York, NY, USA, 2022. [Google Scholar]
  31. Bogner, F.X.; Wilhelm, M.G. Environmental Perspectives of Pupils: The Development of an Attitude and Behaviour Scale. Environmentalist 1996, 16, 95–110. [Google Scholar] [CrossRef]
  32. Vieira, C.L.Z.; Rumenos, N.N.; Gheler-Costa, C.; Toqueti, F.; Spazziani, M.D.L. Environmental Education in Urban Cities: Planet Regeneration through Ecologically Educating Children and Communities. Int. J. Educ. Res. Open 2022, 3, 100208. [Google Scholar] [CrossRef]
  33. Bogner, F.X.; Wiseman, M. Outdoor Ecology Education and Pupils’ Environmental Perception in Preservation and Utilisation. Sci. Educ. Int. 2004, 15, 27–48. [Google Scholar]
  34. Bogner, F. Environmental Values (2-MEV) and Appreciation of Nature. Sustainability 2018, 10, 350. [Google Scholar] [CrossRef]
  35. Pradhan, K.M. Local Government: Constitutional Vision and Present Practice. Res. Nepal J. Dev. Stud. (RNJDS) 2019, 2, 109–128. [Google Scholar] [CrossRef]
  36. Weeks, J.R. Defining Urban Areas. In Remote Sensing of Urban and Suburban Areas, Remote Sensing and Digital Image Processing; Rashed, T., Jürgens, C., Eds.; Springer: Dordrecht, The Netherlands, 2010; pp. 33–45. ISBN 978-1-4020-4385-7. [Google Scholar]
  37. United States Census Bureau. Urban and Rural. Available online: https://www.census.gov/programs-surveys/geography/guidance/geo-areas/urban-rural.html (accessed on 21 February 2023).
  38. Hanberry, B.B. Imposing Consistent Global Definitions of Urban Populations with Gridded Population Density Models: Irreconcilable Differences at the National Scale. Landsc. Urban Plan. 2022, 226, 104493. [Google Scholar] [CrossRef]
  39. Raab, P.; Randler, C.; Bogner, F. How Young “Early Birds” Prefer Preservation, Appreciation and Utilization of Nature. Sustainability 2018, 10, 4000. [Google Scholar] [CrossRef]
  40. Bharatpur Metropolitan City Welcome to Bharatpur Metropolitan City. 2016. Available online: https://bharatpurmun.gov.np/en/node/27 (accessed on 27 January 2023).
  41. Thapa, G. Kathmandu City. The Kathmandu Post. 2016. Available online: https://kathmandupost.com/opinion/2016/02/21/kathmandu-city (accessed on 24 January 2023).
  42. Rai, R.K.; Nepal, M.; Khadayat, M.S.; Bhardwaj, B. Improving Municipal Solid Waste Collection Services in Developing Countries: A Case of Bharatpur Metropolitan City, Nepal. Sustainability 2019, 11, 3010. [Google Scholar] [CrossRef]
  43. Flacke, J.; Maharjan, B.; Shrestha, R.; Martinez, J. Environmental Inequalities in Kathmandu, Nepal—Household Perceptions of Changes Between 2013 and 2021. Front. Sustain. Cities 2022, 4, 835534. [Google Scholar] [CrossRef]
  44. Joshi, P. The Growth, Roles and Needs of the Private Education System: Private Stakeholder Perspectives from Nepal. Int. J. Educ. Dev. 2019, 65, 57–67. [Google Scholar] [CrossRef]
  45. Singh, D. Government of Nepal Economic Survey 2020/21; Ministry of Finance, Government of Nepal: Kathmandu, Nepal, 2021. [Google Scholar]
  46. Adhikari, P.; Babu Subedi, S.; Rai, S. Environment Education in School Level of Nepal. Jeju 2017, 19, 60. [Google Scholar] [CrossRef]
  47. National Statistics Office Population Size and Distribution. National Population and Housing Census 2021. 2023. Available online: https://censusnepal.cbs.gov.np/results (accessed on 22 October 2024).
  48. Regmi, S. Data Collected and Used to Validate the Construct of Environmental Attitude in Urban Nepal Using 2-MEV Scale 2023. Available online: https://data.mendeley.com/datasets/cg5zxnz6tj/1 (accessed on 8 May 2022).
  49. Taylor-Powell, E. Questionnaire Design: Asking Questions with a Purpose; The Texas A&M University System: College Station, TX, USA, 1998. [Google Scholar]
  50. Yong, A.G.; Pearce, S. A Beginner’s Guide to Factor Analysis: Focusing on Exploratory Factor Analysis. TQMP 2013, 9, 79–94. [Google Scholar] [CrossRef]
  51. Gallagher, M.W.; Brown, T.A. Introduction to Confirmatory Factor Analysis and Structural Equation Modeling. In Handbook of Quantitative Methods for Educational Research; Teo, T., Ed.; Sense Publishers: Rotterdam, The Netherlands, 2013; pp. 289–314. ISBN 978-94-6209-404-8. [Google Scholar]
  52. Hu, L.; Bentler, P.M. Cutoff Criteria for Fit Indexes in Covariance Structure Analysis: Conventional Criteria versus New Alternatives. Struct. Equ. Model. Multidiscip. J. 1999, 6, 1–55. [Google Scholar] [CrossRef]
  53. Hooper, D.; Coughlan, J.; Mullen, M. Structural Equation Modelling: Guidelines for Determining Model Fit. Electron. J. Bus. Res. Methods 2008, 6, 53–60. [Google Scholar] [CrossRef]
  54. Jha, S.G. A Brief Appraisal of Existing Main Environmental Issues in Nepal and Potential Intervention to Solve the Perceived Problems. Banko 2007, 17, 39–45. [Google Scholar] [CrossRef]
  55. Mayer, F.S.; Frantz, C.M. The Connectedness to Nature Scale: A Measure of Individuals’ Feeling in Community with Nature. J. Environ. Psychol. 2004, 24, 503–515. [Google Scholar] [CrossRef]
  56. Chawla, L.; Heft, H. Children’s Competence and the Ecology of Communities: A Functional Approach to the Evaluation of Participation. J. Environ. Psychol. 2002, 22, 201–216. [Google Scholar] [CrossRef]
  57. Taylor, A.; de Bruin, W.B.; Dessai, S. Climate Change Beliefs and Perceptions of Weather-Related Changes in the United Kingdom: Climate Change Beliefs. Risk Anal. 2014, 34, 1995–2004. [Google Scholar] [CrossRef]
  58. Pyhälä, A.; Fernández-Llamazares, Á.; Lehvävirta, H.; Byg, A.; Ruiz-Mallén, I.; Salpeteur, M.; Thornton, T.F. Global Environmental Change: Local Perceptions, Understandings, and Explanations. Ecol. Soc. 2016, 21, art25. [Google Scholar] [CrossRef] [PubMed]
  59. Salvo, M.D.; Signorello, G.; Cucuzza, G.; Begalli, D.; Agnoli, L. Estimating Preferences for Controlling Beach Erosion in Sicily. Aestimum 2018, 27–38. [Google Scholar] [CrossRef]
  60. Kunwar, R.; Laxmi, G.C.; Acharya, N.; Adhikari, S. Brief Overview of the Integrated Curriculum in Nepal: Key Features, Impacts and Challenges. J. Res. Instr. 2024, 4, 155–169. [Google Scholar] [CrossRef]
  61. Subedi, K.R. Local Curriculum in Schools in Nepal: A Gap between Policies and Practices. Crossing Bord. Int. J. Interdiscip. Stud. 2018, 6, 57–67. [Google Scholar]
Figure 1. The locations of the study sites, Kathmandu and Bharatpur Metropolitan City. (a) The red dot shows the location of Nepal on the global map. (b) The exact location of the study sites on a map of Nepal. (c,d) Detailed maps of the study sites.
Urbansci 08 00231 g001
Figure 2. The confirmatory factor analysis model of the 2-MEV Scale for urban Nepal with a valid fit of goodness of fit values showing three attitudes under the Preservation value and two attitudes under the Utilisation value, and respective item numbers under each attitude.
Urbansci 08 00231 g002
Table 1. List of 2-MEV Scale items used in this study [5,16,18,23,25,27,29,31,39].
Item NumberItem
1If someday I have free time, I would like to volunteer to help protect the environment.
2I would like to participate in an afforestation campaign.
3I would like to participate in a cleaning campaign.
4I would like to volunteer with an organisation that is working to protect the environment in my community.
5I try to tell others that nature is important.
6I support conservation of forest for wildlife protection.
7If necessary, land near my community should be separated to support endangered plants and animals.
8I always turn off the light when I do not need it anymore.
9I enjoy sitting under a tree to enjoy its shade.
10I prefer the environment of a village compared to that of a city.
11Walking through the forests and/or in the mountains brings me joy.
12I enjoy hearing the soft rustling of leaves when the wind blows through the trees.
13I enjoy the natural sound of the flowing river.
14I like the quiet of the nature.
15I personally take care of plants and enjoy gardening.
16I enjoy looking at stars at night.
17Waste should be thrown away in the river or streams.
18Waste consisting of plastic materials should be burned.
19People have the right to change the environment (nature), e.g., clearing forest, plotting land, or draining stream.
20People should be allowed to change the environment for their benefit without considering its effect on the environment.
21Building new roads is so important that trees should be cut down.
22People are supposed to rule over nature.
23Weeds should be killed because they take up space from plants we need.
24Since human beings are more intelligent, they have the greatest right to live.
25To feed people, forests must be cleared for agriculture to grow food.
Table 2. Exploratory factor analysis of random samples representing half of the total responses. The exploratory factor analysis was conducted using Principal Axis Factoring with Direct Oblimin rotation with Kaiser normalisation. The natures of factor loadings using the structure matrix are provided in the table showing the association of each item with the higher-order factors (values). P is Preservation value, A is Appreciation value, U is Utilisation value, I is Intent to Support attitude (primary factor), and C is Care with Resources attitude (primary factor) in relation to the original 2-MEV study [23]. The primary factors are used here to show the position of Preservation-related items in 3 and 4 constrained factor EFA.
Item NumbersIntended Factor for Each ItemConstrained to FactorsFactor Loadings of Constrained 2 Factors
P, A, U432PU
1PP, -CP, IP0.686
2PP, I, -CIP0.71
3PIPP0.447
4PIPP0.431
5PP, -CIP0.592
6P-CPP0.375
7P-CPnone
8P-CnoneP0.441
9AP, -CPP0.487
10AnonenoneP0.409
11AP, -CPP0.645
12Anonenonenone
13APIP0.468
14A-CPP0.427
15AP, I, -CP, IP0.755
16APIP0.474
17Unonenonenone
18UUUU 0.366
19UUUU 0.674
20UUUU 0.616
21Unonenonenone
22UUUU 0.376
23Unonenonenone
24UUUU 0.393
25Unonenonenone
Variance Explained41.9%35.8%28.9%
Table 3. The comparison of values and attitudes based on age using the items finalised in the 2-MEV Scale for urban Nepal.
Values and AttitudesAge
121314151617
NMeanNMeanNMeanNMeanNMeanNMean
Preservation44.77374.601404.581454.59884.61104.65
Intent of Support54.60414.711574.581684.491024.51114.82
Protection 54.53444.601494.571624.49964.54134.49
Enjoyment 54.89514.521684.591814.661114.61124.37
Utilisation62.00472.031571.731752.011011.74112.00
Polluting Nature61.33491.501701.301881.571081.38121.38
Altering Nature62.67492.601582.141772.421052.12122.46
Table 4. The comparison of values and attitudes based on gender using the items finalised in the 2-MEV Scale for urban Nepal. The asterisk (*) and italic fonts indicate statistical significance, with a p-value less than 0.05.
Values and AttitudesMean ScoresStd. DeviationFp-Value
FemaleMaleFemaleMale
Preservation *4.724.480.3320.48333.30<0.001
Intent of Support *4.734.390.4230.74137.32<0.001
Protection of Nature *4.704.400.5590.76722.24<0.001
Enjoyment of Nature *4.694.540.4580.629.710.002
Utilisation1.921.820.8710.8691.460.227
Polluting Nature1.401.460.8330.8320.660.417
Altering Nature *2.432.171.311.254.950.027
Table 5. The comparison of values and attitudes of this study, the urban Nepal 2-MEV Scale, with the rural Nepal 2-MEV Scale [18].
Values and AttitudesMean ScoresStd. Deviation
UrbanRuralUrbanRural
Preservation4.594.360.430.45
Intent of Support4.554.740.630.45
Protection of Nature4.543.790.700.80
Enjoyment of Nature4.614.550.550.61
Utilisation1.872.420.870.78
Polluting Nature1.442.570.831.06
Altering Nature2.292.291.280.90
Table 6. Different key parameters analysed in this study compared with the previous 2-MEV studies from rural Nepal and other industrialised regions of the world. The associated studies are cited within the table titles and statements. The statement “out of scope” means that the topic/parameter was not considered in the respective studies.
ParametersUrban Nepal (This Study)Rural Nepal [18]Studies from Industrialised Regions
ValuesPreservation and UtilisationSame as urban NepalSame as urban Nepal; in some cases, Appreciation as a separate value [34]
Relationship of ValuesLow negative correlation (−0.24)High negative correlation (−0.93)Close to urban Nepal, with low negative correlations (−0.1 to −0.45) [16,24]
AttitudesSame in urban and rural Nepal studiesSame as urban NepalDifferent from urban and rural Nepal [24,25,29]
Attitudes vs. GenderMostly females show high preservative values and attitudesNo difference between gendersSimilar to urban Nepal [9]
Attitudes vs. AgeNo significant difference except Utilisation valueNo observable tendencyOut of scope
Urban–Rural RelationshipMajor difference in construct of attitudesOut of scopeNo difference found [22]
Orientation of ItemsDifference between individualistic and communal itemsSame as urbanOut of scope
Disclaimer/Publisher’s Note: The statements, opinions and data contained in all publications are solely those of the individual author(s) and contributor(s) and not of MDPI and/or the editor(s). MDPI and/or the editor(s) disclaim responsibility for any injury to people or property resulting from any ideas, methods, instructions or products referred to in the content.

