Abstract
This paper addresses methodological issues related to the identification and monitoring of visitor overcrowding and congestion situations in historic centres. Once the visitor carrying capacity was estimated for public spaces, taking into consideration the standards of quality and comfort for visitor experience and those related to the desired conditions for heritage assets’ conservation, digital real-time monitoring tools were implemented in an experimental urban area in Valencia, Spain, in order to know, through the establishment of proxemic triggers, when the standards were violated (or may soon be violated); then, the carrying capacity was exceeded, and management actions may be required. The results show that these digital monitoring tools are very efficient and accurate in micro-scale public spaces, user-friendly and affordably priced.
1. Introduction
The management of public spaces poses a significant challenge for cities, and the outcomes of such management distinguish one city from another. Traditionally, public spaces were designed and planned years ago to serve local residents. However, nowadays, these spaces serve not only a local social function [1] but also as transit routes for commuters travelling daily for work and as cultural attractions hosting events that draw large crowds, including tourists and visitors. Consequently, many cities face situations of overcrowding and congestion that were not anticipated in their original design [2].
A special case is presented by historic cities or neighbourhoods, which are legacies of urban planning from centuries past, designed with objectives and circumstances vastly different from today’s. These historic neighbourhoods often serve as major tourist attractions, forming a significant part of the local economy. In particular, historic centres feature unique urban characteristics that create distinctive urban landscapes or streetscapes, marked by a high concentration of historical structures and heritage buildings of significant value [3,4]. These streetscapes are part of a unique public realm which holds the city’s character and distinctiveness because they can signify the history and the values that a society has built up over centuries. These features make them different from the rest of urban spaces and provide identity to cities. However, these urban spaces are currently under excessive pressure due to the daily influx of visitors and tourists [2]. The comfort and safety of people, as well as the integrity of heritage elements, are not guaranteed under these conditions unless public-use management tools are implemented.
A basic tool for determining the use level of a space is the carrying capacity for visitors/users. The scientific literature has extensively addressed the analysis of the concept and application of visitor carrying capacity (VCC), which is considered an important management tool for heritage sites [5,6,7,8,9]. This tool provides information about the upper limit of the number of visitors at a given site that allows for the maintenance of the quality of the tourism experience, avoiding the degradation of sites and the surroundings, thus ensuring the environmental and social sustainability of the visit activity. This limit acts as a threshold [10]. It is important to say that determining the maximum number of People At One Time (PAOT) in the Usable Surface for Visitation (USV) is a key element of the VCC [11].
It is important to highlight that the initial work on estimating VCC was primarily associated with protected natural areas in the United States, largely driven by the US National Park Service since the 1960s. In fact, this tool is recognized by the National Park and Recreation Act of 1978, which established a statutory requirement in 2014 (54 U.S.C. § 100502) [12] that national park general management plans must include “visitor carrying capacities for all areas” of each park unit. Numerous VCC studies have subsequently been developed worldwide, addressing both protected areas and a variety of outdoor spaces such as beaches and natural areas [13,14,15,16,17,18], as well as indoor spaces like monuments and museums and their surrounding urban areas [19,20,21,22,23].
In recent years, planning tools have increasingly incorporated digital geospatial technologies for calculating VCC in open spaces [24,25,26,27,28], with Geographic Information Systems (GISs) playing a prominent role [29]. These technologies produce highly precise and easily updatable results, facilitating practical implementation for site management. No early researcher could have anticipated how vital this tool would become today, especially in historic cities that are major tourist destinations. The direct repercussions of tourism activity on public space use levels and tourist attractions often lead to overcrowding and congestion crises, which can pose safety risks [30,31].
Nevertheless, it is important to emphasize that estimating VCC alone is not sufficient to ensure effective visitor flow management in public spaces. First, it is important to stablish comfort and safety thresholds standards for VCC [32] or overcrowding limits [33,34] based on proxemic distances [35], taking into account the diverse events, social practices and pedestrian dynamics that occur in urban public spaces [36,37]. It is important to mention that when establishing standards, the goal is not to find a “magic number or value” but rather to create a foundation for managing visitor flows [26,28,33,38,39]. Then, it is essential to understand when, how frequently and why these thresholds are exceeded to manage situations of overcrowding and congestion effectively. For this, it is important to recognize the triggers that are enough to prompt a management response to ensure that desired conditions continue to be maintained before the threshold is crossed [10].
To achieve this, a comprehensive visitor flow management strategy also requires the robust monitoring of people flows [26,40,41]. Visitor flow monitoring is an integral part of this framework, as it involves the routine and systematic collection of information or observations to assess specific resource conditions and visitor experiences [10]; this process provides critical feedback to managers. Various studies analyse or use different types of counting methods [42,43,44], such as manual counts supported by short videos [45], visitor tracking [39], using the distribution of geotags on social networks [46] and how person counting cameras work [47] and their influence on pedestrian behaviour [48,49], among others. However, many of these studies use large-scale data, which typically lack the spatio-temporal precision required to address streets or micro-scale public spaces, which are very common in historic centres [50]. Although studies like those by Gao et al. [50] tackle this problem by using sensors that count how many people connect to open Wi-Fi networks at a micro-urban scale, there are still challenges in calculating the density of people, instead of just the number, in precise areas.
The introduction of visitor flow management digital technologies emerges as an unavoidable solution, not only to regulate overcrowding and congestion states but also to enhance security, operational efficiency and user experience. Real-time visitor flow monitoring systems provide valuable insights into overcrowding dynamics, allowing for proactive adjustments and facilitating effective people flow management, a continuous improvement in public space management and a better visitor’s experience.
This research aims to analyse people flow monitoring systems using digital technologies, particularly image sensors, to verify their utility as tourism management tools from the perspective of urban studies.
2. Methodology and Process
The research design of this work aligns with the stages suggested by Peffers et al. (2007) [51] for Design Science Research: identifying the problem and objective, proposing a solution, applying it through a case study and finally evaluating its suitability.
First of all, a review of the scientific literature on issues related to the management of visitor carrying capacity and the monitoring of pedestrian flows was conducted. Also, field-work sessions based on the direct observation of urban spaces to identify critical points and the analysis of pedestrian flows by GPS tracking techniques were carried out. Furthermore, we based this work on the results of previous studies carried out by authors related to visitor carrying capacity both in outdoor and indoor heritage sites as already mentioned and on related issues such as geospatial tools for urban studies and the physical and psychological comfort of visitors, especially those based on the use of digital geospatial tools in public open spaces
The identified problem of this research is related to the generalized overcrowding of public spaces, in this case, streets in many heritage tourism destinations. Thus, in order to verify that overcrowding is occurring in a historic public space, it is first of all necessary to know the visitor carrying capacity of the sites and thus establish their saturation conditions based on proxemic distances. It should be remembered that this type of study must be adapted to each site, since the heritage assets, urban spaces characteristics, pedestrian dynamics and local events are unique to each place. Nevertheless, the applied methodology can be extrapolated to other places.
Therefore, the objective of this research is to propose a management solution based on the development of a real-time monitoring system and methodology that allow for an understanding of the volume and density of visitor flows through image sensors. This system considers the events occurring in historic public spaces as triggers to determine when the visitor carrying capacity could potentially be exceeded, enabling public administrations or stakeholders to take informed management measures that contribute to the preventive conservation of heritage assets and their surroundings, provide a better experience for tourists and locals, and promote social sustainability.
The management of the visitor carrying capacity in pedestrian historic centres is closely linked to the monitoring of the flow of people in these spaces, although it is necessary to mention that there are spatio-temporal behavioural aspects of people that qualitatively influence the analysis [50,52]. These aspects are analysed from studies of perception, and this work does not address this visitor behavioural analysis. Therefore, this study is focused on pedestrian flow quantitative estimates, volume and density, and a geospatial analysis of places where the activity takes place.
Calculating the number of people that make up a flow is carried out by counting. There are different procedures for this, ranging from manual methods to those using sophisticated sensors as mentioned before. Two-dimensional video-cameras are highly accurate devices well suited for analysing the number of visits of people in a public space [20,47,53,54,55] and have a high reliability of up to 98% of the count [56], with good results, especially at the micro-urban scale.
Flow density is a measurement of persons per unit land area. It is, therefore, a data point related to the spatial capacity of a place that provide us information about its level of saturation. Visitor density also serves as a reliable and objective indicator of perceived crowding [33,57,58].
2.1. Study Area
In order to practically use the monitoring system, and following the example of Long & Zhang (2024) [52], digital technologies were applied as new elements in the streets of the historic centre of Valencia (Spain). This city is considered as an urban laboratory where researchers can conduct experiments, thus enabling the analysis of data generated from digital devices and the facilitation of design and implementation processes. Furthermore, situations of overcrowding and congestion were beginning to be observed in the historic centre spaces of Valencia. Therefore, it was pertinent to establish quality standards for pedestrian flows (residents and visitors) in the urban heritage space for the reasons of people’s physical and psychological comfort and also for safety reasons. Miguelete Street was the selected space for monitoring these parameters because of its geographical location, flanking a cathedral and connecting two socially and touristically significant squares in Valencia, La Virgen and La Reina (Figure 1). This street is a linear urban space where access to the cathedral, that is the most important religious building of the city, is compulsory. It is between 5 and 8 m wide and allowed for a good angle of view for the camera on the movements of people in the space, making it a noteworthy testing area. This street has high pedestrian traffic, especially visitors, and holds a scarce presence of static activities in the public space (such as restaurants or cafes’ outdoor dining areas, only some street vendor stalls) that can obstruct the walkway other than people themselves.
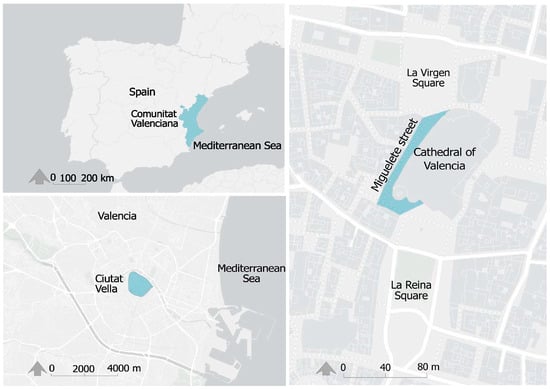
Figure 1.
Location map of studied area.
2.2. Pedestrian Behaviour
The pedestrian patterns on this street are similar to those found in other historic centres in Spain, such as Barcelona [48], where visitor flow peaks during weekends compared to the rest of the week. Additionally, there is noticeable seasonality typical of tourist attractions, with visitor numbers increasing during the summer season [59]. Furthermore, distortions in these patterns can be observed during local events, such as festivals, which result in a significant rise in pedestrian traffic on those dates [40]. Regarding daily activities on the street under study, it was observed that the street mainly serves as a transit route between the two urban plazas it connects. There is also a noticeable presence of tourist groups stopping to observe parts of the cathedral, along with individuals sitting to rest, as well as small groups approaching nearby shops.
2.3. Video-Cameras for Pedestrian Counting Features
For this work, the chosen motion image sensors were 2D video-cameras with person recognition software that provide accurate data and can track people’s movements in detail, providing information continuously and remotely. The cameras used were CPF-SENSOR (model WTK10070) from Witeklab (Barcelona, Spain), whose features and specifications are shown in Table 1 and Table 2.

Table 1.
Technical camera’s features.

Table 2.
Technical camera’s specifications.
Knowing the specifications, it is possible to determine the visual field, which is 106° based on the following formula:
2 × arctan (image sensor/(2 × focal length)),
Regarding the visual field of the cameras, it is important to mention that the sensors were located on the walls and roofs of the cathedral, which are stable and protected surfaces. The sensors were placed at a height of 12 m above floor level, with a camera angle of 50° relative to the floor plane, aligning with the recommended angles suggested by Hung et al. [47]. This positioning avoids undesired movements and keeps the sensors out of reach from vandalism or theft. Considering these parameters, it was possible to cover the width of the street and obtain a suitable image area of 155 m2 for analysis by the software. As it is a heritage building, a non-invasive support system was designed to avoid making fixings and perforations on the envelope.
Using the specifications and knowing the location of the camera, it was possible to recreate the visual field on a point cloud of the street, using the open-source software Cloud Compare version 2.13 alpha (Figure 2), for posterior processing in GIS software.

Figure 2.
(a) Original camera view with person counting system. (b) Recreation of camera view using point cloud.
The station or central unit with a PC and a 4 G USB modem with a SIM were also located in a protected and discreet place, with a permanent 220 V power supply. The station performed the storage and analysis of images and sent them wirelessly to avoid the distribution of wiring in the building.
The software of these sensors pays special attention to the privacy of users following the recommendations of the Regulation (EU) 2016/679 of the European Parliament and of the Council [60] in relation to the responsibility of data management. Therefore, the software works in real time, but the data stored and sent to the servers are purely numerical. This, in turn, avoided saturating the memory of the central unit, allowing for smooth data collection over long periods of time.
2.4. Pedestrian Counting Procedure
To estimate the number of pedestrians, this work utilized computer vision technology to analyse and process image signals in real time. A Convolutional Neural Network (CNN)-based approach [61,62] was chosen due to the challenges of detecting individuals in crowded scenes, such as heavy occlusions, high person densities and significant variations in appearance [47,63] (Figure 3). The technique was optimized using high-quality pictures from an HD colour camera, in combination with a fast computing algorithm for profile person detection and movement tracking in the street. Providing simple numerical data simplifies the movement tracking problem into a flow of an array of numerical indexes representing boxes associated with persons.

Figure 3.
Example of Convolutional Neural Network (CNN) structure. Source: Own elaboration based on Girshick et al. (2014) [61].
The algorithm was developed using Machine Learning (ML) to automatically create models for detecting movements. By analysing relational data with Graphical Neural Networks (GNNs), the algorithm processes complex relationships between objects, suitable for various applications, including pedestrian traffic analysis. We created an object detector using a CNN for image classification, incorporating detection as suggested by Girshick et al. (2014) [61]. This involves creating a “small square” with the positions x and y, high and wide of the found object (Figure 2a). The problem consists of localizing areas in the images that, for a neuronal network, are just a matrix of colour pixels, to position various objects and classify them in an efficient and fast way. For these purposes, several libraries from TensorFlow were used in the Python 3.6+ environment.
2.5. Data Processing
The data collected by the video-cameras were sent to a server in the cloud where they could be accessed in numerical or graphical form at any time from any device with an internet connection. After that, these data were processed using Excel spreadsheets (version v2019). This allowed us to obtain the results of the counts quantitatively and graphically every 10 s.
The data were grouped by days within the interval of 9:00–19:00, maintaining readings taken every 10 s. This allowed for the detection of peak moments in the number of people throughout the day. To facilitate reading the resulting graph, a temporal marker as added every 30 min, showing the relative occurrences of these peaks. Proxemic threshold values were introduced as a constant, providing a clear visualization of the saturation threshold at any given moment.
Although data for the entire year are available, three representative dates were selected to demonstrate the methodology, based on specific events occurring on these days, which will be explained in a further section:
- 23 November 2023, as a typical day with a regular weekly event;
- 5 March 2024, during a local holiday season;
- 12 May 2024, coinciding with a specific local festivity.
2.6. Establishment of Target Scene Area by Geo-Processing Tools
The establishment of the Target Scene Area is crucial in the analysis of the pedestrian flow, because it is the pilot area from which the volume and density of the flux is estimated. It allows us to determine the effective measurement and classification of crowding states and to understand overcrowding dynamics (spatio-temporal behaviours of people) in these areas by interpreting their visit time preferences.
The first step in the process was to determine the Usable Surface for Visitation within the field of vision of the camera. This was achieved after the viewshed was obtained from a 3D model derived from a point cloud and a micro-urban-scale DTM of the street. The digitization process is detailed in previous works [29,64]. The viewshed was calculated with ArcGIS Pro 3.2.2 (Figure 4) and cross-referenced and refined with frames taken directly from the camera to validate the results.
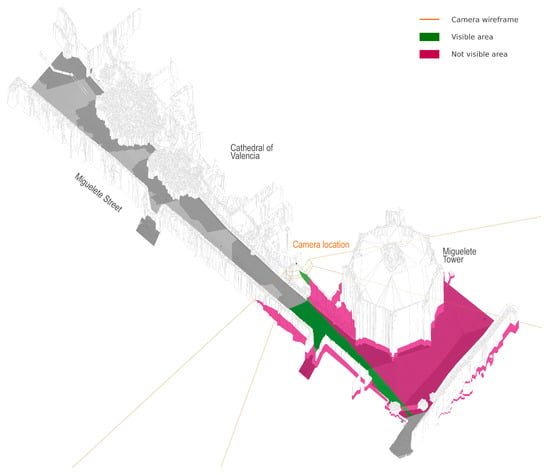
Figure 4.
The calculated viewshed based on the camera on Miguelete Street.
The visual area provided by the camera was treated as a fixed image. The polygon where the count took place was estimated based on the distance a pedestrian can walk every 10 s at a leisurely pace. The average walking speed of pedestrians was not monitored in this study; instead, a fixed average speed of 1.3 m/s was established, based on a study of Gianoulaki (2024) [65]. This allowed us to set a walking distance of 13 m. Considering the distance travelled by the pedestrian in Miguelete Street, the resulting Target Scene Area is 78.36 m2.
Additionally, to obtain an effective walking area, the fixed-object effective width and shy distance of the surrounding walls and obstacles from the total area were subtracted, following the parameters of the National Academies of Sciences Engineering and Medicine of the USA [66]. The final effective Usable Surface for Visitation in the Target Scene Area is 57.60 m2, where the visitor’s estimations were made, as shown in Figure 5.
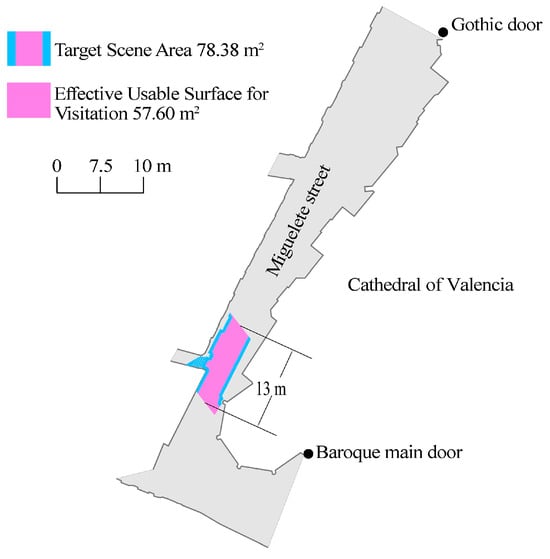
Figure 5.
Target Scene Area of Miguelete Street camera.
2.7. Setting Carrying Capacity Standards
In order to establish carrying capacity standards, thresholds and triggers for transit comfort and safety values have to be established, as suggested in previous works [32]. The standards were based on the ranges of interpersonal distance recognized in proxemic studies [35] and in other works related to studies of visitor carrying capacity in urban spaces [28].
Therefore, proxemic distance standards were established in the Usable Surface for Visitation. In this way, it was possible to determine the number of People At One Time (PAOT) the space can accommodate by finding the maximum number of points that can fit into this area. This optimization problem was solved using geo-tool algorithms on ArcGIS Pro, applying different proxemic distances for each comfort level (Figure 6). Consequently, different comfort thresholds were established for this specific area, taking into account the number of persons registered by the cameras (Table 3). For example, it was considered that when personal space distances drop below 1.20 m in the Target Scene Area, meaning more than 36 people are registered by the camera, the area can be considered saturated but acceptable. However, it should be noted that these spatial needs can vary according to the psychological and physiological profile of each type of visitor [11].
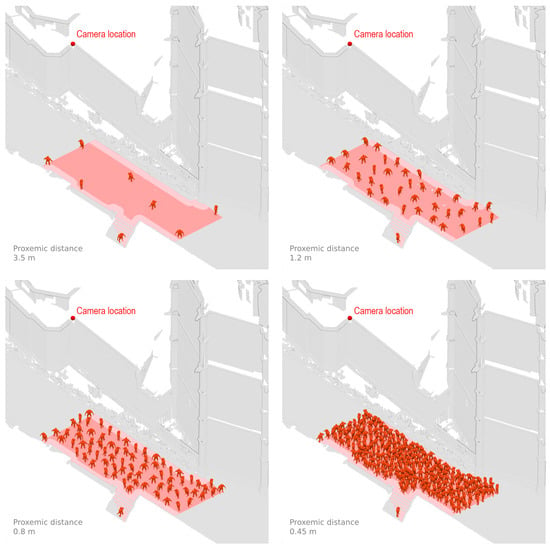
Figure 6.
Random distribution of people into polygons with proxemic distance in Usable Surface for Visitation in Miguelete Street.

Table 3.
Thresholds based on proxemic studies.
As suggested by the IVUMC [10], it is necessary to identify and establish potential triggers that could lead to comfort thresholds being exceeded. To achieve this, general data were analysed and compared with a list of events that occurred in the city of Valencia on the specified dates (Table 4). The analysis considers the frequency of these events, including daily, weekly, seasonal and annual occurrences.

Table 4.
Studied events that took place in the study area.
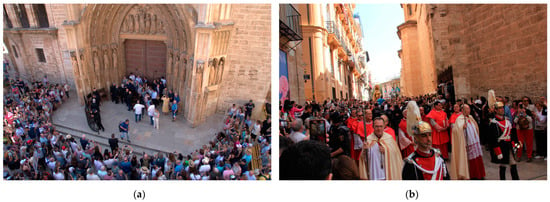
Figure 7.
(a) Tribunal de las aguas. (b) Virgen de los Desamparados procession.
Table 4.
Studied events that took place in the study area.
| Events | Description | Frequency and Duration |
|---|---|---|
| Cathedral of Valencia visiting hours | Visitors can find a variety of historic, religious and artistic attractions, with the Holy Grail as the main one. | Paid visit hours: Monday–Saturday from 10:30 to 18:30 and Sunday from 14:00 to 17:30 (in summer season until 18:30) Free visit hours: Monday–Saturday from 7:30 to 10:00 and 18:30 to 20:30 Sunday from 7:30 to 13:30 and 17:30 to 20:30 |
| Tribunal de las Aguas (Water Tribunal of the plain of Valencia) (Figure 7a) | A traditional event, designated as an Intangible Cultural Heritage by UNESCO, that happens on the Gothic door of the cathedral. | Every Thursday at 12:00 Variable duration |
| Mascletà | Firework acoustic spectacle designated as an Intangible Cultural Heritage by UNESCO. Happens on Fallas holiday season in Valencia on the Plaza del Ayuntamiento. | From March 1st to 19th (Fallas season) at 14:00 The duration varies from 6 to 8 min |
| Virgen de los Desamparados festivity(Figure 7b) | Various events take place throughout the day, with the most important being the procession of the Virgin from the Basilica to the cathedral. The procession enters through the Baroque door and travels the entire length of Miguelete Street. | Second Sunday of May. D’Infantes’ Mass: 8:00 Procession: 10:30 Pontifical Mass: 12:00 Fireworks (Mascletà): 14:00 |
Finally, all this information was synthesized into graphs that provide a comparative visualization of carrying capacity, events, proxemic thresholds and triggers. The graphs representing the results for each of the mentioned days include the following information:
- The lower abscissa shows the time slots every 30 min during which the data collection took place. Thus, it can be observed that the camera began the data collection at 9:00 and concluded at 19:00.
- The ordinate axis shows ranges related to the number of people counted by the cameras.
- The horizontal lines indicate various comfort thresholds based on proxemic interpersonal distances (Table 3), corresponding to the number of people counted. These lines provide insight into flow density and alert us to potential violations of the established limits.
- The base coloured band of the graph indicates the range of people where the comfort level remains acceptable up until it approaches the saturation point.
- Marks that show the peaks in the number of people indicate the triggers or conditions of concern that are significant enough to prompt a management response. This ensures that the desired conditions are maintained before the threshold is crossed [10].
3. Results and Performance Evaluation
The results presented in this work serve as examples of the functioning of the real-time monitoring visitor flow system implemented on Miguelete Street in Valencia. Below, the graphs explained before are presented to illustrate different states of visitor numbers. By establishing the Target Scene Area and proxemic distance standards, it is possible to determine the number of people that the Usable Surface for Visitation can accommodate by calculating the maximum points that can fit within an irregular polygon.
3.1. Real-Time Monitored Persons in the Usable Surface for Visitation of the Target Scene Area on 23 November 2023
Data were collected for each day with respective thresholds and triggers. On 23 November 2023 (Figure 8), the total number of pedestrians was 38,436. Two triggers related to events were identified. The first occurred at 12:21:21 with 56 people, surpassing one of the proposed thresholds continuously. This time coincides with the end of the Tribunal de las Aguas (Water Tribunal of the plain of Valencia) event. The second trigger occurred at 6:04:00 p.m., with 49 people, once again surpassing a threshold. This is associated with the start of free visits to the Valencia Cathedral, which begins at 18:30.
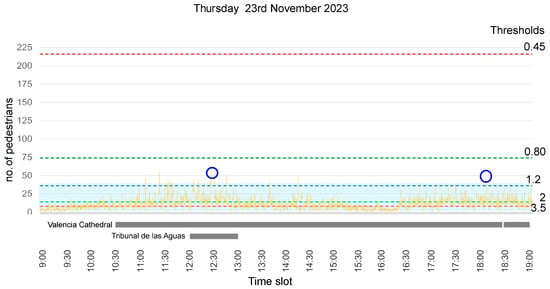
Figure 8.
Visitor flow curve on 23 November 2023. The yellow line represents pedestrian counts, while the blue circles indicate peak moments that could prompt a management response.
3.2. Real-Time Monitored Persons in the Usable Surface for Recreation of the Target Scene Area on 5 March 2024
Figure 9 shows a graph of the pedestrian count for 5 March 2024. On this day, 54,696 persons were recorded. A trigger occurred at 14:13:59 with 60 pedestrians, surpassing one of the established thresholds. This trigger coincides with the end of the Fallas’ fireworks (Mascletà) at a place close to Miguelete Street. Notably, there is a significant drop in pedestrian density in the minutes before and after 14:00, almost to a complete halt, followed by a rapid recovery of the flow after the event concludes because Miguelete Street is a key transit street. The next trigger was produced at 17:52:50 and is again linked to the end of the guided tours and the beginning of free visits to the Valencia Cathedral at 18:30.
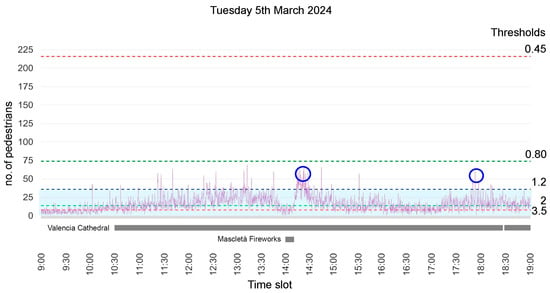
Figure 9.
Visitor flow curve on 5 March 2023. The purple line represents pedestrian counts, while the blue circles indicate peak moments that could prompt a management response.
3.3. Real-Time Monitored Persons in the Usable Surface for Visitation of the Target Scene Area on 12 May 2024
The results for 12 May 2024 (Figure 10) were taken on the day of the local religious festivities of Virgen de los Desamparados, which was also monitored simultaneously in the field. The total number of people for this day was 147,058. The graph shows that from the beginning of the monitoring period, the comfort level exceeded the desirable value. The monitoring started at 9:00:00:28 with a count of 67 pedestrians, following the conclusion of the D’Infants’ Mass, which began at 8:00. The first trigger was detected at 9:46:28 with 140 pedestrians, maintaining a very high flow level until 10:00, when the procession of the Virgen, starting from the Basilica de los Desamparados on the Plaza de la Virgen, began. The second trigger occurred at 10:52:53 with 157 people, exactly when the Virgen passed through the studied Usable Surface for Visitation. After this moment, there was a marked decrease until 12:00, the start time of the Pontifical Mass held inside the Cathedral of Valencia. The third trigger, at 13:01:21, with 111 pedestrians, coincides with the end of the Pontifical Mass inside the cathedral. The last trigger, at 14:20:44, with 86 pedestrians, coincides again with the end of the onsite fireworks (Mascletà) in honour of Virgen de los Desamparados. There was a significant drop in pedestrian density minutes after and before this. The graph shows a steep upward slope, indicating a rapid recovery flow.
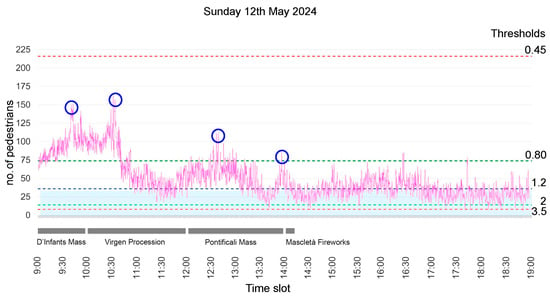
Figure 10.
Visitor flow curve on 12 May 2024. The pink line represents pedestrian counts, while the blue circles indicate peak moments that could prompt a management response.
3.4. Comparative Contextual Evaluation of Three Visitation Events
Finally, Figure 11 shows a comparison between the three days with different characteristics. It is evident that the events on May 12th significantly differ from the others in terms of the level of discomfort experienced by people.
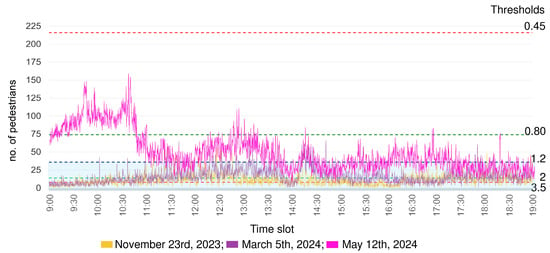
Figure 11.
Comparative visitor flow curves on the studied dates.
It is particularly interesting within the framework of visitor carrying capacity studies to observe that establishing thresholds associated with proxemic standards and identifying triggers are key elements in defining the different types of visitor flows that will occur in a given location. These factors set a trend in the analysis, which is crucial for designing preventive actions and early warnings of saturation and congestion later. However, it is important to remember, as previously mentioned, that while proxemic thresholds tend to be quite similar across various locations and cultures, triggers are unique to each specific place. Therefore, it is essential to thoroughly analyse the local urban cultural agenda and understand the regular events that impact the analysed public space, as these will serve as the reference points for establishing a particular type of flow.
4. Conclusions
The initial goal of this methodological work, which was to identify a solution for monitoring visitor carrying capacity using digital technologies, was successfully achieved. A real-time monitoring system was developed, tested and evaluated to determine its technical feasibility as a tool that contributes to the preventive conservation of heritage assets and their surroundings, enhances the tourist experience and promotes social sustainability. Its potential as a predictive tool was also demonstrated, enabling public administrations and heritage managers to take and implement informed management measures in advance.
It is important to note that during the experimentation process, numerous factors specific to the local heritage environment had to be considered. As mentioned earlier, each site has unique characteristics that influence the development of this work; however, the method was proven to be adaptable and applicable to other contexts.
In terms of digital technologies, it is important to highlight that the use of monitoring systems with image sensors, as proposed in this study, proves to be both highly suitable and innovative for micro-scale public spaces within historic districts. The technological equipment used was technically and economically feasible, as there are devices available on the market that, when properly programmed, can be employed for this purpose without significant difficulties and at a reasonable cost. Additionally, person recognition and counting software was applied, achieving high accuracy and delivering optimal results. The combined use of 3D urban models and GISs was proven to be a key geospatial tool, essential for integrating all the technological developments involved in a real-time monitoring system for a dynamic public space which requires constant updates.
Even if counting methods using new technologies, geo-tools and tourism management techniques have been used to measure visitor and pedestrian dynamics, the combination of these approaches presents a more comprehensive and innovative solution for the real-time monitoring and management of public spaces, especially in complex and sensitive urban environments like historic centres.
The use of visitor capacity standards and data analysis through the establishment of thresholds and triggers was proven to be highly effective in understanding visitor flows. This approach will likely be one of the most original and significant contributions of this work, as these factors have a predictive nature that is crucial for public administrations and heritage managers to proactively address situations of overcrowding and congestion. It is important to note that the thresholds and triggers identified in this study are specific to the local context; in other locations, these factors will differ according to each area’s unique characteristics. Additionally, it is essential to acknowledge that not all visitation patterns can be anticipated, as human behaviour is often unpredictable. However, certain situations occur regularly and therefore hold predictive value.
Similarly, other limitations appear, such as identifying events that may act as triggers. While it is possible to recognize official events like local traditional festivals, there is a wide range of informal or spontaneous events, such as those created by street performers or protests, which are not comprehensively tracked. Another limitation is the use of global proxemic distances, which may not fully account for the heterogeneity of pedestrians; in other contexts, these measures might vary according to cultural environments, as other authors suggest [35]. On a technical level, a further challenge involves managing the data collected by cameras, requiring database systems capable of handling large volumes of information; data loss can also occur due to issues such as signal disruptions, power failures or data transmission errors.
Regarding the experimental development of the system carried out in Valencia’s historic centre, it is important to highlight that, once the visitor carrying capacity of Miguelete Street was established, the real-time visitor monitoring system was tested and evaluated by analysing various key visitor flow situations to assess the system’s behaviour and the results it provided. The data collected reflect highly accurate situations, corroborated by direct observation. However, this study provided precise quantitative data that had never before been available in the city of Valencia. These data made it possible to identify when (events, situations, etc.), for how long and with what intensity the established visitor carrying capacity for this key transit street was exceeded.
Expanding the collection of annual data series and developing digital models for a larger urban area will allow for a deeper understanding of visitor flow patterns across a broader section of Valencia’s historic centre. Moreover, this methodology can be extrapolated to other historic centres for validation, extending beyond streets to include other public spaces such as plazas, parks or even indoor areas with high visitor traffic. Additionally, the gathered data could be integrated into existing city and heritage management databases, enabling comparisons across different layers of the urban fabric. Comparative studies between our methodology and those proposed by other researchers could also be conducted. Ultimately, this research has the potential to enable true Smart Public Space Management, addressing not only tourism but also broader urban dynamics.
Author Contributions
Conceptualization, M.J.V. and P.R.O.C.; methodology, M.J.V., P.R.O.C., P.T. and J.M.G.-R.; software, P.R.O.C., P.T. and J.M.G.-R.; validation, M.J.V. and P.R.O.C.; formal analysis, M.J.V. and P.R.O.C.; investigation, M.J.V., P.T. and P.R.O.C.; resources, M.J.V. and J.M.G.-R.; data curation, P.R.O.C. and P.T.; writing—original draft preparation, M.J.V. and P.R.O.C.; writing—review and editing, P.R.O.C. and M.J.V.; visualization, P.R.O.C. and P.T.; supervision, M.J.V.; project administration, M.J.V.; funding acquisition, M.J.V. All authors have read and agreed to the published version of the manuscript.
Funding
This research was funded by the project “Analysis and Development of HBIM Integration into GIS for Creating a Cultural Heritage Tourism Planning Protocol” (ref. PID2020-119088RB-I00), funded by the Ministry of Science and Innovation, Government of Spain, and the “Programa de Ayudas de Investigación y Desarrollo (PAID-01-22)” by the Universitat Politècnica de València.
Data Availability Statement
The datasets used and/or analysed during the current study are available from the first author upon reasonable request.
Conflicts of Interest
The authors declare no conflicts of interest.
References
- Mehta, V. The Street: A Quintessential Social Public Space; Routledge: Nueva York, NY, USA, 2013; ISBN 9780203067635. [Google Scholar]
- García-Hernández, M.; de la Calle-Vaquero, M.; Yubero, C. Cultural Heritage and Urban Tourism: Historic City Centres under Pressure. Sustainability 2017, 9, 1346. [Google Scholar] [CrossRef]
- Laitinen, R.; Cohen, T.V. Cultural History Of Early Modern Streets. In Cultural History of Early Modern European Streets; BRILL: Leiden, The Nederland, 2009; ISBN 9789047425984. [Google Scholar]
- Massengale, J.; Dover, V. Street Design: The Secret to Great Cities and Towns; Wiley: Hoboken, NJ, USA, 2014; ISBN 978-1-118-06670-6. [Google Scholar]
- Viñals, M.J.; Mayor, M.; Martínez-Sanchis, I.; Teruel, L.; Alonso-Monasterio, P.; Morant, M. Turismo Sostenible y Patrimonio: Herramientas Para La Planificación y Gestión; Editorial Universitat Politècnica de València: Valencia, España, 2017; ISBN 978-84-9048-618-4. [Google Scholar]
- Wagar, J.A. The Carrying Capacity of Wild Lands for Recreation; Forest Science; Society of American Foresters: Washington, DC, USA, 1964. [Google Scholar]
- McCool, S.F.; Lime, D.W. Tourism Carrying Capacity: Tempting Fantasy or Useful Reality? J. Sustain. Tour. 2001, 9, 372–388. [Google Scholar] [CrossRef]
- Coccossis, H.; Mexa, A. The Challenge of Tourism Carrying Capacity Assessment: Theory and Practice; New Directions in Tourism Analysis; Ashgate: Farnham, UK, 2004; ISBN 9780754635697. [Google Scholar]
- Zelenka, J.; Kacetl, J. The Concept of Carrying Capacity in Tourism. Amfiteatru Econ. 2014, 16, 641–654. [Google Scholar]
- IVUMC. Monitoring Guidebook Evaluating Effectiveness of Visitor Use Management; Interagency Visitor Use Management Council Consists: Washington, DC, USA, 2019. [Google Scholar]
- Manning, R.; Lawson, S.; Newman, P.; Laven, D.; Valliere, W. Methodological Issues in Measuring Crowding-Related Norms in Outdoor Recreation. Leis. Sci. 2002, 24, 339–348. [Google Scholar] [CrossRef]
- U.S. Congress. National Park Service and Related Programs; U.S. Government Printing Office: Washington, DC, USA, 2014. [Google Scholar]
- Zacarias, D.A.; Williams, A.T.; Newton, A. Recreation Carrying Capacity Estimations to Support Beach Management at Praia de Faro, Portugal. Appl. Geogr. 2011, 31, 1075–1081. [Google Scholar] [CrossRef]
- Queiroz, R.E.; Ventura, M.A.; Guerreiro, J.A.; Cunha, R.T. da Carrying Capacity of Hiking Trails in Natura 2000 Sites: A Case Study from North Atlantic Islands (Azores, Portugal). Rev. Gestão Costeira Integr. 2014, 14, 233–242. [Google Scholar] [CrossRef][Green Version]
- Viñals, M.J.; Planelles, M.; Alonso-Monasterio, P.; Morant, M. Recreational Carrying Capacity on Small Mediterranean Islands. Cuad. Tur. 2016, 37, 437–463. [Google Scholar] [CrossRef]
- Guo, W.; Chung, S. Remaking Tourism Carrying Capacity Frameworks for Geoparks. In Proceedings of the 4th International Conference on Advances in Social Science, Humanities, and Management (ASSHM 2016); DEStech Publications, Inc.: Guangzhou, China, 2016; pp. 197–205. [Google Scholar]
- Santos, P.L.A.; Brilha, J. A Review on Tourism Carrying Capacity Assessment and a Proposal for Its Application on Geological Sites. Geoheritage 2023, 15, 47. [Google Scholar] [CrossRef]
- Silva, C.P.; Alves, F.L.; Rocha, R. The Management of Beach Carrying Capacity: The Case of Northern Portugal. J. Coast. Res. 2007, 50, 135–139. [Google Scholar] [CrossRef]
- García Hernández, M. Capacidad de Acogida Turística y Gestión de Flujos de Visitantes En Conjuntos Monumentales: El Caso de La Alhambra. PH Boletín. Doss. Tur. En Ciudad. Históricas 2001, PH 36, 124–137. [Google Scholar] [CrossRef]
- Zubiaga, M.; Izkara, J.L.; Gandini, A.; Alonso, I.; Saralegui, U. Towards Smarter Management of Overtourism in Historic Centres Through Visitor-Flow Monitoring. Sustainability 2019, 11, 7254. [Google Scholar] [CrossRef]
- Petronijević, A. Practical Application of the Tourism Carrying Capacity Concept in Cultural Tourism: Example of the Maritime Museum of Montenegro. Turizam 2022, 26, 114–123. [Google Scholar] [CrossRef]
- Viñals, M.J.; Alonso-Monasterio, P.; Alonso-Monasterio, M. Analysis of the Spatial Standards and Perceptual Components of the Recreational Carrying Capacity Applied to Archaeological Sites: Case Study of Castellet de Bernabé (Llíria, Spain). In Methods and Analysis on Tourism and Environment; Mondéjar Vargas, O., Perez, C., Eds.; Nova Science Publishers: New York, NY, USA, 2013; pp. 109–120. [Google Scholar]
- Lopes Martins, J. Analysis of Tourism Capacity in Historic Centres: The Case of Porto; Universidade do Porto: Porto, Portugal, 2021. [Google Scholar]
- Santos, X.M.; Pena Cabrera, L. Management of Tourist Flows. The Cathedral of Santiago de Compostela. PASOS Rev. Tur. Patrim. Cult. 2014, 12, 719–735. [Google Scholar] [CrossRef]
- Makhadmeh, A.; Al-Badarneh, M.; Rawashdeh, A.; Al-Shorman, A. Evaluating the Carrying Capacity at the Archaeological Site of Jerash (Gerasa) Using Mathematical GIS Modeling. Egypt. J. Remote Sens. Sp. Sci. 2020, 23, 159–165. [Google Scholar] [CrossRef]
- de Almeida, D.S.B. Urban Tourism Crowding Dynamics: Carrying Capacity and Digital Twinning; University Institute of Lisbon: Lisbon, Portugal, 2021. [Google Scholar]
- Jurišić, M.; Plaščak, I.; Rendulić, Ž.; Radočaj, D. GIS-Based Visitor Count Prediction and Environmental Susceptibility Zoning in Protected Areas: A Case Study in Plitvice Lakes National Park, Croatia. Sustainability 2023, 15, 1625. [Google Scholar] [CrossRef]
- de Almeida, D.S.; Simões, R.; Brito e Abreu, F.; Lopes, A.; Boavida-Portugal, I. A Carrying Capacity Calculator for Pedestrians Using OpenStreetMap Data: Application to Urban Tourism and Public Spaces. arXiv 2024, arXiv:2406.16781. [Google Scholar]
- Orozco Carpio, P.R.; Viñals, M.J.; Escudero, P.A.; Rolim, R.C.V.S. Geospatial Tools for Determining Visitor Carrying Capacity in Tourist Streets and Public Spaces of Historic Centres. Heritage 2023, 6, 7100–7114. [Google Scholar] [CrossRef]
- Liu, M.; Li, L.; Li, Q.; Bai, Y.; Hu, C. Pedestrian Flow Prediction in Open Public Places Using Graph Convolutional Network. ISPRS Int. J. Geo-Inform. 2021, 10, 455. [Google Scholar] [CrossRef]
- Helbing, D.; Molnár, P.; Farkas, I.J.; Bolay, K. Self-Organizing Pedestrian Movement. Environ. Plan. B Plan. Des. 2001, 28, 361–383. [Google Scholar] [CrossRef]
- IVUMC Visitor Use Management Framework. A Guide to Providing Sustainable Outdoor Recreation; Interagency Visitor Use Management Council: Washington, DC, USA, 2016. [Google Scholar]
- Enseñat-Soberanis, F.; Blanco-Gregory, R. Crowding Perception at the Archaeological Site of Tulum, Mexico: A Key Indicator for Sustainable Cultural Tourism. Land 2022, 11, 1651. [Google Scholar] [CrossRef]
- Jacobsen, J.K.S.; Iversen, N.M.; Hem, L.E. Hotspot Crowding and Over-Tourism: Antecedents of Destination Attractiveness. Ann. Tour. Res. 2019, 76, 53–66. [Google Scholar] [CrossRef]
- Hall, E.T. The Hidden Dimension; Reprint (1.; Anchor Books: New York, NY, USA, 1966; ISBN 0385084765. [Google Scholar]
- Carmona, M. Explorations in Urban Design. An Urban Design Research Primer, 1st ed.; Routledge: Nueva York, NY, USA, 2014; ISBN 978-1-4094-6264-4. [Google Scholar]
- Carmona, M.; Heath, T.; Oc, T.; Tiesdell, S. Urban Spaces-Public Places: The Dimensions of Urban Design, 1st ed.; Elsevier: Oxford, UK, 2003; ISBN 0-7506-36327. [Google Scholar]
- Tokarchuk, O.; Barr, J.C.; Cozzio, C. How Much Is Too Much? Estimating Tourism Carrying Capacity in Urban Context Using Sentiment Analysis. Tour. Manag. 2022, 91, 104522. [Google Scholar] [CrossRef]
- Park, H. Measuring & Managing Park Carrying Capacity Final Report: August 2020; University of British Columbia: Vancouver, BC, Canada, 2020. [Google Scholar]
- Teruel-Recio, P.; Vinals, M.J.; Gandia, J.M.; Orozco-Carpio, P.R. Study of Visitor Flows in Heritage Streetscapes Based on Counting People Using Motion-Image Sensors. The Case of Valencia Cathedral (Spain). In Proceedings of the International Congress proceedings: International Congress for Heritage Digital Technologies and Tourism Management HEDIT 2024, Valencia, Spain, 20–21 June 2024; Vinals, M.J., Lopez-Gonzalez, C., Eds.; Editorial Universitat Politècnica de València: Valencia, Spain, 2024; pp. 374–384. [Google Scholar]
- International Association of Public Transport (UITP); Walk21 Foundation. Urban Mobility Indicators for Walking and Public Transport; International Association of Public Transport: Brussels, Belgium, 2019. [Google Scholar]
- Nordback, K.; Kothuri, S.; Petritsch, T.; McLeond, P.; Rose, E.; Twaddell, H. Exploring Pedestrian Counting Procedures; FHWA-HPL- 16-026; U.S. Department of Transportation: Washington, DC, USA, 2016. [Google Scholar]
- Basil Read, J.; Daniels, M.; Harmon, L. Implementing Technology-Based Visitor Counts in Parks: A Methodological Overview. J. Park Recreat. Admi. 2021, 39, 85–103. [Google Scholar] [CrossRef]
- Sevtsuk, A. Estimating Pedestrian Flows on Street Networks. J. Am. Plan. Assoc. 2021, 87, 512–526. [Google Scholar] [CrossRef]
- Amen, M.A.; Afara, A.; Nia, H.A. Exploring the Link between Street Layout Centrality and Walkability for Sustainable Tourism in Historical Urban Areas. Urban Sci. 2023, 7, 67. [Google Scholar] [CrossRef]
- Martí, P.; García-Mayor, C.; Serrano-Estrada, L. Taking the Urban Tourist Activity Pulse through Digital Footprints. Curr. Issues Tour. 2021, 24, 157–176. [Google Scholar] [CrossRef]
- Hung, D.-H.; Hsu, G.-S.; Chung, S.-L.; Saito, H. Real-Time Counting People in Crowded Areas by Using Local Empirical Templates and Density Ratios. IEICE Trans. Inf. Syst. 2012, E95.D, 1791–1803. [Google Scholar] [CrossRef]
- Yoshimura, Y.; Amini, A.; Sobolevsky, S.; Blat, J.; Ratti, C. Analysis of Pedestrian Behaviors through Non-Invasive Bluetooth Monitoring. Appl. Geogr. 2017, 81, 43–51. [Google Scholar] [CrossRef]
- Lee, J.M. Exploring Walking Behavior in the Streets of New York City Using Hourly Pedestrian Count Data. Sustainability 2020, 12, 7863. [Google Scholar] [CrossRef]
- Gao, Y.; Liu, S.; Wei, B.; Zhu, Z.; Wang, S. Using Wi-Fi Probes to Evaluate the Spatio-Temporal Dynamics of Tourist Preferences in Historic Districts’ Public Spaces. ISPRS Int. J. Geo-Inf. 2024, 13, 244. [Google Scholar] [CrossRef]
- Peffers, K.; Tuunanen, T.; Rothenberger, M.A.; Chatterjee, S. A Design Science Research Methodology for Information Systems Research. J. Manag. Inf. Syst. 2007, 24, 45–77. [Google Scholar] [CrossRef]
- Long, Y.; Zhang, E. City Laboratory: Embracing New Data, New Elements, and New Pathways to Invent New Cities. Environ. Plan. B Urban Anal. City Sci. 2024, 51, 1068–1072. [Google Scholar] [CrossRef]
- Ashkanani, A.M.; Roza, A.S.M.; Naghavipour, H. A Design Approach of Automatic Visitor Counting System Using Video Camera. IOSR J. Electr. Electron. Eng. Ver. I 2015, 10, 62–67. [Google Scholar] [CrossRef]
- Goto, I.; Ueda, K.; Matsuda, Y.; Suwa, H.; Yasumoto, K. BLESS: BLE Based Street Sensing for People Counting and Flow Direction Estimation. In Proceedings of the 2024 IEEE International Conference on Pervasive Computing and Communications Workshops and other Affiliated Events (PerCom Workshops), Biarritz, France, 11–15 March 2024; pp. 76–81. [Google Scholar]
- Liu, W.; Salzmann, M.; Fua, P. Context-Aware Crowd Counting. In Proceedings of the 2019 IEEE/CVF Conference on Computer Vision and Pattern Recognition (CVPR), Long Beach, CA, USA, 15–20 June 2019; pp. 5094–5103. [Google Scholar]
- Affluences ¿Por Qué Elegir Las Cámaras de Conteo de Personas Para Gestionar Los Flujos de Visitantes? Available online: https://www.pro.affluences.com/es/post/cámaras-de-conteo-de-personas (accessed on 1 July 2024).
- Rapoport, A. Toward a Redefinition of Density. Environ. Behav. 1975, 7, 133–158. [Google Scholar] [CrossRef]
- Döringer, S.; Porst, F.; Stumpf, L.; Heurich, M. The Relationship between Measured Visitor Density and Perceived Crowding Revisited: Predicting Perceived Crowding in Outdoor Recreation. Leis. Sci. 2023, 1–24. [Google Scholar] [CrossRef]
- VisitValencia. Estadísticas de Turismo. Valencia, Spain. 2022. Available online: https://fundacion.visitvalencia.com/sites/default/files/media/downloadable-file/files/Folleto_Estadisticas_2022_WEB.pdf (accessed on 22 October 2024).
- European Parliament, C. of the E.U. Reglamento (UE) 2016/679 del parlamento europeo Y del consejo de 27 de abril de 2016, relativo A la protección de las personas físicas en lo que respecta AL tratamiento de datos personales Y A LA libre circulación de estos datos Y por el que se deroga LA. In Protección de Datos Personales; Dykinson: Madrid, Spain, 2016; pp. 17–144.
- Girshick, R.; Donahue, J.; Darrell, T.; Malik, J. Rich Feature Hierarchies for Accurate Object Detection and Semantic Segmentation. In Proceedings of the 2014 IEEE Conference on Computer Vision and Pattern Recognition, Columbus, OH, USA, 23–28 June 2014; pp. 580–587. [Google Scholar]
- Li, L. A Crowd Density Detection Algorithm for Tourist Attractions Based on Monitoring Video Dynamic Information Analysis. Complexity 2020, 2020, 6635446. [Google Scholar] [CrossRef]
- Rodriguez, M.; Laptev, I.; Sivic, J.; Audibert, J.-Y. Density-Aware Person Detection and Tracking in Crowds. In Proceedings of the 2011 International Conference on Computer Vision, Barcelona, Spain, 6–13 November 2011; pp. 2423–2430. [Google Scholar]
- Orozco Carpio, P.R.; Viñals, M.J.; López-González, M.C. 3D Point Cloud and GIS Approach to Assess Street Physical Attributes. Smart Cities 2024, 7, 991–1006. [Google Scholar] [CrossRef]
- Giannoulaki, M.; Christoforou, Z. Pedestrian Walking Speed Analysis: A Systematic Review. Sustainability 2024, 16, 4813. [Google Scholar] [CrossRef]
- National Academies of Sciences Engineering and Medicine. Highway Capacity Manual 7th Edition: A Guide for Multimodal Mobility Analysis, 7th ed.; National Academies Press: Washington, DC, USA, 2022; ISBN 978-0-309-27566-8. [Google Scholar]
Disclaimer/Publisher’s Note: The statements, opinions and data contained in all publications are solely those of the individual author(s) and contributor(s) and not of MDPI and/or the editor(s). MDPI and/or the editor(s) disclaim responsibility for any injury to people or property resulting from any ideas, methods, instructions or products referred to in the content. |
© 2024 by the authors. Licensee MDPI, Basel, Switzerland. This article is an open access article distributed under the terms and conditions of the Creative Commons Attribution (CC BY) license (https://creativecommons.org/licenses/by/4.0/).