Article

Neighborhood Effects on Acute Pediatric Asthma: Race, Greenspace, and PM2.5

by
Elizabeth J. Wesley
1,†,
Nathaniel A. Brunsell
1,*,
David R. Rahn
1,
Jarron M. Saint Onge
2,
Natalie J. Kane
3 and
Kevin F. Kennedy
3
1
Department of Geography and Atmospheric Science, University of Kansas, Lindley Hall, 1475 Jayhawk Blvd, Lawrence, KS 66045, USA
2
Department of Sociology, University of Kansas, Lawrence, KS 66045, USA
3
Children’s Mercy Kansas City, Kansas City, MO 64108, USA
*
Author to whom correspondence should be addressed.
Current address: World Resources Institute, Washington, DC 20002, USA.
Urban Sci. 2024, 8(4), 176; https://doi.org/10.3390/urbansci8040176
Submission received: 24 September 2024 / Revised: 14 October 2024 / Accepted: 15 October 2024 / Published: 17 October 2024

Abstract

:
Urbanization produces spatially variable landscapes where climatic, environmental, and social systems interact in complex ways that affect public health. Environmental exposure along with the associated health risks are unevenly distributed and communities of color are often disproportionately affected by poor health outcomes. Acute pediatric asthma is the most common chronic condition of childhood in developed nations and is especially prevalent in minority and low-income children. In this study, we analyze the spatial variability of neighborhood-level acute pediatric asthma emergency department (ED) visits across the Kansas City Metro Area. Using Bayesian negative binomial regression, we describe the relationships and interactions between race, low income, fractional vegetation, and PM2.5. We find significant disparities in acute pediatric asthma incidence in census tracts with different levels of poverty and percentages of non-White populations, even after accounting for neighborhood economic position. We also find that higher PM2.5 concentrations are associated with increased asthma ED visits and that a high percentage of vegetative cover reduces this effect in high-pollution neighborhoods. The magnitude of this protective effect is stronger in neighborhoods with a high proportion of non-White residents. These results suggest that investing in greenspace infrastructure may reduce the deleterious effects of PM2.5 and provide health benefits, especially in neighborhoods of color.

1. Introduction

Pediatric asthma is associated with a host of social, climatic, and environmental factors. Asthma is not a disease but rather a diverse disorder of variable presentation with the primary symptom being a chronic inflammation of the airways characterized by recurrent episodes of wheezing, coughing, shortness of breath, and tightness of chest associated with airflow obstruction [1,2,3]. Asthma is the most common chronic condition of childhood in developed nations [4]. In the United States, pediatric asthma is associated with 50 billion dollars in healthcare expenditures annually and causes significant disruptions to both children and parents due to absenteeism [3]. Pediatric asthma doubled in the United States between 1980 and 1995, and although the overall growth has slowed since then, racial disparities have increased [5]. Minority and low-income children are disproportionately affected in terms of prevalence rates, morbidity, and mortality [2,3]. Yet, little is known about how race and poverty interact with environmental factors to influence asthma prevalence.
Exposure to higher levels of air pollution has been associated with increased asthma incidence although some studies report conflicting results. In clinical settings, air pollution has been shown to affect asthma through oxidative stress which aggravates symptoms like cough and wheeze, decreases lung function, and induces airway inflammation [6]. Chang et al. [7] found that short-term increases in PM2.5 increased asthma emergency room admissions, and Delamater et al. [8] found that increasing levels of CO, NO2, and PM2.5 had a positive effect on asthma hospitalization rates. On the other hand, in a meta-analysis, Buteau et al. [9] found no evidence for the short-term effects of exposure to air pollution but did find indications of long-term effects. However, the authors note that the diversity of statistical design and exposure metrics precludes definitive conclusions. Additionally, in a review of studies on the impact of environmental factors on pediatric asthma, Pollock et al. [10] found that the spatial variation of air pollutants has not been adequately investigated, and Chen et al. [11] found that their effects on health can be underestimated if spatial relationships are ignored. Using the same dataset as this study to examine racial and spatial disparities in pediatric asthma, Kane [12] found that in neighborhoods divided by Highway 71, which was constructed through historically Black neighborhoods, highway presence is the primary hazard for acute asthma incidence. Additionally, a meta-analysis of traffic-related air pollution found moderate to high impacts on pediatric asthma [13].
Greenspace can have protective effects against asthma by reducing heat exposure and modifying pollution concentrations. Vegetation lowers temperatures by increasing the latent heat flux and reducing the urban heat island (UHI) effect [14,15]. Increased temperatures facilitate the formation of pollutants like ground-level ozone and have been shown to have a positive association with asthma incidence [16,17,18,19,20]. Vegetation can also impact concentrations of air pollutants by removing pollution through uptake, deposition, and dispersion [21,22]. Alcock et al. [23] found that increased greenspace has a negative effect on asthma incidence rate. Ayres-Sampaio et al. [24] found that lack of greenspace is positively associated with increased hospital admissions for asthma, while Feng and Astell-Burt [25] found that increased greenspace is protective against asthma incidence in areas characterized by high traffic volume. Additionally, greenspace is a modifiable factor of the urban environment and potential intervention point for improving public health.
However, social factors remain a key determinant of pediatric asthma prevalence. Brewer et al. [26] found that accounting for disproportionately higher air pollution levels in predominantly non-White neighborhoods did not attenuate the higher odds of asthma diagnosis among non-White children. Castillo et al. [27] also found that there was significant racial/ethnic inequity in the distribution of both PM2.5 exposure and associated health impacts. However, while identifying social inequalities in asthma prevalence is helpful in prioritizing resources to vulnerable neighborhoods, it is crucial to examine how modifiable risk factors like environmental hazards are contextualized within these inequalities [28]. Many studies examine the effects of social factors on asthma in isolation or the relationships between environmental and atmospheric characteristics and asthma prevalence, but few examine how the these environmental and atmospheric relationships vary across social factors. The social, environmental, and atmospheric systems in urban areas are intertwined through both the surface-energy balance and more than a century of racially motivated housing policies, civic disinvestment, and growing inequality, and increasing environmental justice and promoting health requires understanding their interactions. In this study, we characterize the neighborhood-level factors relating to acute pediatric asthma rates in the Kansas City Metro Area and how these factors vary by neighborhood social and environmental context.

2. Data and Methods

The interactions between climatic, environmental, and social systems in the Kansas City Metro Area affect acute pediatric asthma incidence. Although the distinctions between these systems are fuzzy, it is helpful to define the climate system as encompassing the measurable characteristics of the surface-energy balance including land surface temperature (LST), precipitation and weather, atmospheric gases, and particulate matter. The environmental system comprises qualities of the physical environment including land cover, fractional vegetation, zoning and land use, building characteristics, and transportation networks. The social system includes the intersecting characteristics of individuals, neighborhoods, and communities including poverty, health-care coverage, and race and ethnicity. These climatic, environmental, and social components are examined simultaneously in relation to each other to improve our understanding of urban systems as a whole rather than the sum of their parts [29].

2.1. Data

2.1.1. Study Area

The Kansas City Metropolitan Area is located at 39.0398° N latitude and 94.5949° W longitude and spans two states and six counties: Johnson and Wyandotte Counties in Kansas, and Platte, Clay, Cass, and Jackson Counties in Missouri. The Kansas City Metro Area exhibits characteristic patterns of urban sprawl (Figure 1), which is generally defined as “geographic expansion over large areas, low-density land use, low land-use mix, low connectivity, and heavy reliance on automobiles relative to other modes of travel” [30], showing a 55% increase in built area between 1972 and 2001 [31].
Like many American cities, Kansas City has a history of race-based residential housing segregation and redlining [32]. In 2010, the Black–White dissimilarity index—a commonly used measure of community-level segregation—was 62.2, indicating a high degree of Black–White residential segregation [33]. For reference, the U.S. Department of Housing and Urban Development (HUD) defines dissimilarity values of 55 and higher as indicating high segregation and values between 40 and 54 as indicating moderate segregation [34]. The overall non-White–White dissimilarity index in 2010 was 48 [33]. Additionally, the city is highly economically segregated and the poverty rate rose from 8.5% to 12.4% between 2000 and 2010 [33]. In 2010, the Urban Institute identified Kansas City as the fifth most economically segregated metropolitan area out of 100 analyzed [35]. Evidence shows that living in racially and economically segregated communities can have detrimental impacts on individual health [35].
Demographic characteristics of the Kansas City, MO-KS Metro Area from 2010 are given in Table 1.

2.1.2. Pediatric Asthma

KC Health CORE is a collaborative initiative between Children’s Mercy Hospital (CMH) and the Center for Economic Information at the University of Missouri, Kansas City (UMKC-CEI) created to investigate the geographic disparity of pediatric health outcomes. This analysis uses pediatric asthma data from 2002–2012 geocoded to street centerlines based on the patients’ home address at the time of admission. The data come from a retrospective collection of pediatric asthma encounters within the CMH network and include residents of Clay and Jackson Counties in Missouri and Cass and Johnson Counties in Kansas. Only children aged 2–18 years are considered as asthma is difficult to diagnose in very young children [3,36]. The original medical records were formatted according to Table 2 [36].
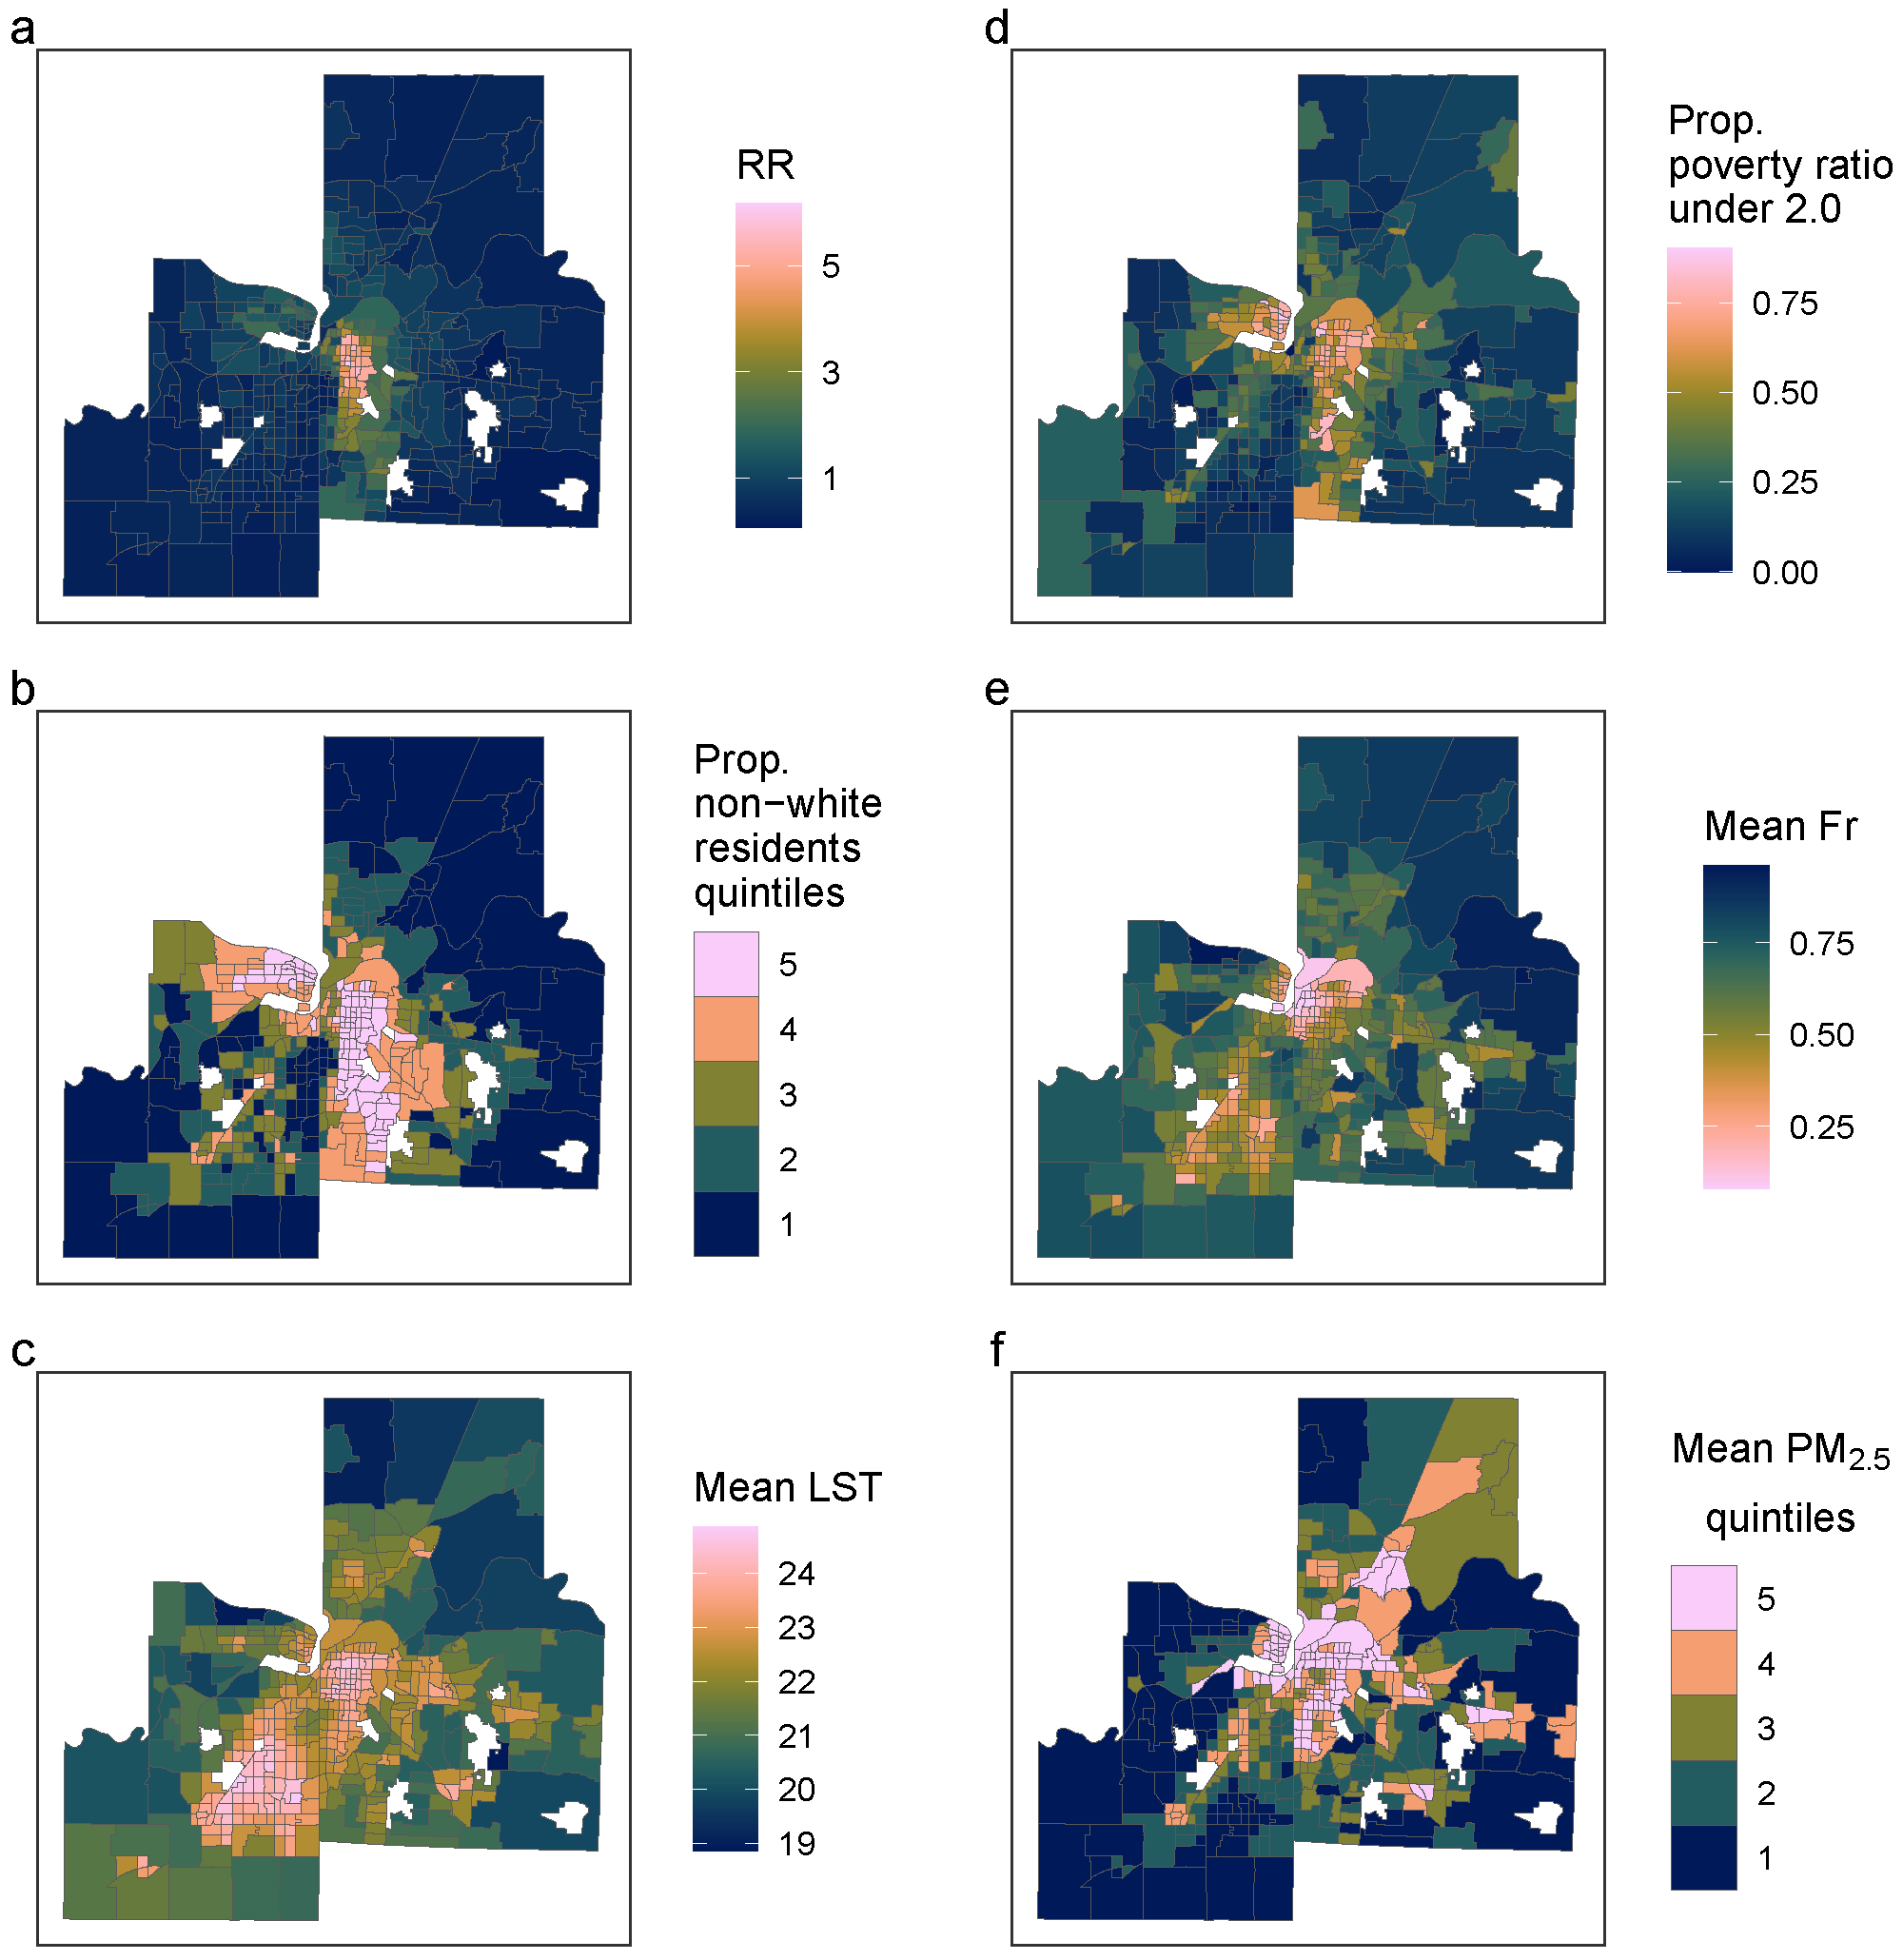
The data were further classified into three severity levels: (1) controlled visit, (2) acute care visit, and (3) hospitalization. These severity levels are constructed from the International Classification of Diseases Ninth revision diagnoses codes (ICD-9) which record the patient diagnoses and the patient class, recording both the visit location and the type of treatment received by the patient, e.g., controlled vs. acute care, inpatient vs. outpatient. Level-1 visits are controlled encounters that do not necessarily indicate presentation of symptoms, Level-2 visits are acute care visits for immediate symptoms at same-day clinics and emergency departments, and Level-3 visits are the most severe acute care visits, requiring hospitalization and/or aggressive treatment. This analysis only considers acute care visits (Levels 2 and 3). The CMH network contains the only facilities in the Kansas City metropolitan area that specialize in pediatric emergency care and emergency patients are typically transferred there from other facilities. Thus, the network is likely to capture the majority of acute and severe cases of pediatric asthma [12]. See Kane [12,36] for more details on processing of the asthma data. The asthma observations were assigned to census tracts based on the location of the home where the child was living at the time of admission. Data were further aggregated to the total count of acute asthma cases per census tract allowing us to investigate broad spatial trends (Figure 2). A total of 1 census tract and 11 associated asthma observations were discarded due to missing data, resulting in a sample of 71,381 daily acute-care asthma cases over 11 years and 427 census tracts.

2.1.3. Environmental Data

We characterized the physical environment of each census tract with the percent of vegetated cover estimated from the Moderate Resolution Imaging Spectroradiometer (MODIS) Terra Surface Reflectance Daily Global 250 m product for the years 2002–2012. Data were acquired from and calculations performed using Google Earth Engine via the R package rgee [37]. Most research on the relationship between greenspace and asthma uses the Normalized Difference Vegetative Index (NDVI) as a proxy measure for “greenness”; however, while correlated with the amount of vegetation in a pixel, NDVI does not represent a physical quantity [38]. A better measure is the fractional vegetation (Fr), a quantity derived by imposing physical constraints on NDVI [39]. Like NDVI, Fr is easily derived from freely available satellite imagery but has the additional benefits of representing a physical quantity and being less dependent on atmospheric conditions [38].
To calculate Fr, first, we calculated the NDVI, which is defined as
NDVI = ρ NIR ρ red ρ NIR + ρ red
where ρ NIR and ρ red are the surface reflectance values in the near-infrared and red bands, respectively. From NDVI, we calculated Fr, which is the vegetated proportion of a pixel and is defined as
Fr = NDVI NDVI soil NDVI veg NDVI soil 2
where NDVI soil and NDVI veg are the NDVI values corresponding to bare soil and fully vegetated pixels, respectively [39]. NDVI soil was assigned a value of 0.17 and NDVI veg was assigned a value of 0.85 based on the probability density functions of NDVI values from representative bare soil and fully vegetated pixels selected from the study area. Where there were multiple pixels intersecting a census tract, the daily median value was calculated. The NDVI value corresponding to the 99th percentile of the time series of each census tract was chosen to represent the proportion of vegetated cover as a static land cover type (Figure 2). Fr from the Landsat 7 8-Day NDVI Composite (30 m) product was also calculated to assess the sensitivity of model results to the resolution of Fr. The choice of MODIS (250 m) or Landsat (30 m) resulted in equivalent model estimates for the effect of greenspace indicating that either spatial resolution can be used effectively. We chose the MODIS data because of the high temporal resolution, which may benefit subsequent research.

2.1.4. Climatic Data

Daily land-surface temperature (LST) for each census tract was calculated from the MODIS Terra Land Surface Temperature and Emissivity Daily Global 1 km product for the years 2002–2012 using rgee and Google Earth Engine. Where there were multiple pixels intersecting a census tract, the daily median value was calculated. We then calculated the mean value for the time series for each census tract (excluding NA values). While LST values averaged over 11 years contain no information about the temporal association between acute asthmatic episodes and temperature, the LST averages reveal an uneven spatial distribution similar to that of asthma and the other risk factors (Figure 2).
We used PM2.5 concentration estimates developed by the Center for Air, Climate and Energy Solutions (CACES) using v1 empirical models as described in Kim et al. [40]. These models use land-use regression (LUR) to estimate annual air pollution concentrations at the census-block level by combining data from U.S. Environmental Protection Agency regulatory monitors, land-use characteristics, and satellite-derived estimates of air pollution. These estimates are then upscaled to the census-tract level with a population-weighted average. This dataset is freely available with coverage of the entire United States. We calculated the mean PM2.5 concentration per census tract for the years 2002–2012. These calculated means for the census tracts containing the 13 EPA monitors in the study area show good agreement ( r = 0.71 ) with the mean observed PM2.5 concentrations and exhibit the expected spatial variation (Figure 2). Additionally, we assigned PM2.5 quintile ranks to the census tracts to emphasize intra-urban variation in environmental exposure and reduce dependence on precision of the estimated means. This has the additional benefit of reducing the correlation between Fr and PM2.5. While the LUR does make use of land cover as a variable, covariates used in the PM2.5 modelling were combined using partial least squares (PLS) to reduce dimensionality; in addition, the estimated PM2.5 concentrations contribute different information than Fr.

2.1.5. Socioeconomic Data

Social data were acquired from the American Community Survey (ACS) 5-year estimates for 2010 (2006–2010) using Social Explorer and the 2010 Decennial Census using the tidycensus package for R [41]. Variables include income-to-poverty ratios from the ACS (under 1.00: doing poorly, 1.00–1.99: struggling, 2.00 and over: doing okay) [42], the proportion of non-White residents from the 2010 Decennial Census (calculated as (Total Population − Total White Alone)/Total Population), and the population under age 18 per census tract from the 2010 Decennial Census [43] (Figure 2). We aggregated the income to poverty ratio categories to under 2.00—doing poorly or struggling—and above 2.00—doing okay based on Social Explorer definitions. We opted to use the proportion of non-White residents to characterize neighborhood racial composition because studies repeatedly show that communities of color are disproportionately impacted by environmental exposure and that race-based residential segregation is linked to persistent and unequal health outcomes [44,45,46].

2.1.6. Data Processing

All data processing was performed in the R software environment for statistical computing version 4.1.2 using the tidyverse suite of packages [47,48].

2.2. Analysis Methods

2.2.1. Descriptive Analysis

The relationships between variables were first explored through descriptive analysis. Mean values of the independent variables were calculated for quintiles of asthma rates (number of cases per population under 18) to examine how they vary between census tracts with high and low rates. Relationships were also visualized by categorizing each of the independent variables into deciles and then calculating the mean asthma rate for the tracts falling within each bin.

2.2.2. Statistical Modelling

We estimated the effects of PM2.5 on acute pediatric asthma using negative binomial regression with Bayesian methods. Additionally, we investigated how greenspace moderates the relationship between air pollution and asthma and how this moderating effect differs by neighborhood social context. We controlled for social characteristics of the census tracts and included the population under 18 as an offset to control for the differing pediatric populations per census tract. All analyses were accomplished using the brms package for R [49].
The asthma counts were generated by a Poisson process with the following probability:
P ( Y i = y i | x i ) = e λ i λ i y i y i !
where λ i is the conditional mean count per census tract, otherwise known as the rate parameter. However, in a Poisson distribution, the mean and the variance are assumed to be equal. In the case of the total number of acute care asthma visits per tract, the variance far exceeds the mean ( E ( Y ) = μ = 176.28 , V a r ( Y ) = σ 2 = 25 , 478.31 ), indicating that the data are overdispersed, a quality of the distribution which, if ignored, can result in the underestimation of the uncertainty surrounding the parameters. The negative binomial distribution is a special case of the Poisson distribution which accounts for overdispersion by introducing dispersion parameter ϕ which allows the mean μ and variance σ 2 to be estimated separately. As ϕ approaches infinity, σ 2 approaches μ and the negative binomial distribution resembles the Poisson distribution. Thus, the data are represented by
y i N B ( u i , e x p ( X i , β ) , ϕ )
where u i is an exposure variable to account for uneven sampling—in this case the pediatric population per census tract, X i is the independent variables, and β is the regression coefficients [50].
Because we are interested in describing the magnitude and direction of effects as well as explicitly accounting for uncertainty in effect estimates, we made use of a Bayesian modelling framework. Bayesian methods explicitly quantify uncertainty, placing the focus on the presence and strength of effects rather than on null hypothesis significance testing [51]. Uncertainty is associated with the measurement of all variables, not least in regard to the asthma outcome data [12]. Additionally, given that pediatric asthma is associated with a number of factors from genetics to indoor allergens to atmospheric conditions, the purpose of such an analysis is not to pinpoint exact effects but to understand the structure of relationships in a manner that allows for targeted intervention.
Bayesian methods make explicit use of probability distributions to quantify inferential uncertainty and incorporate expert knowledge through the specification of prior distributions for the estimated parameters [52]. These prior distributions represent the uncertainty of our knowledge about the data-generating process before seeing the actual data. The priors are then conditioned on the observed data, resulting in posterior estimates of the parameter distributions. These posterior distributions represent intervals with a high probability of containing the quantity of interest, which allows probabalistic statements to be made about the modelled effects, an advantage over the frequentist paradigm which interprets confidence intervals only in relation to a (hypothetical and infinite) repeated series of similar trials [53].
The foundation of Bayesian inference is Bayes’ theorem,
p ( θ | d a t a ) posterior p ( d a t a | θ ) likelihood × p ( θ ) prior
which states that the probability of a parameter given the data are proportional to the probability of the data conditioned on the parameter multiplied by the marginal probability for the parameter. In other words, the posterior distribution is the the prior distribution weighted by the observed data.
The total count of acute care pediatric asthma visits between 2002 and 2012 per census tract was modelled with a log-link function to relate the mean count μ to a linear combination of k variables:
μ i = e x p ( l o g ( e x p o s u r e ) + α + β 1 x 1 i + β 2 x 2 i + . . . + β k x k i )
where i indexes the census tracts and the exposure is the total population under 18. Incorporating the exposure term accounts for the differing pediatric populations of census tracts and is equivalent to modelling the asthma rate. The independent variables considered were poverty (proportion of the census tract population with an income to poverty ratio of less than 2.0), race (the proportion of non-White residents), Fr, LST, and quintiles of PM2.5. LST was found to have no effect in any model and so is not presented in the results.
Priors for the intercept and β terms were selected to be weakly informative [54] and chosen based on prior predictive checks (simulating outcomes from the priors and comparing them to the observed data) [55]. Sensitivity of the posterior estimates to prior specification was also tested by changing the parameters of the priors and evaluating their affect on the posterior. Non-informative, weakly informative, and strongly informative priors all produce equivalent estimates of the parameters indicating that the data are sufficiently strong to dominate posterior estimation [54].
Bayesian estimation is accomplished by repeatedly sampling from the joint posterior distribution which in brms is accomplished using a Markov chain Monte Carlo (MCMC) algorithm. Effectiveness of the MCMC sampling was assessed visually by inspecting trace plots for chain convergence and numerically with Rhat ( R ^ ) estimates. R ^ represents the amount of between chain variance relative to the within chain variance with a value of 1.0 indicating total convergence. Stable and accurate estimates of parameters depend partially on sample size, which was evaluated numerically by the effective sample size (ESS) which estimates the amount of independent information available from the dependent chains as a ratio of the actual sample size by the amount of autocorrelation present in the chains [56].
We present the results of four models:
Model 1: asthma = poverty ratio + prop. non-White
Model 2: asthma = poverty ratio + prop. non-White + PM2.5
Model 3: asthma = poverty ratio + prop. non-White + PM2.5 + fractional vegetation
Model 4: asthma = poverty ratio + prop. non-White + PM2.5 × fractional vegetation
These models were designed to assess the degree to which asthma rates are effected by social, environmental, and climatic environments and to investigate racial disparities. Models were compared using the widely applicable information criterion (WAIC) and by visually assessing the model fit by simulating asthma counts from the joint posterior density.

3. Results

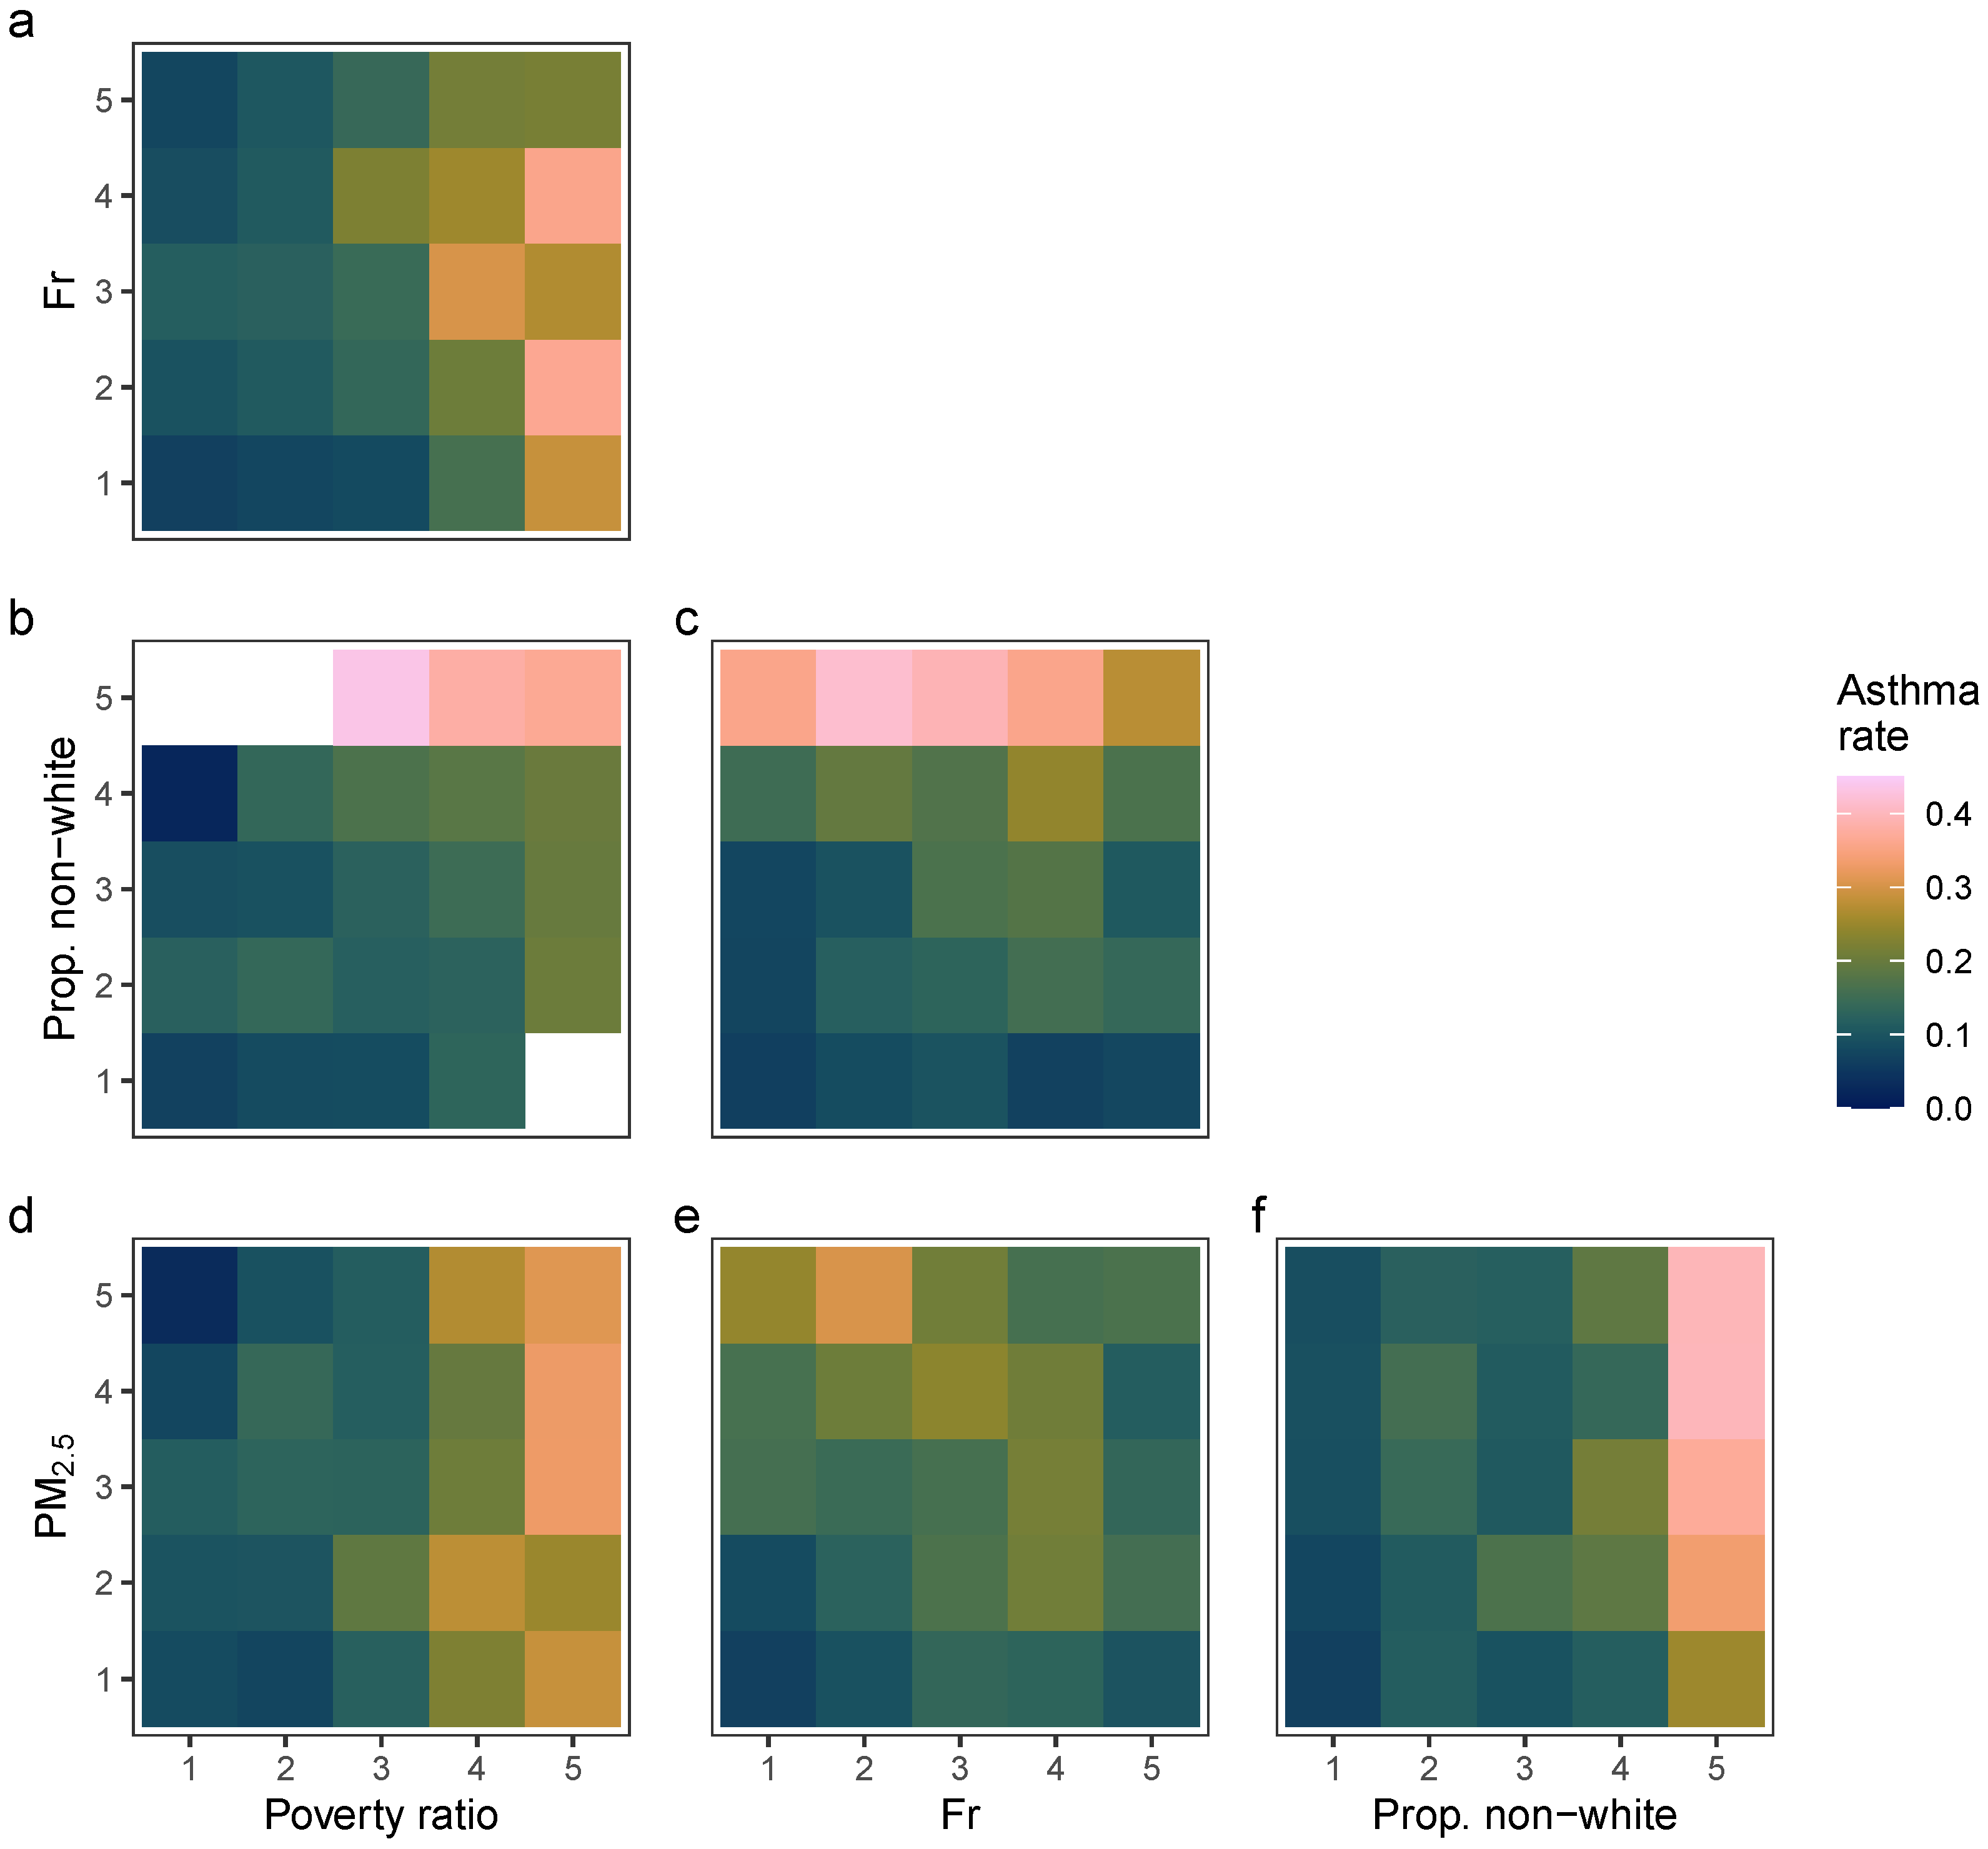
Census tracts with the highest asthma rates are characterized by higher risk levels for all independent variables (Table 3). Moving from the census tracts with the lowest asthma rates (Quintile 1) to the highest (Quintile 5), the proportion of the population below a poverty–income ratio of 2.0 increases, the proportion of the population who identifies as non-White increases, Fr decreases, and the PM2.5 concentration increases. This is also evident in a visual assessment of bivariate risk. Figure 3 shows that asthma rates are highest in census tracts characterized by higher poverty levels and higher PM2.5 concentrations, higher poverty levels and a higher proportion of non-White residents, higher poverty levels and lower Fr, a higher proportion of non-White residents and lower Fr, and a higher proportion of non-White residents and higher PM2.5 concentrations. This exploratory analysis indicates that census tracts with high asthma rates are characterized by higher levels of poverty, higher proportions of non-White residents, lower Fr, and higher PM2.5 concentrations.
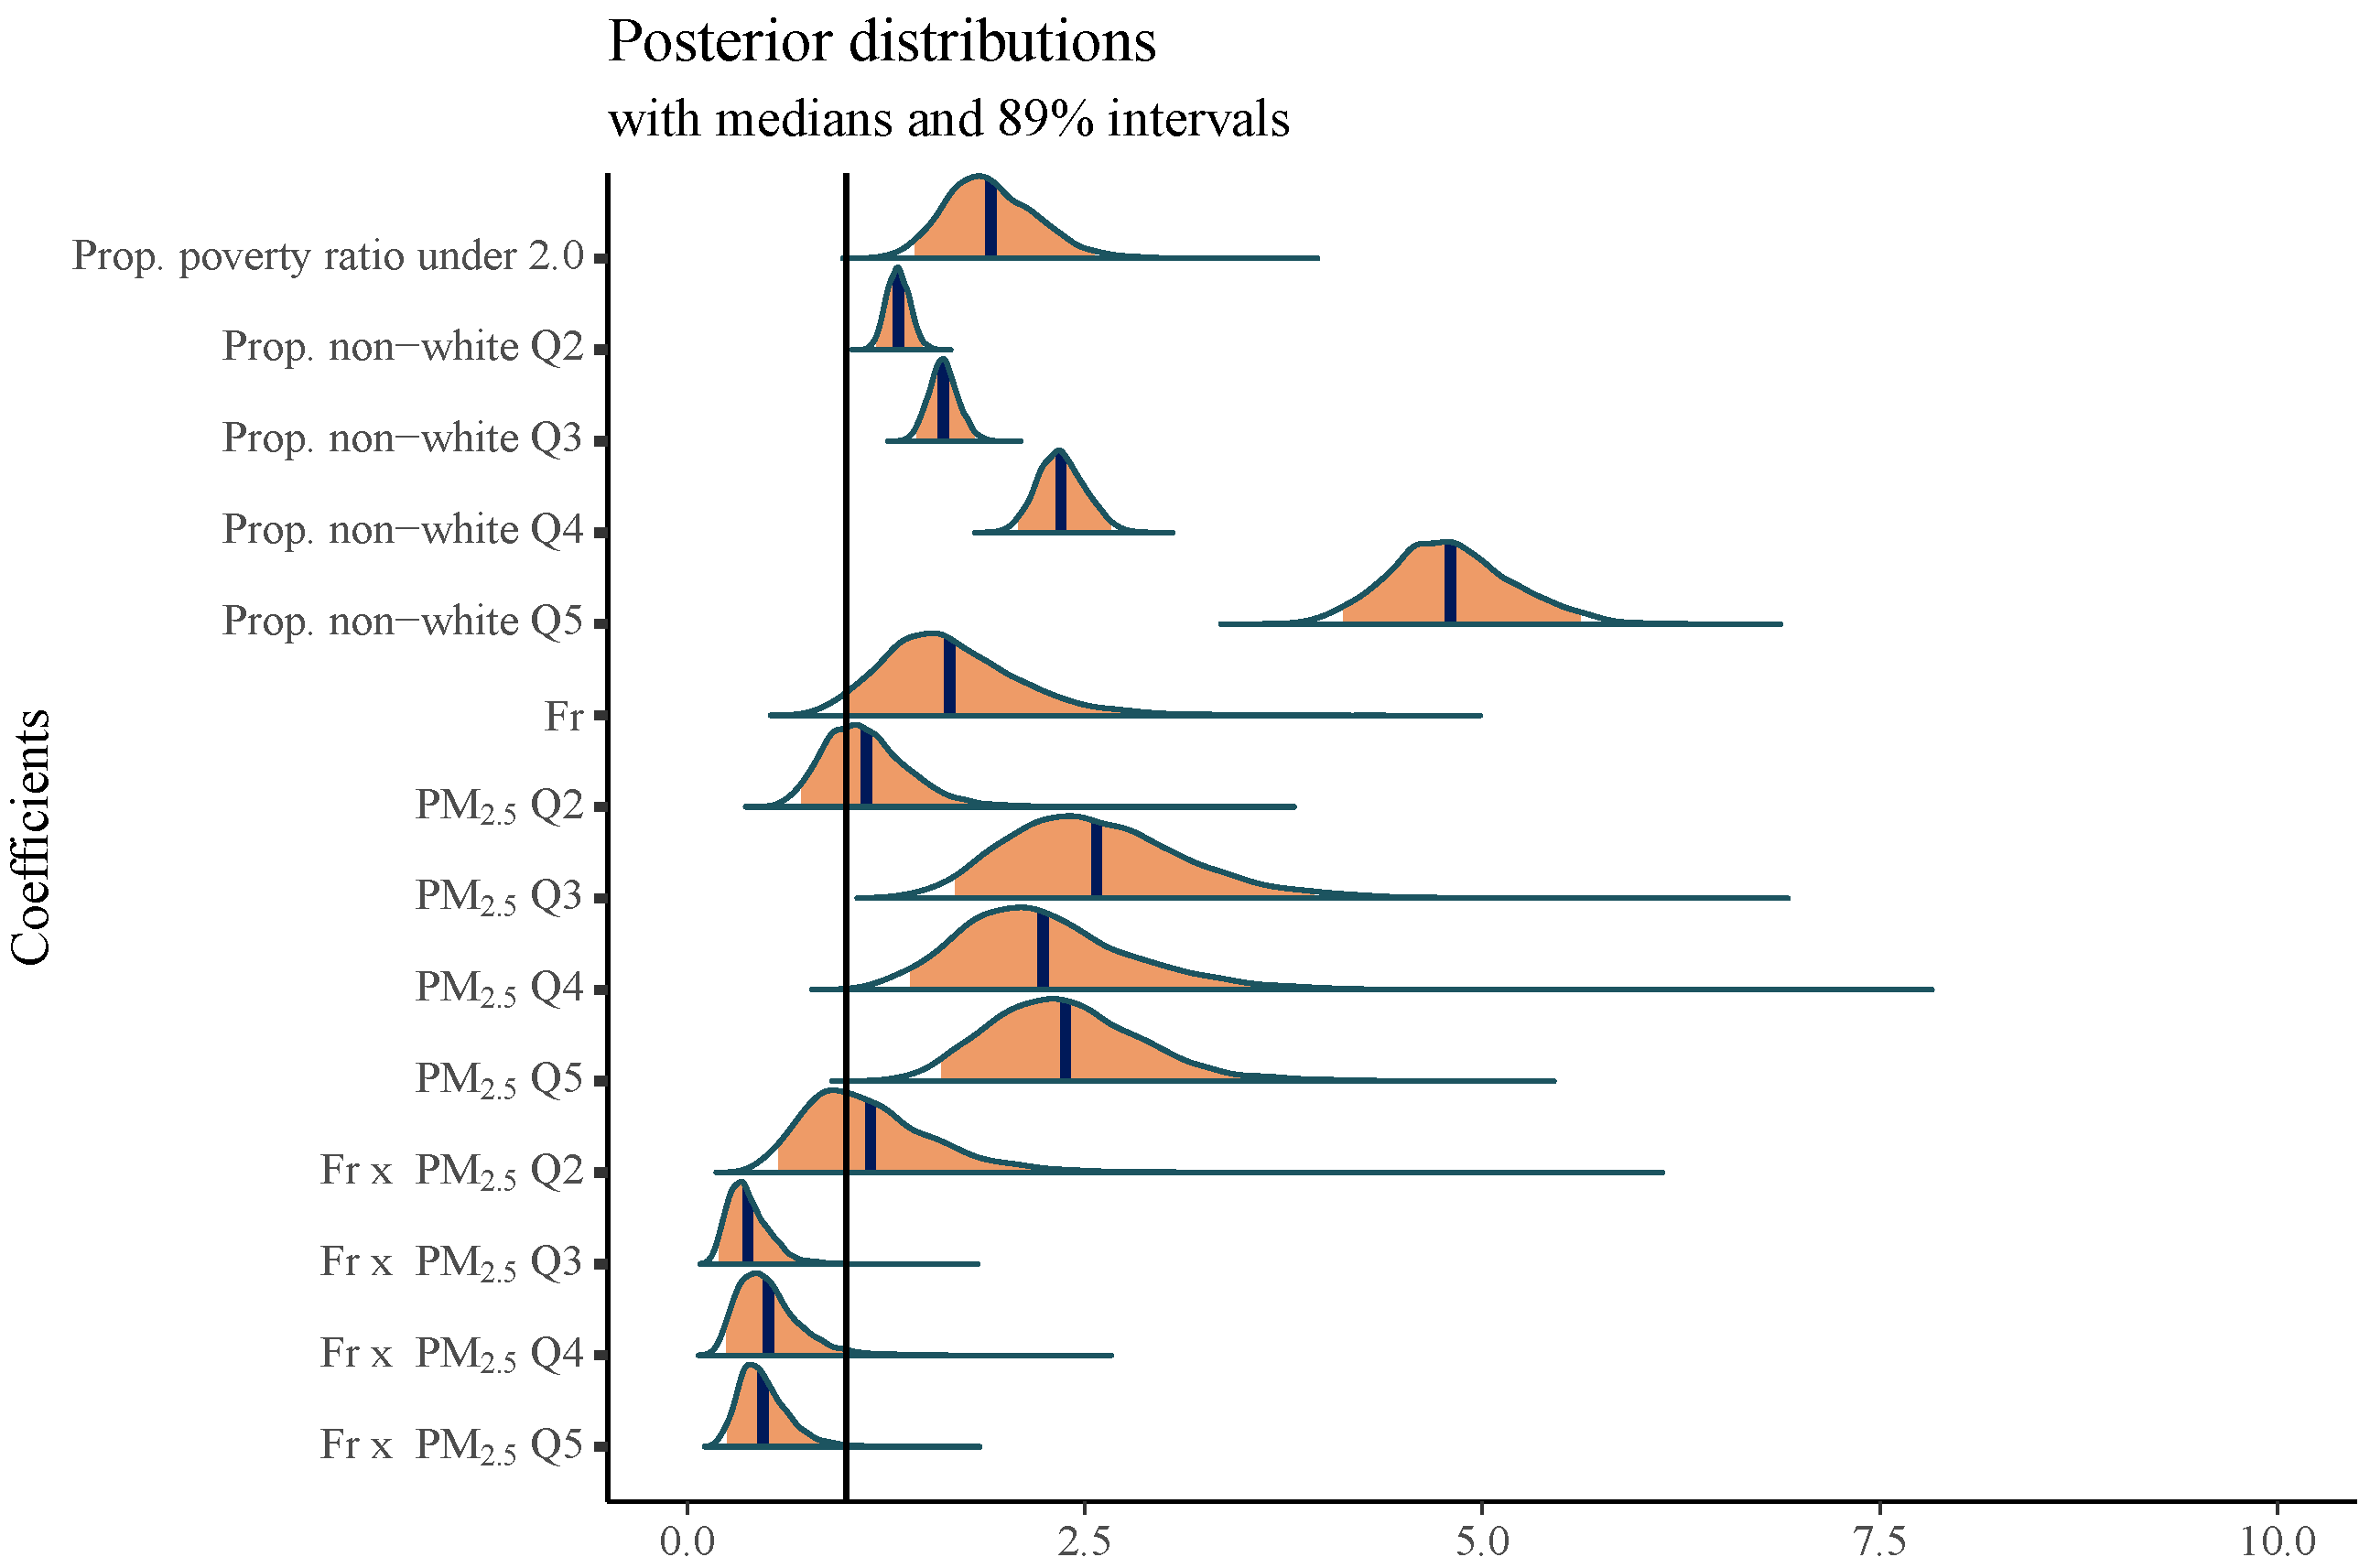
Table 4 presents results from all models as incidence rate ratios (IRRs) and Figure 4 shows the posterior distributions of the model coefficients for Model 4 only. Because the negative binomial regression models the log of the asthma counts, the exponentiated model coefficients correspond to the percent change in asthma count associated with a one unit increase in the independent variable and are known as incidence rate ratios. An IRR of one indicates that a change in exposure produces no change in the asthma count, an IRR less than one indicates that an increase in exposure decreases asthma counts, and an IRR greater than one indicates that an increase in exposure increases asthma counts.
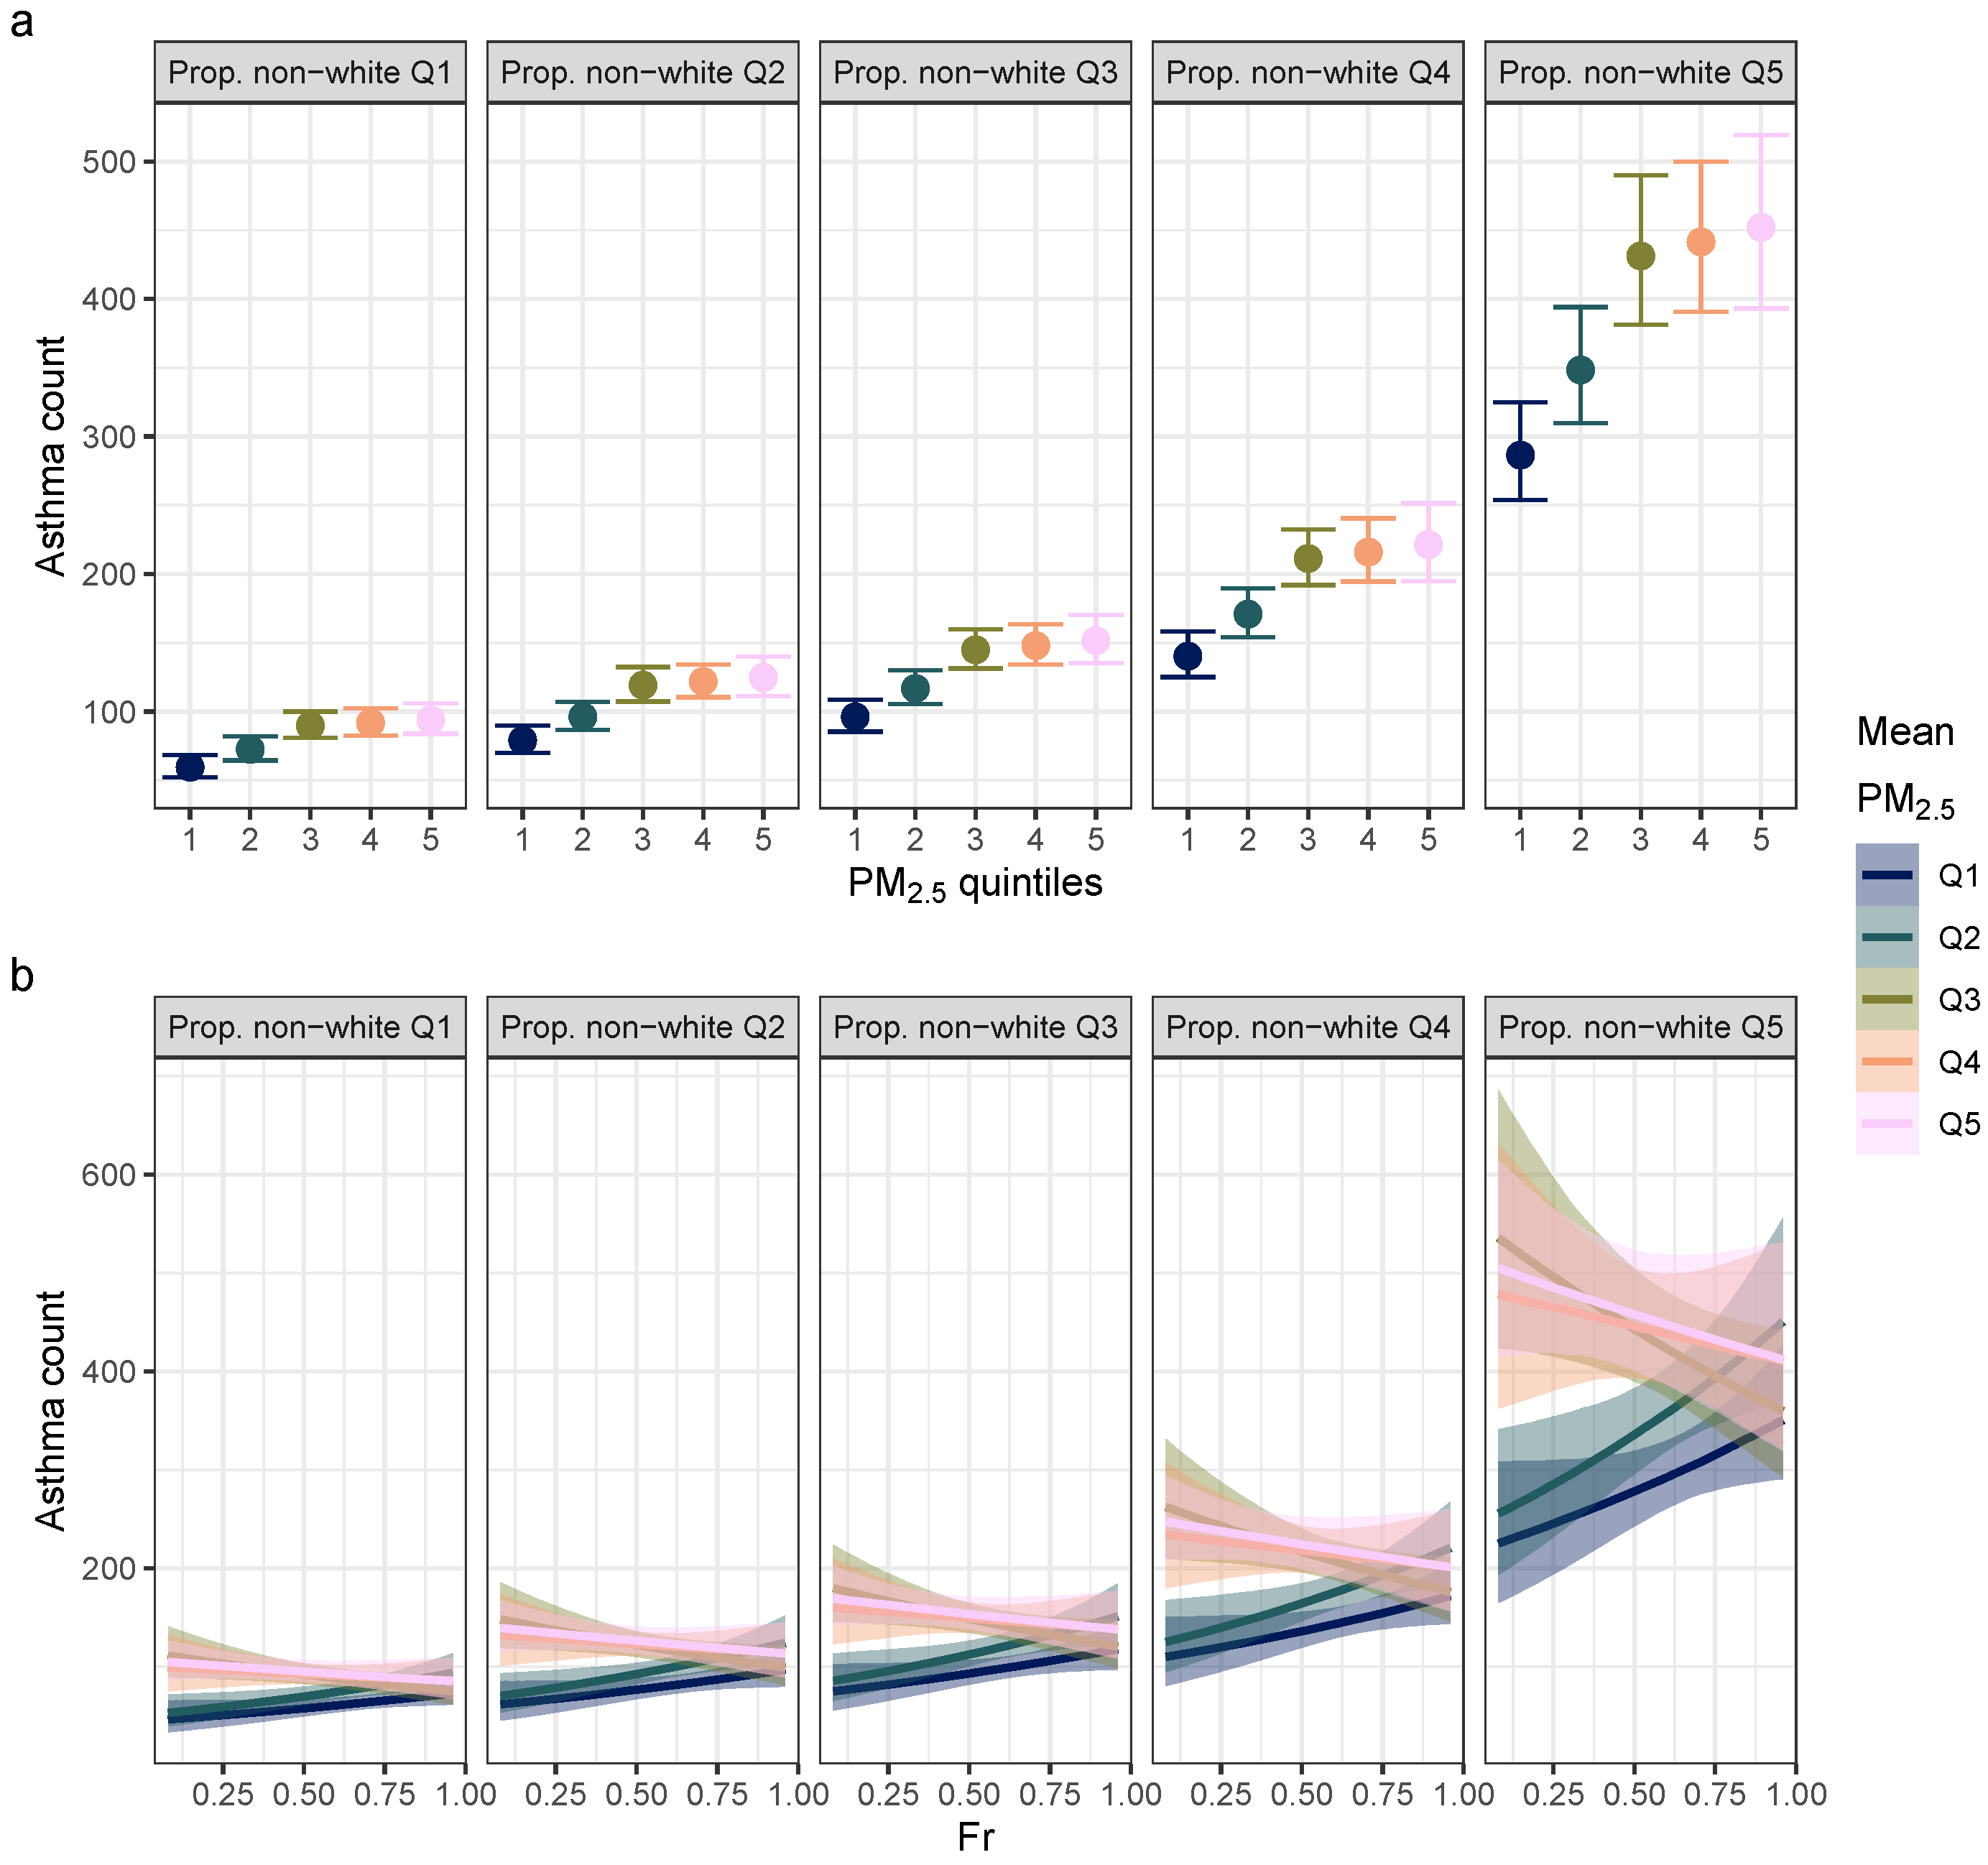
Neighborhood social characteristics have strong positive effects on asthma incidence (Model 1). A 1% increase in the proportion of the population with a poverty ratio under 2.0 is associated with a 3.42% increase in the rate of acute asthma while there is an increase in asthma rate with each successively higher quartile of the proportion of non-White residents. The second quartile (Q2) has an asthma rate 1.32% higher than Q1 (lowest percentage of non-White residents), Q3 is 1.60% higher than Q1, Q4 is 2.25% higher than Q1, and Q5 is 4.33% higher than Q1. With the addition of environmental exposure variables Fr and PM2.5 (Models 2–3), the effect of poverty ratio on asthma decreases by 1.28%, while the effect of proportion of non-White residents increases in both Q4 (0.07%) and Q5 (0.33%), indicating that the burden of environmental exposure is borne more heavily by neighborhoods of color even after controlling for neighborhood economic characteristics.
Models 2–4 examine the effects of environmental exposure while controlling for neighborhood social characteristics. There is little certainty that the IRR for LST is different from one (model not shown) and so LST is not included in these models. Results of all models indicate that higher levels of PM2.5 increase asthma incidence, especially above the 40th percentile of PM2.5 (Q3–Q5). Including Fr but not the interaction between Fr and PM2.5 only changes the model estimates by 0.01%, and the IRR for Fr indicates no effect on asthma. When including the interaction term, the overall effect of Fr becomes positive, increasing asthma rates by 1.65% with every 1% increase in Fr. However, the interaction terms show that this effect becomes negative in census tracts characterized by higher levels of PM2.5. Essentially, in neighborhoods characterized by levels of PM2.5 less than the 40th percentile (Q1–Q2), PM2.5 has no effect on asthma rates and Fr has no effect. On the other hand, neighborhoods characterized by levels of PM2.5 above the 40th percentile (Q3–Q5) show increased asthma rates. However, the interaction terms indicate that increasing Fr in these neighborhoods lowers PM2.5 concentrations. It should be noted that that for Q4, the interval for the Fr and PM2.5 interaction term includes the value of 1.0 and therefore may not be significant, but for the Q5, the interval does not include the no-effect value.
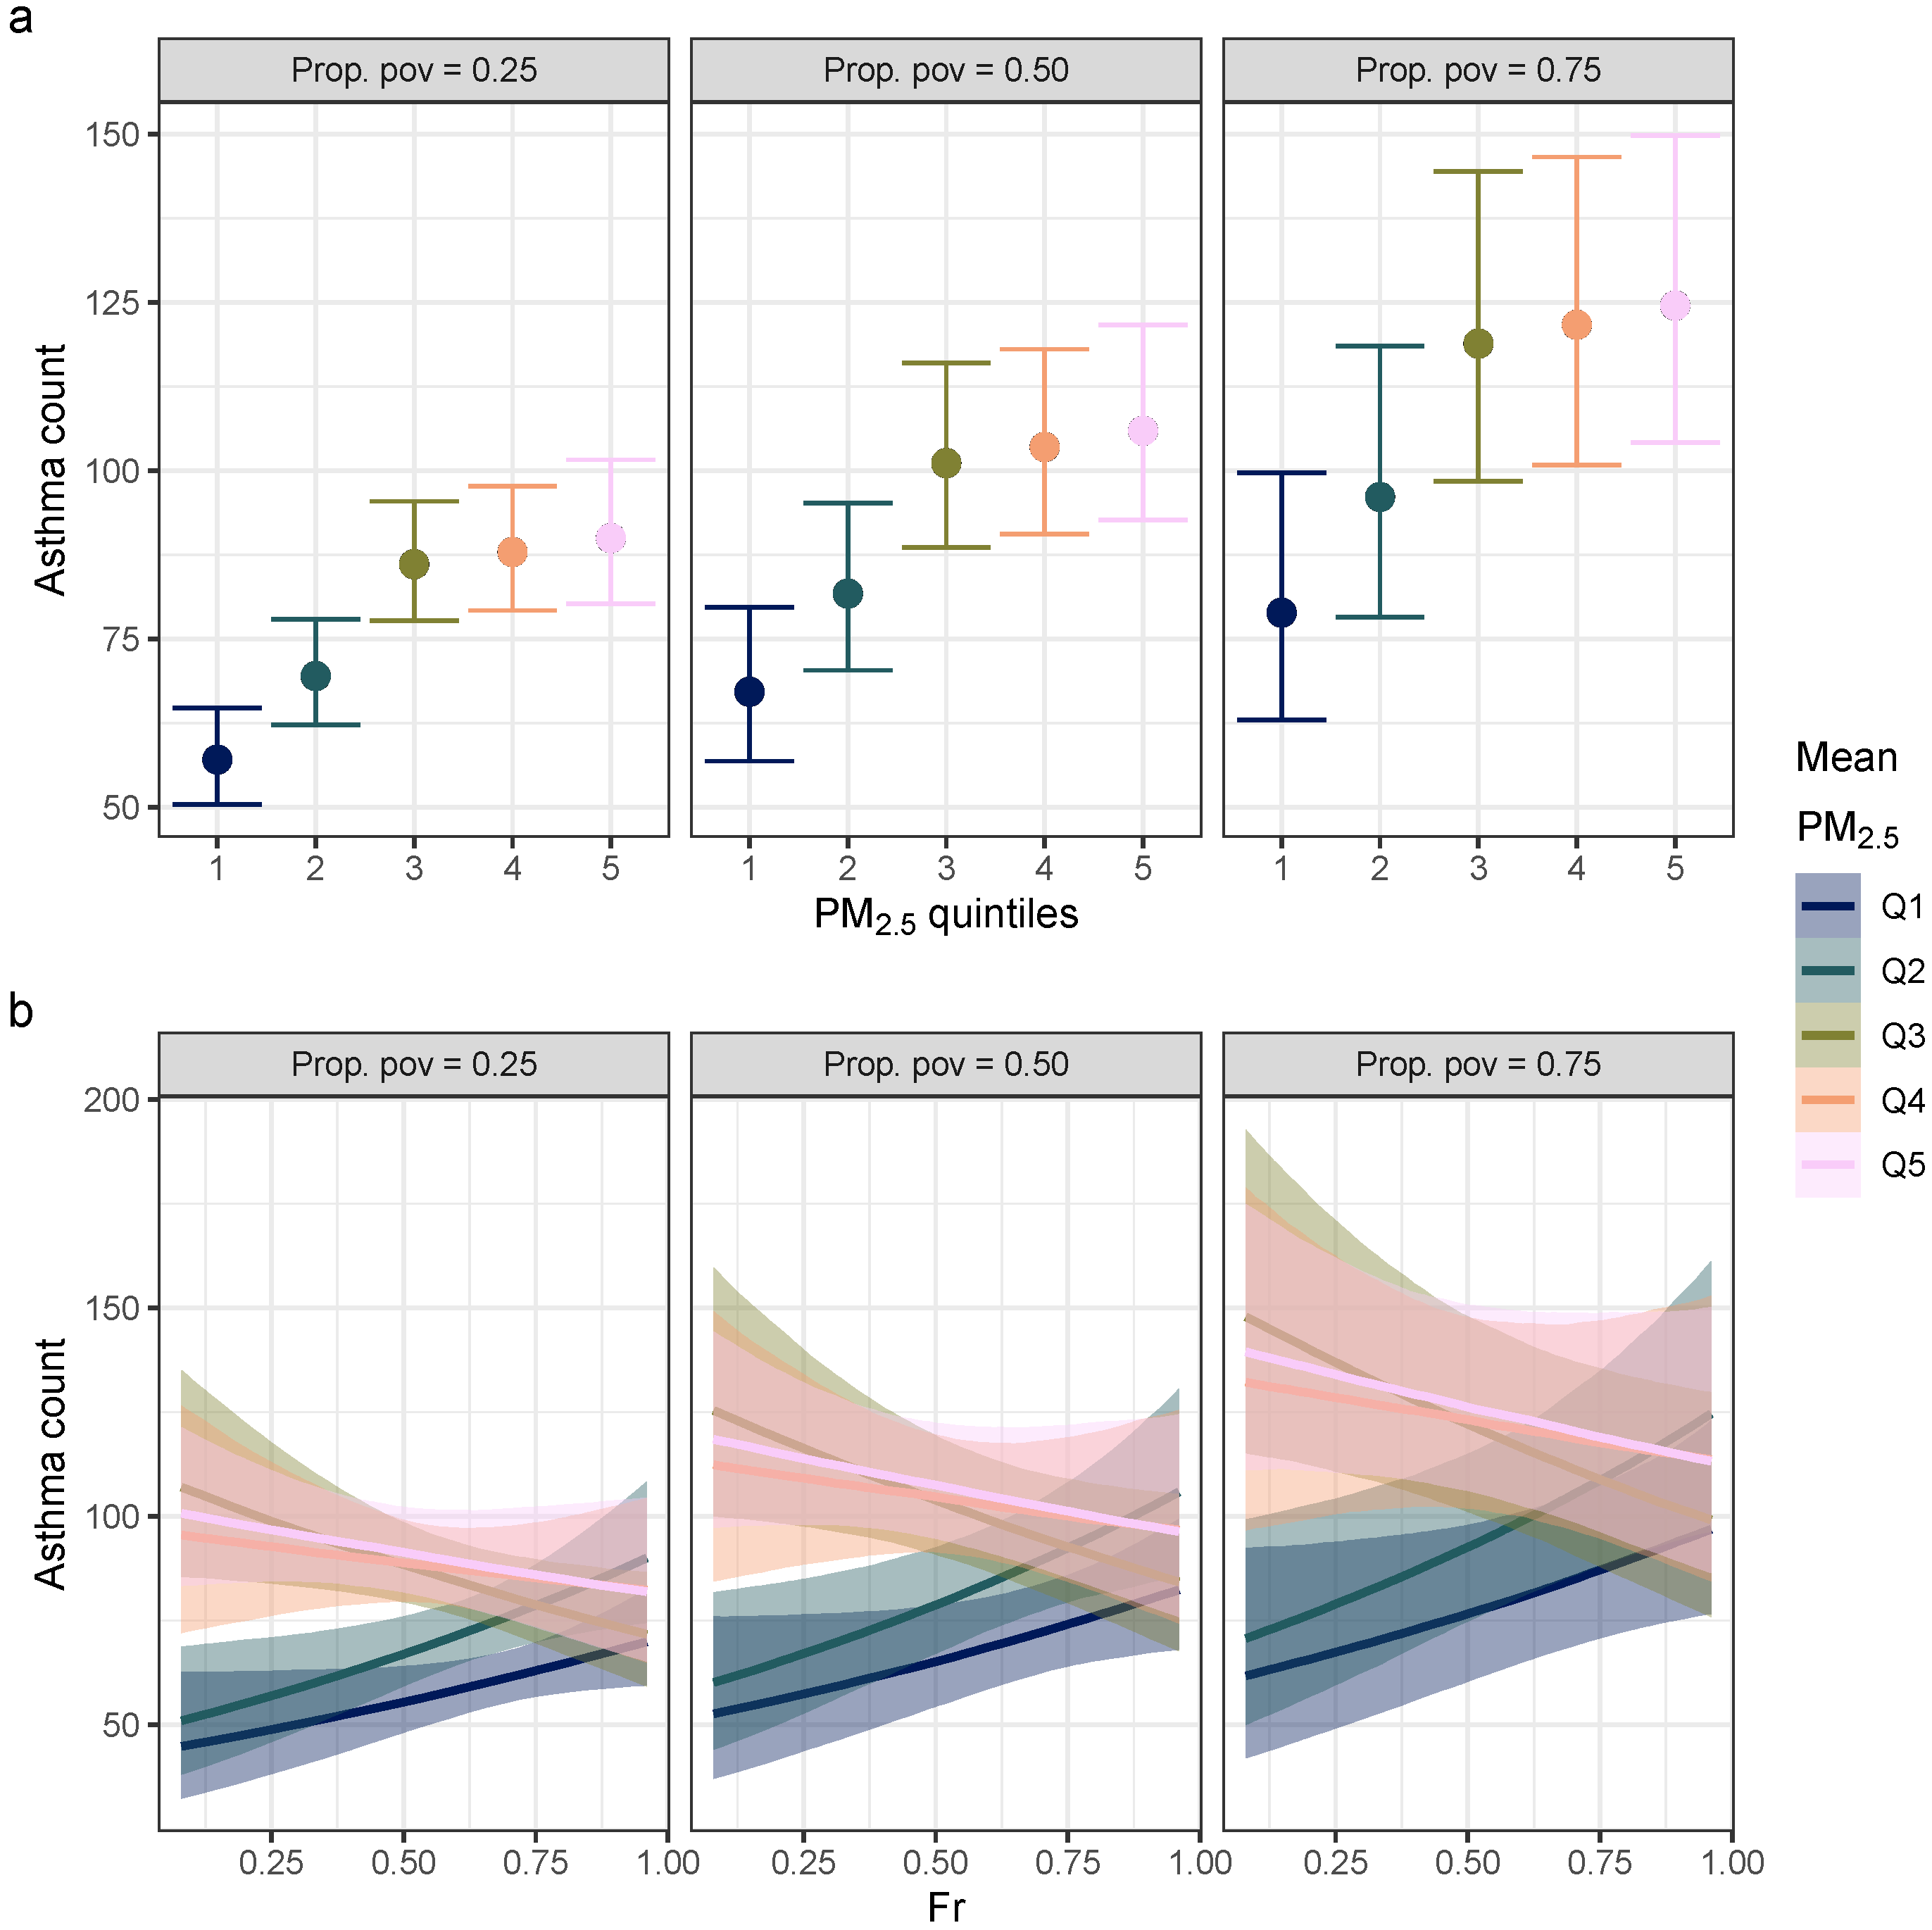
Examining the conditional effects of both PM2.5 and the interaction between PM2.5 and Fr shows that the magnitude of these effects is stronger in census tracts characterized by higher poverty levels and higher proportions of non-White residents (Figure 5 and Figure 6). For the lowest values (Q2), the interaction term includes the no-effect value. As the PM2.5 concentration increases, Fr has a stronger negative effect on asthma rates. Additionally and most importantly, the magnitude of this effect is stronger in census tracts characterized by higher poverty levels and higher proportions of non-White residents. While the burden of environmental exposure is borne more heavily by neighborhoods of color, this burden may be partially alleviated by increasing Fr in highly polluted areas. We caution that the Bayesian analysis is not an explicitly causal analysis, and while we offer this as a potential explanation, additional analysis is necessary to assess the true causal nature of the interaction.
Model fit was assessed visually with posterior predictive plots (Figure 7). Y r e p indicates that the simulated values are replications of the outcome (using the same predictor values that informed the model) rather than predictions [55]. While there is some unaccounted for variation, predictions drawn from the joint posterior density of the model approximate the shape of the observed asthma incidence distribution and the medians of these predictions cluster around the median of the observed data. Mapping the means per census tract of the predictions from the MCMC draws also shows that the model adequately captures the spatial variation of the observed asthma counts (Figure 8).

4. Discussion

The goal of this research was to describe the structure of the census tract-level variation in acute pediatric asthma rates in the Kansas City Metro Area. Using geolocated health data linked with census, satellite, and air pollution data, we explored the social, environmental, and atmospheric factors influencing asthma incidence. We found that while increased greenspace was associated with lower asthma rates in areas characterized by high PM2.5 concentrations, the strongest influence on asthma rates was the proportion of non-White residents in a census tract. We also found that average LST was not a significant factor influencing pediatric asthma.
Our research provides support for the positive association between rate of acute asthma incidence and long-term air pollution concentrations. Many studies point to such an association [6,7], and while some research indicates contradictory results [26], these may be due to the large variation in data and methods, including asthma outcome (acute vs. affirmative diagnosis), statistical design (count vs. binary outcome), spatial scale (census tract vs. county), and temporal scale (averages over study period, years, months, or weeks). We found that higher levels of PM2.5 were associated with increased incidence rate ratios, especially above the 40th percentile of PM2.5 levels. Similar to [23] we found that increased Fr was associated with decreased asthma incidence when PM2.5 concentrations were high but had little to no effect when they were low, possibly due to increased particulate deposition in high pollution areas [21,22]. Street-level geometry can affect deposition by altering turbulence and wind patterns, and although we did not consider such fine resolution details, Fr is a key factor in air pollution mitigation strategies [57]. Building on the work in [12], we found that environmental exposure (PM2.5 concentrations) and the associated positive effects on pediatric asthma were higher in communities of color.
Confirming the work in [12], we found that racial and socioeconomic disparities in acute pediatric asthma rates are significant even after accounting for neighborhood environmental and atmospheric factors. Research indicates that disadvantaged children have elevated exposure to deleterious physical conditions and elevated levels of psychosocial stress that accumulate over time [58]. Structural racism and residential segregation are substantial factors in shaping the spatial distribution of environmental health and environmental health disparities in the United States [59], and racial disparities in the prevalence of disease reflect disparities in environmental and social environments [58]. Our research indicates that the proportion of non-White residents in a census tract is the strongest predictor of acute pediatric asthma in Kansas City, even after controlling for poverty and environmental exposure. This finding indicates that interventions targeted at reducing the health implications of structural racism are key to controlling the asthma epidemic.
Of primary importance are the results indicating that the protective effect of vegetation in high-pollution areas is stronger in census tracts characterized by higher levels of poverty and higher proportions of non-White residents. We found that in census tracts that were above the 40th percentile of PM2.5 concentrations, increasing the amount of fractional vegetation decreased the asthma rate, with the magnitude of this effect being higher in neighborhoods of color. These findings provide support for civic investment in public greenspace, especially in neighborhoods of color, to increase environmental justice by providing a range of positive health benefits [60], including the reduction in acute pediatric asthma. Our results provide evidence for targeted interventions to reduce air pollution by identifying neighborhoods where greenspace investment can have the greatest positive impact on health. Greenspace can not only reduce pediatric asthma, but also promote physical activity; in addition, it is associated with a reduction in obesity, promotes psychological well-being, reduces mortality, and reduces the urban heat island effect [15,60,61,62].

4.1. Limitations

This study relied on data that were both temporally and spatially averaged. Acute asthma incidences and the environmental variables were aggregated to the census-tract level for an ecological analysis. These aggregations represent group exposures that are not readily measured at the individual level; however, this can result in misrepresentation of individual exposure and results from this study are not appropriate to extrapolate to individuals [63]. Regardless, population-level effects—in this case neighborhoods represented by census tracts—are of primary concern to policy makers, and an ecological study can provide easy-to-interpret information on the spatial distribution of environmental health risk. Additionally, future studies should assess sensitivity of the results to different spatial scales of aggregation, i.e., zip codes or other municipal tabulation areas, and caution should be used when interpreting the results at a different scale.
The temporal averaging of the data privileges the spatial variability of environmental health risk but neglects any yearly or seasonal trends in the relationships between acute pediatric asthma, greenspace, and air pollution. Changes to the built environment in established urban areas are generally quite slow, and these averages represent background exposure levels. Any neglected changes within census tracts are likely to be minor compared to the between-tract variation in exposure and asthma outcomes.

4.2. Strengths

A major strength of this analysis is the fine spatial scale of the analysis. By looking at the rates of acute pediatric asthma per census tract, we were able to investigate the relationship between asthma incidence and the social, environmental, and atmospheric structure of the neighborhood where a child was living when they were admitted to an emergency facility in the CMH network for acute asthma. The 427 census tracts in the analysis represent a range of neighborhood conditions. Understanding neighborhood-level variation not just in exposure but exposure-related health risks is crucial to creating informed and targeted policies and intervention strategies [27]. Additionally, the analysis was conducted using open-source software and with freely available (with the exception of the confidential asthma) data. The methods are fairly straightforward and the results are easy to interpret. These were conscious choices made to increase the portability of the methods and to provide analysis that is interpretable, impactful, and actionable.

4.3. Conclusions

Our findings show that there are significant racial disparities in neighborhood acute pediatric asthma rates in the Kansas City Metro Area. Neighborhoods that are characterized by a high proportion of non-White residents, and to a lesser extent a high proportion of residents living in poverty, exhibit higher rates of asthma incidence. We also found that increased levels of PM2.5 were associated with increased asthma incidence, but this effect was moderated by the fraction of vegetation (Fr). This interaction was stronger in neighborhoods with a higher proportion of non-White residents, indicating that increasing the amount of greenspace in neighborhoods of color is protective against the deleterious effects of air pollution on pediatric asthma. Understanding how greenspace interacts with air pollution to influence the spatial distribution of asthma can inform urban planners on the policy consequences and benefits of alterations to the urban land surface. Our research provides a clear mandate for planners and policy makers when considering the environmental health impacts of development and public policy: prioritize environmental justice to improve health equity.

Author Contributions

Conceptualization, E.J.W. and N.A.B.; methodology, E.J.W., N.A.B. and J.M.S.O.; formal analysis, E.J.W.; writing—original draft preparation, E.J.W.; writing—review and editing, E.J.W., N.A.B., D.R.R., J.M.S.O., N.J.K. and K.F.K.; visualization, E.J.W.; funding acquisition, K.F.K. All authors have read and agreed to the published version of the manuscript.

Funding

Funding for the initial asthma data research and geocoding was provided by the Housing and Urban Development (HUD) Office of Lead Hazard Control and Healthy Homes under a Healthy Home Technical Study entitled, “The Kansas City Home Environmental Assessment Research Taskforce” (KC-HEART) [HUD grant #MOHHU0016-13].

Institutional Review Board Statement

This study was approved by the University of Kansas and the Children’s Mercy Kansas City Institutional Review Boards (IRB #11120500, Housing and Health). Access to the pediatric asthma data was obtained through an approved data use agreement between the University of Kansas, the Center for Economic Information at the University of Missouri-Kansas City, and Children’s Mercy Kansas City.

Data Availability Statement

The data presented in this study are available on request from the corresponding author due to IRB constraints.

Conflicts of Interest

The authors declare no conflicts of interest.

References

  1. Ford, E.S.; Mannino, D.M. Considerations Regarding the Epidemiology and Public Health Burden of Asthma. In Asthma, Health and Society: A Public Health Perspective; Harver, A., Kotses, H., Eds.; Springer: Boston, MA, USA, 2010; pp. 3–17. [Google Scholar] [CrossRef]
  2. Won, Y.K.; Hwang, T.H.; Roh, E.J.; Chung, E.H. Seasonal Patterns of Asthma in Children and Adolescents Presenting at Emergency Departments in Korea. Allergy Asthma Immunol. Res. 2016, 8, 223–229. [Google Scholar] [CrossRef] [PubMed]
  3. Trivedi, M.; Denton, E. Asthma in Children and Adults—What Are the Differences and What Can They Tell Us About Asthma? Front. Pediatr. 2019, 7, 256. [Google Scholar] [CrossRef] [PubMed]
  4. Milligan, K.L.; Matsui, E.; Sharma, H. Asthma in Urban Children: Epidemiology, Environmental Risk Factors, and the Public Health Domain. Curr. Allergy Asthma Rep. 2016, 16, 33. [Google Scholar] [CrossRef] [PubMed]
  5. Akinbami, L.J.; Simon, A.E.; Rossen, L.M. Changing Trends in Asthma Prevalence Among Children. Pediatrics 2016, 137, e20152354. [Google Scholar] [CrossRef]
  6. Delfino, R.J.; Wu, J.; Tjoa, T.; Gullesserian, S.K.; Nickerson, B.; Gillen, D.L. Asthma Morbidity and Ambient Air Pollution: Effect Modification by Residential Traffic-Related Air Pollution. Epidemiology 2014, 25, 48–57. [Google Scholar] [CrossRef]
  7. Chang, H.H.; Pan, A.; Lary, D.J.; Waller, L.A.; Zhang, L.; Brackin, B.T.; Finley, R.W.; Faruque, F.S. Time-Series Analysis of Satellite-Derived Fine Particulate Matter Pollution and Asthma Morbidity in Jackson, MS. Environ. Monit. Assess. 2019, 191, 280. [Google Scholar] [CrossRef]
  8. Delamater, P.L.; Finley, A.O.; Banerjee, S. An Analysis of Asthma Hospitalizations, Air Pollution, and Weather Conditions in Los Angeles County, California. Sci. Total. Environ. 2012, 425, 110–118. [Google Scholar] [CrossRef]
  9. Buteau, S.; Geng, X.; Labelle, R.; Smargiassi, A. Review of the Effect of Air Pollution Exposure from Industrial Point Sources on Asthma-Related Effects in Childhood. Environ. Epidemiol. 2019, 3, e077. [Google Scholar] [CrossRef]
  10. Pollock, J.; Shi, L.; Gimbel, R.W. Outdoor Environment and Pediatric Asthma: An Update on the Evidence from North America. Can. Respir. J. 2017, 2017, 8921917. [Google Scholar] [CrossRef]
  11. Chen, L.; Mengersen, K.; Tong, S. Spatiotemporal Relationship between Particle Air Pollution and Respiratory Emergency Hospital Admissions in Brisbane, Australia. Sci. Total. Environ. 2007, 373, 57–67. [Google Scholar] [CrossRef]
  12. Kane, N. Revealing the Racial and Spatial Disparity in Pediatric Asthma: A Kansas City Case Study. Soc. Sci. Med. 2022, 292, 114543. [Google Scholar] [CrossRef] [PubMed]
  13. Boogaard, H.; Patton, A.; Atkinson, R.; Brook, J.; Chang, H.; Crouse, D.; Fussell, J.; Hoek, G.; Hoffmann, B.; Kappeler, R.; et al. Long-Term Exposure to Traffic-Related Air Pollution and Selected Health Outcomes: A Systematic Review and Meta-Analysis. Environ. Int. 2022, 164, 107262. [Google Scholar] [CrossRef] [PubMed]
  14. Oke, T.R. The Energetic Basis of the Urban Heat Island. Q. J. R. Meteorol. Soc. 1982, 108, 1–24. [Google Scholar] [CrossRef]
  15. Wesley, E.J.; Brunsell, N.A. Greenspace Pattern and the Surface Urban Heat Island: A Biophysically-Based Approach to Investigating the Effects of Urban Landscape Configuration. Remote. Sens. 2019, 11, 2322. [Google Scholar] [CrossRef]
  16. Anderson, G.B.; Dominici, F.; Wang, Y.; McCormack, M.C.; Bell, M.L.; Peng, R.D. Heat-Related Emergency Hospitalizations for Respiratory Diseases in the Medicare Population. Am. J. Respir. Crit. Care Med. 2013, 187, 1098–1103. [Google Scholar] [CrossRef]
  17. Kim, J.; Lim, Y.; Kim, H. Outdoor Temperature Changes and Emergency Department Visits for Asthma in Seoul, Korea: A Time-Series Study. Environ. Res. 2014, 135, 15–20. [Google Scholar] [CrossRef]
  18. Lam, H.C.y.; Li, A.M.; Chan, E.Y.y.; Goggins, W.B. The Short-Term Association between Asthma Hospitalisations, Ambient Temperature, Other Meteorological Factors and Air Pollutants in Hong Kong: A Time-Series Study. Thorax 2016, 71, 1097–1109. [Google Scholar] [CrossRef]
  19. O’Lenick, C.R.; Winquist, A.; Chang, H.H.; Kramer, M.R.; Mulholland, J.A.; Grundstein, A.; Sarnat, S.E. Evaluation of Individual and Area-Level Factors as Modifiers of the Association between Warm-Season Temperature and Pediatric Asthma Morbidity in Atlanta, GA. Environ. Res. 2017, 156, 132–144. [Google Scholar] [CrossRef]
  20. Soneja, S.; Jiang, C.; Fisher, J.; Upperman, C.R.; Mitchell, C.; Sapkota, A. Exposure to Extreme Heat and Precipitation Events Associated with Increased Risk of Hospitalization for Asthma in Maryland, U.S.A. Environ. Health 2016, 15, 57. [Google Scholar] [CrossRef]
  21. Nowak, D.J.; Crane, D.E.; Stevens, J.C. Air Pollution Removal by Urban Trees and Shrubs in the United States. Urban For. Urban Green. 2006, 4, 115–123. [Google Scholar] [CrossRef]
  22. Janhäll, S. Review on Urban Vegetation and Particle Air Pollution – Deposition and Dispersion. Atmos. Environ. 2015, 105, 130–137. [Google Scholar] [CrossRef]
  23. Alcock, I.; White, M.; Cherrie, M.; Wheeler, B.; Taylor, J.; Mcinnes, R.; Otte Im Kampe, E.; Vardoulakis, S.; Sarran, C.; Soyiri, I.; et al. Land Cover and Air Pollution Are Associated with Asthma Hospitalisations: A Cross-Sectional Study. Environ. Int. 2017, 109, 29–41. [Google Scholar] [CrossRef] [PubMed]
  24. Ayres-Sampaio, D.; Teodoro, A.C.; Sillero, N.; Santos, C.; Fonseca, J.; Freitas, A. An Investigation of the Environmental Determinants of Asthma Hospitalizations: An Applied Spatial Approach. Appl. Geogr. 2014, 47, 10–19. [Google Scholar] [CrossRef]
  25. Feng, X.; Astell-Burt, T. Is Neighborhood Green Space Protective against Associations between Child Asthma, Neighborhood Traffic Volume and Perceived Lack of Area Safety? Multilevel Analysis of 4447 Australian Children. Int. J. Environ. Res. Public Health 2017, 14, 543. [Google Scholar] [CrossRef]
  26. Brewer, M.; Kimbro, R.T.; Denney, J.T.; Osiecki, K.M.; Moffett, B.; Lopez, K. Does Neighborhood Social and Environmental Context Impact Race/Ethnic Disparities in Childhood Asthma? Health Place 2017, 44, 86–93. [Google Scholar] [CrossRef]
  27. Castillo, M.D.; Kinney, P.L.; Southerland, V.; Arno, C.A.; Crawford, K.; van Donkelaar, A.; Hammer, M.; Martin, R.V.; Anenberg, S.C. Estimating Intra-Urban Inequities in PM 2.5-Attributable Health Impacts: A Case Study for Washington, DC. GeoHealth 2021, 5, 1–15. [Google Scholar] [CrossRef]
  28. Hicken, M.T. Invited Commentary: Fundamental Causes, Social Context, and Modifiable Risk Factors in the Racial/Ethnic Inequalities in Blood Pressure and Hypertension. Am. J. Epidemiol. 2015, 182, 354–357. [Google Scholar] [CrossRef]
  29. Pickett, S.T.A.; Cadenasso, M.L.; Grove, J.M.; Nilon, C.; Pouyat, R.; Zipperer, W.C.; Costanza, R. Urban Ecological Sysytems: Linking Terrestrial Ecological, Physical, and Socioeconomic Components of Metropolitan Areas. Annu. Rev. Ecol. Syst. 2001, 32, 127–157. [Google Scholar] [CrossRef]
  30. Stone, B.; Hess, J.J.; Frumkin, H. Urban Form and Extreme Heat Events: Are Sprawling Cities More Vulnerable to Climate Change than Compact Cities? Environ. Health Perspect. 2010, 118, 1425–1428. [Google Scholar] [CrossRef]
  31. Ji, W. Landscape Effects of Urban Sprawl: Spatial and Temporal Analyses Using Remote Sensing Images and Landscape Metrics. Int. Arch. Photogramm. Remote. Sens. Spat. Inf. Sci. 2008, XXXVII, 1691–1694. [Google Scholar]
  32. Gotham, K.F. Race, Real Estate, and Uneven Development: The Kansas City Experience, 1900–2010, 2nd ed.; State University of New York Press: Albany, NY, USA, 2014. [Google Scholar]
  33. Mid-America Regional Council. Fair Housing and Equity Assessment for the Greater Kansas City Region; Technical Report; Mid-America Regional Council: Kansas City, MO, USA, 2014. [Google Scholar]
  34. U.S. Housing and Urban Development. Affirmatively Furthering Fair Housing Data and Mapping Tool (AFFH-T) Data Documentation; Technical Report; U.S. Housing and Urban Development, Office of Policy Development & Research: Washington, DC, USA, 2020. [Google Scholar]
  35. The Urban Institute. The Cost of Segregation: National Trends and the Case of Chicago, 1990–2010. 2017, p. 78. Available online: https://www.urban.org/sites/default/files/publication/89201/the_cost_of_segregation_final.pdf (accessed on 16 October 2024).
  36. Kane, N.J. An Interdisciplinary Health Disparities Research and Intervention Strategy Applied to the Problem of Pediatric Asthma in Kansas City. Ph.D. Thesis, University of Missouri–Kansas City, Kansas City, MO, USA, 2020. [Google Scholar]
  37. Aybar, C. Rgee: R Bindings for Calling the ’earth Engine’ API. J. Open Source Softw. 2020, 5, 2272. [Google Scholar] [CrossRef]
  38. Carlson, T.N.; Ripley, D.A. On the Relation between NDVI, Fractional Vegetation Cover, and Leaf Area Index. Remote. Sens. Environ. 1997, 62, 241–252. [Google Scholar] [CrossRef]
  39. Gillies, R.R.; Carlson, T.N. Thermal Remote Sensing of Surface Soil Water Content with Partial Vegetation Cover for Incorporation into Climate Models. J. Appl. Meteorol. 1995, 34, 745–756. [Google Scholar] [CrossRef]
  40. Kim, S.Y.; Bechle, M.; Hankey, S.; Sheppard, L.; Szpiro, A.A.; Marshall, J.D. Concentrations of Criteria Pollutants in the Contiguous U.S., 1979–2015: Role of Prediction Model Parsimony in Integrated Empirical Geographic Regression. PLoS ONE 2020, 15, e0228535. [Google Scholar] [CrossRef]
  41. Walker, K.; Herman, M. Tidycensus: Load US Census Boundary and Attribute Data as ‘Tidyverse’ and ‘Sf’-Ready Data Frames. 2022. Available online: https://walker-data.com/tidycensus/ (accessed on 16 October 2024).
  42. Social Explorer. Ratio of Income in 1999 to Poverty Level; Technical Report; Social Explorer: New York, NY, USA, 2022. [Google Scholar]
  43. Social Explorer. Age-Cumulative (Less); Technical Report; Social Explorer: New York, NY, USA, 2022. [Google Scholar]
  44. Schulz, A.J.; Mentz, G.B.; Sampson, N.; Ward, M.; Anderson, R.; de Majo, R.; Israel, B.A.; Lewis, T.C.; Wilkins, D. Race and the Distribution of Social and Physical Environmental Risk. Bois Rev. Soc. Sci. Res. Race 2016, 13, 285–304. [Google Scholar] [CrossRef]
  45. Bullard, R.D. Dismantling Environmental Racism in the USA. Local Environ. 1999, 4, 5–19. [Google Scholar] [CrossRef]
  46. Schlosberg, D. Theorising Environmental Justice: The Expanding Sphere of a Discourse. Environ. Politics 2013, 22, 37–55. [Google Scholar] [CrossRef]
  47. R Core Team. R: A Language and Environment for Statistical Computing; R Foundation for Statistical Computing: Vienna, Austria, 2020. [Google Scholar]
  48. Wickham, H.; Averick, M.; Bryan, J.; Chang, W.; McGowan, L.D.; François, R.; Grolemund, G.; Hayes, A.; Henry, L.; Hester, J.; et al. Welcome to the tidyverse. J. Open Source Softw. 2019, 4, 1686. [Google Scholar] [CrossRef]
  49. Bürkner, P.C. Brms: An R Package for Bayesian Multilevel Models Using Stan. J. Stat. Softw. 2017, 80, 1–28. [Google Scholar] [CrossRef]
  50. Gelman, A.; Hill, J.; Vehtari, A. Regression and Other Stories; Cambridge University Press: New York, NY, USA, 2021. [Google Scholar]
  51. Kruschke, J.K.; Liddell, T.M. Bayesian Data Analysis for Newcomers. Psychon. Bull. Rev. 2018, 25, 155–177. [Google Scholar] [CrossRef]
  52. Lynch, S.M. Introduction to Applied Bayesian Statistics and Estimation for Social Scientists; Springer Science & Business Media: Berlin/Heidelberg, Germany, 2007. [Google Scholar]
  53. Gelman, A.; Carlin, J.B.; Stern, H.S.; Dunson, D.B.; Vehtari, A.; Rubin, D.B. Bayesian Data Analysis; CRC Press: Boca Raton, FL, USA, 2014. [Google Scholar]
  54. Lemoine, N.P. Moving beyond Noninformative Priors: Why and How to Choose Weakly Informative Priors in Bayesian Analyses. Oikos 2019, 128, 912–928. [Google Scholar] [CrossRef]
  55. Gabry, J.; Simpson, D.; Vehtari, A.; Betancourt, M.; Gelman, A. Visualization in Bayesian Workflow. J. R. Stat. Soc. Ser. (Stat. Soc.) 2019, 182, 389–402. [Google Scholar] [CrossRef]
  56. Kruschke, J.K. Doing Bayesian Data Analysis: A Tutorial with R, JAGS, and Stan, 2nd ed.; Academic Press: Cambridge, MA, USA, 2015. [Google Scholar]
  57. Kumar, P.; Druckman, A.; Gallagher, J.; Gatersleben, B.; Allison, S.; Eisenman, T.S.; Hoang, U.; Hama, S.; Tiwari, A.; Sharma, A.; et al. The Nexus between Air Pollution, Green Infrastructure and Human Health. Environ. Int. 2019, 133, 105181. [Google Scholar] [CrossRef] [PubMed]
  58. Williams, D.R.; Sternthal, M.; Wright, R.J. Social Determinants: Taking the Social Context of Asthma Seriously. Pediatrics 2009, 123, S174–S184. [Google Scholar] [CrossRef]
  59. Bailey, Z.D.; Krieger, N.; Agénor, M.; Graves, J.; Linos, N.; Bassett, M.T. Structural Racism and Health Inequities in the USA: Evidence and Interventions. Lancet 2017, 389, 1453–1463. [Google Scholar] [CrossRef]
  60. Wolch, J.R.; Byrne, J.; Newell, J.P. Urban Green Space, Public Health, and Environmental Justice: The Challenge of Making Cities ‘Just Green Enough’. Landsc. Urban Plan. 2014, 125, 234–244. [Google Scholar] [CrossRef]
  61. Gascon, M.; Triguero-Mas, M.; Martínez, D.; Dadvand, P.; Rojas-Rueda, D.; Plasència, A.; Nieuwenhuijsen, M.J. Residential Green Spaces and Mortality: A Systematic Review. Environ. Int. 2016, 86, 60–67. [Google Scholar] [CrossRef]
  62. Dadvand, P.; Villanueva, C.M.; Font-Ribera, L.; Martinez, D.; Basagaña, X.; Belmonte, J.; Vrijheid, M.; Gražulevičienė, R.; Kogevinas, M.; Nieuwenhuijsen, M.J. Risks and Benefits of Green Spaces for Children: A Cross-Sectional Study of Associations with Sedentary Behavior, Obesity, Asthma, and Allergy. Environ. Health Perspect. 2014, 122, 1329–1335. [Google Scholar] [CrossRef]
  63. Macintyre, S.; Ellaway, A.; Cummins, S. Place Effects on Health: How Can We Conceptualise, Operationalise and Measure Them? Soc. Sci. Med. 2002, 55, 125–139. [Google Scholar] [CrossRef]
Figure 1. The Kansas City metro area exhibits classic patterns of urban sprawl. True-color composite image from Landsat (30 m) 6 June 2011.
Urbansci 08 00176 g001
Figure 2. Spatial distributions of asthma rates and independent variables. Moving from top left to bottom right, the plots show values per census tract: (a) the relative risk of acute asthma incidence compared to the study area mean rate, (b) the proportion of population living with an income to poverty ratio of below 2.00 indicating doing poorly or struggling, (c) the proportion of the population who identifies as non-White, (d) the mean fractional vegetation (Fr) indicating the amount of vegetative cover, (e) the mean land-surface temperature (LST), (f) and quintiles of the mean PM2.5 concentration.
Urbansci 08 00176 g002
Figure 3. Descriptive plots showing bivariate means of asthma rates. Independent variables are divided into quintiles and the mean asthma rate calculated for each bin. Asthma rates are highest in (a) neighborhoods characterized by high poverty and lower than the 80th percentile of fractional vegetation (Fr), (b) high poverty ratio and high proportion of non-White residents, (c) Fr below the 80th percentile and high proportion of non-White residents, (d) high poverty ratio and high PM2.5 concentrations, (e) low Fr and high PM2.5 concentrations, and (f) high proportion of non-White residents and PM2.5 concentrations above the the 20th percentile.
Urbansci 08 00176 g003
Figure 4. Posterior distributions of exponentiated model coefficients for Model 4. Acute asthma incidence per census tract is modelled on the proportion of residents with a poverty to income ratio below 2.00, the proportion of residents who identify as non-White, the fractional vegetation (Fr), quintiles of PM2.5, and the interaction between Fr and the quintiles of PM2.5.
Urbansci 08 00176 g004
Figure 5. Effects of PM2.5 quintiles on asthma incidence conditioned on the proportion of residents living in poverty (a) and effects of the interaction between fractional vegetation (Fr) and PM2.5 quintiles on asthma incidence conditioned on the proportion of residents living in poverty. Conditional effects are shown for fixed values (0.25, 0.5, 0.75) of proportion of residents living in poverty. The effect of PM2.5 is stronger in neighborhoods characterized by higher poverty rates. In neighborhoods with PM2.5 concentrations above the 40th percentile (Q3–Q5), PM2.5 has a stronger positive effect on asthma rates (a). In these higher-pollution neighborhoods, Fr has a negative impact on asthma rates with the magnitude of this effect being larger in neighborhoods with higher poverty rates (b).
Urbansci 08 00176 g005
Figure 6. Effects of PM2.5 quintiles on asthma incidence conditioned on the proportion of non-White residents (a) and effects of the interaction between fractional vegetation (Fr) and PM2.5 quintiles on asthma incidence conditioned on the proportion of non-White residents (b). Conditional effects are shown for quintiles of the proportion of non-White residents. The effect of PM2.5 is stronger in neighborhoods characterized by higher proportions of non-White residents. In neighborhoods with PM2.5 concentrations above the 40th percentile (Q3–Q5), PM2.5 has a stronger positive effect on asthma rates (a). In these higher-pollution neighborhoods, Fr has a negative impact on asthma rates with the magnitude of this effect being larger in neighborhoods with a higher proportion of non-White residents (b).
Urbansci 08 00176 g006
Figure 7. Posterior predictive checks. Plot shows densities of simulated values overlaid on the density of observed values. The x-axis is truncated to highlight the area of greatest density.
Urbansci 08 00176 g007
Figure 8. Mean acute asthma counts from the posterior replications for each census tract shown with the observed counts. From left to right, the plots show (a) the predicted counts against the observed counts and (b) the percent difference between the mean predicted counts and the observed counts.
Urbansci 08 00176 g008
Table 1. Demographic characteristics of the Kansas City Metro Area from the American Community Survey 5-year estimates. Data accessed through Social Explorer (www.socialexplorer.com, accessed on 20 May 2024).
CategoryAttributesPopulationPercent
TotalTotal population1,999,718
AgePop. under 18515,65325.8
RaceWhite Alone1,594,66379.7
Black or African American Alone246,53612.3
American Indian and Alaska Native Alone90100.5
Asian Alone44,5892.2
Native Hawaiian and Other Pacific Islander Alone24150.1
Some Other Race Alone50,0122.5
Two or More Races52,4932.6
Ratio of income-to-poverty levelPop. for whom poverty status is determined1,967,280
Under 1.00 (Doing Poorly)217,60611.1
1.00 to 1.99 (Struggling)307,62315.6
Under 2.00 (Poor or Struggling)525,22926.7
2.00 and Over (Doing Ok)1,442,05173.3
Table 2. Structure of the original pediatric asthma data records submitted by CMH to UMKC-CEI.
CategoryAttributes
DiagnosisDate of admission
ICD-9 code
Event account number
Patient medical record number (MRN)
Patient residential address
DemographicsBirthdate
Sex
Race
Ethnicity
Visit characteristicsPayment type
Patient class
Table 3. Mean values of independent variables in census tracts stratified by quintiles of asthma rate, increasing in prevalence from 1 to 5. Neighborhoods characterized by the highest rates of asthma have higher poverty ratios, higher proportions of non-White residents, lower fractional vegetation (Fr), and higher PM2.5 concentrations compared to neighborhoods with lower asthma rates.
Asthma Rate (Quintiles)
12345
Mean proportion poverty–income ratio below 2.00.120.180.290.420.57
Mean proportion non-White residents0.100.140.200.380.72
Mean Fr0.630.580.550.570.46
Mean PM2.510.4210.7210.8811.0011.14
Table 4. Exponentiated estimates (IRRs) with 89% credibility intervals. Lower WAIC (widely applicable information criterion) indicates better model fit.
Model 1Model 2Model 3Model 4
Intercept0.060.050.050.04
[0.06, 0.07][0.05, 0.06][0.04, 0.06][0.03, 0.05]
Prop. poverty ratio under 2.03.422.142.151.91
[2.63, 4.44][1.63, 2.83][1.62, 2.85][1.43, 2.56]
Prop. non-White Q21.321.291.291.33
[1.19, 1.47][1.17, 1.44][1.16, 1.44][1.19, 1.48]
Prop. non-White Q31.601.571.571.61
[1.43, 1.79][1.41, 1.74][1.41, 1.76][1.44, 1.80]
Prop. non-White Q42.252.322.322.35
[1.98, 2.55][2.05, 2.62][2.05, 2.63][2.08, 2.66]
Prop. non-White Q54.334.664.654.80
[3.71, 5.07][4.01, 5.43][4.00, 5.43][4.12, 5.61]
Fr 1.001.65
[0.81, 1.24][1.00, 2.73]
PM2.5 Q2 1.201.191.13
[1.08, 1.33][1.08, 1.32][0.72, 1.77]
PM2.5 Q3 1.411.402.57
[1.26, 1.57][1.26, 1.56][1.68, 3.94]
PM2.5 Q4 1.441.432.24
[1.28, 1.61][1.28, 1.60][1.40, 3.57]
PM2.5 Q5 1.501.492.38
[1.33, 1.69][1.32, 1.69][1.60, 3.56]
Fr × PM2.5 Q2 1.15
[0.58, 2.27]
Fr × PM2.5 Q3 0.38
[0.20, 0.74]
Fr × PM2.5 Q4 0.51
[0.25, 1.07]
Fr × PMV Q5 0.48
[0.25, 0.91]
Bayes’ R20.7590.7700.7690.767
WAIC4598.54567.94570.04566.9
Disclaimer/Publisher’s Note: The statements, opinions and data contained in all publications are solely those of the individual author(s) and contributor(s) and not of MDPI and/or the editor(s). MDPI and/or the editor(s) disclaim responsibility for any injury to people or property resulting from any ideas, methods, instructions or products referred to in the content.