Abstract
This article is the first attempt to understand and develop an effective tool to support decision-makers in defining actions aimed at the development of rural areas in view of the global rationalization and optimization of resources. The objective was to create a rurality index (RI) to assist in resource allocation and policy design by considering the unique characteristics of India addressing a critical gap in regional development studies. A modified Fuzzy Analytical Hierarchy Process (F-AHP) was used to develop an RI tailored to the Gonda district in India. A comprehensive survey of 1300 experts guided the selection and prioritization of 21 factors across six domains: education, infrastructure, employment, agriculture, healthcare, and social index. These factors were then applied to assess 1214 villages in 16 development blocks. This methodology facilitated the ranking and zoning of the areas, resulting in 16 distinct zones, which enhanced the interpretability of the results. Rupaideeh and Itiyathok emerged at the top of the combined domain rankings, while Babhanjot and Chapiya occupied the bottom positions. The developed index provides a robust framework for guiding resource allocation and designing targeted interventions, thereby promoting more equitable development across communities. The results underscored the complex interplay of factors influencing village development across the assessed regions. Moreover, this model demonstrated the potential for adaptation and application in diverse localities, subject to appropriate modifications of parameters to suit local contexts. The index’s versatility and comprehensive approach offers valuable insights for policymakers and development practitioners seeking to address regional disparities effectively.
1. Introduction
India, a developing country, has been grappling with regional imbalances since achieving independence in 1947. Since then, three major definitions of rurality have prevailed in the Indian context, indicating three historical periods of social, economic, and cultural changes. Termed “Agricultural rurality” (1947–1960), the initial definition conceptualized ruralism as a rural–urban dichotomy. During this period, rurality was characterized by poverty and inadequate infrastructure, contrasting sharply with urban areas. The prevailing view held that rural regions required modernization and industrialization to bridge this developmental gap. The second term, “Industrial rurality” (1960–1990), was marked by the Green Revolution and the proliferation of small-scale industries and enterprises in areas. This period saw significant efforts to industrialize and modernize agricultural practices. Finally, the concept of “Postindustrial rurality” (1990 to present) emerged alongside economic liberalization, reframing rural areas as potential hubs for tourism, organic farming, and an enhanced quality of life [1]. This shift in perspective not only highlighted the unique advantages of rural settings in the contemporary era but also introduced new opportunities and challenges for the nearby populations. The difference between “rural” and “rurality” lies in their usage and scope. “Rural” is a term that describes areas or characteristics associated with the countryside, such as “rural communities” or “rural landscapes.” It directly refers to aspects typical of non-urban environments. In contrast, “rurality” is a noun that denotes the quality or state of being rural. It encompasses the broader characteristics and degree to which an area is rural, including factors like population density, economic activities, and lifestyle. While “rural” acts as a description, “rurality” defines the extent and nature of rural characteristics [2]. The budget of the Department of Rural Development of India has significantly increased over the past few decades, being allocated INR 1,57,545 crore for 2023 [3]. Given the wide range of factors at play alongside the growing pressure on various governmental departments to effectively manage and allocate resources, it has become necessary to develop a system that considers essential factors native to an area for defining village characteristics and subsequently allowing for a better understanding of the area from a management and development standpoint.
In the district of Gonda, Uttar Pradesh, the selection and implementation of policies and programs are guided by a combination of central and state government initiatives, local needs assessments, and community participation. This process involves multiple stakeholders, including government bodies at various levels, non-governmental organizations, and the local community (Table 1).

Table 1.
Elective and Administrative Structure of India [4].
The multi-tiered approach to policy selection in Gonda includes [5]:
- Central Government Policies: Major rural development programs such as MGNREGA and Pradhan Mantri Awaas Yojana—Gramin (PMAY-G) are formulated and funded by the central government. These programs are adapted and implemented at the state and district levels.
- State Government Policies: The state government of Uttar Pradesh tailors these central programs to local conditions and runs its own schemes, such as the Uttar Pradesh Skill Development Mission (UPSDM) and the State Innovations in Family Planning Services Project Agency (SIFPSA).
- District Administration: The District Planning Committee (DPC) in Gonda plays a crucial role in planning and approving local development projects. The DPC formulates district plans based on input from various local bodies and aligns them with state and national policies. In the case of the Gonda district, the main focus at the moment is on “School Chalo Abhiyan”, which is being carried out to promote education.
- Panchayati Raj Institutions (PRIs): PRIs, including Gram Panchayats, Block Panchayats, and District Panchayats, are instrumental in the planning and implementation of rural development programs. They engage with local communities to identify their needs and priorities and ensure the execution and monitoring of various schemes at the village level.
Based on the programs and policies being implemented in the area, their effectiveness and impact are measured through the undermentioned tools [6]:
- HDFC Bank’s Holistic Rural Development Program (HRDP): This program focuses on four main domains: Natural Resource Management (NRM), Skill and Livelihood Enhancement, Health and Sanitation, and Education. Specific indicators within these domains include:
- 1.1.
- NRM: Land area under irrigation, application of organic manure, and sustainable agriculture practices.
- 1.2.
- Skill and Livelihood: Participation in skill training, livelihood enhancement activities, income from agriculture and non-agricultural sources.
- 1.3.
- Health and Sanitation: Access to clean drinking water, sanitation facilities, health infrastructure, and services.
- 1.4.
- Education: Infrastructure development, student and teacher engagement, and learning outcomes.
- Integrated Rural Development Program (IRDP): The IRDP in Gonda assesses the impact of the program on the economic and agricultural conditions of beneficiaries. Key indicators include:
- 2.1.
- Economic Indicators: Income levels, employment rates, and poverty rates.
- 2.2.
- Asset Creation: Types of durable assets created under the program.
- 2.3.
- Agricultural Productivity: Crop yield, land under irrigation, use of high-yielding varieties, and chemical fertilizers.
- National Health Mission (NHM): This mission focuses on health-related indicators, including:
- 3.1.
- Maternal and Child Health: The Maternal Mortality Ratio (MMR), Infant Mortality Rate (IMR), Total Fertility Rate (TFR), and anemia prevalence.
- 3.2.
- Communicable Diseases: Incidence and mortality rates for diseases like tuberculosis, malaria, and kala-azar.
- 3.3.
- Health Infrastructure and Services: Availability and utilization of health services, quality of care, and patient satisfaction.
Traditional methods are thus unable to fully capture the localized characteristics and needs of the communities. A Multi-Criteria Decision-Making (MCDM) approach can address these shortcomings by providing a rational, objective, and non-biased framework for decision-making. The MCDM approach offers a more nuanced and comprehensive framework for decision-making by considering multiple criteria and their relative importance. Key features include:
- Holistic Evaluation: Considers a wide range of factors, including social, economic, environmental, and cultural dimensions.
- Participatory Methods: Involves stakeholders in the decision-making process to ensure that local needs and preferences are considered.
- Dynamic and Flexible: Adapts to changing conditions and priorities, allowing for continuous improvement and optimization of resource allocation.
- Quantitative and Qualitative Analysis: Combines both quantitative data and qualitative insights to provide a balanced and comprehensive assessment.
This study aimed to define a suitable methodology for identifying areas needing targeted political–economic measures based on the degree of rurality. In this study, a multi-criteria model correlated with spatial analysis techniques was developed to construct a localized rurality index for the Gonda district. This approach incorporates variables that best capture rurality. The rankings and zoning of areas were carried out using the modified fuzzy analytical hierarchy process (F-AHP). The F-AHP was used because it can evaluate the relative importance of various criteria by taking inputs from the experts, thus capturing human ambiguity. By incorporating the variables that best capture rurality, the F-AHP can facilitate informed decision-making and optimize resource allocation at the regional level, ensuring that development initiatives are tailored to the specific needs of areas like Gonda.
2. Methodology
The MCDM theories focus on creating and using decision-support tools and procedures to address complicated choice issues involving several criteria, goals, or objectives that conflict with one another. The F-AHP, multi-attribute utility theory, AHP, DEA, and many other MCDA theories are available for resolving the aforementioned issues [7,8,9,10]. All these decision-making techniques differ in how the objectives and alternative weights are calculated. This paper evaluated villages using the F-AHP MCDA model, which was modified to help with both qualitative and quantitative assessments. The implementation of this methodology can be carried out in two significant segments: the preliminary stages (1) to (3) and the main stages (4) and (5).
2.1. Preliminary Stages
- Establishing the Objective: The main objective of this research is to assess the current situation of rural areas through ranking and zoning, which would help in the allocation of resources and policies.
- Defining a Set of Evaluation Criteria: Access to reliable data is one of the critical requirements of a study [11,12]. As such, the initial factors for evaluating villages were selected based on the literature review; the policies enacted; and a survey of 1300 policymakers, bureaucrats, and politicians from the target blocks. A total of 21 factors were identified (Table 2).
 Table 2. Statistical analysis of the data sets of the factors and indicators.
 - Hierarchical Structure: After the finalization of factors (in total 21), a hierarchical structure was drawn up which divided the factors into six domains: Socioeconomic, Education, Infrastructure, Employment, Agriculture, and Healthcare. This structure allows any specific department to utilize the results for managerial purposes without worrying about the influence of the other factors and domains (Figure 1).
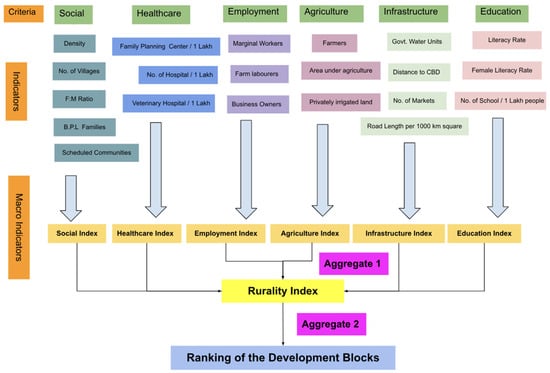 Figure 1. Weightage of factors and hierarchical structure.
2.2. Main Stages
- Calculating Factor Weights: The weights of the factors and domain defined in step (2) were determined in this stage. The estimation was performed with F-AHP, which is described in Section 4. A separate survey was carried out and included seven experts, the head of the department of each domain, and one university professor who acted as a buffer (Figure 1).
- Ranking the Villages: In this step, the data of the factors were used to calculate the rurality index for each domain for every development block. The results were used to rank and zone 16 development blocks (Table 3).
 Table 3. Ranking of the development blocks of the Gonda district based on global scores.
2.3. Identification of the Parameters
The first step in developing the rurality index was identifying factors suitable for the “Indian Context”, which refers to the specific socioeconomic, cultural, and geographical conditions in India that are relevant to the study. An extensive literature review was conducted on government policies related to village development in India, especially in the target area. The aim was to select factors representing the multidimensional nature of rurality, encompassing social, economic, infrastructure, and employment aspects. The availability of localized data at the village level was also crucial for the spatial analysis techniques used in this study. Indicators with accessible disaggregated data from the census and other government sources were prioritized [13,14,15]. For example, data on population demographics, livelihoods, basic amenities, and facilities were available and relevant for capturing rurality. To identify the most relevant indicators for rurality in the local context, a survey was conducted of 1300 people working across various government departments at the block, district, and state levels, as well as elected representatives (Table 1). The survey compiled opinions on the key parameters that impact village development and living standards based on residents’ domain experience in planning and governance. Additionally, more than 100 government policies and programs related to rural development were analyzed to cross-verify the overlap of significant factors. The final set of 21 indicators across 6 domains was selected based on the frequency and consensus from this comprehensive survey, along with data availability constraints (Table 2). This ground-up approach combining grassroots stakeholder perspectives with policy analysis helped ensure that the rurality factors were tailored to local developmental needs.
To enable aggregation and comparison across the diverse indicators, they were standardized using the fuzzy set theory [16]. Unlike binary logic, fuzzy logic allows for partial memberships from 0 to 1 to account for uncertainty. Spatial fuzzy functions were defined for each indicator based on the data type and distribution to transform them to a 0–1 scale. For instance, a decreasing linear function was used for population density, where lower density indicates higher rurality. An integrated scoring model was subsequently developed to express rurality as a weighted summation of the standardized indicators for each village. The weighting reflects the relative importance of the factors in characterizing rurality in the regional context. This approach provided a flexible multicriteria framework to construct a rurality index tailored to local conditions in India. The scores enabled comparative ranking and spatial clustering to delineate rurality zones with similar developmental challenges.
2.4. Allocation of Weightage to Parameters Via the F-AHP Inspection Method
Weighted linear combination (WLC) is one of the most employed aggregation methods in decision-making [17,18].
For the allocation of weights, the F-AHP in combination with WLC is employed, which is one of the most widely accepted decision-making and prioritization methodologies. The F-AHP uses quantitative analysis to provide results for a qualitative problem. This technique evaluates the weights of domains and elements using a nine-point scale devised by Saaty [19].
2.5. Setting up a Pairwise Comparison Matrix of Criteria
In this phase, a comparison matrix was constructed to compare the factors. An inspection technique was utilized in this article. When an assessment is carried out with the participation of expert users exclusively, an inspection technique of evaluation is applied. An in-section approach seemed more appropriate for this part of the study since the importance of each factor would have been decided by the experts’ viewpoint. A panel of seven experts was chosen to compare the factors side by side. The expert group comprised one expert from each domain (Head of the Department of the Gonda district) and one university professor who acted as a buffer to consider diverse views. A comprehensive statistical analysis was carried out on the factors to adequately explain the data set and provide better insight into the situation for the experts regarding the villages before asking them to weigh the factors (Table 2). Additionally, at this point, factors were identified as beneficial or non-beneficial factors. A higher value of beneficial factors was desired, and a lower value of non-beneficial factors was considered good.
Table 2 Each expert completed the matrix of the pairwise factor comparison. Then, each cell of the final matrix was computed as a geometric mean of the other matrices gathered by the experts, resulting in the formation of a final matrix. Following pairwise comparisons, estimates were carried out, resulting in a final set of domain and factor weights (Figure 1). In this stage, the comparison matrix’s principal eigenvalue and consequent normalized right eigenvector determined the relative significance of the analyzed factors and domains. The elements of the normalized eigenvector were the weights of the domain and factors. In this study, an open-source decision-making program was used which implemented the F-AHP to perform the required computations to make this process convenient. Table 2 depicts the weights of the factors. Instead of using an eigenvector, the findings would have been slightly different if the geometric mean was used for the calculation of the factors’ weights. However, the difference would have been almost negligible and the final ranking would have remained unchanged [20].
The experts considered ‘Education’ to be the most binding domain, but the ‘(%) of Land irrigated privately’ factor was rated highest when evaluating the areas. The ‘Employment’ domain was considered the least important for the assessment. The viability of the study primarily depended on its’ accessibility to local experts of proven prestige who could provide well-founded and consistent responses during the surveying process, as per the requirements of the F-AHP. The consistency ratio (C.I.) should be less than 0.1, and, in the case of this study, it was 0.08543 (Table 2) [21]. To establish the objective importance or weight for each factor, the F-AHP methodology was employed as an analytical approach. In contrast to the PCA method used in previous works [22,23] by Cozzi and Eastman, the F-AHP offers a structured and systematic means of assessing the relative significance of variables within a complex decision-making context [24,25]. The F-AHP, distinguished by its use of linguistic variables and hierarchical structure, facilitates the examination of relationships among various quantitative variables while accommodating imprecision and uncertainty in expert judgments. Unlike PCA, which relies on statistical correlations, the F-AHP derives the relative importance of each variable through expert opinions and pairwise comparisons. Within the F-AHP framework, the significance of each variable is determined based on pairwise comparisons and aggregated preferences. This approach ensures that variables are assessed based on their relevance within the decision model, mirroring the consideration of redundancy in PCA [26,27]. The output of the F-AHP provides a set of relative importance values (weights) for the variables, enabling an objective and systematic assessment of variable importance within the decision-making process.
3. Ranking: The F-AHP Method
A conventional Fuzzy Analytic Hierarchy Process (F-AHP) approach typically concludes with the assignment of factor weights. However, this study extends the methodology by integrating the Weighted Linear Combination (WLC) technique to generate a comprehensive RI. Information on the influential weight of each variable was utilized to rank and zone the areas based on the data of the factors under consideration. The final scores of the villages were calculated and weighted using the weights acquired from the experts via the preceding fuzzy method via equations [28,29,30].
where is the performance value of the ith alternative over the jth criteria.
The final score was calculated based on the parameters’ global score. Furthermore, the villages were ranked and categorized based on their overall and final scores. The rankings of the areas are shown in Table 3, and the results of the zoning are shown in Figure 2, Figure 3, Figure 4, Figure 5, Figure 6, Figure 7 and Figure 8.
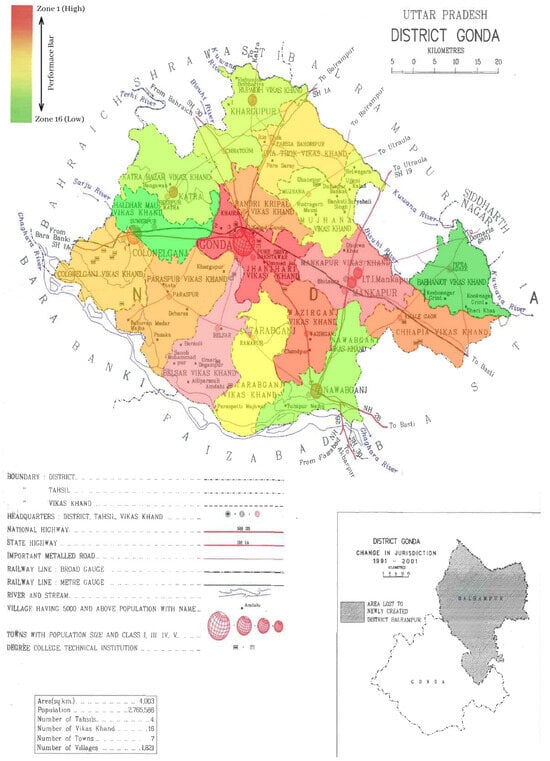
Figure 2.
Combined Domain Zoning Map Source: Original image from the Office of the Chief Development Officer for Gonda, India.
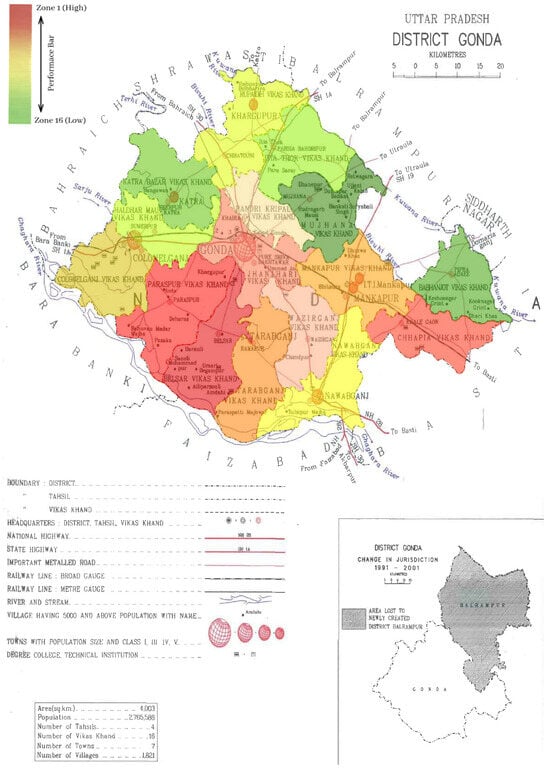
Figure 3.
Education Domain Zoning Map.
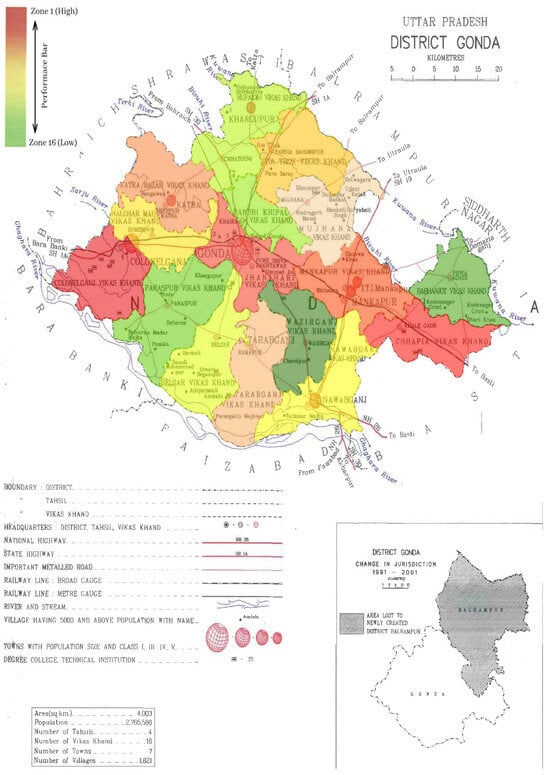
Figure 4.
Healthcare Domain Zoning Map.
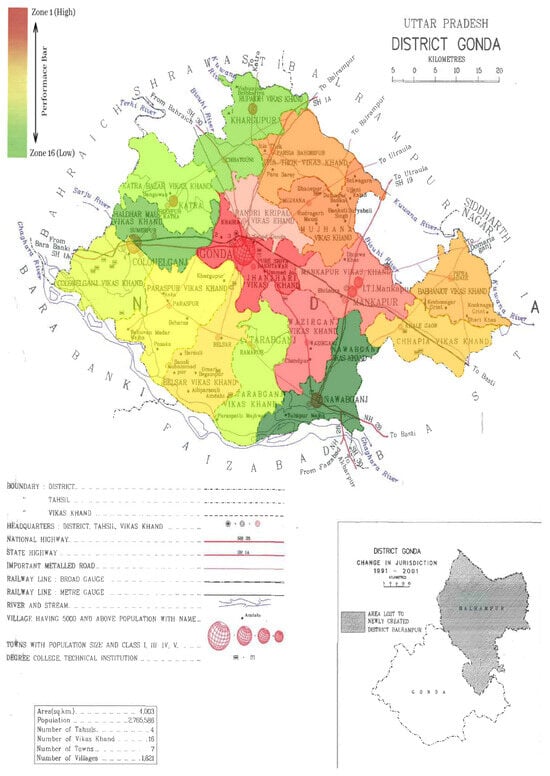
Figure 5.
Infrastructure Domain Zoning Map.
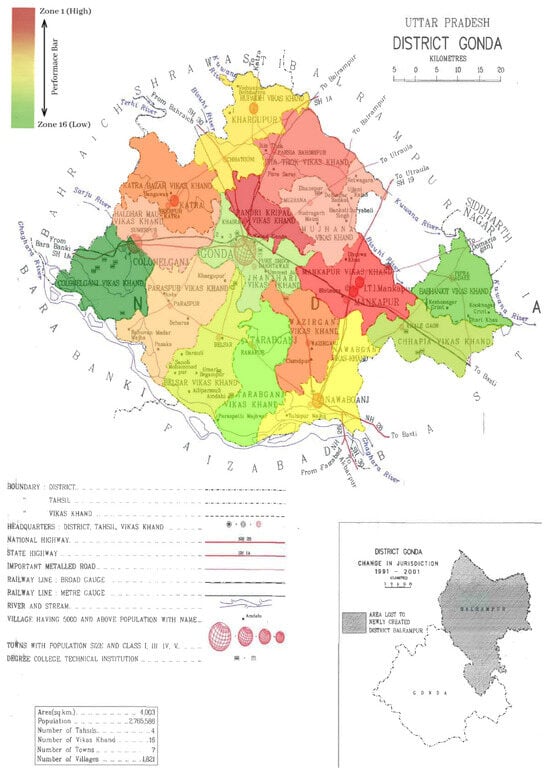
Figure 6.
Agriculture Domain Zoning Map.
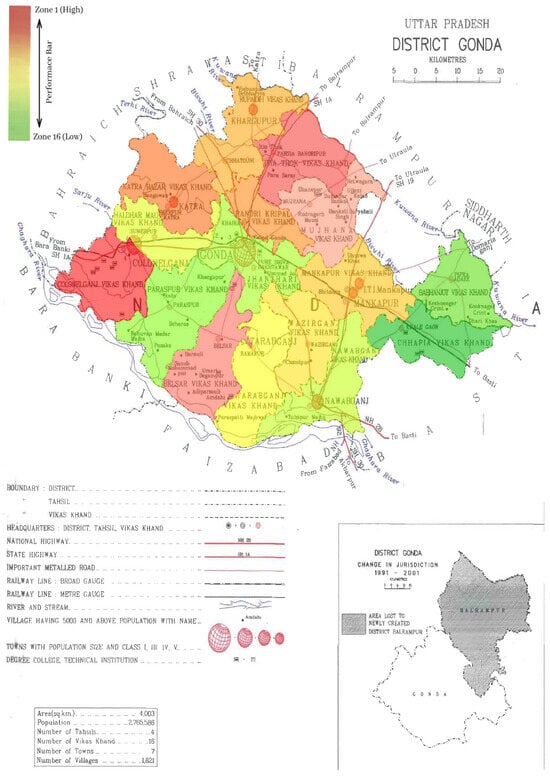
Figure 7.
Employment Domain Zoning Map.
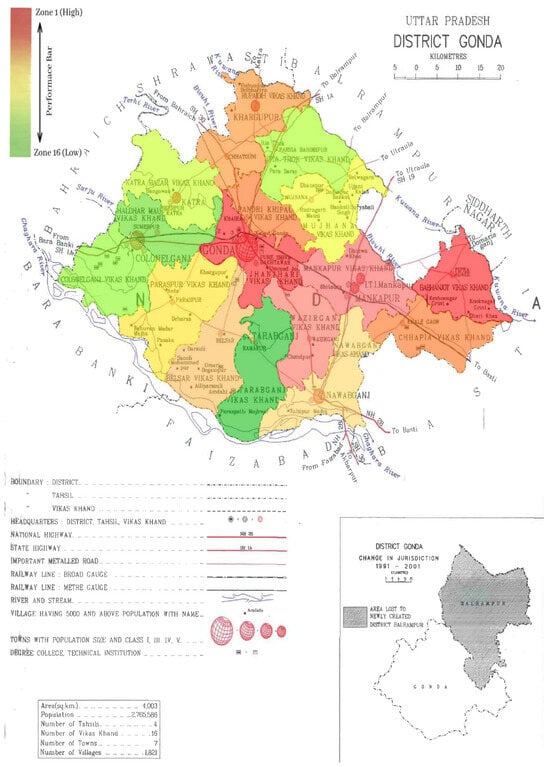
Figure 8.
Social Indicator Domain Zoning Map.
In the present study, the rurality indicators were transformed into a standardized range between 0 and 1 using fuzzy functions, with 0 representing the minimum and 1 the maximum degree of rurality. The weighted linear combination (WLC) method was employed to aggregate these indicators. Weights for the WLC were determined using the fuzzy analytical hierarchy process (F-AHP) [23,31,32]. This process produced a ranking of each development block, each representing the degree of rurality for one of the six macro indicators. These individual rankings were further combined by conducting F-AHP weighting and subsequent WLC aggregation, resulting in a unified Rurality Index (RI) and ranking and zoning for the Gonda district (Table 3).
4. Results and Discussion
This section provides a block-wise analysis across key domains, including education, healthcare, infrastructure, agriculture, employment, and social indicators, revealing the developmental dynamics and disparities across the Gonda district. The results of the ranking can be found in Table 3 and zoning of the areas can be observed in Figure 2, Figure 3, Figure 4, Figure 5, Figure 6, Figure 7 and Figure 8. The finalized data set is attached as a Supplementary copy for reference.
4.1. Education Dynamics
Education is the cornerstone of development, and, in the Gonda district, Belsar and Paraspur stand out as the leading educational hubs, securing the first and second ranks, respectively. Belsar hosts 310 schools and Paraspur has 296, all conveniently located near major roadways, contributing to their high literacy rates of over 85%. The proximity to urban centers and a thriving knowledge economy has significantly propelled their educational success. However, Babhanjot and Mujhena, ranked 15th and 16th, struggle with lower literacy rates, sparse school infrastructures, and limited financial facilities. Mujhena is particularly hampered by low institutional density, which restricts educational opportunities. On the other hand, Jhanjhari, ranked fourth, benefits from a literacy rate of approximately 74%, well above the district average of 66%. Its favorable location near major educational institutions and training centers offers better access to resources, with 12 schools per 100,000 people and a female literacy rate of around 68%. In contrast, Babhanjot, with a literacy rate below 60% and only five schools per 100,000 people, highlights the severe educational disparities in more isolated regions. Haldharmau, ranked 12th, also faces challenges, with a literacy rate of 62% and fewer educational facilities, resulting in a lower female literacy rate of 55%. Mankapur, which stands at seventh place, indicates potential, featuring a 70% literacy rate and improved gender parity thanks to its closeness to a regional educational hub (Table 3 and Figure 3).
4.2. Healthcare Disparities
Healthcare access varies widely across the district, with Colonelganj leading the rankings, the credit for which goes to its well-equipped hospitals providing more than twelve beds per 10,000 people. Its strategic location along major transport routes enhance accessibility to other high-capacity medical facilities, and the proximity to a district-level healthcare center adds to its strengths. With three hospitals and two veterinary hospitals per 100,000 people, supported by strong family planning and outreach services, Colonelganj is well positioned to meet the healthcare needs of its residents. Chapiya, ranked second, benefits from a notable 90% institutional birth rate and access to mobile health units and regular health camps, all contributing to its high healthcare ranking. However, the picture is quite different in more remote blocks like Paraspur, ranked 14th, where affordability and accessibility remain a major challenge due to a lack of all-weather roads and medical staff. The three-tier public healthcare delivery system in these areas needs strengthening to bridge these gaps. Wazirganj, ranked 16th, struggles with minimal healthcare infrastructure, having only 1.2 branches per 10,000 people, and heavily relies on alternative medicine, leaving 58% of its residents with limited access to modern healthcare. Babhanjot, ranked 15th, fares slightly better but still has only one hospital per 100,000 people and limited family planning services. Haldharmau, ranked ninth, faces similar issues, with insufficient healthcare facilities contributing to its mid-tier ranking (Table 3 and Figure 4).
4.3. Infrastructure Variances
Infrastructure is a key driver of development, and this is clearly reflected in Jhanjhari, which ranks first due to its strategic location along metro corridors. This advantageous positioning supports a robust infrastructure, with 150 km of road length per 1000 km2 and widespread government water units, ensuring excellent connectivity and access to resources. The proximity to Central Business District (CBD) markets, just 10 km away, further stimulates economic activities. Unfortunately, remote areas like Haldharmau, ranked 15th, suffer from only 50% all-weather road connectivity and 37% bus transit access, according to 2011 census records. Expanding schemes like the Pradhan Mantri Gram Sadak Yojana (PMGSY) to these underdeveloped areas could significantly improve accessibility. Mankapur, ranked third, demonstrates the impact of strong infrastructure development, with 140 km of road length per 1000 km2, close market access, and its proximity to the Mankapur railway station. Rupaideeh, ranked 14th, struggles with inadequate infrastructure, with only 70 km of road length per 1000 km2 and a significant 25 km distance to the nearest CBD market, impeding economic growth. Haldharmau faces similar challenges, with poor road networks and limited access to essential services, underlining the need for targeted infrastructure investments (Table 3 and Figure 5).
4.4. Agricultural Productivity
Agriculture is the lifeblood of the Gonda district, particularly in areas like Pandri Kripal, which ranks first in agricultural productivity. Here, over 75% of the population is engaged in farming, supported by 85% of the land under cultivation and efficient private irrigation covering 75% of the agricultural area. The fertile soil and favorable climate conditions further enhance productivity. Mankapur, ranked second, is a leader in oilseed production, with 80% of its land being cultivated and 70% irrigated privately. The presence of well-developed irrigation systems and agricultural support services, alongside state schemes ensuring 90% water accessibility, has fueled Mankapur’s agricultural success. However, regions like Colonelganj and Babhanjot, ranked 16th and 15th, respectively, face significant challenges. Colonelganj has only 60% of its land under cultivation and poor irrigation coverage, while Babhanjot struggles with similar issues, having 65% of its land cultivated and limited private irrigation facilities. Crop diversification remains a challenge in wheat-dominant zones like Chapiya, ranked 12th (Table 3 and Figure 6).
4.5. Employment Status
Employment opportunities in the Gonda district vary widely, with Colonelganj and Itiyathok, ranked first and second, benefiting from thriving manufacturing and trading ecosystems. Their proximity to Lucknow, the state capital, provides access to training, knowledge, and diverse job opportunities, which significantly boosts their economic standing. Colonelganj’s diversified economy, with 40% of the population involved in non-agricultural activities, reduces economic vulnerability, while Itiyathok maintains a low percentage of marginal workers. In contrast, Babhanjot, ranked 15th, faces severe employment challenges due to its low industry presence and skill gaps. With 55% of the population reliant on agriculture, economic stagnation is a persistent issue. Chapiya, ranked 16th, is similarly disadvantaged, with 60% of its workforce being engaged in low-paying marginal jobs, leading to economic instability. Addressing these challenges will require replicating successful apprenticeship models, providing soft loans for entrepreneurial units, and establishing strong market linkages to foster economic growth and reduce dependency on marginal work (Table 3 and Figure 7).
4.6. Social Index
The analysis of social indicators in the Gonda district demonstrates a peculiar interconnectedness of factors, contributing to the district’s overall state of well-being. For example, Babhanjot, ranked first, excels with a lower percentage of ‘Below Poverty Line (BPL) families’ (20%) and a favorable ‘Female to Male (F:M)’ ratio of 940:1000, indicating better social welfare and gender equality. However, despite its strong social metrics, Babhanjot’s lower employment ranking suggests that social well-being does not always translate into economic success. Mankapur, ranked second, also shows strong social indicators, with 25% BPL families and a similar F:M ratio, reflecting good community health metrics. On the other hand, Haldharmau, ranked 15th, faces significant social challenges, with 45% of families living below the poverty line and a lower F:M ratio of 910:1000. Colonelganj, despite its economic success, ranks poorly in social indicators due to a higher percentage of BPL families and less favorable gender ratios. These disparities highlight the need for comprehensive development strategies that balance social welfare with economic opportunities, ensuring that improvements in one area support growth in others (Table 3 and Figure 8).
The disparities in development indicators across the Gonda district highlight the significant challenges posed by infrastructure and technology gaps hindering human development. The analysis emphasized the need for bottom-up, equitable development strategies tailored to the unique characteristics of each block. The success of Jhanjhari (combined ranking: first), driven by its infrastructure development, demonstrates the potential of targeted planning, which could be replicated in underperforming areas like Babhanjot, where credit exclusion exceeds 64% (Table 3 and Figure 2). Additionally, incorporating social audits into programs like the National Rural Health Mission could enhance accountability and improve healthcare quality, particularly in remote areas like Paraspur, which lacks the well-equipped facilities found in Colonelganj. The correlation between infrastructure and block rankings is evident, with Jhanjhari’s extensive road network and market access driving its economic growth, while Rupaideeh’s inadequate infrastructure hinders its development. In agriculture, the contrast between Pandri Kripal’s high land cultivation rates and Chapiya’s challenges with crop diversification calls for targeted interventions to boost farmer profits.
The ranking system serves as a vital tool for policymakers, enabling efficient resource allocation and the formulation of targeted policies to address the specific needs of each block. Overall, the study underscores the necessity of comprehensive strategies that integrate improvements in education, healthcare, infrastructure, and agriculture to foster sustainable growth and reduce inequalities within the district.
5. Conclusions
The study aimed to develop a comprehensive rurality index for the Gonda district, confirming expectations of significant disparities in development across its blocks. While the findings highlighted contrasts in educational infrastructure, healthcare access, agricultural productivity, and overall development, they also revealed unexpected complexities, particularly the intricate relationship between social indicators and economic outcomes, as seen in Babhanjot’s high social index ranking despite its lower employment levels. This challenges the conventional linear understanding of development and underscores the necessity for a multidimensional approach that considers a broader range of factors. However, the rurality index, while a valuable tool, has limitations due to its static nature, which fails to capture the dynamic aspects of rural development. Its applicability to other regions requires careful adaptation to local contexts and indicator selection, emphasizing the need for continuous refinement.
Future research should address these limitations by incorporating temporal dynamics into the rurality index, enabling tracking of development progress over time and offering a more comprehensive understanding of regional evolution. Expanding the index to include factors such as environmental sustainability, cultural heritage, and digital connectivity, along with diverse expert inputs, could refine the methodology further. Additionally, evaluating the effectiveness of policies implemented based on the index will be crucial in enhancing its utility as a guide for policymakers. The study’s methodology, integrating Multiple-Criteria Decision-Making (MCDM) techniques with stakeholder input and statistical analysis, offers a replicable and adaptable model for assessing rurality, making it a valuable tool for guiding resource allocation and designing targeted interventions in rural areas globally.
Supplementary Materials
The following supporting information can be downloaded at: https://www.mdpi.com/article/10.3390/urbansci8040168/s1.
Author Contributions
Conceptualization, A.S. and H.O.; methodology, A.S. and H.O.; software, A.S.; validation, A.S. and H.O.; formal analysis, A.S.; investigation, A.S.; resources, A.S. and H.O.; data curation, A.S. and H.O.; writing—original draft preparation, A.S.; writing—review and editing, H.O.; visualization, A.S.; supervision, H.O.; project administration, H.O. All authors have read and agreed to the published version of the manuscript.
Funding
This research received no external funding.
Data Availability Statement
The data can be made available upon request.
Acknowledgments
We extend our heartfelt gratitude to the District Collector’s Office in Gonda and the Statistical Bureau of the Gonda District for their invaluable support and cooperation in the collection of data and surveys. Your assistance has been instrumental in the successful completion of our research. We also wish to express our sincere thanks to all the Heads of Departments in Gonda for their guidance and contributions. Your expertise and commitment have been essential in achieving our goals.
Conflicts of Interest
The authors declare no conflicts of interest.
References
- Singh, K. Rural Development: Principles, Policies and Management; SAGE Publications India Pvt Ltd.: New Delhi, India, 2009. [Google Scholar] [CrossRef]
- PRS Legislative Research Report of the 15th Finance Commission for 2021-26; Delhi, India. 2021. Available online: https://prsindia.org/policy/report-summaries/report-15th-finance-commission-2021-26 (accessed on 20 November 2022).
- U. P. Directorate of Census Operations. Uttar Pradesh–Series 10—Part XII A—District Census Handbook, Gonda in Census of India 2011. 2011. Available online: https://censusindia.gov.in/nada/index.php/catalog/1218 (accessed on 20 November 2022).
- Isserman, A.M. In the National Interest: Defining Rural and Urban Correctly in Research and Public Policy. Int. Reg. Sci. Rev. 2005, 28, 465–499. [Google Scholar] [CrossRef]
- Margatina, K.; Baziotis, C.; Potamianos, A. Attention-Based Conditioning Methods for External Knowledge Integration. In Proceedings of the 57th Annual Meeting of the Association for Computational Linguistics, Stroudsburg, PA, USA, 28 July–2 August 2019; Association for Computational Linguistics: Stroudsburg, PA, USA, 2019; pp. 3944–3951. [Google Scholar]
- Galluzzo, N. An Analysis of Rurality Index in Romanian Countryside by a Quantitative Approach. Trakia J. Sci. 2018, 16, 134–139. [Google Scholar] [CrossRef]
- Dashore, K.; Pawar, S.S.; Sohani, N.; Verma, D.S. Product Evaluation Using Entropy and Multi Criteria Decision Making Methods. Int. J. Eng. Trends Technol. 2013, 4, 2183–2187. [Google Scholar]
- Shukla, A.; Ono, H. AHP-PROMETHEE Technique for Managerial Purposes of Rural Settlements. 日本建築学会研究報告 九州支部 (CD-ROM) 2022, 61, ROMBUNNO.763. Available online: https://jglobal.jst.go.jp/en/detail?JGLOBAL_ID=202202258613772677 (accessed on 20 November 2023).
- Chang, D.-Y. Applications of the Extent Analysis Method on Fuzzy AHP. Eur. J. Oper. Res. 1996, 95, 649–655. [Google Scholar] [CrossRef]
- Shukla, A.; Vishwakarma, A.K.; ONO, H.; Habibi, M.S. Using Quantum GIS for Real-Time Monitoring of Groundwater Quality: A Case Study of Gorakhpur City, India. Indian J. Sci. Technol. 2021, 14, 2472–2482. [Google Scholar] [CrossRef]
- Shukla, A.; Ono, H. F-AHP Technique for Managerial Purposes of Rural Settlement. In Proceedings of the 13th International Symposium on Architectural Interchanges in Asia, Shanghai, China, 1–2 December 2022; The Architectural Society of China: Shanghai, China, 2022. [Google Scholar]
- Shukla, A.; Ono, H. A Knowledge-Based Technique of Ranking and Categorizing Villages for Monitoring and Management Purposes. In Proceedings of the National Conference on Humanity and Social Sciences 2022, Virtual, 22–24 April 2022; Ministry of Rural Development India: Varanasi, India, 2022. [Google Scholar]
- Shukla, A.; Ono, H. Developing a Rurality Index for Villages in Gonda District, India. In Proceedings of the Architectural Institute of Japan: 2024 Annual Conference, Tokyo, Japan, 29 August 2024. [Google Scholar]
- Zadeh, L.A. Toward a Theory of Fuzzy Information Granulation and Its Centrality in Human Reasoning and Fuzzy Logic. Fuzzy Sets. Syst. 1997, 90, 111–127. [Google Scholar] [CrossRef]
- Organisation for Economic Co-Operation and Development. Creating Rural Indicators for Shaping Territorial Policy; Organisation for Economic Co-operation and Development: Paris, France, 1994. [Google Scholar]
- Jennifer, W.; John, W.C. Mixed Methods: Integrating Quantitative and Qualitative Data Collection and Analysis While Studying Patient-Centered Medical Home Models; Agency for Healthcare Research and Quality: Rockville, MD, USA, 2013.
- Saaty, T.L. That Is Not the Analytic Hierarchy Process: What the AHP Is and What It Is Not. J. Multi-Criteria Decis. Anal. 1997, 6, 324–335. [Google Scholar] [CrossRef]
- Kabassi, K. Evaluating Museum Websites Using a Combination of Decision-Making Theories. J. Herit. Tour. 2019, 14, 544–560. [Google Scholar] [CrossRef]
- Romano, S.; Cozzi, M.; Viccaro, M.; Persiani, G. A Geostatistical Multicriteria Approach to Rural Area Classification: From the European Perspective to the Local Implementation. Agric. Agric. Sci. Procedia 2016, 8, 499–508. [Google Scholar] [CrossRef][Green Version]
- Kabassi, K.; Martinis, A. Sensitivity Analysis of PROMETHEE II for the Evaluation of Environmental Websites. Appl. Sci. 2021, 11, 9215. [Google Scholar] [CrossRef]
- van Laarhoven, P.J.M.; Pedrycz, W. A Fuzzy Extension of Saaty’s Priority Theory. Fuzzy Sets. Syst. 1983, 11, 229–241. [Google Scholar] [CrossRef]
- Saaty, R.W. The Analytic Hierarchy Process—What It Is and How It Is Used. Math. Model. 1987, 9, 161–176. [Google Scholar] [CrossRef]
- Mumtaz, Y.; Shukla, A.; Mumtaz, R. Analysis of Contribution to Environmental Safeguard Based on Gender: A Case Study of Kabul, Afghanistan. Mod. Environ. Sci. Eng. 2021, 7, 16–22. [Google Scholar] [CrossRef]
- Kanayo, F. Nwanze IFAD Strategic Framework 2016–2025. 2016. Available online: https://www.ifad.org/documents/d/new-ifad.org/ifad-strategic-framework-2016-2025 (accessed on 12 March 2022).
- Eastman, J.R. Idrisi for Windows, Version 2.0: Tutorial Exercises; Graduate School of Geography-Clark University: Worcester, MA, USA, 1997. [Google Scholar]
- Ocaña-Riola, R.; Sánchez-Cantalejo, C. Rurality Index for Small Areas in Spain. Soc. Indic. Res. 2005, 73, 247–266. [Google Scholar] [CrossRef]
- Weinert, C.; Boik, R.J. MSU Rurality Index: Development and Evaluation. Res. Nurs. Health 1995, 18, 453–464. [Google Scholar] [CrossRef]
- Pandey, A.K.; Shukla, A.; Chaurasia, A.K.; Mumtaz, Y. Creation of GIS Integrated Power Supply Map of Madan Mohan Malaviya University of Technology, Gorakhpur Using GPS. Mod. Environ. Sci. Eng. 2021, 7, 56–71. [Google Scholar] [CrossRef]
- Habibi, S.M.; Ono, H.; Shukla, A. Geographical Information System (GIS) Based Multi-Criteria Decision Analysis for Categorization of the Villages: In the Case of Kabul New City Villages. Urban Sci. 2021, 5, 65. [Google Scholar] [CrossRef]
- Roszkowska, E. Multi-criteria Decision Making Models by Applying the Topsis Method to Crisp and Interval Data Ewa Roszkowska. Univ. Econ. Katow. 2011, 6, 200–230. [Google Scholar]
- Sungur, O.; Kilinç, M. Defining and Developing A Rurality Index for Turkey. J. Urban Reg. Anal. 2022, 14, 129–153. [Google Scholar] [CrossRef]
- Li, Y.; Long, H.; Liu, Y. Spatio-Temporal Pattern of China’s Rural Development: A Rurality Index Perspective. J. Rural. Stud. 2015, 38, 12–26. [Google Scholar] [CrossRef]
Disclaimer/Publisher’s Note: The statements, opinions and data contained in all publications are solely those of the individual author(s) and contributor(s) and not of MDPI and/or the editor(s). MDPI and/or the editor(s) disclaim responsibility for any injury to people or property resulting from any ideas, methods, instructions or products referred to in the content. |
© 2024 by the authors. Licensee MDPI, Basel, Switzerland. This article is an open access article distributed under the terms and conditions of the Creative Commons Attribution (CC BY) license (https://creativecommons.org/licenses/by/4.0/).