Article

Does Proximity to MRT Stations Affect Online Shopping Use? An Analysis Using Data from Japan and New York

Department of Logistics and Information Engineering, Tokyo University of Marine Science and Technology, 2-1-6 Etchujima Koto-ku, Tokyo 135-8533, Japan
*
Author to whom correspondence should be addressed.
Urban Sci. 2024, 8(4), 154; https://doi.org/10.3390/urbansci8040154
Submission received: 31 May 2024 / Revised: 7 September 2024 / Accepted: 20 September 2024 / Published: 25 September 2024

Abstract

:
The rapid growth of the e-commerce market in the retail sector has led to a greater demand for home delivery services in recent years. In order to develop policies to address the issues related to delivery demand, it is critical to understand the demand mechanism of online shopping. Furthermore, the relationship between proximity to mass rapid transit and shopping mode choice mechanisms has not been studied, although, in the field of urban design, accessibility to mass rapid transit is known to affect travel behaviors. We focus on the relationship between proximity to mass rapid transit stations and the shopping mode choice mechanism and estimate structural equation models, considering in-person and online shopping propensities as the latent variables. We use the two datasets. One is from a web-based survey of online shoppers in Japan. The other is the 2019 NYC Citywide Mobility Survey data. The results based on Japanese survey data indicate a clear difference in shopping mode choice mechanisms between MRT-dependent neighborhoods and non-MRT-dependent neighborhoods, while such a difference is limited in NYC. Furthermore, the study reveals how individual and household characteristics and accessibility indicators affect online shopping propensity based on the type of neighborhood and city/country.

1. Introduction

The e-commerce market in retail has grown rapidly in recent years. In 2024, retail e-commerce sales are estimated to exceed USD 6.3 trillion worldwide, and this figure is expected to reach new heights in the coming years [1]. Since the 1990s, it has steadily increased its share in total retail sales. In the U.S., total e-commerce sales for 2023 were estimated at USD 1118.7 billion, an increase of 7.6 percent from 2022 [2]. This phenomenon is not only observed in the U.S. but also in Japan. In the case of Japan, according to the Ministry of Economy, Trade, and Industry [3], the scale of the e-commerce market for consumers was JPY 22.7 trillion in 2022 (a 9.91% increase since 2021). The share in the retail product sales is estimated at 9.13% in Japan. Unnikrishnan et al. [4] found that the COVID-19 pandemic had a significant impact on shopping behavior and, during the pandemic, online shopping and home delivery were the most common forms of shopping in the Portland–Vancouver–Hillsboro Metropolitan area in the U.S. The increased demand for deliveries could lead to an increase in negative externalities, such as traffic congestion and air pollution [5]. Cao et al. [6] point out that the impact of increased traffic demand on the congested road network is significant, and any change in trip generation due to the rise of e-commerce, even if it is slight, could have a significant impact on the existing road network. According to the New York Times, delivery trucks operated by UPS and FedEx racked up more than 471 thousand parking violations in 2018, a 34 percent increase from 2013 in NYC [7]. Also, similar problems occur in major urban areas in the U.S., not only in NYC [8]. On the other hand, in-person shopping accounts for a high proportion (21.1%) of daily car trips in the U.S. [8], and if e-commerce replaces in-person shopping, this new shopping channel could reduce personal shopping trips [6].
The adoption of online shopping depends on various factors. Studies were conducted in various countries and regions to clarify factors that contribute to the adoption of online shopping. Some studies identify the spatial characteristics relevant to the adoption of online shopping. Zhou et al. [9] found that the higher the GDP and population density of a city, the more frequently people tend to shop online. On the other hand, Krizek et al. [10] found that people living in the suburbs and further away from the central business district (CBD) were more likely to shop online. Cheng et al. [11] underline the importance of understanding the characteristics of areas that are associated with higher e-commerce home delivery demand. They conducted a case study using data from Singapore, an Asian city-state known for its successful Transit-Oriented Development (TOD). The concept of TOD proposes to locate residential developments in close proximity to Mass Rapid Transit (MRT) stations, which function as “centers of urban life” [12]. As Cheng et al. [11] pointed out, the adoption of online shopping is still in progress, and an understanding of the impacts of such lifestyle change is critical for transportation and land use planning. However, past case studies have been conducted only for a limited number of cities and very few from Asian cities, and furthermore, the relationship between TOD and the mechanism of shopping mode choice (in-person vs. online shopping) has not yet been fully studied.
This study focuses on the proximity of online shoppers to MRT stations. In the field of urban design, TOD is known to influence residents’ travel behavior [13]. Our research question is as follows: “Does neighborhood dependence on MRT relate to shopping mode choice mechanisms like it does to travel behaviors?”. We aim to investigate how individual and household characteristics and spatial characteristics (other than the proximity to an MRT station) have a different impact on consumers’ propensity for in-person and online shopping, depending on their proximity to an MRT station. In this study, structural equation models (SEMs) are estimated using the two datasets. The first dataset is from a web-based survey of online shoppers in Japan (Japan survey data), where TOD is as prevalent as in Singapore. The second one is the 2019 NYC Citywide Mobility Survey (CMS) data. NYC is one of the major MRT-dependent cities in the world in terms of the extension of MRT lines and the number of passengers. Since consumers’ purchasing behavior is known to differ by country and region, we attempt to identify differences between the two sample sets as to the relationship between the proximity to MRT stations and the shopping mode choice mechanism. Findings that further understanding of shopping choices would be beneficial not only to planners and policymakers, but also to firms seeking to learn more about consumer shopping demand.
The rest of the paper is organized as follows: In the next section, we review studies attempting to identify the factors of online shopping use and the relationship between online and in-person shopping. In Section 3, we describe the two sets of data from Japan and NYC. In Section 4, we estimate structural equation models using these two datasets. We describe the model specifications and present the estimation results. We identify differences in online shopping based on the proximity to MRT stations. Also, we compare the results for sample sets from the two countries. In Section 5, we conclude the research with a summary and the future research needs.

2. Literature Review

Previous studies have theorized (1) the explanatory potential of online shopping adoption (using factors including both individual and household (e.g., age, income, education, and household structure) and spatial characteristics (e.g., accessibility and built environment)), as well as (2) complementary and substitution relationships between online and in-person shopping.
Some of those focusing on (1) are especially concerned with demand estimation (Wang and Zhou [14]; Fabusuyi et al. [15]; Comi and Nuzzolo [16]; Stinson et al. [17]; Reiffer et al. [18]). For example, Wang and Zhou [14] use the 2009 U.S. National Household Travel Survey (NHTS) data to estimate two models: a binary choice model for online shopping adoption and a negative binomial model for the number of online purchases delivered to home. They use the model to compare the freight trip demand driven by households with that of business establishments. Other studies focusing on (1) include those especially focusing on the effect of spatial characteristics, such as Farag et al. [19] and Ren and Kwan [20]. Farag et al. [19] analyze the data obtained during 1996–2001 from the Netherlands. Based on the statistical analyses, they conclude that internet use and online shopping tend to be urban phenomena in the Netherlands and also that residential environment and shop accessibility affect the adoption of online shopping, supporting their two initial hypotheses: the innovation diffusion hypothesis (“e-shopping is a predominantly urban phenomenon, because new technology usually starts in centres of innovation”) and the efficiency hypothesis (“people are more likely to adopt e-shopping when their accessibility to shops is relatively low”). Ren and Kwan [20] use the data of an activity–internet diary survey conducted in the Columbus Metropolitan Area, Ohio, during 2003–2004 and develop two models, similar to Wang and Zhou (2015): a logistic regression model for online shopping adoption and a Poisson regression for the number of online purchases. Their analyses indicate that low physical shopping accessibility leads to higher online shopping dependency and that areas with a white majority are more likely to adopt online shopping. Using the data from a carrier serving online shopping-driven parcel deliveries in Singapore, Cheng et al. [11] estimate a linear regression model for online shopping adoption with explanatory variables relevant to urbanization level, accessibilities, household characteristics, and housing types. The results indicate the significant effects of neighborhood housing type as well as other spatial characteristics. Another relevant study from Asia is Loo and Wang [21]. Their study focuses on both e-working and online shopping and estimates an ordered logit regression model using household survey data from Nanjing, China, considering accessibility indicators (such as the distance to the nearest MRT station) as well as individual and household characteristics and personal attitudes toward e-shopping. Their result highlights the influence of the spatial distribution of shopping centers, MRT stations, and public transportation services in the adoption of e-activities.
More recent studies typically address both (1) and (2). Cao et al. [6] use the data of internet users in the Minneapolis-St Paul metropolitan area. They developed an SEM especially focusing on the relationship among online searching frequency, online buying frequency, and in-person shopping frequency and concluded that there are complementary relationships between online searching and in-person shopping and online shopping and in-person shopping. Notably, in this early study using an SEM for online and in-person shopping propensities, spatial characteristics are not considered exogenous variables. Using survey data collected in 2009 and 2010 from Davis, California, Lee et al. [22] investigate the effect of personal characteristics, perceptions and attitudes, and the built environment on online and in-person shopping. They develop pairwise copula models, indicating a complementary relationship between online and in-person shopping. Their result further indicates that the effects of factors on shopping in Davis are different from shopping outside Davis. Dias et al. [23] focus on the relationship between online and in-person shopping for non-grocery, grocery, and ready-to-eat meals. They develop a multivariate ordered probit model using the data from the 2017 Puget Sound Household Travel Survey. Their findings include the difference in online activities between residents in high-density and low-density areas and the existence of complex complementary and substitution effects between online and in-person shopping. Kim and Wang [24] investigate person-related and household-related factors (e.g., age, income, race, car ownership, and if there are children) affecting retail, food, and grocery deliveries and further analyze the relationship between the three types of delivery (retail, grocery, and food) and in-person shopping, considering shopper’s travel mode choice (driving or walking). They use the 2018 NYC CMS data and develop SEM models. Their findings indicate that the relationship between online and in-person shopping depends on the type of delivered goods and shopping travel mode.
A few studies focus on the estimating spatial distribution of online shopping adoption. Beckers et al. [25] use the data from an online questionnaire survey conducted in Belgium, in 2016, asking the respondents’ socio-economic attributes and online shopping frequencies. They develop a logistic regression model and apply it to estimate the percentage of online shoppers by location in Belgium, highlighting the spatial heterogeneity of online shopping adaption. They conclude that the geography of online shopping adoption should be considered in planning and research. Colaço and de Abreu e Silva [26] use a 7-day shopping survey conducted in Lisbon, in 2020, and estimate binary logistic regression models for online retail purchases and online food purchases. Using the model, similarly to Beckers et al. [25], they attempt to explain the spatial differences in online purchase probability. They conclude that the differences cannot be explained solely by the centrality and shop availability.
One of the research gaps, obvious from the literature review, is the scarcity of studies from Asia. Most of the past studies are from cities in the U.S. or Europe. In this paper, we attempt to add a case study from Japan. Another research gap is the lack of study considering the relationship between neighborhood dependency on MRT and shopping mode choice (in-person vs. online shopping). Some existing studies consider the differences in shopping decision mechanisms between urban and non-urban areas; some other studies consider the marginal effects of accessibility measures on the use of online shopping. We hypothesize that lifestyle or behavioral patterns associated with neighborhood dependency on MRT are relevant to the shopping mode choice mechanism. We test this hypothesis using the aforementioned two datasets from two different countries.

3. Data Description

We use data from a web-based survey conducted in Japan in 2022 and data from the CMS to analyze shopping mode choices and compare them between consumers in Japan and NYC.

3.1. Web-Based Questionnaire Survey in Japan

Table 1 shows an overview of the web-based survey conducted in Japan. The data were collected during 19 and 25 May 2022 to investigate the shopping behaviors for both in-person and online shopping at the household level. The respondents were registered individuals recruited by a market research services firm, Asmarq Co., Ltd. (Tokyo, Japan), that contracts with over 1 million potential respondents. Respondents were screened to household members who were responsible for at least 60% of their household’s purchases. Furthermore, in order to understand the characteristics of households that regularly purchase online, only those whose most recent online purchases were within one month of the survey date were included. Respondents were randomly selected early in the survey period, but, later, were narrowed down to only those in categories (in terms of household size, age, and gender) unrepresented initially, so that the distributions of respondents (in terms of household size, age, and gender) would be similar to national statistics. For more details, see Motojima et al. [27]. The questions include individual characteristics such as gender, age, and occupation; household characteristics such as place of residence, household size, and car ownership; number of days spent for in-person shopping; and online shopping in the past 30 days. Overall, 325 individuals responded to the survey.
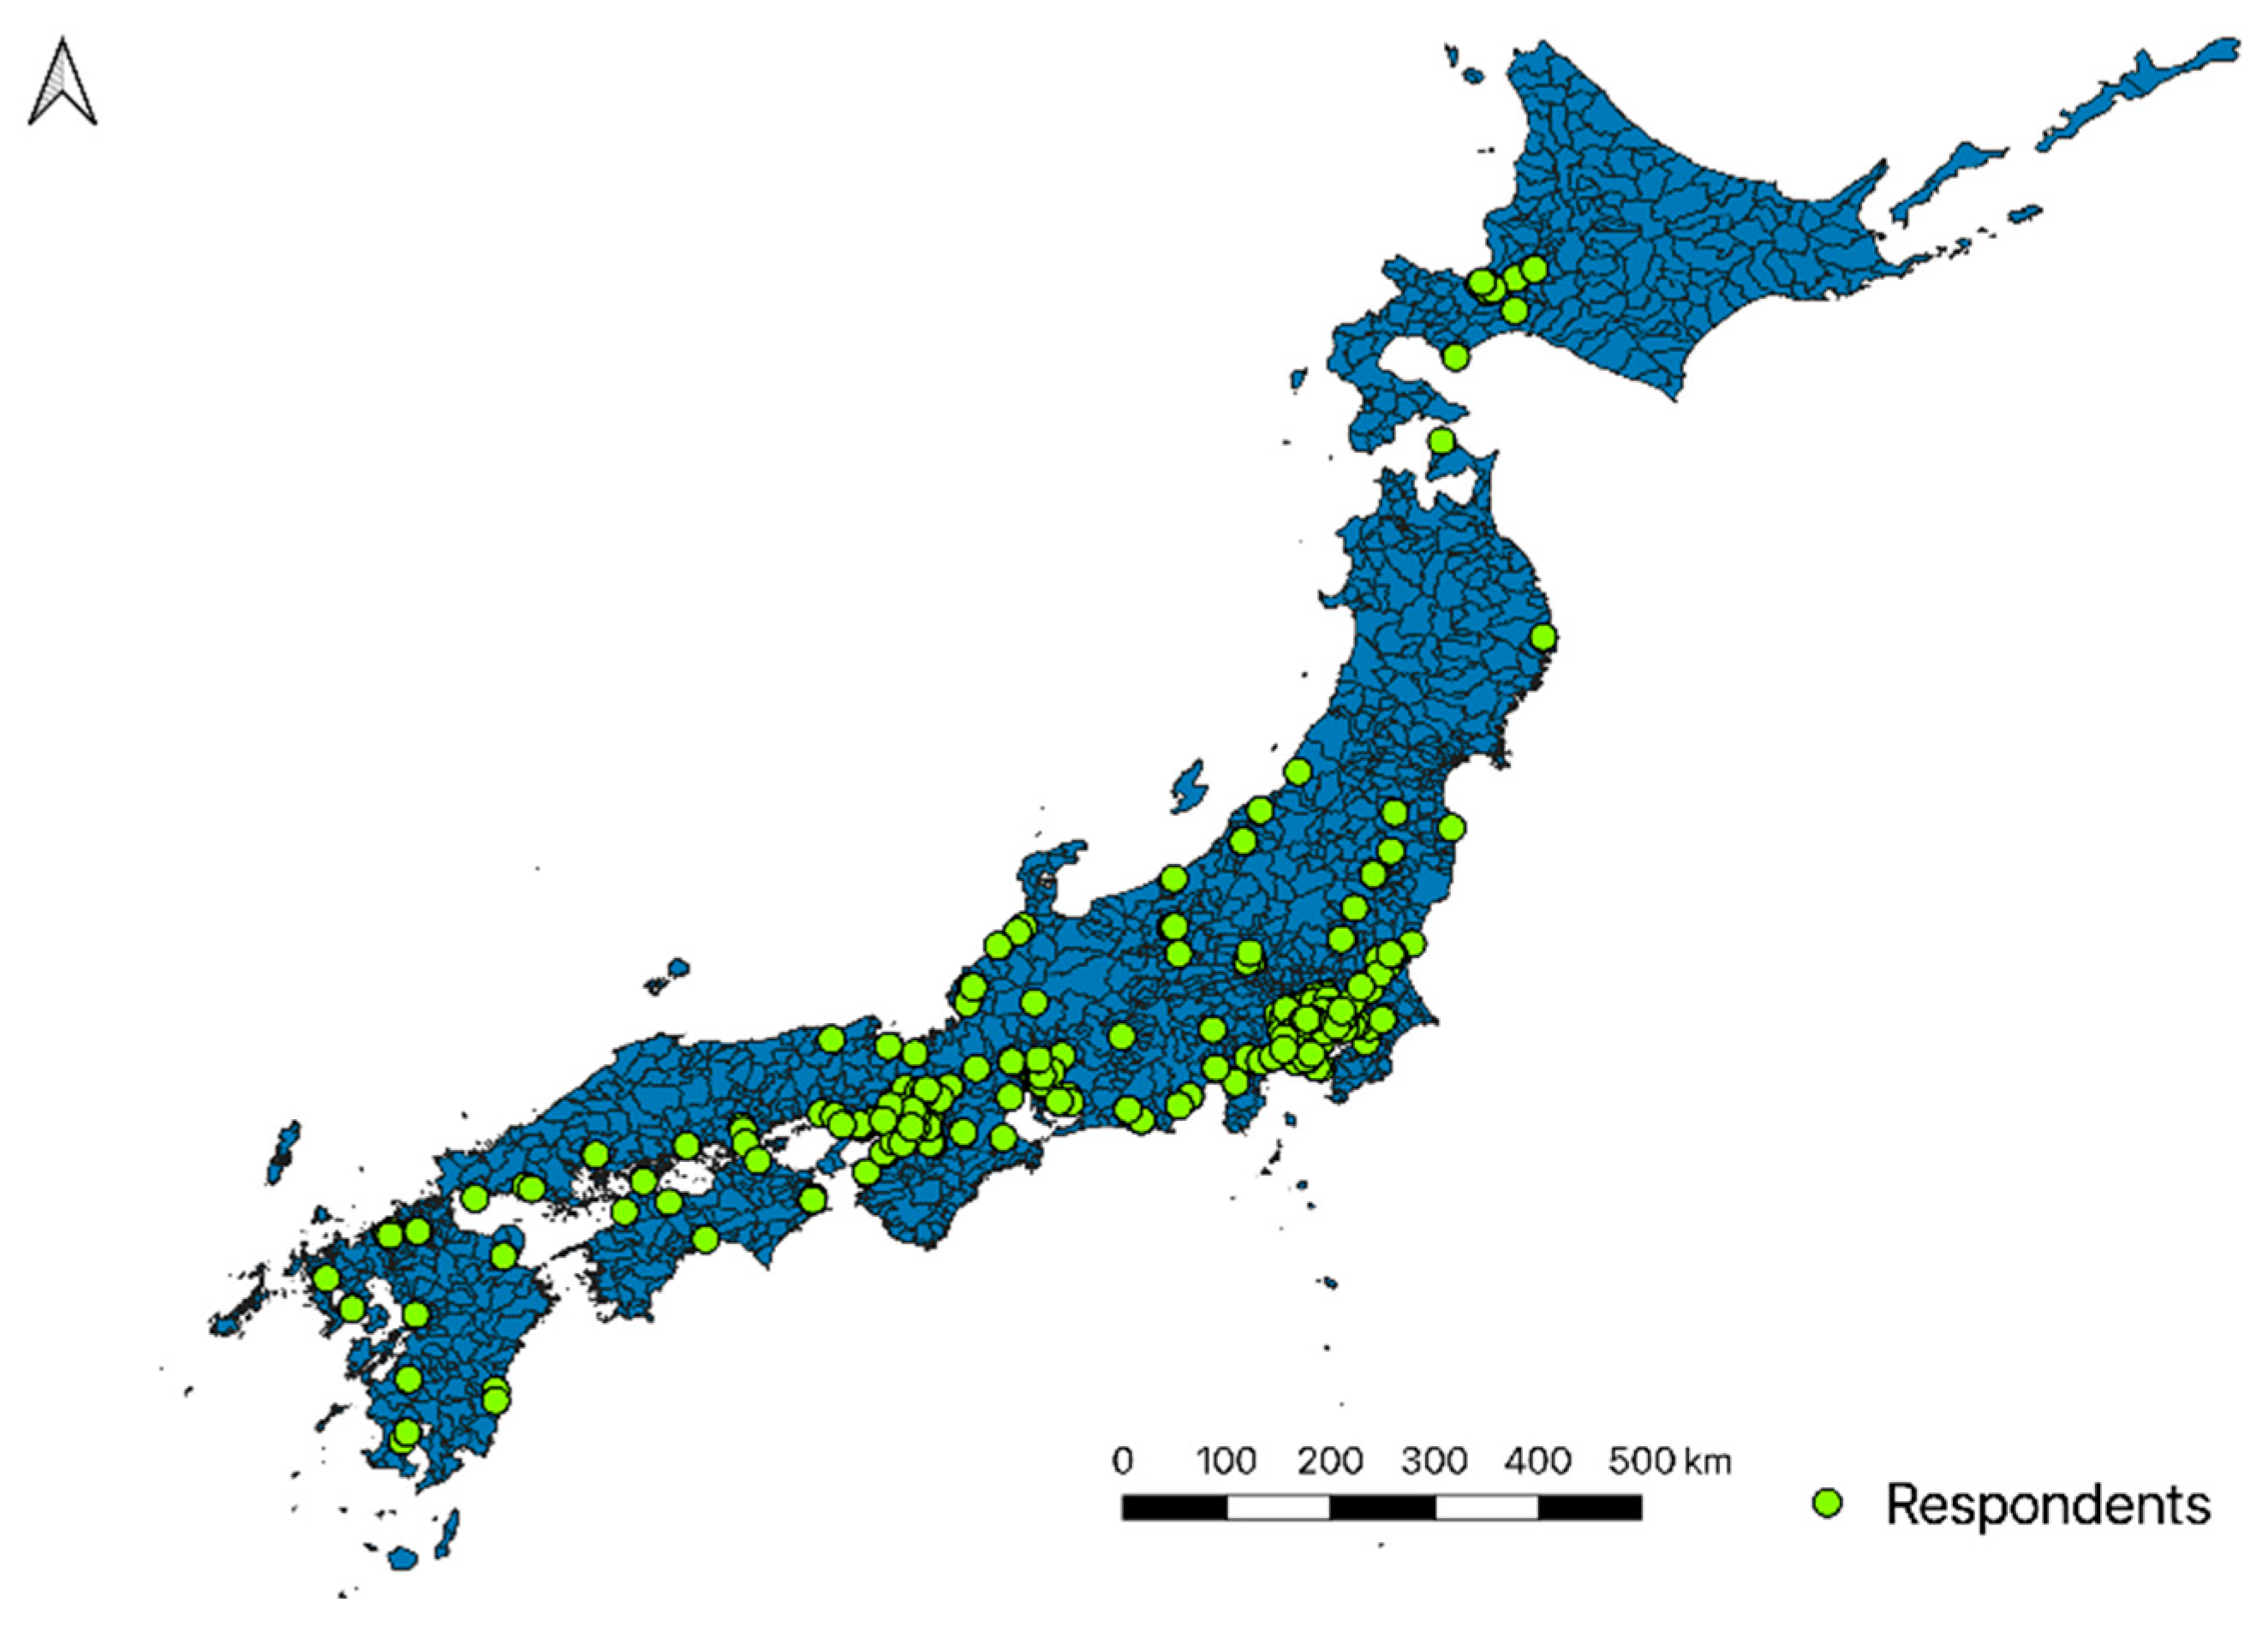
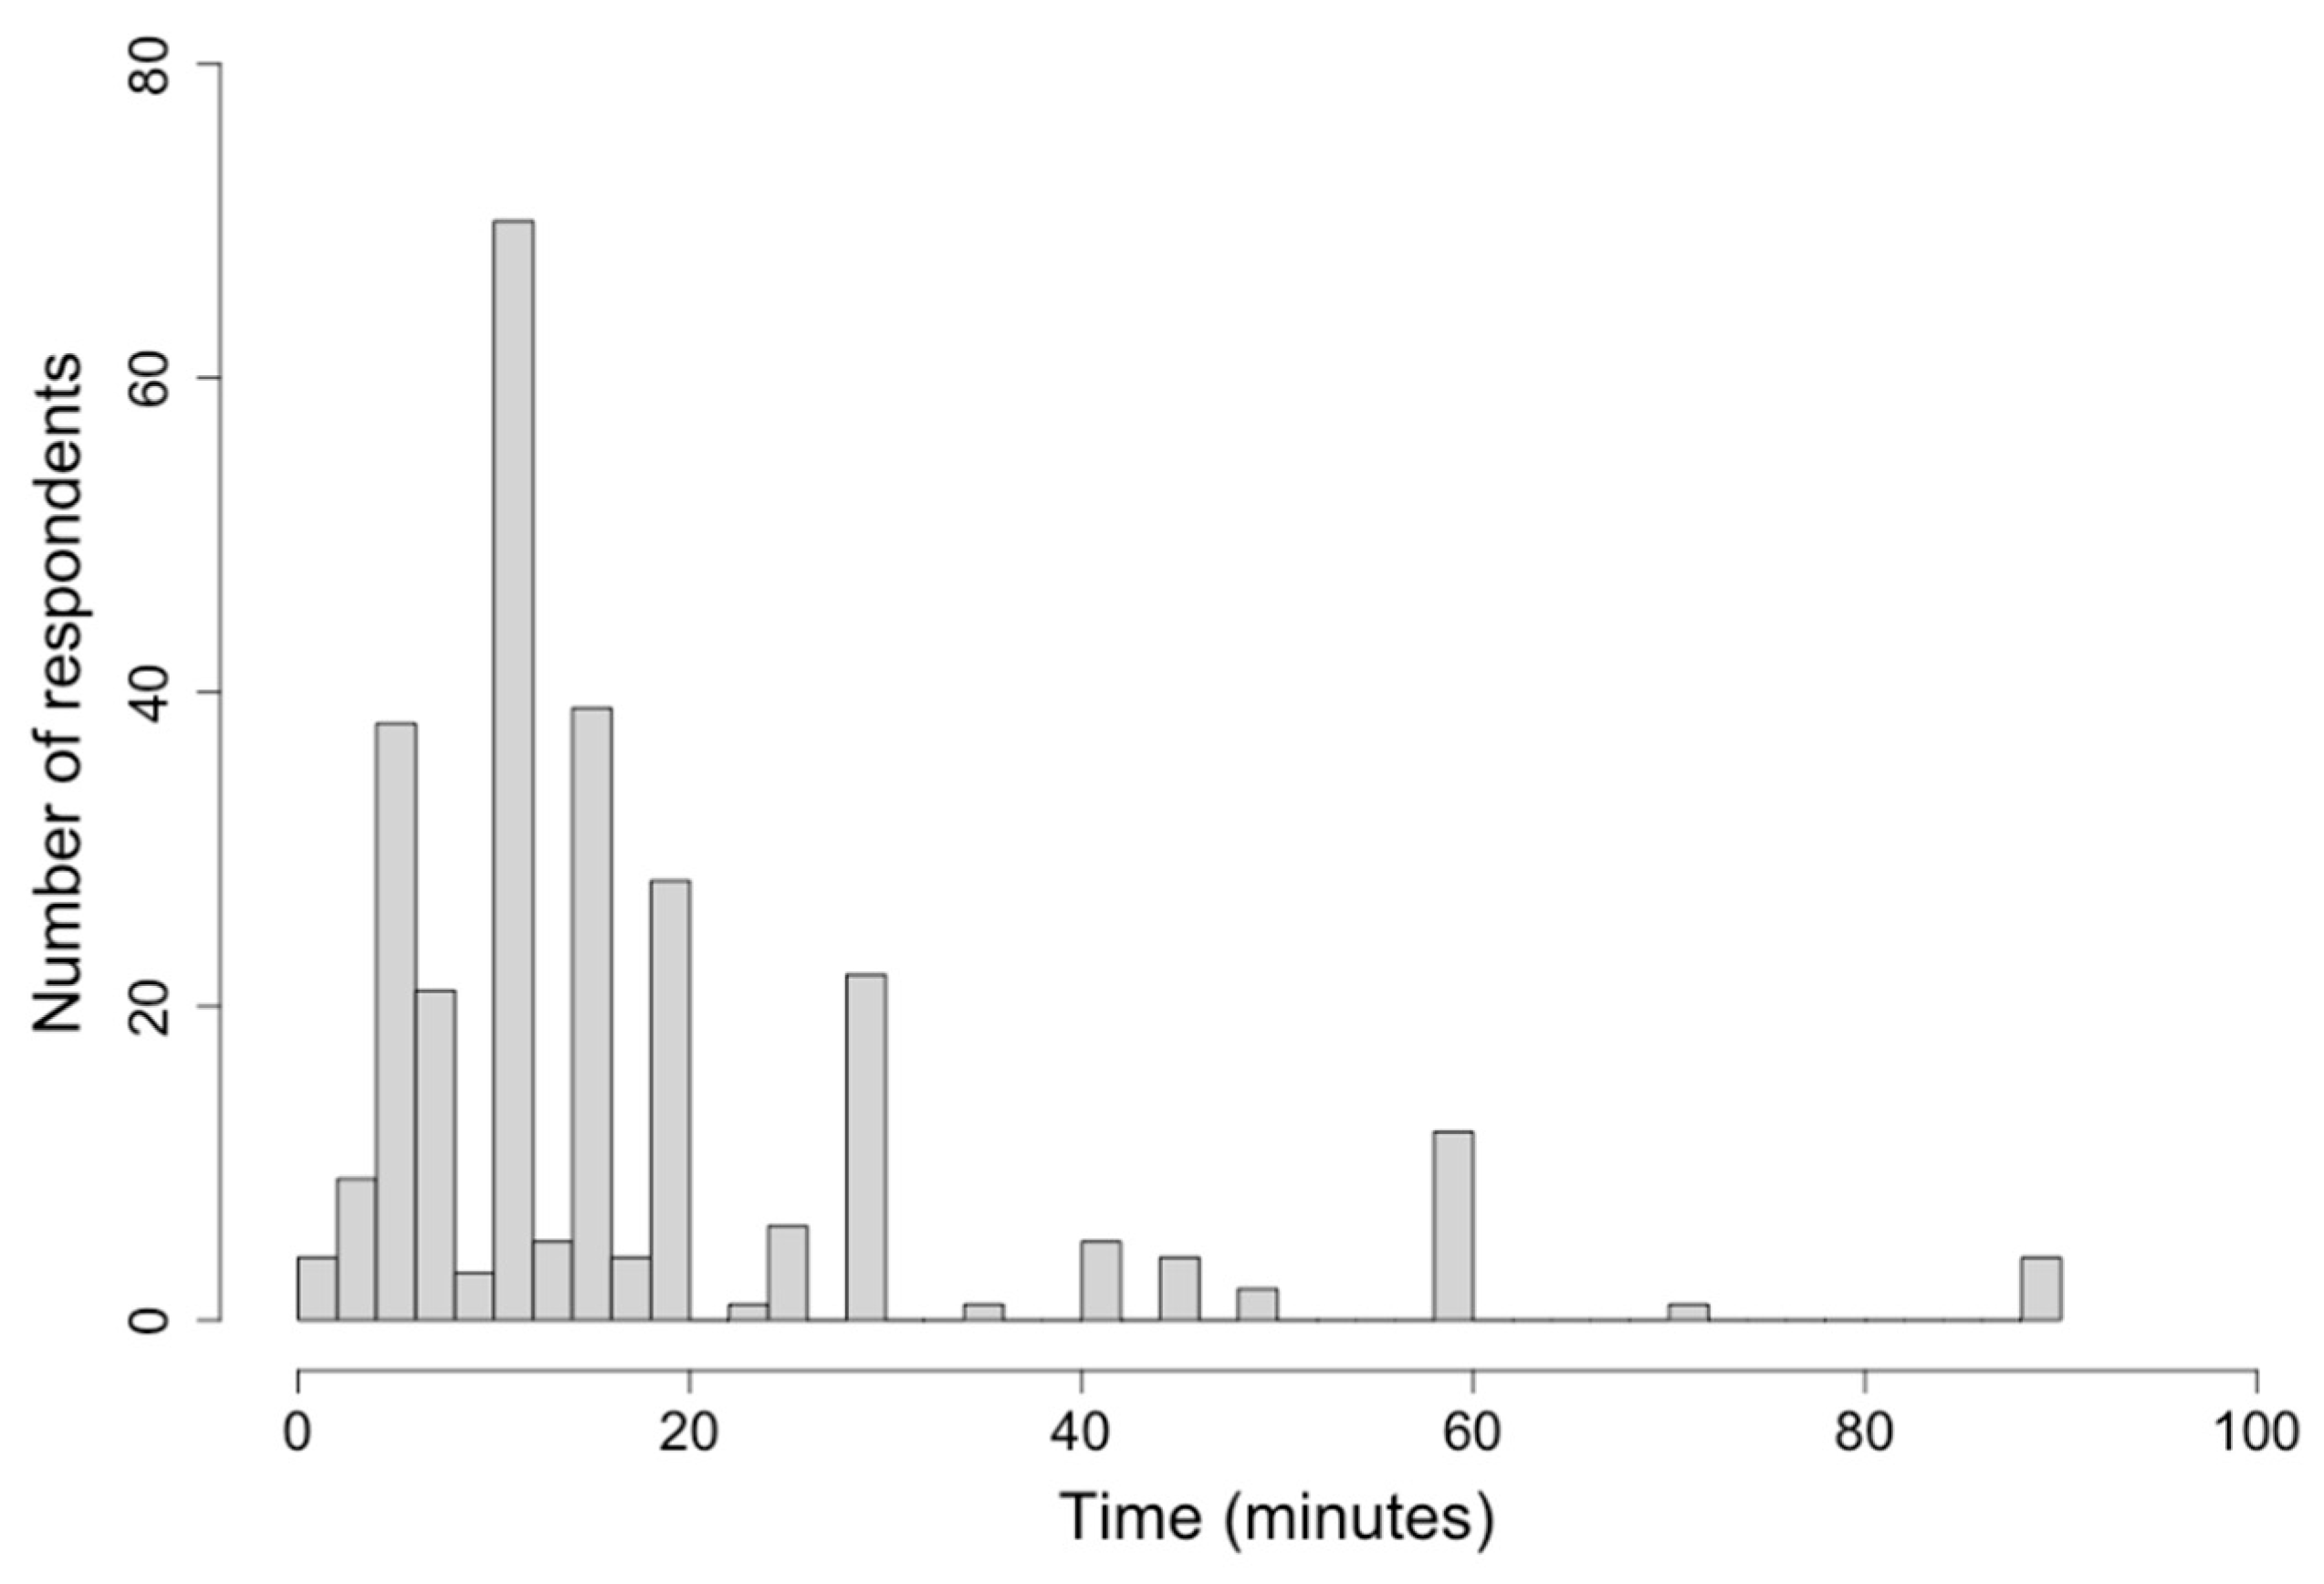
Figure 1 shows the spatial distribution of survey respondents in Japan. The survey respondents are distributed throughout the country, including both urban and suburban areas. The individual and household characteristics of the respondents are summarized in Table 2. Nearly 70 percent of the respondents own their car. The average age is 53.4 years, and the average household size is 2.4. The average household income, using the median value for each category, is JPY 6,762,000 (USD 53,244 using the rate as of May 2022, JPY/USD 127). More than half of the respondents have a university degree. The distribution of the time taken to reach the nearest MRT station from their homes is shown in Figure 2. The minimum time required was 1.2 min, the median was 13.2 min, the mean was 17.4 min, and the maximum was 90 min. Furthermore, accessibility variables were computed based on the respondents’ locations. Firstly, we calculated the distance from each respondent’s location to the nearest Amazon fulfillment center. If the online shopping user’s location is outside the next-day delivery area, an advantage of online shopping is compromised. It was therefore hypothesized that the distance to the relevant Amazon FC of the respondent could be a factor influencing the propensity to shop online. Secondly, we calculated the distance between the respondent and the nearest grocery store (or supermarket). The location of grocery stores across the country was obtained from another data source [28]. Table 3 shows the summary of the two accessibility variables. As for the distance to the nearest Amazon FCs, the average distance from respondents was approximately 70 km, as Amazon FCs are often located in suburban areas. Most respondents are located relatively close to grocery stores.
A summary of respondents’ online and in-person shopping behavior with regard to each product is shown in Table 4. In both in-person and online shopping, the most common type of goods is groceries. The minimum delivery speed is less than one day, the average is 3.28 days, and the longest is 13 days.

3.2. NYC DOT Citywide Mobility Survey 2019

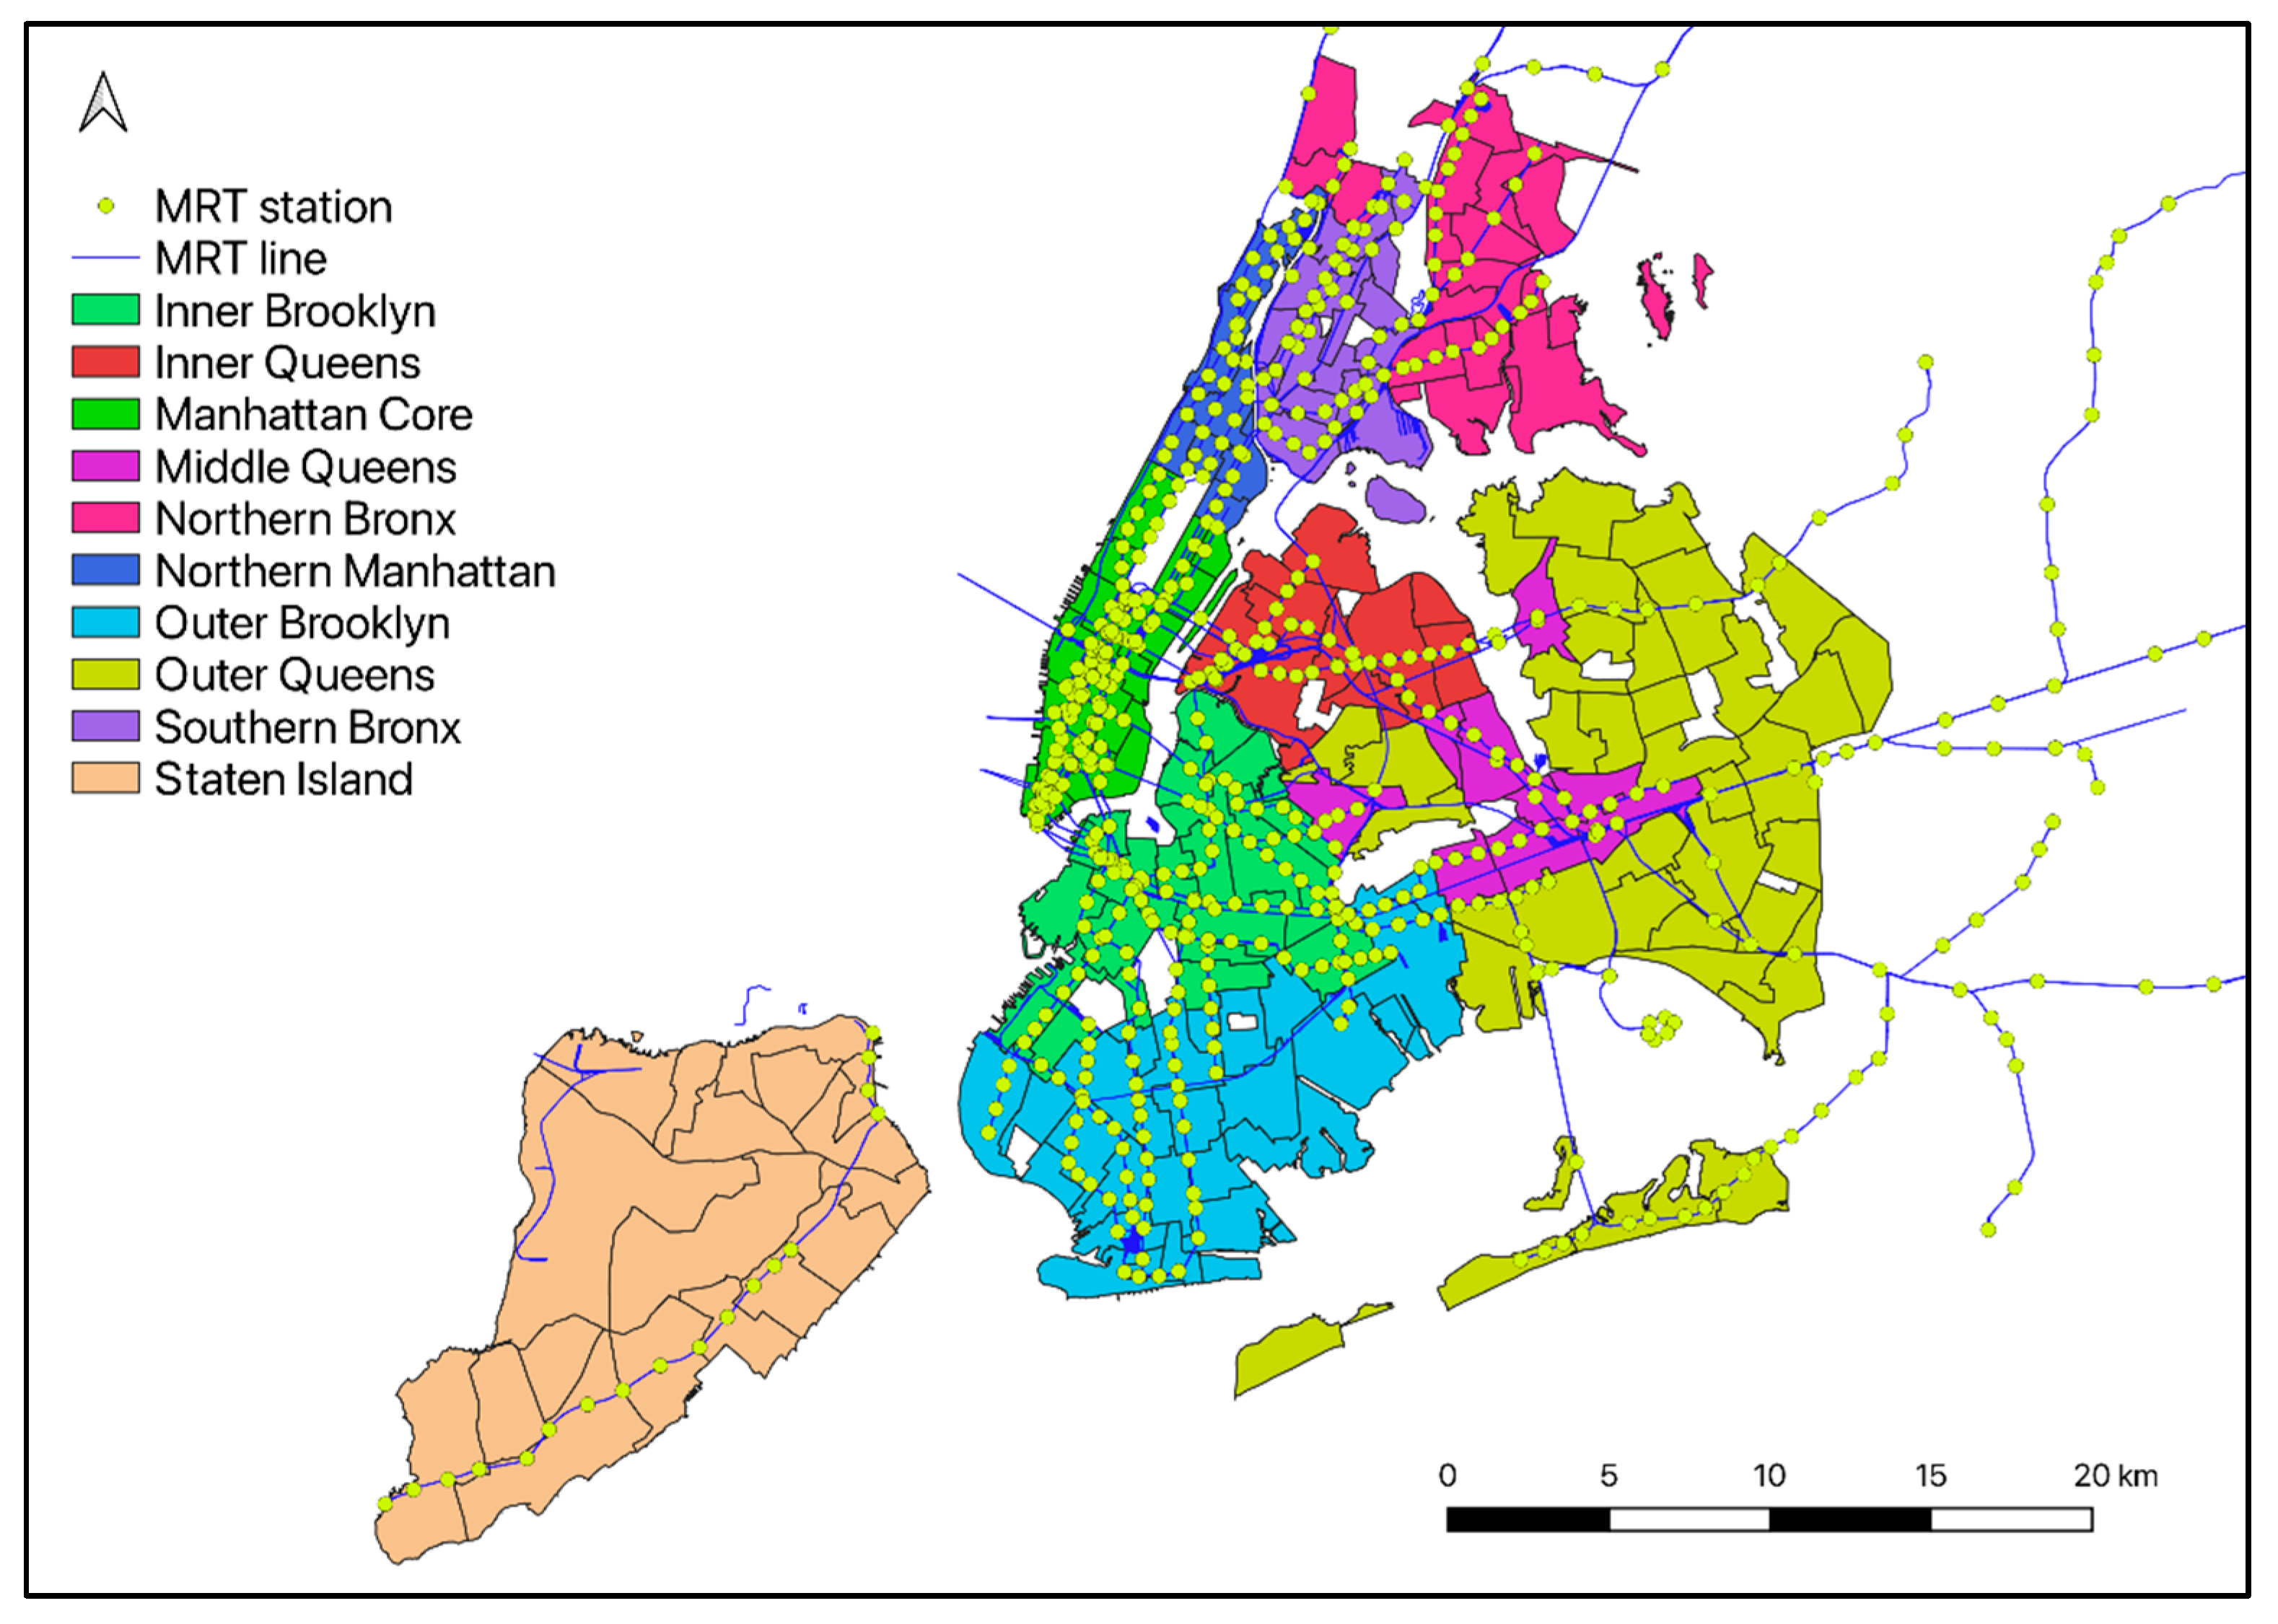
Since 2017, the NYC Department of Transportation (DOT) has conducted CMS [29] annually, aiming to understand trip behavior, preferences, and attitudes of NYC residents. Figure 3 shows the survey area and the MRT lines and stations in NYC. Each year, more than 3000 NYC residents are targeted, with approximately 300 respondents from each of the 10 survey zones. We used data from the 2019 CMS, which randomly recruited participants from all addresses in the study area using an address-based sampling method and sent 118,525 postcard invitations to each sample. Approximately 75% of participants participated via the smartphone application, 20% via the website, and the remainder via telephone [30]. The tables used are “Person Table”, “Household Table”, “Trip Table”, and “Day Table”. The “Person Table” contains personal attributes such as gender, race, age, and education of each respondent at the individual level. The “Household Table” includes household characteristics such as annual income, residential area, number of members, and number of private cars. The “Trips Table” includes the trips made by the respondent during the survey period, the origin and destination attributes, the time and distance required for the trip, and the means of transportation. The “Day Table” includes the number of online purchases and frequency of delivery use. Table 5 provides an overview of the CMS data and the variables extracted from each data frame for the analysis. The 2019 survey used in the analysis covers 3036 individuals. The data frame includes variables related to respondents’ trips (e.g., distance traveled and trip mode). Table 6 provides a summary of individual and household characteristics in the CMS data. The samples were narrowed down to only those that included the data of trips to retail stores or trips for dining out during the survey period, resulting in a final sample size of 2025.
The number of MRT stations in each district was obtained from another data source [31]. Table 7 shows the area of each district and the number of stations per unit square km. Note that CMS’s samples’ exact locations are not available and therefore we use this district-level accessibility variable. Table 8 shows the summary of variables related to in-person and online shopping.

3.3. The Differences in the Two Datasets

The Japan survey data include online shopping users only. On the other hand, samples in the CMS data include those who do not use online shopping. In the CMS data, trip data were also collected. While there are some individual and household characteristic variables common in the two sets of data, the variables relevant to in-person and online shopping behavior are more detailed in the Japan survey data. Regarding the adoption of online shopping, respondents in the CMS data purchase online with greater frequency than those in the Japan survey data.

4. Analysis of Online Shopping Usage Factors Using a Structural Equation Model

4.1. Methodology

An SEM is a statistical method for simultaneously analyzing a large number of observed variables collected to investigate the properties of a construct or observed variable. SEM and path analysis are widely used multivariate analysis methods (Cao et al. [6], Zhou et al. [9], Farag et al. [19], Kin and Wang [24]). As mentioned earlier, Zhou et al. [9] emphasize that the advantage of SEM is its ability to assess the bidirectional relationship between multiple endogenous variables and their effects. These studies indicate that SEM is one of the traditional and appropriate approaches to uncover complex relationships (e.g., in-person and online shopping). We aim to investigate how individual and household characteristics and accessibility variables relate differently to consumers’ propensities to in-person and online shopping depending on their proximity to an MRT station. We consider two constructs, the propensity to in-person shopping and the propensity to online shopping, and analyze the relationship between the two, as well as the relationship between the individual and household characteristics and accessibility variables and online shopping propensity.
We estimate SEMs using the Japan survey data and the CMS data. Samples were divided based on their proximity to an MRT station. The Japan survey data were divided into two groups, using 15 min as the threshold (a median time to the nearest MRT station is 13.2 min and an average time is 17.4 min). The group with a time to the nearest MRT station of less than 15 min is referred to as “near” (n = 150). The other group is referred to as “far” (n = 129). The CMS data respondents were also divided into two groups: those who live in the districts with at least one MRT station per square kilometer (Inner Brooklyn, Manhattan Core, and Northern Manhattan) or the others. The first group is referred to as “near” (n = 570). The rest is referred to as “far” (n = 1455). These four sets of data are analyzed.
The explanatory variables used in the analysis differ between the two datasets (Table 9 and Table 10). In all models, “In-person Propensity” and “Online Propensity”, which represent the propensities to shop in-person and online, respectively, are constructs (latent variables). “Household size” is assumed to directly account for the size of demand for both in-person and online shipping.
The specification of SEM for the Japan survey data is as follows:
In-person propensity (latent variable)
log G r o c e r i e s = a b 11 I n   p e r s o n   p r o p e n s i t y + ϵ 1
log D a i l y   g o o d s = a b 21 I n   p e r s o n   p r o p e n s i t y + ϵ 2
log O t h e r   c a t e g o r y = a b 31 I n   p e r s o n   p r o p e n s i t y + ϵ 3
Online propensity (latent variable)
log G r o c e r i e s   E C   +   1 = a b 42 O n l i n e   p r o p e n s i t y + ϵ 4
log D a i l y   g o o d s   E C   +   1 = a b 52 O n l i n e   p r o p e n s i t y + ϵ 5
log O t h e r   c a t e g o r y   E C   +   1 = a b 62 O n l i n e   p r o p e n s i t y + ϵ 6
The relationships between two latent variables and with other exogenous variables to online propensity is as follows.
I n   p e r s o n   p r o p e n s i t y   =   a d 11 log h o u s e h o l d   s i z e + d 1
O n l i n e   p r o p e n s i t y   =   a a 21 I n   p e r s o n   p r o p e n s i t y   + a d 21 log h o u s e h o l d   s i z e +   a d 22 B a c h e l o r s   d e g r e e +   a d 23 C a r   o w n e r s h i p +   a d 24 O v e r   50   y e a r s   o l d + a d 25 log A v e   d e l i v e r y   s p e e d   +   1 + a d 26 log D i s t   t o   h u b + a d 27 log D i s t   t o   r e t a i l s + d 2
The specification of SEM for the CMS data is as follows.
In-person propensity (latent variable)
log N o .   o f   s h o p p i n g   t r i p s   + 1   =   a b 11 I n   p e r s o n   p r o p e n s i t y + ϵ 1
log N o .   o f   d i n i n g   t r i p s   + 1   =   a b 21 I n   p e r s o n   p r o p e n s i t y + ϵ 2
Online propensity (latent variable)
log O n l i n e   s h o p p i n g   f r e q u e n c y   + 1   =   a b 32 O n l i n e   p r o p e n s i t y + ϵ 3
log N o .   o f   p a c k a g e s   r e c i e v e d   + 1   =   a b 42 O n l i n e   p r o p e n s i t y + ϵ 4
log U s e   o f   f o o d   d e l i v e r y   G r o c e r i e s   + 1   =   a b 52 O n l i n e   p r o p e n s i t y + ϵ 5
log U s e   o f   f o o d   d e l i v e r y   C o o k e d   f o o d   + 1   =   a b 62 O n l i n e   p r o p e n s i t y + ϵ 6
Relationships between two latent variables and with other exogenous variables to online propensity is as follows.
I n   p e r s o n   p r o p e n s i t y   =   a d 11 log h o u s e h o l d   s i z e + d 1
O n l i n e   p r o p e n s i t y = a a 21 I n   p e r s o n   p r o p e n s i t y + a d 21 log h o u s e h o l d   s i z e + a d 22 B a c h e l o r s   d e g r e e + a d 23 C a r   o w n e r s h i p + a d 24 O v e r   50   y e a r s   o l d + a d 25 log A v e   d i s t   t o   r e t a i l s + a d 26 log N o .   o f   M R T   t r i p s + d 2
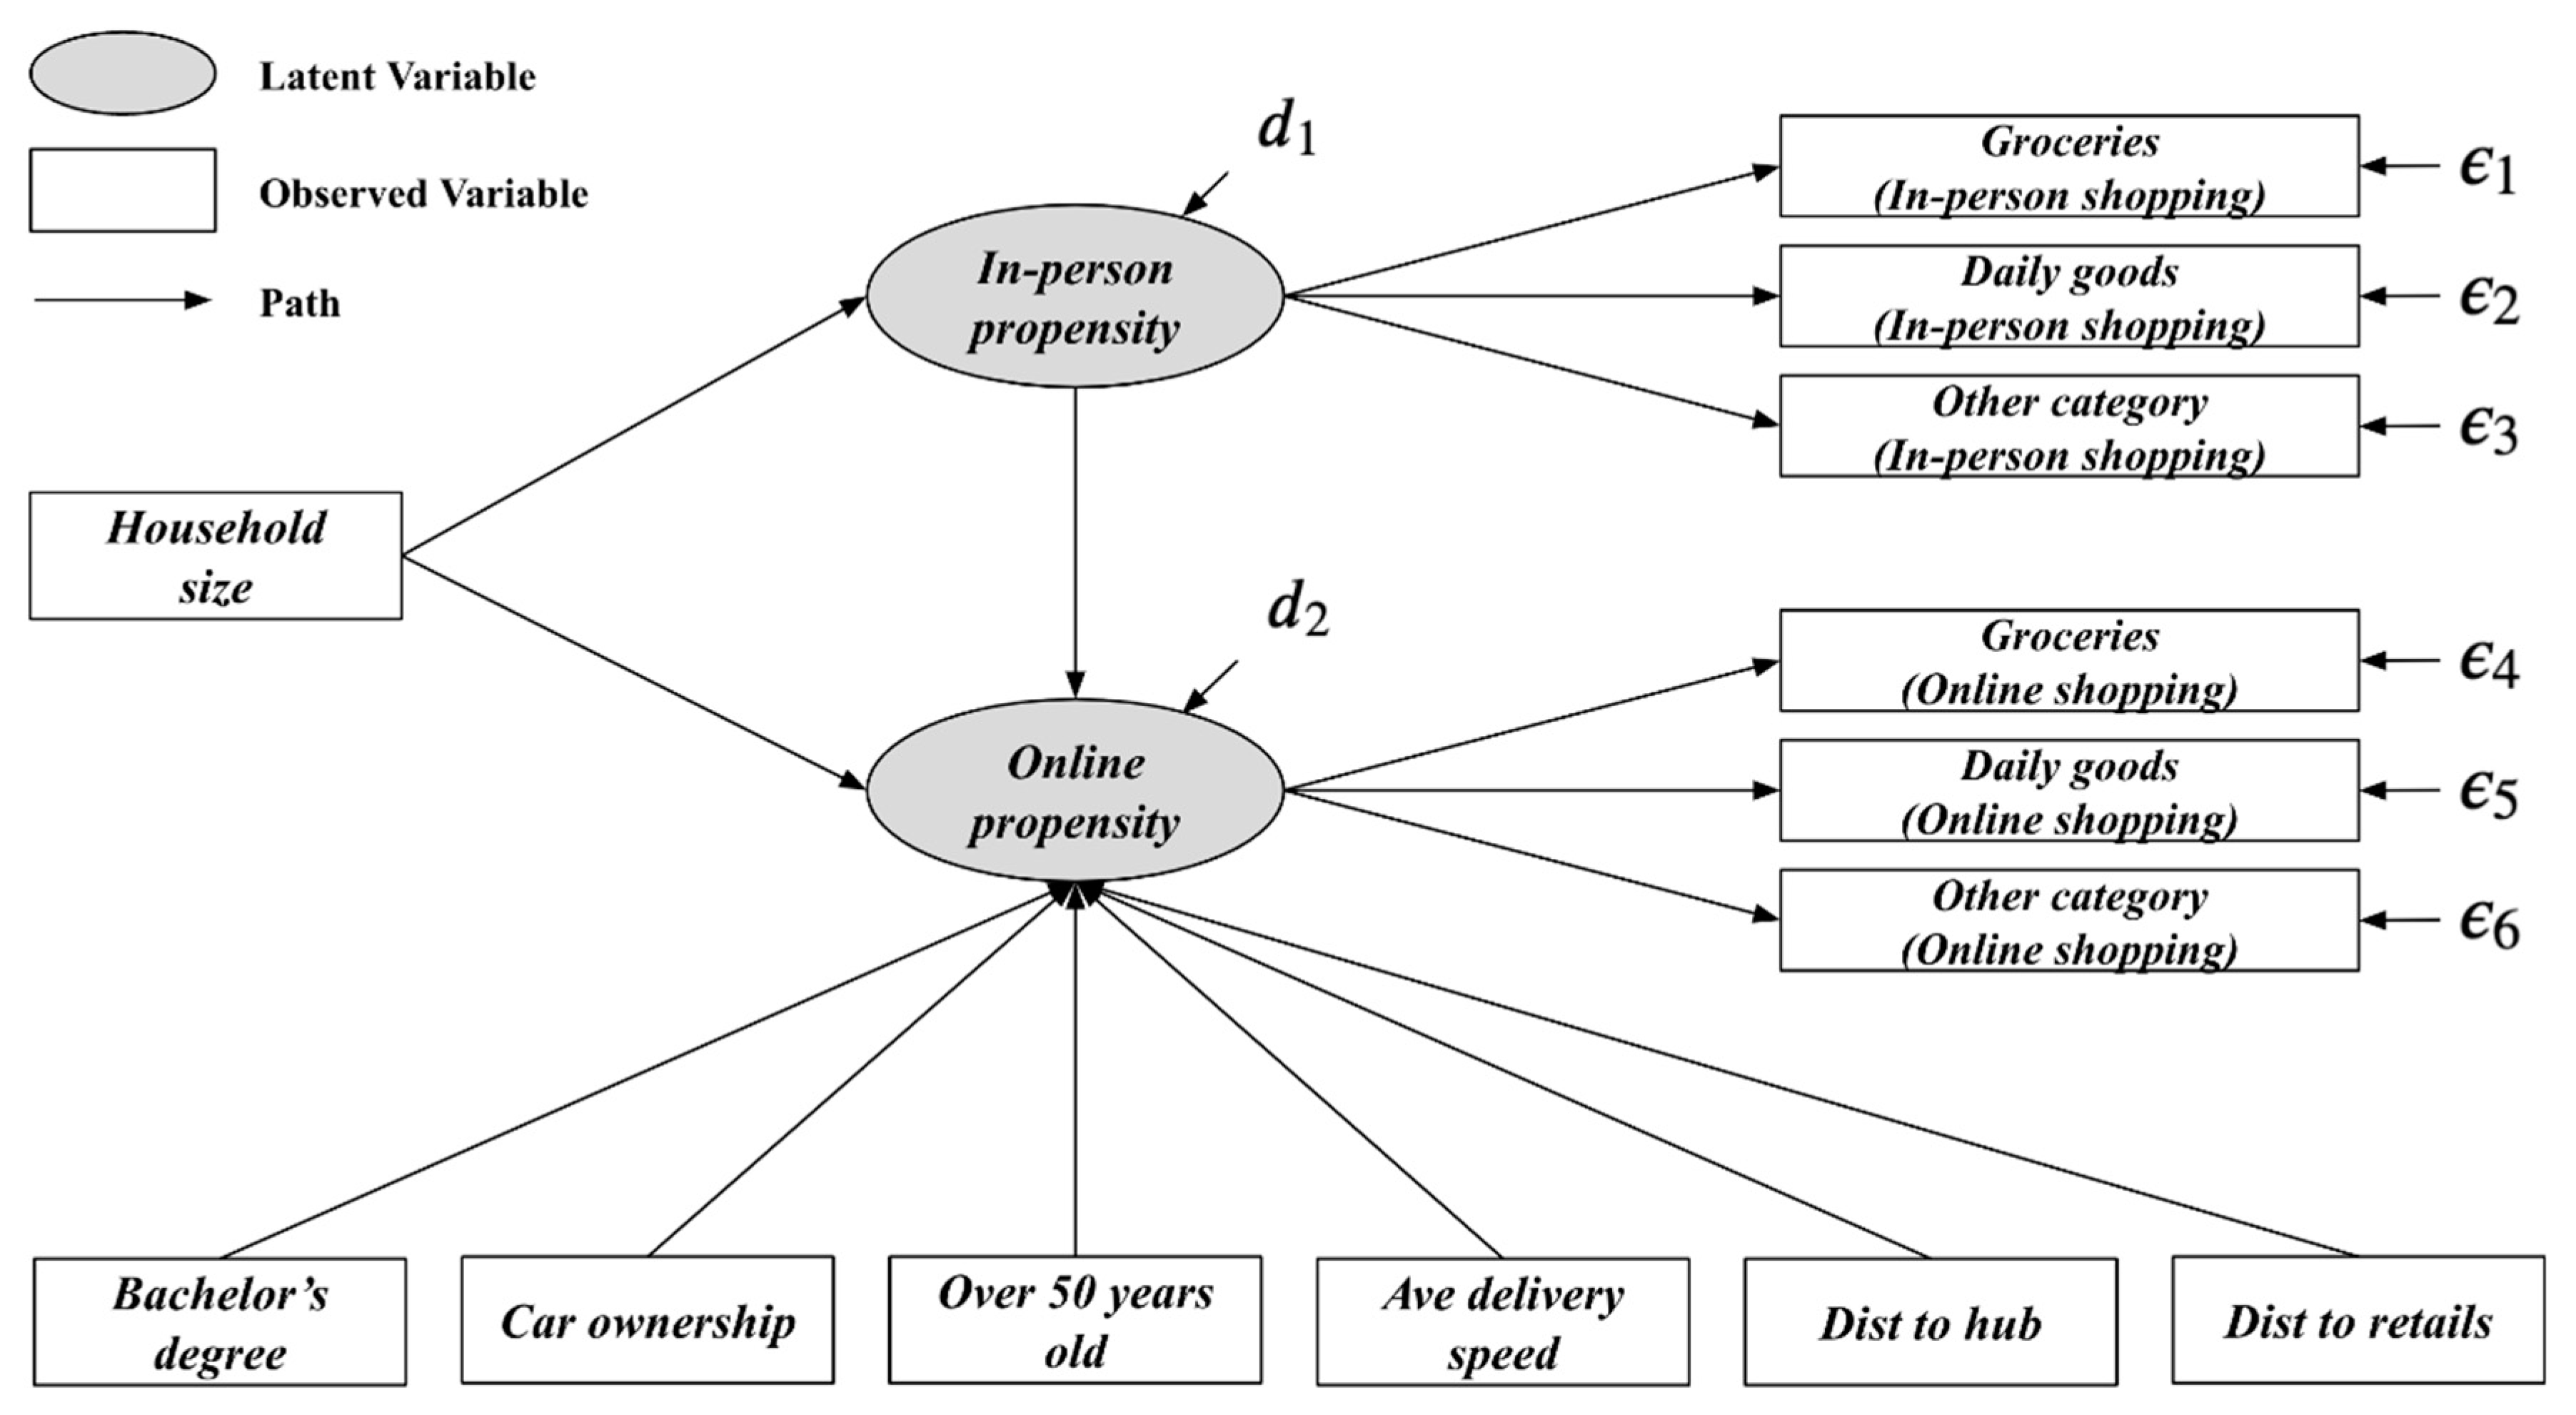
The path diagram is shown in Figure 4. As for the Japan survey data, the number of days to go in-person shopping and the frequency of online shopping are available by goods category. The exogenous variables for online shopping propensity consist of three dummy variables (“bachelor’s degree”, “car ownership”, and “over 50 years old”) and three accessibility variables (“ave delivery speed”, “dist to hub”, and “dist to retails”) as well as household size.
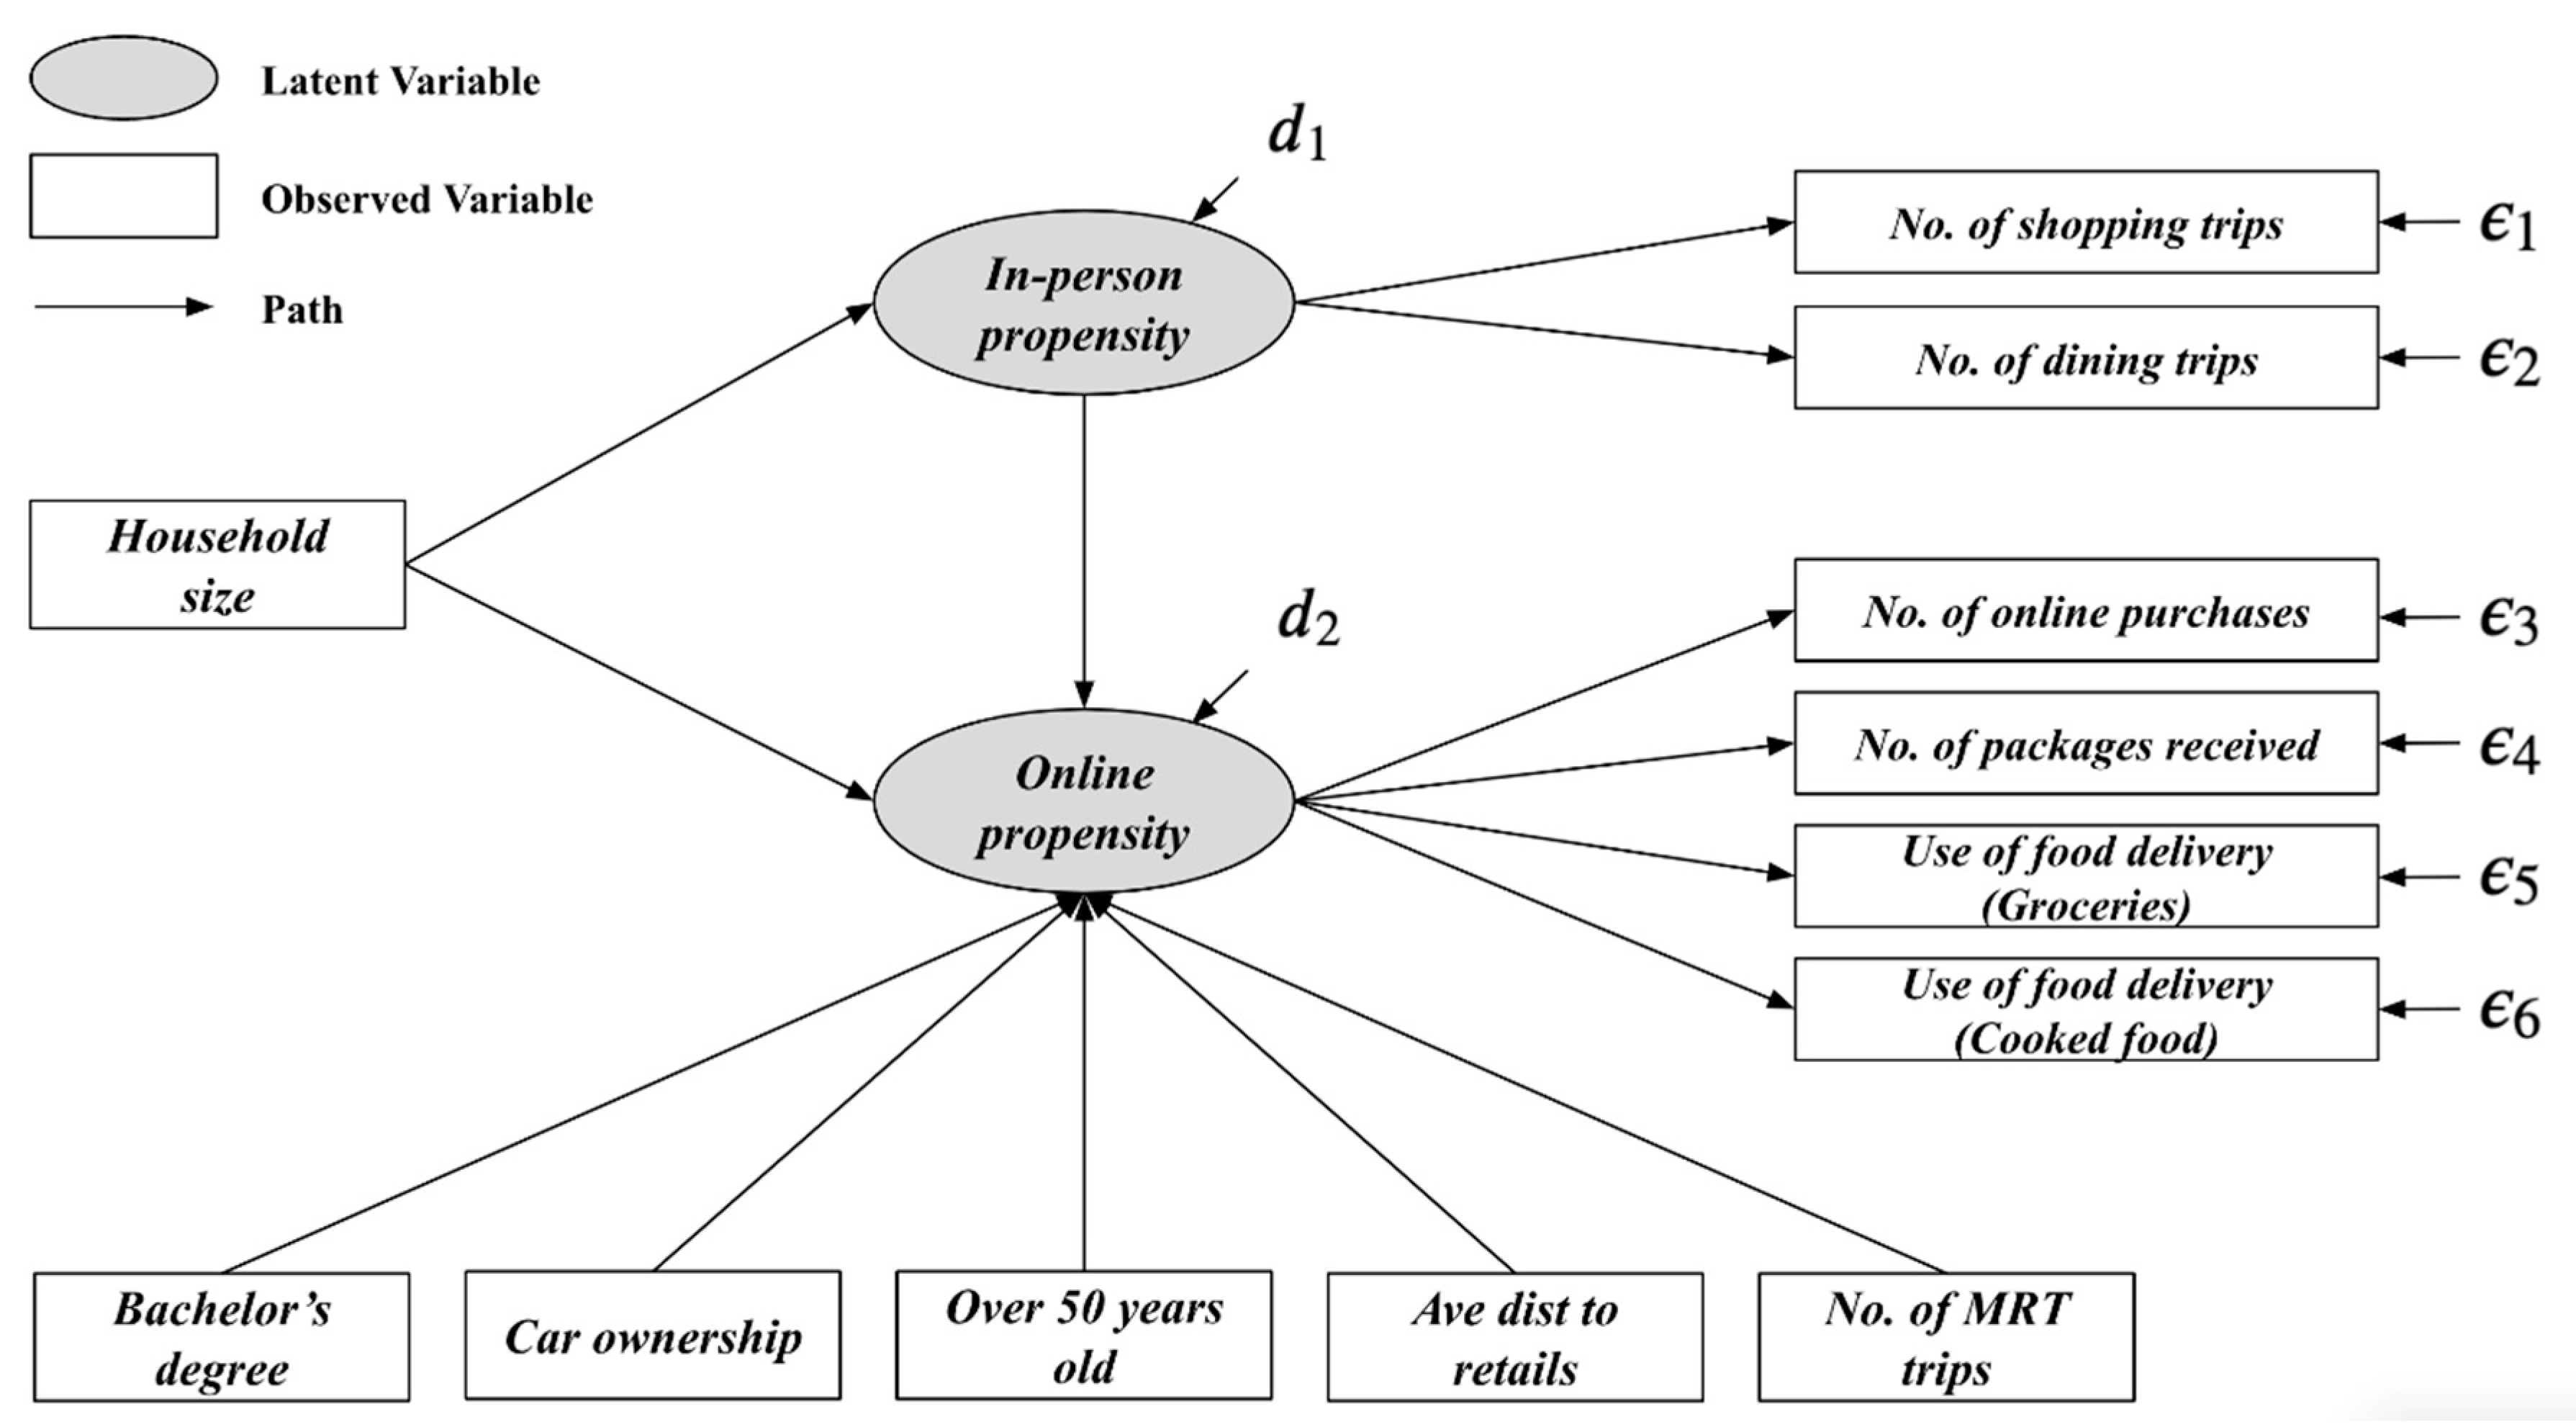
The path diagram for the CMS data is shown in Figure 5. As for the CMS data, the number of days to go in-person shopping and the frequency of online shopping are not separated by goods category. The number of shopping trips and the number of trips for dining out are the indicators of in-person shopping propensity. On the other hand, online shopping frequency, the number of packages received, and the numbers of deliveries of groceries and cooked food are the indicators of online shopping propensity. The exogenous variables for the online shopping propensity consisted of three dummy variables, two accessibility variables (“ave dist to retails”, “No. of MRT trips”), and household size.

4.2. Results

4.2.1. Japan Survey Data

Table 11 shows the estimation results (standardized coefficients) of the SEMs for the “near” group using the Japan survey data. First, in-person propensity has a positive effect on online propensity, which is statistically significant at the 99% confidence level; those who shop in-person also shop online. In-person propensity is greater when household size is larger, with the standardized coefficient of 0.297 (z-value: 3.01). On the other hand, there is no statistically significant relationship between household size and online propensity. Car ownership decreases online propensity, while Bachelor’s degree and Over 50 years old have little impact on online propensity. As for three accessibility variables, the increases in ave delivery speed (no. of days to receive packages) and dist to hub—those relevant to the delivery service level—decrease online shopping propensity, while dist to retails does not affect online propensity. Only the negative coefficient of ave delivery speed is statistically significant at the 95% confidence level.
Similarly to the “near” group, in the “far” group (Table 12), in-person propensity has a positive effect on online propensity. However, the effect of household size on online propensity (0.306) is much larger than that on in-person propensity (0.195). None of the other exogenous variables have a significant effect, even at the 90% confidence level.

4.2.2. CMS Data

In the “near” group (Table 13), in-person propensity positively influences online propensity, similar to the Japan survey data. The effects of household size on in-person propensity and online propensity are 0.157 and 0.114, respectively. As in Japan, there is a greater effect on in-person propensity than online propensity, although the difference is not as distinct as in the Japan survey data. The positive effect of Bachelor’s degree on online propensity is statistically significant at the 99% confidence level. Also, the negative effect of over 50 years old on online propensity is statistically significant at the 90% confidence level. Furthermore, no. of MRT trips has a strong positive effect on online propensity (0.176) that is statistically significant at the 99 % confidence level. Other characteristics, such as car ownership and ave dist to retails, are not statistically significant.
In the “far” group (Table 14), unlike the “far” group of Japan survey data, the effect of household size on in-person propensity (0.146) is greater than that on online propensity (0.075); the result is close to the “near” group. Furthermore, the positive effect of a Bachelor’s degree on online propensity is statistically significant at the 95% confidence level. Again, no. of MRT trips has a strong effect (0.146). On the other hand, unlike the “near” group, car ownership is statistically significant and has a strong positive effect on online propensity (0.144). Furthermore, the positive effect of ave dist to retails is statistically significant at the 95% confidence level. The effect of over 50 years old is not statistically significant in the “far” group.

4.2.3. Discussion

We hypothesized that lifestyle and behavioral patterns associated with neighborhood dependency on MRT are related to shopping mode choice mechanisms. We tested this hypothesis for two areas by estimating the SEM for two groups defined by proximity to MRT stations (“near” and “far”). In the Japan survey data, there are differences in estimation results between the two groups by proximity to an MRT station. Specifically, the influence of household size on the in-person propensity and online propensity is quite different. For those close to MRT stations, online propensity remains constant even with the greater household size. On the other hand, for those far from MRT stations, household size increases online propensity. Notably, the effect of the accessibility to retail stores (“dist to retails”) as well as car ownership is controlled. The result highlights that the shopping mode choice mechanism differs depending on the proximity to MRT stations. Online shopping is more likely to cater to the needs of large households in non-MRT-dependent neighborhoods than those in MRT-dependent neighborhoods. On the other hand, in the CMS data of NYC, the difference between the two groups in terms of the effects of household size on two latent variables is not distinct. Compared to small households, large households rely more on in-person shopping, regardless of the proximity to MRT stations, although the “far” group relies more on vehicle trips (46.3%) than the “near” group (15.0%) for in-person shopping. While an in-depth investigation is required to identify specific reasons for the difference between the two datasets, the results highlight the difference in the relationship between the proximity to an MRT station and the shopping mode choice mechanism between the two areas (Japan and NYC). The result indicates that there are potentially different levels of reliance on online shopping and in-person shopping depending not only on household characteristics but also on the dependency on MRT. Urban planners and policymakers should understand such demand heterogeneity and consider it for land use planning (e.g., development permissions for retail stores and/or logistics facilities) to meet the needs of local residents. The findings may also be useful to businesses engaged in online retailing for considering their marketing strategies. These businesses should understand that the demand of their potential customers may vary depending on the lifestyle and behavioral patterns associated with the neighborhood dependency on MRT, which seems to be the case in Japan (less likely so in NYC).
Regarding the accessibility variables, in the Japanese survey data, there are differences in the degree of effects between the two groups. In the group “near”, two accessibility variables (“ave delivery speed” and “dist to hub”) impact online propensity greater than those for the group “far”. Relative reliance on online shopping is likely to be undermined by inconveniences such as longer delivery times or lack of next-day delivery service in areas close to MRT stations. For e-commerce retailers to be competitive in MRT-dependent areas, their service level should be high, which may justify the deployment of fulfillment centers in close proximity to the population in Japanese large cities. Although many coefficients failed to reach statistical significance potentially due to the small sample size, the longer distance to the nearest retail stores promotes online shopping for the “far” group more than for the “near” group. In the CMS data, a Bachelor degree is statistically significant for both groups. As mentioned in past studies (Anderson et al. [32]; Jaller and Pahwa [33]; Wang and Zhou [14]), higher education level promotes the use of online shopping, which is not so evident in the Japan survey data. Furthermore, the results indicate that individuals who use an MRT station on a daily basis tend to shop online more frequently. TOD is associated with mixed land uses that promote local retail outlets. However, individuals who use MRT heavily may use online shopping more than individuals who use MRT less. This is an important policy implication, especially for US cities where TOD is challenging due to high car dependency because the vitality of local shopping districts is related to the success of TOD.
The differences in results between the two areas (Japan and New York) may be largely due to differences in data collection methods and definitions of the two groups (“near” and “far”). However, differences in factors such as car dependence, built environment, retail shopping experience, and home delivery service levels may also be at play.

5. Conclusions

We focused on the relationship between proximity to MRT stations and the shopping mode choice mechanism and estimated SEMs with two latent variables: in-person propensity and online propensity. We used two datasets. One is from a web-based questionnaire survey carried out in Japan and the other is from the NYC CMS. We analyzed the effects of factors on consumers’ in-person and online shopping propensities based on their proximity to the MRT stations. The results highlight not only neighborhood variations (i.e., MRT-dependent neighborhood vs. non-MRT-dependent neighborhood) but also international differences in the shopping mode choice mechanism. The difference between MRT-dependent neighborhoods and non-MRT-dependent neighborhoods is more evident in the analysis of the Japan survey data than in the CMS data. In the Japan survey data, the effect of household size on online shopping propensity is different between the two groups. Furthermore, delivery speed is more important for the online shopping propensity in an MRT-dependent neighborhood (the “near” group) potentially because in-person shopping becomes attractive in such a neighborhood when delivery speed is slow. In NYC, the effects of household size on in-person shopping propensity and online shopping propensity are similar between MRT-dependent and non-MRT-dependent neighborhoods. This may be related to the high rate of car use (28% car share compared to only 16% for the subway (MRT) [31] despite NYC’s extensive transit network. It should be noted that this limited difference might also come from the fact that, while the samples in the Japan survey data are from various cities in the country, those in the CMS data are from a single metropolitan region. Also, whereas the Japan survey data contain the detailed locations of the respondents, the CMS data are missing this information. It was therefore difficult to accurately compute the proximity to MRT stations, leading to the limited difference between the two neighborhood groups. The findings of this research should be useful for planners and policymakers as well as retailing businesses who need to understand consumers’ preferences.
Past urban design studies have indicated that the built environment, which is often associated with TOD, affects travel behaviors (Ewing and Cervero, [13]). Since shopping is one of the major trip objectives, we hypothesize that the neighborhood differences, specifically whether a neighborhood is MRT-dependent or not, are also related to the shopping mode choice mechanism. While the results of the analysis using the data from Japan, known for successful cases of TOD in urban areas, support this hypothesis, the results of the analysis using CMS do not. This research indicates that travel patterns characterized by MRT-dependency could lead to different shopping mode choice mechanisms and different levels of online shopping propensity. The future research that covers various cities with different urban design contexts should be useful to deepen the understanding on how the online shopping and e-commerce parcel delivery demand will grow depending on urban design and how urban design should cater to the delivery demand.
Author Contributions

Conceptualization, T.S.; methodology, Y.O. and T.S.; formal analysis, Y.O. and T.S.; writing—original draft preparation, Y.O. and T.S.; writing—review and editing, T.S. and T.H.; visualization, Y.O.; supervision, T.S. and T.H. All authors have read and agreed to the published version of the manuscript.

Funding

This work was supported by JSPS KAKENHI Grant Number 23K13421.

Data Availability Statement

The data presented in this study are available on request from the corresponding author due to confidentiality.

Conflicts of Interest

The authors declare no conflicts of interest.

References

  1. Statista. E-Commerce Worldwide-Statistics & Facts. Available online: https://www.statista.com/topics/871/online-shopping/ (accessed on 27 May 2024).
  2. US Census Bureau. Monthly Retail Trade-Quarterly Retail E-Commerce Sales Report. Available online: https://www.census.gov/retail/ecommerce.html (accessed on 27 May 2024).
  3. Ministry of Economy, Trade and Industry. Results of a Market Survey on E-Commerce. Available online: https://www.meti.go.jp/press/2023/08/20230831002/20230831002.html (accessed on 27 May 2024).
  4. Unnikrishnan, A.; Figliozzi, M. Exploratory analysis of factors affecting levels of home deliveries before, during, and Post-COVID-19. Transp. Res. Interdiscip. Perspect. 2021, 10, 100402. [Google Scholar] [CrossRef] [PubMed]
  5. Kim, W.; Wang, X.C. The adoption of alternative delivery locations in New York City: Who and how far? Transp. Res. Part A Policy Pract. 2022, 158, 127–140. [Google Scholar] [CrossRef]
  6. Cao, X.J.; Xu, Z.; Douma, F. The interactions between e-shopping and traditional in-store shopping: An application of structural equations model. Transportation 2012, 39, 957–974. [Google Scholar] [CrossRef]
  7. Haag, M.; Hu, W. 1.5 Million Packages a Day: The Internet Brings Chaos to N.Y. Streets. The New York Times. Available online: https://www.nytimes.com/2019/10/27/nyregion/nyc-amazon-delivery.html (accessed on 27 May 2024).
  8. Hu, P.S.; Reuscher, T.R. Summary of Travel Trends: 2001 National Household Travel Survey; Federal Highway Administration, U.S. Department of Transportation: Washington, DC, USA, 2004.
  9. Zhou, Y.; Wang, X.C. Explore the relationship between online shopping and shopping trips: An analysis with the 2009 NHTS Data. Transp. Res. Part A Policy Pract. 2014, 70, 1–9. [Google Scholar] [CrossRef]
  10. Krizek, K.J.; Li, Y.; Handy, S.L. Spatial attributes and patterns of use in household-related information and communications technology activity. Transp. Res. Rec. 2005, 1926, 252–259. [Google Scholar] [CrossRef]
  11. Cheng, C.; Sakai, T.; Alho, A.; Cheah, L.; Ben-Akiva, M. Exploring the relationship between locational and household characteristics and e-commerce home delivery demand. Logistics 2021, 5, 29. [Google Scholar] [CrossRef]
  12. Ibraeva, A.; de Almeida Correia, G.H.; Silva, C.; Antunes, A.P. Transit-oriented development: A review of research achievements and challenges. Transp. Res. Part A Policy Pract. 2020, 132, 110–130. [Google Scholar] [CrossRef]
  13. Ewing, R.; Cervero, R. Travel and the built environment: A meta-analysis. J. Am. Plan. Assoc. Am. Plan. Assoc. 2010, 76, 265–294. [Google Scholar] [CrossRef]
  14. Wang, X.C.; Zhou, Y. Deliveries to residential units: A rising form of freight transportation in the US. Transp. Res. Part C Emerg. Technol. 2015, 58, 46–55. [Google Scholar] [CrossRef]
  15. Fabusuyi, T.; Twumasi-Boakye, R.; Broaddus, A.; Fishelson, J.; Hampshire, R. Estimating small area demand for online package delivery. J. Transp. Geogr. 2020, 88, 102864. [Google Scholar] [CrossRef]
  16. Comi, A.; Nuzzolo, A. Exploring the relationships between e-shopping attitudes and urban freight transport. Transp. Res. Procedia 2016, 12, 399–412. [Google Scholar] [CrossRef]
  17. Stinson, M.; Enam, A.; Moore, A.; Auld, J. Citywide impacts of e-commerce: Does parcel delivery travel outweigh household shopping travel reductions? In Proceedings of the 2nd ACM/EIGSCC Symposium on Smart Cities and Communities, Portland, OR, USA, 10–12 September 2019; pp. 1–7. [Google Scholar]
  18. Reiffer, A.; Kübler, J.; Briem, L.; Kagerbauer, M.; Vortisch, P. Integrating urban last-mile package deliveries into an agent-based travel demand model. Procedia Comput. Sci. 2021, 184, 178–185. [Google Scholar] [CrossRef]
  19. Farag, S.; Weltevreden, J.; Van Rietbergen, T.; Dijst, M.; van Oort, F. E-shopping in the Netherlands: Does geography matter? Environ. Plan. B Plan. Des. 2006, 33, 59–74. [Google Scholar] [CrossRef]
  20. Ren, F.; Kwan, M.P. The impact of geographic context on e-shopping behavior. Environ. Plan. B Plan. Des. 2009, 36, 262–278. [Google Scholar] [CrossRef]
  21. Loo, B.P.; Wang, B. Factors Associated with Home-Based e-Working and e-Shopping in Nanjing, China. Transportation 2018, 45, 365–384. [Google Scholar] [CrossRef]
  22. Lee, R.J.; Sener, I.N.; Mokhtarian, P.L.; Handy, S.L. Relationships between the online and in-store shopping frequency of Davis, California residents. Transp. Res. Part A Policy Pract. 2017, 100, 40–52. [Google Scholar] [CrossRef]
  23. Dias, F.F.; Lavieri, P.S.; Sharda, S.; Khoeini, S.; Bhat, C.R.; Pendyala, R.M.; Pinjari, A.R.; Ramadurai, G.; Srinivasan, K.K. A comparison of online and in-person activity engagement: The case of shopping and eating meals. Transp. Res. Part C Emerg. Technol. 2020, 114, 643–656. [Google Scholar] [CrossRef]
  24. Kim, W.; Wang, X.C. To be online or in-store: Analysis of retail, grocery, and food shopping in New York City. Transp. Res. Part C Emerg. Technol. 2021, 126, 103052. [Google Scholar] [CrossRef]
  25. Beckers, J.; Cárdenas, I.; Verhetsel, A. Identifying the geography of online shopping adoption in Belgium. J. Retail. Consum. Serv. 2018, 45, 33–41. [Google Scholar] [CrossRef]
  26. Colaço, R.; e Silva, J.D.A. Exploring the e-shopping geography of Lisbon: Assessing online shopping adoption for retail purchases and food deliveries using a 7-day shopping survey. J. Retail. Consum. Serv. 2022, 65, 102859. [Google Scholar] [CrossRef]
  27. Motojima, R.; Sakai, T.; Hyodo, T. Development of an online daily goods shopping demand model using internet-based consumption behavior survey data. Transp. Res. Rec. 2024, 03611981241270172. [Google Scholar] [CrossRef]
  28. Geofabrik Downloads (Japan). Available online: https://download.geofabrik.de/asia/japan.html (accessed on 27 May 2024).
  29. Citywide Mobility Survey. Available online: https://www.nyc.gov/html/dot/html/about/citywide-mobility-survey.shtml (accessed on 27 May 2024).
  30. RSG. 2019 Citywide Mobility Survey Results. Available online: https://www.nyc.gov/html/dot/downloads/pdf/nycdot-citywide-mobility-survey-report-2019.pdf (accessed on 27 May 2024).
  31. Geofabrik Downloads (New York). Available online: https://download.geofabrik.de/north-america/us/new-york.html (accessed on 27 May 2024).
  32. Anderson, W.P.; Chatterjee, L.; Lakshmanan, T.R. E-commerce, transportation, and economic geography. Growth Change 2003, 34, 415–432. [Google Scholar] [CrossRef]
  33. Jaller, M.; Pahwa, A. Evaluating the environmental impacts of online shopping: A behavioral and transportation approach. Transp. Res. Part D Transp. Environ. 2020, 80, 102223. [Google Scholar] [CrossRef]
Figure 1. Distribution of the respondents of the Japan survey data.
Urbansci 08 00154 g001
Figure 2. Distribution of travel time to the nearest MRT stations in Japan.
Urbansci 08 00154 g002
Figure 3. NYC CMS survey area.
Urbansci 08 00154 g003
Figure 4. Path diagram for the Japan survey data.
Urbansci 08 00154 g004
Figure 5. Path diagram for the CMS data.
Urbansci 08 00154 g005
Table 1. Overview of the web-based questionnaire survey (Japan survey data).
Description
RespondentsIndividuals who are responsible for 60% or more of the shopping for the household. Their most recent online shopping were within 1 month of the survey period.
Survey period19–25 May 2022
No. of samples325 (those used in this study: 279)
Questionnaire itemIndividual characteristicsGender, age, occupation/industry, education level, means of commuting, and commuting time.
Household characteristicsType of residence, household income, car ownership, and time to the nearest train station.
Purchasing behaviorPercentage of the person’s share of household purchases, number of days spent for in-person shopping in the last week (by goods type), number of purchases online in the past 30 days (by goods type), number of packages received in the last 30 days, and membership of online shopping sites (registered or not).
The last three online purchasesDate and time of use, website for online shopping, number of items ordered, goods type ordered, value of item, delivery fee, delivery speed, method of receipt, and the company that delivered.
Table 2. Individual and household characteristics of the Japan survey data.
Variable Sample SizeShare (%)
GenderFemale14644.9
Male17955.1
Car OwnershipYes22368.6
No10231.4
Age–30144.3
30–403811.7
40–507422.8
50–607723.7
60–708827.1
70–3410.4
Household size18425.8
210532.3
37824.0
44313.2
592.8
6-61.8
Household Income (thousand JPY)–2000216.5
2000–3000268.0
3000–40003410.5
4000–50003912.0
5000–60003410.5
6000–7000288.6
7000–8000278.3
8000–10,0003310.2
10,000–15,0004112.6
15,000–20,00072.2
20,000–51.5
No Answer309.2
Education LevelElementary/Middle school41.2
High School7322.5
College5717.5
University16550.8
Master216.5
PhD51.5
Table 3. Summary of accessibility variables.
VariableMin.1st Qu.MedianMean3rd Qu.Max
Distance to the nearest Amazon FC (m)347.48157.913,978.570,405.558,206.8817,358.4
Distance to the nearest supermarket (m)47.02287.54517.87994.63974.1516,380.43
Table 4. Shopping behaviors for both in-person shopping and online shopping.
VariableMin.1st Qu.MedianMean3rd Qu.Max
Number of online purchases that has been made in the past 30 days1.002.004.004.195.0010.00
Number of packages received in the last 30 days1.002.003.923.925.0020.00
Delivery speed (days)0.332.003.003.284.0013.00
Number of online purchases in the past 30 days by product.
Groceries0.000.001.001.462.0020.00
Daily goods0.000.000.000.791.0010.00
Other CategoryBooks0.000.000.000.360.365.00
Clothing and cosmetics0.000.000.000.731.0010.00
Electrical appliances0.000.000.000.391.003.00
Furniture and kitchenware0.000.000.000.240.244.00
Other0.000.000.001.001.0010.00
Number of days spent for in-person shopping in the last week
(excluding eating and drinking on the spot).
1.002.003.003.575.008.00
Number of days spent for in-person shopping
(excluding eating and drinking on the spot) in the last week by purchase item.
Groceries1.003.004.004.025.008.00
Daily goods1.001.002.002.032.008.00
Other CategoryBooks1.001.001.001.311.008.00
Clothing and cosmetics1.001.001.001.392.008.00
Electrical appliances1.001.001.001.271.008.00
Furniture and kitchenware1.001.001.001.442.008.00
Other1.001.001.001.472.008.00
Table 5. Overview of the NYC CMS 2019 (CMS data).
Description
RespondentsCitizens in the City of New York.
Survey period13 May–30 June 2019.
No. of samples3036 (those used in this study: 2025)
Questionnaire itemsPersonal attributesGender, age, ethnicity, education level, primary type of employment, industry, and typical commuting mode.
Household attributesHousehold size, number of children in household, household’s annual income, number of vehicles owned, and home CMS zone.
Online shoppingNumber of online purchases, number of packages, frequency of delivery use (groceries), and frequency of delivery use (cooked food).
Trip dataTrips undertaken during the period of the survey (e.g., trip mode, duration, distance, and purposes).
Table 6. Summary of individual and household characteristics of CMS respondents.
Variable Sample SizeShare (%)
GenderFemale163753.9
Male130743.1
Non-binary/Other/Prefer not to answer923.1
Number of household vehicle0149549.2
1106535.1
238912.8
3692.3
4–180.5
Age18–242247.4
25–3471323.5
35–4462620.6
45–5455318.2
55–6449516.3
65–7430810.1
75–1173.9
Household size184227.7
296631.8
354117.8
443114.2
51515.0
6–1053.6
Highest level of education completedLess than high school1033.4
High school graduate/GED2478.1
Some college40913.5
Vocational/Technical training521.7
Associate degree1836.0
Bachelor’s degree92030.3
Graduate/post-graduate degree82527.2
Missing2227.3
Prefer not to answer752.5
Household’s annual incomeUnder USD 15,0002157.1
USD 15,000–USD 24,9992187.2
USD 25,000–USD 34,9991956.4
USD 35,000–USD 49,9992688.8
USD 50,000–USD 74,99946115.2
USD 75,000–USD 99,99937812.5
USD 100,000–USD 149,99943914.5
USD 150,000–USD 199,9992317.6
USD 200,000–USD 299,9991695.6
USD 300,000–822.7
Prefer not to answer38012.5
Table 7. MRT station density.
DistrictSquare kmNumber of StationsStations/km
Inner Brooklyn107.571081.004
Inner Queens70.18390.556
Manhattan Core56.251192.116
Middle Queens56.57300.530
Northern Bronx97.77340.348
Northern Manhattan30.77411.333
Outer Brooklyn168.58680.403
Outer Queens290.11320.110
Southern Bronx59.54470.789
Staten Island256.72180.070
Table 8. Summary of variables related to in-person shopping and online shopping.
VariableMin1st Qu.MedianMean3rd Qu.Max
Variables related to in-person shopping
Number of shopping trips1.002.004.005.998.0056.00
Number of dining trips0.000.002.002.594.0030.00
Number of transits0.000.002.004.417.0052.00
Average trip duration (minutes)0.007.9313.3822.4222.26866.10
Average trip distance (km)0.002.414.208.297.411052.45
Average distance to retails (km)0.000.932.354.875.69134.71
Number of MRT trips0.000.002.004.938.0043.00
Number of trips by vehicle0.000.001.003.295.0056.00
Number of trips by walk0.001.006.008.3213.0055.00
Total trips1.0020.0034.0034.1447.00178.00
Variables related to online shopping
Number of online purchases0.000.000.005.167.00178.00
Number of packages received0.000.002.006.439.00178.00
Use of food delivery (Groceries)0.000.000.000.420.0028.00
Use of food delivery (Cooked food)0.000.000.001.410.0053.00
Table 9. Variables used in the model (Japan survey data).
NotationDescriptionNear (N = 150)Far (N = 129)
MedianMeanMedianMean
Latent variable
   In-person propensityLatent variable indicating propensity to shop in-person.----
   Online propensityLatent variable indicating propensity to shop online.----
Demand size
   Household sizeNumber of household members.2.002.372.002.54
In-person shopping frequency
   GroceriesNumber of days per week to go shopping groceries.4.004.294.003.76
   Daily GoodsNumber of days per week to go shopping daily goods.2.002.012.002.05
   Other categoryNumber of days per week to go shopping other goods.6.006.486.007.39
Online shopping frequency
   Groceries ECFrequency of online shopping (groceries) per month.1.001.620.001.12
   Daily Goods ECFrequency of online shopping (daily goods) per month.0.000.810.000.71
   Other category ECFrequency of online shopping (other category) per month.1.002.122.002.44
Other characteristics
   Bachelor’s degreeDummy variable: 1 if the respondent has a bachelor’s degree, 0 otherwise.-0.51-0.52
   Car ownershipDummy variable: 1 if the respondent’s household has a vehicle, 0 otherwise.-0.64-0.76
   Over 50 years oldDummy variable: 1 if the respondent is over 50-year-old, 0 otherwise.-0.61-0.64
   Ave delivery speedAverage days for receiving packages (average of the last three deliveries).3.003.243.003.16
   Dist to hubDistance to the nearest Amazon fulfillment center in meter.11,89666,83919,82165,624
   Dist to retailsDistance to the nearest grocery store in meter.502869544988
Table 10. Variables used in the model (CMS data).
NotationDescriptionNear (N = 570)Far (N = 1455)
MedianMeanMedianMean
Latent variable
   In-person propensityLatent variable indicating propensity to shop in-person.----
   Online propensityLatent variable indicating propensity to shop online.----
Demand size
   Household sizeNumber of household members.2.002.122.002.64
In-person shopping frequency
   No. of shopping tripsNumber of trips for shopping.4.505.884.006.03
   No. of dining tripsNumber of trips for eating out.2.0002.812.002.51
Online shopping frequency
   No. of online purchasesNumber of online purchases2.005.870.004.88
   No. of packages receivedNumber of packages received during the survey (min: 1 day, max: 7 days).3.006.870.006.25
   Use of food delivery (Groceries)Number of food delivery (groceries).0.000.510.000.38
   Use of food delivery (Cooked food)Number of food delivery (cooked food).0.001.850.001.24
Other characteristics
   Bachelor’s degreeDummy variable: 1 if the respondent has a bachelor’s degree and 0 otherwise.-0.71-0.54
   Car ownershipDummy variable: 1 if the respondent’s household has a vehicle and 0 otherwise.-0.30-0.62
   Over 50 years oldDummy variable: 1 if the respondent is over 50-year-old and 0 otherwise-0.30-0.32
   Ave dist to retailsAverage distance to retail stores in miles.0.972.161.733.37
   No. of MRT tripsDaily use of subway (except for shopping and eating out).3.005.540.003.35
Table 11. Results for “near”, the Japan survey data.
Measurement Part
GroceriesDaily GoodsOther CategoryGroceries ECDaily Goods ECOther Category EC
Latent variable
   Online propensity 0.317 (3.07) **0.481 (4.38) **0.721 (4.62) **
   In-person propensity0.214 (2.30) *0.503 (5.16) **0.854 (6.50) **
Structural part
In-person propensityOnline propensity
Latent variable
   Online propensity
   In-person propensity 0.526 (2.96) **
Demand size
   Household size0.297 (3.01) **0.058 (0.52)
Other characteristics
   Bachelor’s degree −0.021 (−0.22)
   Car ownership −0.172 (−1.64)
   Over 50 years old −0.027 (−0.28)
   Ave delivery speed −0.299 (−2.72) **
   Dist to hub −0.146 (−1.46)
   Dist to retails 0.065 (0.68)
Comparative fit index0.744 N150
Tucker-lewis index0.652 RMSEA0.075
Note: z statistics in parentheses. p < 0.1. * p < 0.05. ** p < 0.01.
Table 12. Results for “far”, the Japan survey data.
Measurement Part
GroceriesDaily GoodsOther CategoryGroceries ECDaily Goods ECOther Category EC
Latent variable
   Online propensity 0.435 (2.65) **0.404 (2.59) *0.355 (2.44) *
   In-person propensity0.332 (3.33) **0.961 (5.84) **0.458 (4.26) **
Structural part
In-person propensityOnline propensity
Latent variable
   Online propensity
   In-person propensity 0.491 (2.09) *
Demand size
   Household size0.195 (2.04) *0.306 (1.79)
Other characteristics
   Bachelor’s degree −0.102 (−0.73)
   Car ownership −0.095 (−0.65)
   Over 50 years old −0.046 (−0.33)
   Ave delivery speed −0.211 (−1.37)
   Dist to hub −0.061 (−0.44)
   Dist to retails 0.151 (−1.05)
Comparative fit index 0.984N129
Tucker-lewis index 0.978RMSEA0.014
Note: z statistics in parentheses. p < 0.1. * p < 0.05. ** p < 0.01.
Table 13. Results for “near”, the CMS data.
Measurement Part
No. of Shopping TripsNo. of Dining TripsOnline Shopping FrequencyNo. of Packages ReceivedUse of Food Delivery (Groceries)Use of Food Delivery (Cooked Food)
Latent variable
   Online propensity 0.692 (10.09) **0.617 (9.91) **0.198 (3.65) **0.330 (6.01) **
   In-person propensity0.607 (6.32) **0.446 (5.90) **
Structural part
In-person propensityOnline propensity
Latent variable
   Online propensity
   In-person propensity 0.419 (4.20) **
Demand size
   Household size0.157 (2.40) *0.114 (1.88)
Other characteristics
   Bachelor’s degree 0.145 (2.64) **
   Car ownership 0.071 (1.21)
   Over 50 years old −0.101 (−1.84)
   Ave dist to retails 0.054 (1.00)
   No. of MRT trips 0.176 (3.14) **
Comparative fit index0.679 N570
Tucker-lewis index0.558 RMSEA0.082
Note: z statistics in parentheses. p < 0.1. * p < 0.05. ** p < 0.01.
Table 14. Results for “far”, the CMS data.
Measurement Part
No. of Shopping TripsNo. of Dining TripsOnline Shopping FrequencyNo. of Packages ReceivedUse of Food Delivery (Groceries)Use of Food Delivery (Cooked Food)
Latent variable
   Online propensity 0.691 (15.77) **0.669 (15.80) **0.192 (5.69) **0.243 (7.14) **
   In-person propensity0.635 (12.34) **0.470 (11.20) **
Structural part
In-person propensityOnline propensity
Latent variable
   Online propensity
   In-person propensity 0.510 (7.90) **
Demand size
   Household size0.146 (3.66) **0.075 (2.00) *
Other characteristics
   Bachelor’s degree 0.085 (2.54) *
   Car ownership 0.144 (3.97) **
   Over 50 years old −0.054 (−1.50)
   Ave dist to retails −0.072 (−2.14) *
   No. of MRT trips 0.146 (4.11) **
Comparative fit index0.794 N1455
Tucker-lewis index0.716 RMSEA0.063
Note: z statistics in parentheses. p < 0.1. * p < 0.05. ** p < 0.01.
Disclaimer/Publisher’s Note: The statements, opinions and data contained in all publications are solely those of the individual author(s) and contributor(s) and not of MDPI and/or the editor(s). MDPI and/or the editor(s) disclaim responsibility for any injury to people or property resulting from any ideas, methods, instructions or products referred to in the content.