Abstract
We harnessed the analytical power of geospatial analysis and modeling techniques, pioneering a novel approach to studying the spatial distribution of households with at least one senior aged 65 or over, known as senior households (SHHs). We developed and implemented a spatial modeling approach that disaggregates the senior household counts obtained from the U.S. Census block data to residential land parcels. This innovative method models the senior household count on each land parcel, generating a detailed, reliable synthetic microspatial dataset for urban senior studies. Robust spatial analysis techniques are then applied to examine senior household spatial distribution in the context of segregation and access vulnerability in the study area. Our research, conducted in the urban setting of Colorado Springs, provides a deeper understanding of the senior residential landscape and identifies vulnerability. Our research findings are not just academic but also practical tools for planners, policymakers, and community advocates in the city to understand senior residential settlements, segregation, and social inequality. Our adaptable approach can be applied using similar modeling and analysis techniques for different study areas. The synthetic data and its generation approach are valuable resources for future urban senior research, enabling further examinations of different senior residential neighborhood typologies beyond basic demographic and socioeconomic aggregated indicators. They can assist studies interested in analyzing the influence of local factors and neighborhood effects on active aging among individuals, as well as simulating individual senior choices and spatial behaviors. Furthermore, they serve as a comparison baseline for future attempts to develop synthetic senior population data with socioeconomic and health characteristics.
1. Introduction
According to [1], nearly 58 million adults aged 65 and above lived in the United States in 2022, comprising approximately 17% of the country’s population. The number of American citizens aged 65 and above is predicted to rise from 58 million in 2022 to 82 million by 2050, representing a 47% increase [2]. This demographic group, especially individuals who dwell in the community, rather than nursing or assisted living facilities, requires special attention and community support to promote healthy and productive aging [3].
Previous research suggests that active aging in place involves more than just managing illnesses or care transitions. Seniors’ well-being and the aging process should be viewed as a holistic construct that includes physical, social, and environmental components [4]. Community resources are crucial in promoting successful aging, especially for those who choose to age in their own homes [5]. Lipsitz [6] suggested that successful models of supportive community-based programs toward healthy longevity should include key factors such as healthy housing that enables aging in place without social isolation and loneliness, engagement in meaningful and productive work, financial needs, physical health, transportation, food, and housing security, and affordable, high-quality home- and community-based healthcare. Importantly, this demographic group also needs initiatives that foster independence, wellness, self-care, self-development, community participation, and social connectivity. These initiatives help connect seniors with supportive services and opportunities for socialization, thus improving their engagement, participation, dignity, self-fulfillment, self-determination, and support [3,7,8,9].
In order to promote the well-being of seniors living in urban areas, it is important to understand where they live and ensure that they have equal access to community resources [10,11]. Various studies have shown that different social and ethnic groups often end up living in separate areas, which is known as residential segregation [11,12,13]. Previous studies have also emphasized the significant impact of residential segregation on living conditions and social inequalities, particularly for older adults [14,15,16,17,18]. As a reflection of broader social inequalities, spatial segregation is influenced by various factors, including sociocultural, institutional, and economic elements [19]. Spatial segregation is often associated with income and education disparities, with access to urban resources being a key determinant [20]. The impact of spatial inequalities on individual outcomes, such as health and well-being, is a major concern [21]. The spatial structure, particularly related to land values, urban violence, and neighborhood typologies, can interactively reinforce differential social resources among different classes [22,23]. For urban seniors, their living conditions and accessibility to aging resources can significantly impact their well-being and ability to stay active. For those with socioeconomic disadvantages living in segregated areas, there is a greater likelihood of financial constraints, poorer health, and limited access to resources that support healthy and active aging [10,24,25,26,27,28,29,30,31,32].
The existing research on senior residential segregation and social inequality has provided a strong foundation for explaining the observations of segregation. It emphasizes the necessity for policies and programs that can address the unequal access to resources and opportunities for seniors living in segregated areas. However, the current research has been limited to using observations at the segregated neighborhood level based on survey data. Due to the current unavailability of detailed and accurate data on the locations of senior housing, researchers have often relied on administrative aggregated data with coarse spatial resolution when conducting studies for larger areas like cities, regions, or countries. This approach has resulted in various conceptual and methodological limitations, as discussed below. The absence of high-resolution and multidimensionally rich datasets has impeded the widespread application of spatial analytical approaches in geographical information science (GIS) for urban senior research and applications. Meanwhile, it is essential to systematically quantify the pattern of residential settlement and spatial segregation and to identify vulnerable areas where support should be focused in order to promote the well-being of senior residents in cities worldwide.
In this paper, we aim to develop an analytical framework using geospatial modeling and analysis techniques for urban senior research to discover patterns of residential household distribution and segregation and identify access vulnerability while dealing with the limitation of data availability. We define senior households (SHHs) as households with at least one person aged 65 or above. To overcome data limitations, we propose a geospatial modeling technique to generate synthetic spatial microdata that represents close-to-reality senior household location data. Our algorithm focuses on generating senior household counts for each parcel, which can be improved in the future to model socioeconomic and health status. We use robust spatial clustering techniques, including density-based and multivariate clustering, to reveal the spatial pattern of senior residential households and patterns of segregation. We examine senior residential segregated scapes in the context of spatial segregation and access vulnerability based on aggregated income and mobility affordability measures. Our synthetic senior household data will be used to expose different neighborhood typologies, including vulnerable areas, such as low-income areas or low-income renters without vehicles. The results also reveal low accessibility to public libraries, an example of essential resources for active aging, which can help in future planning interventions.
We will be conducting our analysis and implementing our model using the city of Colorado Springs, Colorado in the United States as our case study. The city is situated near the remarkable Pikes Peak, a landmark in Pike National Forest, at an altitude of 6035 ft. on the eastern foothills of the Rocky Mountains. Colorado Springs has consistently been ranked among the top ten best cities in the country, according to U.S. News & World Report, and is a sought-after retirement destination, especially among retired military personnel [33]. According to the United States Census Bureau [1], the population of Colorado Springs was 478,961 in 2020, with 14.3% of the population comprising people aged 65 years and above. There were 201,150 households within the city limits, out of which 53,677 (26%) were households with seniors. The city has established strong partnerships with several non-governmental organizations (NGOs), including Innovations in Aging Collaboratives, Silver Key, and Lifelong Colorado Initiative, among others, to create a lifelong livable community for the city and the Pikes Peak region.
Our work demonstrates the exceptional capabilities of geospatial modeling and analysis techniques to uncover the residential scapes of urban seniors living in the community. The proposed model for disaggregating senior household count serves as a solid foundation for more advanced models that consider socioeconomic and health status to create even more precise spatial patterns of senior households. These advanced models can further support future micro-simulation models for individual seniors. We believe that our analysis of segregation and vulnerability showcases the immense power of geospatial data analysis for urban senior research and policymakers. Our approach can be easily adapted and expanded for different study areas across the U.S. or the world. This research also offers valuable insights into Colorado Springs’ efforts to promote active aging and senior research. However, it is important to note that our study does not aim to provide a comprehensive understanding of the various driving factors and resulting impacts of senior spatial segregation and vulnerability or the multidimensional needs of the elderly population in Colorado Springs. Instead, our goal is to establish a methodology for generating synthetic senior microdata and applying robust geospatial analysis techniques to detect segregation in senior research using Colorado Springs as a case study.
In the following sections, we will provide background foundations, review related works, present methodologies to model senior household distribution, examine spatial segregation, and identify vulnerability to access. The results will be presented and discussed and followed by our remarks and conclusion.
2. Background and Related Works
One central concept with quantitative positivistic approaches in urban senior research is the spatial distribution of seniors in the community [34]. It refers to the living locations of seniors and the determination of whether these locations form a pattern over the study area. The existence of a random or clustered pattern is often referred to as a spatial pattern. The concept of spatial patterns can be extended to consider residency locations of only a particular group of seniors based on their socioeconomic or health status. Given the same study area, it might be the case that the spatial concentration patterns of seniors, in general, are different from those of a specific group. This is often referred to as spatial segregation, as previously discussed. Understanding the spatial patterns of senior residency is essential for high-impact research, urban planning, community knowledge transfer, and public policy toward a more productive aging society.
Efforts to understand the spatial distribution of seniors across metropolitans and how that changes over time have been significant in senior research in the U.S. and worldwide. For example, in the U.S., Graff and Wiseman [35], McCarthy [36], and Fuguitt and Beale [37] aimed to examine the patterns of change in concentrations of older Americans nationwide using historic U.S. Census data. More similar and recent reports have been published by the United States Census Bureau [38]. Similar studies have been carried out for different countries, like Canada [39,40], Australia [41], Great Britain [42], and China [43], to name a few. Understanding the spatial distribution of population and resources was often coupled with important works on identifying factors associated with aging population geography and residential choice [44,45,46,47], detecting senior spatial segregation [30,31], evaluating social and healthcare resource accessibility [25,26,28,29,48], assessing public service planning for older people [32], and identifying vulnerability [40,49]. Mapping and spatial analyses using geographical information systems (GIS) have been recognized as powerful evidence-based practice tools for understanding senior settlement patterns and resource access. Popular spatial analysis techniques used in the studies mentioned above include descriptive mapping, proximity analyses, global and local spatial autocorrelation, cluster detection, GIS transportation network analyses, and spatial regression analyses. GIS analysis tools coupled with readily available census data have served well to inform and educate professionals and the public, empower decision-making at all levels, help in planning and tweaking clinical and cost-effective actions, and predict outcomes before making any financial commitments, to name a few [50].
However, current efforts in spatial analysis for urban senior research have been limited due to senior-related data limitations. Most of the existing studies relied on authoritative census data [51]. Limitations exist due to how the census data were collected and reported [52]. Authoritative census data for U.S. and countries worldwide are often reported as statistics (e.g., mean and average) based on spatially aggregated boundaries (e.g., blocks, block groups, tracts, counties, districts) to protect the confidentiality of individual responses. While remaining the most reliable statistical estimates over time, the data are not sufficiently detailed for studies at high spatial resolution levels, such as those of individuals or households. Other studies [45,53,54] utilized individual surveys for their findings, which are limited by conducting costs, low rates of responses, and small sample sizes. Remote sensed data such as orthophotography and satellite imagery have been recognized as an extensive and valuable spatial data source. However, their application in senior research remains limited to visualization or manual detection analysis over a small study area due to a lack of ancillary senior data points at high spatial resolution and complex algorithms for anthropological feature recognition. For example, Thomson and Hardin [49] discussed using GIS with satellite-based remote sensing imagery to manually identify potential low-income housing sites. The limited availability of micro-spatial and attribute-rich data also hinders the applications of robust spatial analysis and modeling approaches, such as investigating segregation at a high spatial resolution analysis scale, simulating residential choices, and assessing social and environmental interactions, particularly for large study areas [55]. Commonly used techniques in existing research include spatial queries, map overlay, interpolation, proximity calculations, and spatial statistics. These techniques, along with facility buffer analysis and transportation network analysis, effectively analyze patterns and modalities at a coarse spatial resolution using aggregated data points or polygons. However, advanced data-driven modeling and analytic techniques such as pattern detection, spatial data mining, and spatial individual behavior simulation [56,57] are not yet applicable for senior research due to technically challenging features and the lack of high-resolution data.
Using census data with aggregated statistics such as count and average in senior research has significant conceptual and methodological consequences for studying urban senior residential patterns. Being data-driven, the accuracy of the spatial pattern analysis depends on the data’s spatial resolution. Data points representing individual seniors or households produce accurate results, while analysis using aggregated data like census blocks or tracts can lead to inaccurate outcomes. Residential patterns and associating characteristics detected using census tract data are limited to the relationship between an ‘average representative’ of a population group (seniors in our case) and average social or environmental characteristics. For instance, in Colorado Springs, the city area is divided into 113 census tracts, with each tract representing approximately 5000 people and 2000 households on average. The number of senior households can range from 0 to over 1000, with an average being approximately 500. Using aggregated data as census tracts for analysis may lead to the ecological fallacy, where the analysis outcomes for aggregated count data cannot be applied to individuals [58]. Furthermore, the outcome of spatial pattern detections and predictions using the same analysis process may differ if one uses the same collected data but with different aggregated boundaries, such as tracts versus block groups or counties. This is a well-known problem with spatial data analysis known as the modifiable area unit problem (MAUP) [59].
The relationship between an individual’s perception of the urban environment and their interactions within it is difficult to investigate using aggregated census tract data. These data fall short in revealing meaningful interactions among seniors and between seniors and the environment in a local context, which is crucial to community resilience research, including risk and vulnerability management. Omer and Benenson [60] and Omer [61] have linked the lack of data at high spatial resolution, in general, to the dichotomy between the quantitative positivistic and the humanistic and structuralistic streams in social science research. The former depends heavily on authoritative aggregate data sources, while the latter values unique individual perceptions of the social and physical environment. To further separate the two, the aggregate data alone cannot be compared directly to those collected in field surveys using personal questionnaires. To better understand senior populations, more detailed information at the individual or household level is highly desired for better analysis. Urban planners and policymakers are also highly interested in studies that reflect detailed and close-to-reality residential scapes of seniors, ideally at household parcels, in order to effectively develop and evaluate changes to the existing plans or policies. Omer [61] presents a GIS-based approach for estimating residential segregation using high-resolution individual data at the household level in Israel and mentions that it could be applied for senior distribution. However, such fine-scale household data are often unavailable in many countries, including the U.S. Heavily relying on aggregated census data alone bounded researchers’ ability to understand the senior residential scapes and estimate variations in individual senior behaviors and their relationships to the immediate human and physical environment.
A separate stream of efforts has been underway to generate a synthetic (artificial or simulated) population at a high spatial resolution, often called synthetic spatial microdata. These data can be generated to represent high-resolution individual data points or areas [62], populations inside buildings [63], or population grids [64]. Hermes et al. [55] provide a comprehensive review of methods that can be used to generate synthetic data, highlighting their potential applications and the need for further research. An authoritative data source, like U.S. Census aggregated data, is used as the base data source to generate synthetic data. These data provide statistics reported at a specific aggregating boundary (or source zone), which will be disaggregated into many smaller target zones. The target zones can be discontinuous points/polygons or continuous surface grids. The target zones thus can imply implicit locations or explicit locations of the simulated populations [65]. Disaggregation is usually done using some areal interpolation method, with or without the assistance of ancillary information, such as land use and transportation networks, or statistical models, such as a fit regression model or machine-learning algorithms, to refine population interpolation [63,66]. Dasymetric mapping is one of the most popular methods for areal interpolation to generate synthetic population data [67,68]. This method first consists of two steps: (1) refining target zones by discarding the uninhabited areas obtained from ancillary data before mapping the source data to target zones and (2) disaggregating the source data to the refined target zones either randomly or using some weight-based and modeling algorithms [63,64,65,69,70,71]. Synthesizing household data is a cost-effective way to address data limitations while preserving personal data confidentiality. It has the potential for various applications like examining policy effects, population changes, transportation, or health issues. However, the modeling techniques require further development for handling population characteristics or specific groups. More demonstrations of synthetic data usefulness are needed to realize its full potential, including in senior research.
Our paper aims to advance the applications of geospatial modeling and analysis techniques in senior research by providing a comprehensive and practical framework to analyze urban senior household residential patterns and segregation, as well as identify vulnerable areas. Our approach works based on spatial modeling techniques for generating synthetic senior household data for our study area, followed by robust spatial analytic approaches to detect spatial clusters and accessibility to resources. Our approach to generating synthetic data involves a two-step disaggregation process based on a dasymetric processing technique and a weighted distribution method using parcel information. We believe this process will help to better understand the spatial distribution of senior households, gain more insights into segregation and low accessibility to public resources, and therefore help develop more effective public policies. We hope our work will serve as the foundation for future synthetic data model developments and more advanced spatial analysis and modeling applications in urban senior studies.
3. Methodology and Implementation
Our comprehensive analytical framework is structured into three key components. First, we generated synthetic senior household microdata. We examined the residential settlement patterns of senior households at high spatial resolution using these data and a density-based spatial clustering of applications with noise (DBSCAN) clustering technique [72,73]. Second, we looked at how income affects where people live to find economically disadvantaged areas and mapped synthetic senior homes in these areas using high-resolution orthoimages. This approach provides valuable insights into the diverse landscape typologies of senior neighborhoods. We applied a multivariate spatial clustering approach [74] to inductively identify the spatially segregated areas. Last, we repeatedly utilize the multivariate clustering technique to identify areas where transportation is unaffordable to reveal places with extreme transportation insecurity based on the number of low-income renters without vehicles in each census tract. For this component, we expanded our analytical framework to include a GIS-based transportation network simulation as an impactful step informing practical intervention. This simulation allows us to estimate travel times for seniors from their homes to specific resources, which are public libraries in our case study. Our synthetic microdata for senior households can then be mapped to access vulnerable areas to identify potential senior residential areas within vulnerable census tracts. The following sections will provide further information about the data and analytic methods.
3.1. Data
All data used for this research were obtained from popular administrative data sources and are often publicly available for cities in the U.S. and worldwide. All data for this paper is also available in the Supplemental Materials. We collected four primary datasets for this paper. The first dataset is the U.S. 2020 Census data, which can be downloaded at http://data.census.gov/advanced (accessed on 11 October 2023). Shapefiles for Colorado Springs census blocks and census tracts were collected. Attributes for the block data include the aggregated household count and aggregated senior household count. Attributes for the tract data include a richer set of sociodemographic attributes—aggregated senior household count, average per capita income, the number of senior households reported as homeowners without a vehicle, the number of senior households reported as home renters without a vehicle, and the number of senior households living with food stamps. The second dataset includes land parcels for Colorado Springs with parcel descriptive attributes. The third dataset includes high-resolution orthoimages of Colorado Springs. The fourth dataset comprises GIS data shapefiles to model the transportation network for the city, including road center lines, bus lines, bus stops, and public library locations. We requested the last three datasets through the City of Colorado Springs office.
3.2. Modeling Senior Households by Disaggregating Census Block Counts
We use a two-step process to create artificial senior households that involves breaking down aggregated data through dasymetric processing and using parcel information to distribute weight. Currently, we only focus on breaking down the number of senior households but plan to expand to include household characteristics in the future.
Our process, shown in Figure 1, starts with the U.S. Decennial Census 2020 data as our primary source. We use block counts to disaggregate senior households into land parcels, which serve as our target zones. The land parcel data also act as our ancillary data to refine our target zones, with information on land parcel descriptions indicating whether the parcel is residential or not, and if it is residential, what type of housing it is (single residential house, condo, duplex, triplex, multiple-unit apartments, etc.).
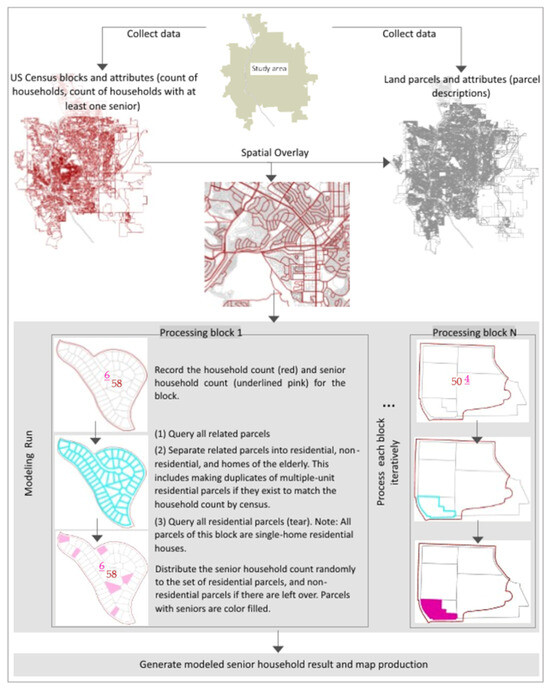
Figure 1.
General workflow to disaggregate senior household counts to residential land parcels.
In the first step of the dasymetric process, we collect all the relevant parcels within each block by spatially overlaying the city’s parcel and block boundary data. The collected parcels for each block are then further processed to collect only the ones designated as residential parcels. During the second step, the collected residential parcels are weighted based on their housing type to ensure fair disaggregation. This is necessary because each residential parcel can accommodate more than one household, depending on their housing type. We assume that a single residential house or a condo can accommodate one household, a duplex can accommodate two households, a triplex can accommodate three households, and a parcel containing a multiple-unit apartment can accommodate more than three households. To ensure that the total number of residential parcels available within a block equals the census household count, we estimate the number of households a multiple-unit parcel can accommodate based on the difference between the block’s total household count and the number of households accommodated by other parcels of single residential houses, condos, duplexes, and triplexes. After modeling the possible number of households each parcel can accommodate, we clone each parcel that number of times to produce the final parcel data, which will be used as the target zone for our disaggregating process. The senior household count for each block is then randomly distributed to its related set of residential parcels. To implement the model, we use ESRI’s ArcGIS Pro 3.0 for mapping and ESRI’s Arcy, a licensed Python library, to carry out the geoprocessing functions and workflow. The Python code developed for this paper is available in the Supplemental Materials.
The general workflow was improved to handle complications. One complication involves cases where finding related parcels for some blocks is not straightforward. This is because some related parcels for a block might intersect with the block boundary and are not exclusively within the block boundary. Enhanced GIS spatial queries are required to identify parcels that are either entirely within the block boundaries or intersect with the block boundaries. When distributing senior household counts to residential parcels, parcels that are entirely within the block are given priority before those that intersect with the block boundary. Another scenario occurs when one large parcel covers several blocks. In this case, the model detects the total number of senior households for the related blocks and distributes the count to the covering parcel. The second complication arises when data on parcel descriptions are inconsistent or missing. To overcome this, three different parcel descriptions (local, state, and land descriptions) were used to identify residential parcels effectively. Only those indicating residential living were queried. The third complication occurs when a parcel is identified as multiple-unit residential (duplex, triplex, 4–9 unit residential, high-rise residential), meaning several senior households can be present in each of these parcels. When a block contains a multiple-unit residential parcel, the model prioritizes the distribution of the senior household count to the related single-unit residential parcels (single residential houses and condos) first. It then proceeds to distribute to duplex parcels and triplex parcels before distributing the remaining count to related multiple-unit residential parcels. The fourth complication arises from the inconsistency in how senior households were counted for, particularly those living in parcels identified as homes for the elderly or assisted living. In this work, the locations and senior populations in homes for the elderly or assisted living in the city were collected, and the related parcels were excluded from the model.
Our model adopts a dasymetric process, a widely used method for generating synthetic populations, as discussed in the Background and Related Works section. This process disaggregates the SHH counts from census blocks to relevant residential land parcels. Census blocks, the smallest data units provided by the U.S. Census Bureau, offer the highest spatial resolution for administrative data sources on senior household counts. The mechanism that redistributes household counts to relevant parcels is based on a random distribution assumption, which is simple to implement and effective, particularly due to the small size of census blocks in the U.S. urban environment.
High-density concentrations of senior households using our generated synthetic point data are then detected using a density-based spatial clustering of applications with noise (DBSCAN) clustering technique [72,73]. This is an unsupervised learning method that works on a set of input point data and aims to identify distinctive groups/clusters in the data based on the idea that a cluster in data space is a contiguous region of high point density, separated from other such clusters by contiguous regions of low point density. We applied this method here using the ESRI ArcGIS Pro 3.0 software. This approach has not been widely used in previous studies of seniors, primarily due to technical and implementational challenges outside of the ESRI ArcGIS software.
3.3. Revealing Spatial Segregation and Vulnerability
Our paper defines spatial segregation as the process of dividing an area into sub-areas with significantly different socioeconomic statuses of senior households. We aim to answer two questions: (1) Is Colorado Springs’ residential landscape divided into sub-areas with distinct characteristics in terms of senior popularity and income? (2) If yes, where are senior households more likely to be located, and what are the differences in residential types? We use census tract data and synthetic senior household data (i.e., the count of senior households and per capita income) overlaid on high-resolution orthophotos to examine these questions.
Figure 2 depicts the general workflow of our analysis process. To detect spatially segmented sub-areas within our study area and answer question 1, we use a robust spatial pattern detection algorithm called multivariate clustering [74]. This algorithm uses unsupervised machine learning techniques to identify natural clusters in the data. By specifying the number of clusters to create, the algorithm searches for a solution where all of the features within each cluster are as similar as possible while ensuring that all the clusters are as different as possible. Feature similarity is determined based on the attributes specified as analysis data fields, and the K-Means algorithm [75] is used to create the clusters. The task involved using U.S. Census tract data, along with their sociodemographic attributes, to examine whether all tracts in a study area could be divided into subgroups or clusters based on their given attribute value ranges. A multivariate clustering approach was adopted to detect distinctive subgroups or clusters of tracts. Box plots were used to display the distribution of each attribute and to compare the value ranges of each detected sub-area against the one-standardization value range for the whole study area. Multiple attributes were considered, and several box plots were displayed together to visualize the characteristics of each sub-area.
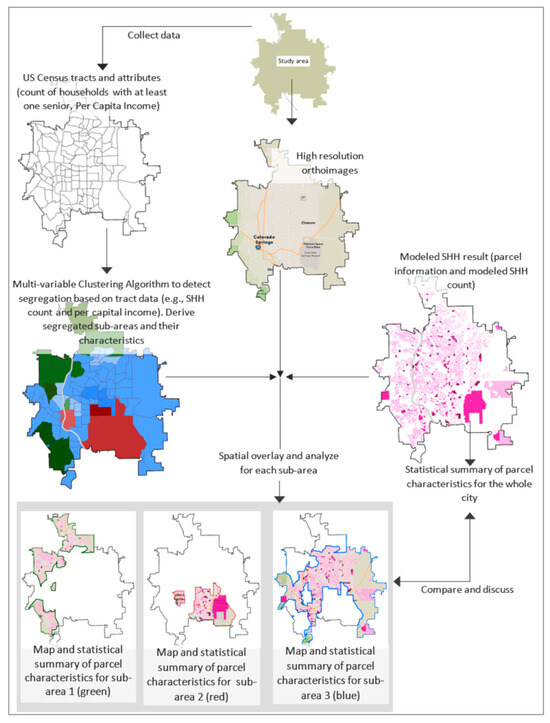
Figure 2.
General workflow of detecting and analyzing spatial segregation and vulnerability.
In this work, we extensively used multivariate spatial clustering techniques to analyze the senior residential segregation. We chose this technique because it is effective at discovering patterns based on multiple attribute dimensions and is easy to implement within the ArcGIS software package. Compared to other spatial clustering techniques popularly used on aggregated data with one variable, such as spatial autocorrelation [76], multivariate clustering can identify hidden structures and patterns within large and multidimensional complex datasets and provide a compelling visual way to explore and analyze clusters [77,78].
Figure 3 illustrates the outcome example of the study area using two attributes (loosely referred to as attribute 1 and attribute 2). A multivariate clustering analysis using these analysis fields and a request for 4 clusters (sub-regions) output a map of the detected sub-regions and their attribute values plotted in different equivalent colors against the whole study area’s data box plots plotted in gray color. Sub-region 2 and 4 have high values for both attributes (in red and orange), sub-region 3 has average values (in green), and sub-region 1 has low values (in blue).
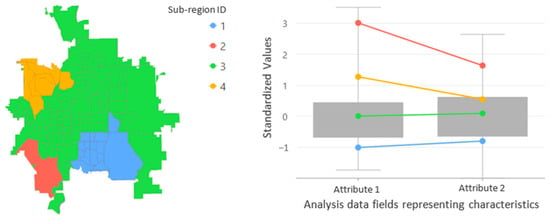
Figure 3.
Output example of running a multivariate clustering analysis on three attributes.
To better understand the spatial segregation pattern, we used synthetic modeled senior households and high-resolution orthoimages to map the location of senior homes to examine the neighborhood landscape and typology within each sub-area. We utilized ESRI’s ArcGIS Pro 3.0 software to run the multivariate clustering algorithm, perform spatial overlays, and create the map.
3.4. Modeling Transportation Networks and Evaluating Accessibility to Public Services
Our study models transportation networks using GIS to simulate car and bus travel within the area [79]. We evaluate and compare travel time to access the nearest public library for households within the study area.
Figure 4 presents our general workflow, which involves constructing driving and bus travel networks and generating a surface that represents the travel time cost to the nearest library for the study area. We collected GIS line data representing road centerlines, bus routes, and bus stops to create the networks. For simplicity, we assume that every road has a sidewalk. We created two transportation networks. The first one includes road lines to simulate car movement. The second one includes sidewalks, bus routes, and bus stops to simulate transit travel. The data lines representing roads are broken down into connected segments at intersections to ensure car movement in different allowable directions. Similarly, the data lines representing sidewalks are broken down into connected segments at their intersections and where they meet the bus stop to ensure pedestrian movement in different allowable directions to and from the bus stops. The data lines representing each bus route are also broken down into connected segments where they meet the bus stops to allow travelers to get on and off the bus.
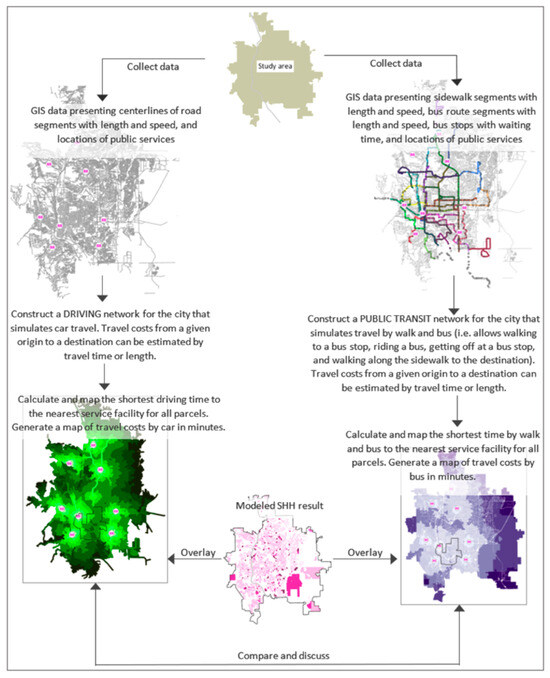
Figure 4.
General workflow of modeling transportation and accessibility to public services.
The driving network had only one feature class (road), while the bus network had 33 feature classes, including sidewalks, bus stops, and 31 bus routes. We set connectivity rules for the bus network to ensure that travelers can only board or get off the bus at bus stops connected to sidewalks. Thirty-two connectivity groups were imposed among the feature classes to set the connectivity rules. Each group contains only the sidewalks, one bus route, and the bus stops for that route. The bus stop feature class connects sidewalks and bus routes within each group and between different groups. We used a travel speed of 45 miles/hour for cars, 40 miles/hour for buses, and 2.75 miles/hour for senior walking, based on the literature [80].
After constructing the transportation networks, we conducted a GIS network service area analysis [81] to create a map that shows the cost of travel time to the nearest library in the study area. This analysis involved determining a region that includes all portions of the network that can be reached from one or more facilities within a specified distance or travel time. Service areas for public libraries were generated based on different time budgets of 15, 30, 45, 60, 90, 120, 150, and 180 min, which were overlaid to create a travel time cost surface. ESRI’s ArcGIS Pro 3.0 was used for this analysis.
4. Synthetic Modeled Senior Household Distribution and Potential Applications
This section presents the results of disaggregating senior household counts into parcels and discusses its applications. Figure 5a shows the spatial distribution of the parcels that contain modeled senior households for the study area. Figure 5b presents a closer view of area 1 (indicated by a blue dashed boundary line on the left), while Figure 5c is a closer view of area 2 (indicated by a blue dashed boundary line on the right), both shown in Figure 5a. For area 1, a pink parcel intersects the boundaries of two blocks; one block has seven senior households, while the other has none. Our algorithm handles this situation by assigning the seven households to the intersecting parcel, which is the only related parcel found in this case. For area 2, the pink parcel expands over several blocks. Our algorithm manages this situation by assigning all reported senior households from all overlaying blocks to only one related parcel found. As previously discussed, examples of complex spatial relationships between block and parcel boundaries occasionally occur in our study area. We ran the model five times to carry out a sensitivity test. The differences in the results for the representative two runs are presented in Appendix A, Figure A2. Because the algorithm works by randomly distributing SSH counts to related parcels for each block, we do not expect precise overlap between the two results when zooming into parcels. We confirmed that the count of senior households for census blocks was accurately distributed to the corresponding residential parcels as intended, with an accuracy of 94% and above. This validation process was achieved using Python code, which involved summing the distributed senior household counts on residential parcels for each block and comparing that value with the original census aggregated value for each run.
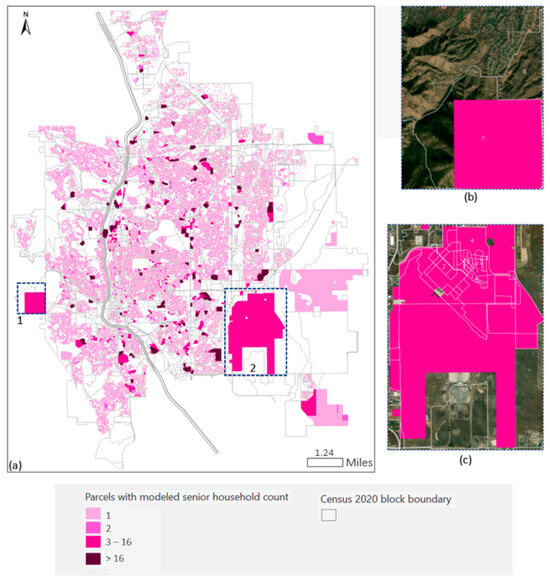
Figure 5.
(a) Modeled senior household count for parcels, excluding the known senior count at assisted living or homes for the elderly for the study area, (b) the zoomed-in view for area 1, and (c) the zoomed-in view for area 2 to show complex spatial relationships between block boundaries (in white color) and parcels (in pink color).
The result here is a close approximation of the actual locations of senior households within blocks. However, it is important to note that the senior household count was randomly distributed to the number of residential parcels within the block to protect senior citizens’ privacy. While this approach may not be completely accurate in modeling household locations, it serves as a useful estimate of the potential distribution of senior households in the city. The results presented in this study can be applied to assist active aging promotion programs, organizations, urban planners, and policymakers. They provide a more informative map of the distribution of senior living locations within the city, as shown in Figure 6. This information can then be used to overlay active aging resources, such as community centers, public services, and medical centers to create a comprehensive view of the senior living landscape. This helps to assess the interactivity and accessibility between seniors and the resources available to them.
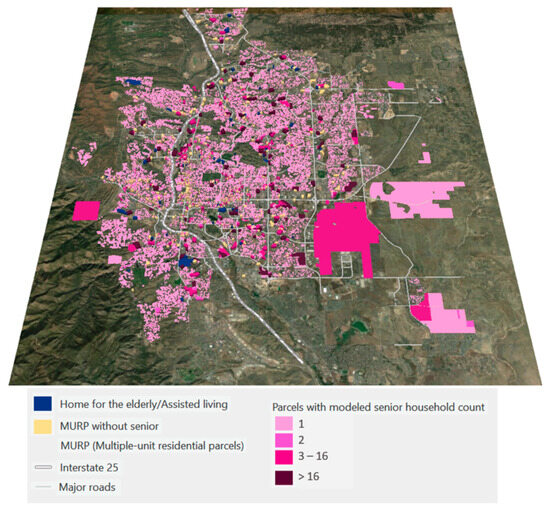
Figure 6.
Valuable three-dimensional visualization platform of the city complex system.
Along with visualizations, we can also analyze parcel statistics to gain more insights. For instance, Table 1 presents the estimated percentage for each housing type within the city and the estimated percentage of senior households associated with each housing type. Our algorithm prioritizes the distribution of senior households to residential parcels. However, in some cases, the parcel data suggest that the block senior household count is higher than the total amount of residential parcels, even after considering multiple-unit apartments or cases involving complex spatial relationships between block and parcel boundaries. This is why we see a few senior households assigned to non-residential parcels. In a real community, it is not unusual to find seniors living in a non-residential parcel attached to their or their family’s business locations or offices. While assigning a leftover senior household to a non-residential parcel is random and can be improved in our future work, we believe that the amount and variations of the modeled senior households on non-residential parcels potentially reflect the hidden living conditions of vulnerable seniors. Therefore, we aim to investigate this perspective further in our future work. Our findings suggest that within the city of Colorado Springs, approximately 73.5% of senior households reside in single-family residential land, 8% in townhouses, 4% in condo units, 8% in multiple-unit apartments, 1.4% in duplexes, and 1.8% in multiple and mobile units under the form of clubhouses. The lack of data on senior household locations has presented a challenge for existing research in producing similar statistical estimates in specific study areas, such as a city or larger region. Consequently, we are unable to compare our findings with those of others. Nevertheless, we aspire for our findings to lay the beginning groundwork for future studies.

Table 1.
Local descriptions of the parcels where seniors live.
The close-to-reality distribution of senior household parcels can be used in spatial analyses to examine spatial patterns of senior home locations with Colorado Springs, thus identifying if there are concentrations of senior households in any sub-area. This can later be used to understand senior home choices and daily spatial behaviors in the context of active aging resources. Figure 7 presents a map of high-density concentrations of senior households using our generated synthetic point data and detected using the DBSCAN spatial clustering technique. We used the parcel centroid to represent the senior household living on the parcel. For parcels with more than one modeled senior household, we generated random points within the parcel to represent its households. We then use the household point locations as input to run the DBSCAN clustering technique to detect clusters of high-density senior households. In Figure 7, each dot (red and gray) represents a senior household location; the red ones are in the detected high-density clusters, and the gray ones are outside of the high-density clusters. The result suggests that there are few concentrations of senior households spread over large areas on the west side of Interstate 25 and on the far North side of the city. However, there are small batches of senior household concentrations all over the city. Compared to the spatial distribution of senior households mapped using aggregated data in Appendix A, Figure A1, the result presented here depicts a more accurate senior household distribution at a much finer spatial resolution. It thus is instrumental in allowing further analysis of neighborhood and community typologies, human–environmental interactions, and other important factors that could help increase active aging community-building efforts.
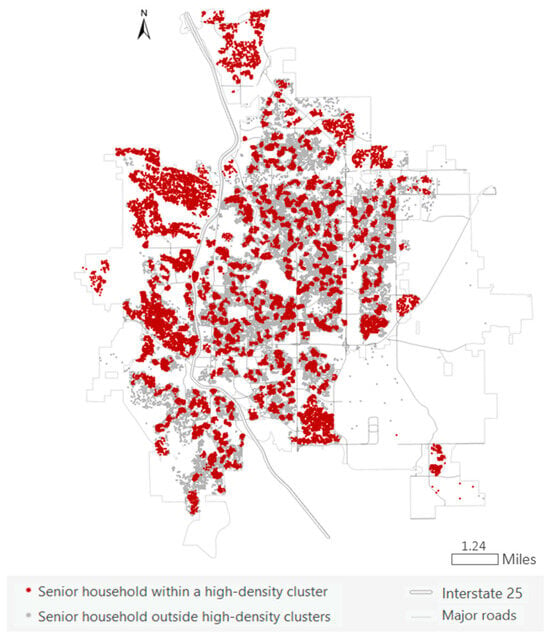
Figure 7.
Detected high-density concentrations of senior households.
5. Revealing Spatial Segregation
In this section, we present our analysis of spatial segregation to showcase how spatial analytics and synthetic data generated in senior households can be used constructively. We explored spatial segregation among senior households based on income and used 2020 U.S. Census tract data. We ran a multivariate clustering algorithm requesting thirteen sub-areas, using senior household count and average per capita income as attributes to achieve this. We then presented the results in Figure 8, which includes a map of the sub-areas (left and their attribute characteristics (right). To further summarize the findings, Table 2 provides an overview of each sub-area’s characteristics based on senior population and average income, as reported in their tracts’ attributes.
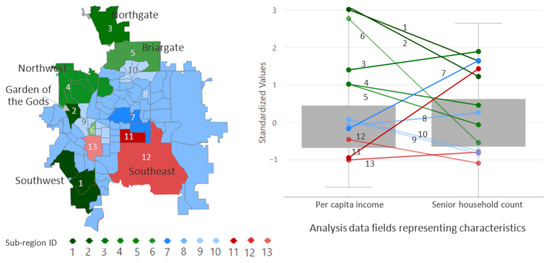
Figure 8.
Spatially continuous groups of census tracts (sub-areas within the study area) detected and characterized by the number of senior households and average per capita income.

Table 2.
Average per capita income and senior household statistics for each sub-area.
The findings of the multivariate clustering analysis provide important insights into the spatial segregation among senior households in Colorado Springs based on income. The identification of high per capita income tracts in sub-areas with IDs 1 to 6 will be useful for policymakers and community leaders in their efforts to improve the city’s overall economic well-being. These high-income sub-areas, accounting for 23% of senior households, comprise some of the most coveted neighborhoods in the city, including the historic Old North End (ID 6) and breathtaking Garden of the Gods (ID 2). The darker green color indicates areas with a higher number of senior households. These include the Southwest’s Broadmoor (ID 1), the Garden of the Gods (ID 2), and the Northgate neighborhoods (ID 3). These findings provide a constructive starting point for policymakers and community leaders to focus their efforts on improving the economic prosperity of the city’s senior population.
Sub-areas numbered 7–10 have been identified as having a medium per capita income and are highlighted in blue on the map. These areas constitute the majority of the city, comprising 63% of the senior households in Colorado Springs. The average per capita income in these areas ranges from $31,000 to $35,000, making it the typical living area for seniors in the city. Of these sub-areas, sub-area 7 stands out as having the highest concentration of seniors. It is marked with a darker shade of blue in Figure 8 and is home to 2599 senior households, which is roughly 5% of the total senior households in the city.
Sub-areas numbered 11–13 have been identified as having low per capita income and are marked in red on the map. These areas include the central downtown area (ID 13, APCI $28,004) and the Southeast neighborhoods (IDs 11, 13, APCI $21,817), which are home to 7546 households (14% of the city’s total). Sub-area ID 11, marked in darker red, has a high concentration of senior households with lower-than-average per capita income, accounting for 3% of the city’s senior households and representing the most financially vulnerable ones.
There are instances of extreme spatial segregation in Colorado Springs where the wealthiest and poorest neighborhoods are located next to each other. For instance, the affluent Old North End Historic neighborhood (sub-area ID 6) with an APCI of $66,590 is adjacent to the impoverished central downtown (sub-area ID 13) with an APCI of $28,004, and the only thing separating them is Uintah Street. Additionally, there are two sub-areas popular among senior citizens (IDs 7 and 11). While one area is a popular mid-income neighborhood, the other is one of the poorest in town. The results presented in this study demonstrate how GIS analytic functions can effectively detect spatial segregation based on income and senior household count. The analysis can be modified to use different attributes for senior residential segregation detection based on various sociodemographic and health factors, provided that the data for such measurements are available. We believe that identifying the spatial structure of segregation in the city is very useful for senior community advocates, city urban planners, policymakers, and senior real estate and housing committees to work together to make Colorado Springs a better place for productive aging. However, due to limitations in data attribute availability at higher resolution, the multivariate clustering analysis can only be applied at a coarse spatial resolution (census tract as analysis unit), resulting in the discovery of sub-areas formed by tract clusters. The next logical analysis step is to investigate the spatial modalities that govern residential choices, spatial behaviors, productive aging resource accessibility, and active aging community participation among and within the sub-areas, ideally at a high spatial resolution, such as senior individuals or senior households. Existing work on spatial analysis for senior research is limited in moving in this direction, mainly due to data limitations, as discussed earlier in this paper. However, continuing efforts to advance spatial analysis in these directions are crucial as they promise to significantly contribute to the urban senior research body of knowledge and active aging community intervention efforts. We aim to tackle these challenges in our future work.
In the following section, we use synthetic senior household data as an alternative data source to overcome the challenge of data constraints. The synthetic data produced here represent a reliable method for displaying senior settlements, analyzing spatial segregation at high resolution, and simulating seniors’ spatial behavior while protecting the actual locations of senior households. Our focus in this paper is to use these data to visualize and contrast the residential landscapes among the segregated sub-areas, paving the way for future research to study segregation in-depth as well as to simulate senior behaviors and interactions at high spatial resolution. It is also important to acknowledge that our study at this stage bypasses identifying the specific factors driving the segregation process, the patterns of which were observed in this study of Colorado Springs. These factors are likely complex and interconnected, encompassing aspects such as seniors’ socio-economic background, health status, and residential preferences. The lack of high-resolution data on socioeconomic and health status and real estate preferences prevents reliable and comprehensive analyses of the segregation process. We aim to continue this line of work and address this issue in the future.
The maps in Figure 9, Figure 10 and Figure 11 provide a clear representation of the distribution of senior households within each sub-area. These visuals showcase how income segregation is reflected through segregation in residential housing locations, neighborhood landscaping, and access to nature and green spaces. It is worth noting that access to green spaces has a significant impact on productive health and longevity, as highlighted in the study by Li et al. [43].
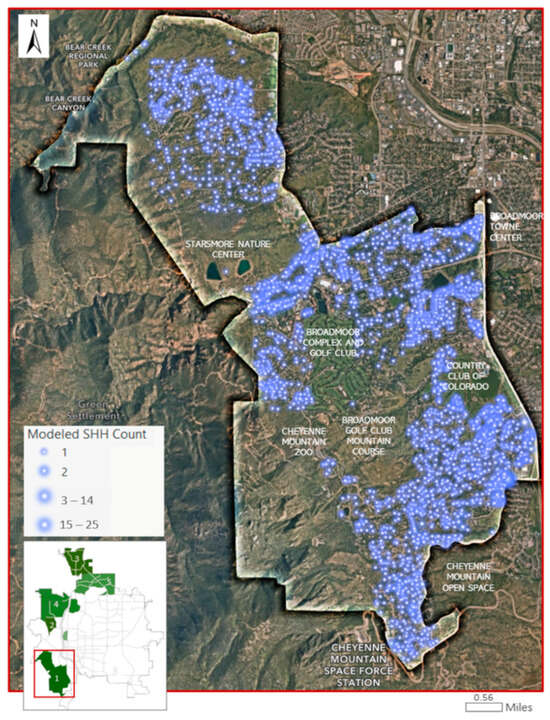
Figure 9.
Modeled spatial distribution of senior households in sub-area 1 (the Broadmoor neighborhood: high income, high SHH count).
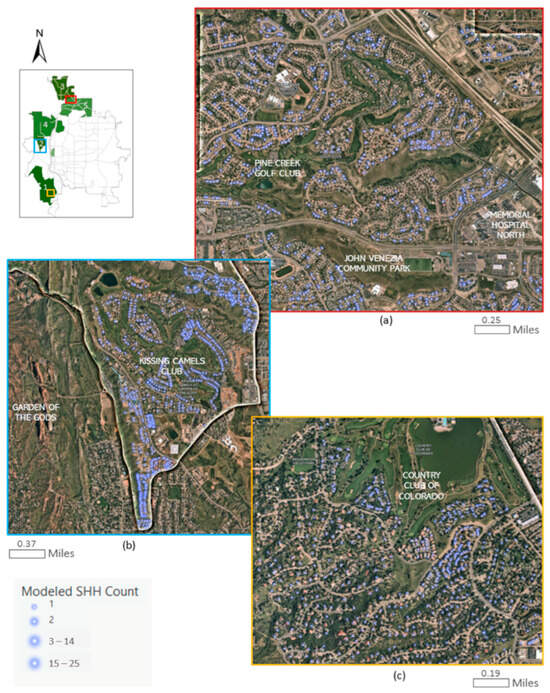
Figure 10.
Landscape examination and modeled distribution of seniors in high-income sub-areas (a) 1 (the Broadmoor neighborhood), (b) 2 (the Garden of the Gods neighborhood), and (c) 5 (the Briargate neighborhood.
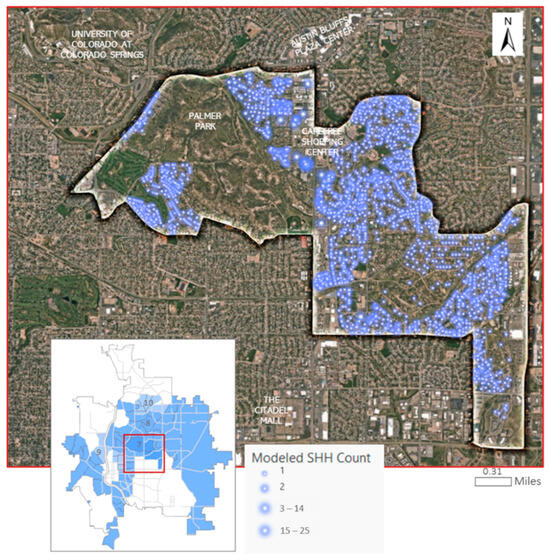
Figure 11.
Modeled spatial distribution of senior households in sub-area 7 (medium income, high SHH count).
Upon close examination of Figure 9 and Figure 10, we can observe the living conditions of the most affluent elderly households in the city. These households are located in neighborhoods that share a common theme of being close to nature. They have access to large land parcels and plenty of open space in between, surrounded by green land. Additionally, they have easy access to the most well-known nature resources in the city, such as the Broadmoor complex, the Starsmore Nature Center, Bear Creek Regional Park, and the Cheyenne Mountain open space (Figure 9). They also have access to high-quality facilities for active aging, including John Venezia Park, Memorial Hospital North, and Pine Creek Golf Club (Figure 10a). Lastly, they have access to Garden of the Gods—Colorado Springs’ awe-inspiring National Natural Landmark (Figure 10b). These visuals serve as a reminder that prioritizing access to green spaces can have a positive impact on the health and well-being of senior citizens. It is essential for workers across different fields to collaborate toward creating inclusive communities that offer equal access to nature and the benefits it provides.
Figure 11 presents a zoomed-in view of the landscape and senior household distribution in a popular mid-income neighborhood (sub-area ID 7). This area is situated in the center of the city boundary and is home to over 2500 households with senior citizens. Our multivariate clustering analysis has identified that this area contains tracts with a much higher number of senior households than the average. It is possible that the concentration of mid-income seniors in this area is due to its central location and its proximity to attractions such as the largest university in Colorado Springs (University of Colorado at Colorado Springs), various shopping centers, and Palmer Park. This 730.7-acre regional park offers stunning views of Pikes Peak on the west and provides over 25 miles of trails for horseback riding, mountain biking, and hiking. It is worth noting that wealthy seniors may not find this area appealing due to its surrounding crowded residential parcels.
In Figure 12, we can see a closer view of the landscape and distribution of senior households in two areas of Colorado Springs—the central downtown (sub-area ID 13) and the Southwest neighborhood (sub-areas 11 and 12). Our analysis shows that both areas have a large number of low-income households. We found that these areas have a mix of commercial and industrial land parcels where senior households have settled. The Southeast neighborhoods are close to the airport and suffer from noise and pollution. Our analysis of the senior households in the area suggests that they have less affordability for single-family residential land. Only 65% of the senior households in this area can afford single-family residential land, compared to 76% in high-income areas and 75% in mid-income areas. The percentage of senior households living in multiple-unit residential lands is also significantly higher at 15%, compared to 13% in mid-income areas and 4% in wealthy areas.
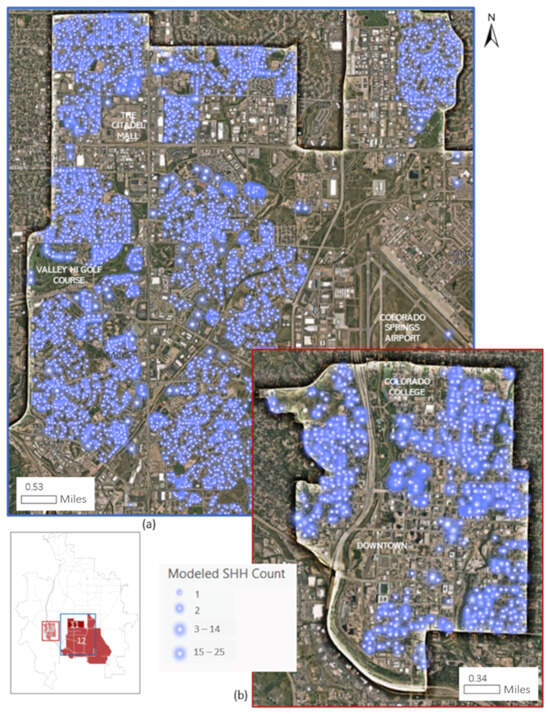
Figure 12.
Modeled spatial distribution of senior households in low-income sub-areas (a) 11, 12, and (b) 13.
Figure 13 highlights an interesting observation regarding the placement of sub-areas with the lowest income. These sub-areas are located adjacent to the wealthiest neighborhood—Old North End Historic neighborhood (sub-area ID 6)—and the mid-income Palmer Park neighborhood (sub-area ID 7). The Old North End is renowned for its unique historical architecture, initially designed for middle and upper-class residents in the late nineteenth century. Today, it remains a popular choice for seniors who appreciate the area’s historic charm, despite the high housing prices. The distribution of senior households within these segregated areas can be seen and compared in Figure 13 and Figure 14.
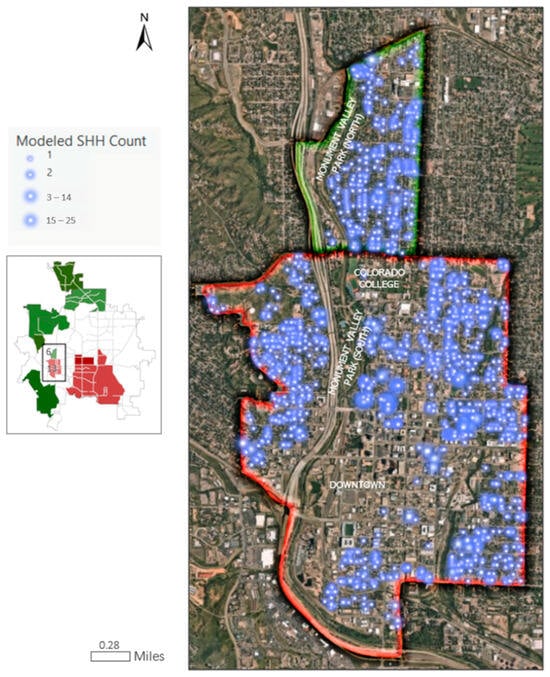
Figure 13.
Comparing landscape and modeled distribution of senior households between sub-area 6 (green, high income) and sub-area 13 (red, low income), both have a lower than average number of SHHs.
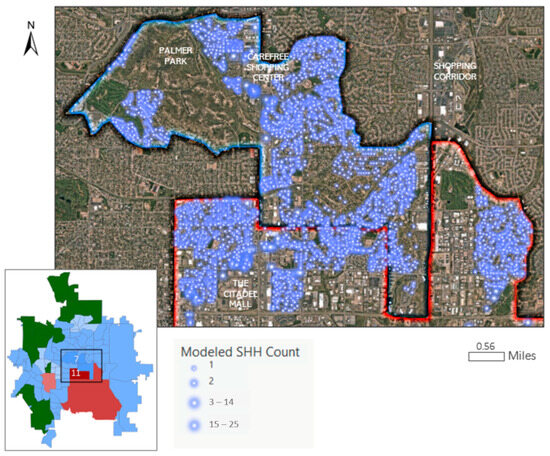
Figure 14.
Comparing the landscape and modeled distribution of senior households between Sub-area 7 (blue, medium income) and Sub-area 11 (red, low income), both have a higher-than-average number of SHHs.
6. Identifying Vulnerability to Access
In this section, we showcase another use of the multivariate clustering technique and the modeled senior household data to identify vulnerable households with limited access to public libraries.
We used multivariate clustering analysis with census tract data to identify access vulnerability. This time, we used three attributes to represent access affordability: the number of senior households reported as homeowners without a vehicle, the number of senior households reported as home renters without a vehicle, and the number of senior households living with food stamps. The result is shown in Figure 15, which depicts two distinctive sub-areas. Compared to the rest of the city, sub-area 2 (shown in red) has a high number of senior household renters without a vehicle and a high number of senior households living with food stamps. This area is the downtown neighborhood of Colorado Springs, which partially overlaps with low-income sub-area 13 identified in the previous analysis on segregation. Senior households in this area are particularly vulnerable to access due to their low affordability, both in terms of financial and transportation mobility.
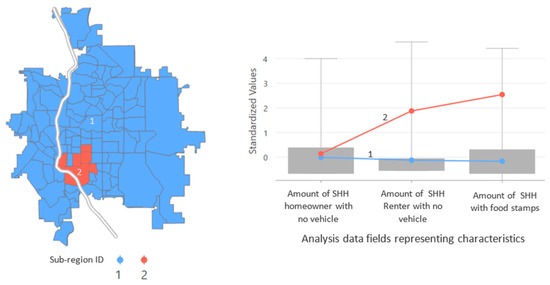
Figure 15.
Identifying the sub-area of low-income renters without vehicles (red).
Transportation networks were constructed to simulate car and bus travel within the city, as discussed in the Methodology and Implementation section. The objective of the analysis is to estimate the time required to travel to the nearest public library from any parcel within the city limits by car and public transit. This will reveal areas with low accessibility. Travel cost surfaces representing the travel time to public libraries covering the city area are derived and presented in Figure 16. Figure 16a shows the cost surface for traveling by bus plus walking to and from the bus stops, and Figure 16b shows that for traveling by car. Access in vulnerable sub-area ID 2, which has many low-income senior household renters without vehicles, is overlaid on these maps. Our results suggest that most residential areas within Colorado Springs are less than 8 min away from a public library by car, except for those in the outer areas that need a maximum of 17 min. However, the time spent traveling by bus is far worse. For many of those who live in vulnerable sub-area ID 2 and are forced to use buses, it can take up to 90 min one way to get to the nearest public library, while it should only take 5 min by car.
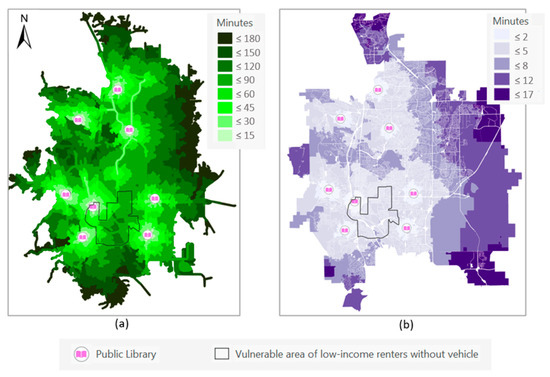
Figure 16.
Time cost surface to travel to the nearest public library (a) by walking and bus and (b) by car.
Figure 17 depicts the locations of senior households that have been modeled, along with their access to the nearest library by the cost of travel time using buses, and the available bus routes within the vulnerable area. These maps have identified four residential areas (marked as 1, 2, 3, and 4 in Figure 17a) where public library access is severely limited. Seniors living in these areas have to spend 90–120 min each way to reach the nearest public library by walking and taking the bus. Public libraries might be the only option for these residents to access free community aging resources, given their low financial affordability. While several buses run across the identified vulnerable area, the route design is limited to serve citizens who are going to the library. As a result, seniors will either have to walk a long distance to the nearest bus stop or switch buses. This suggests that either the bus routes should be modified, additional bus routes should be added, a library location should be added, or mobile library services should be supported to ensure that residents in this area gain more access to nearby libraries.
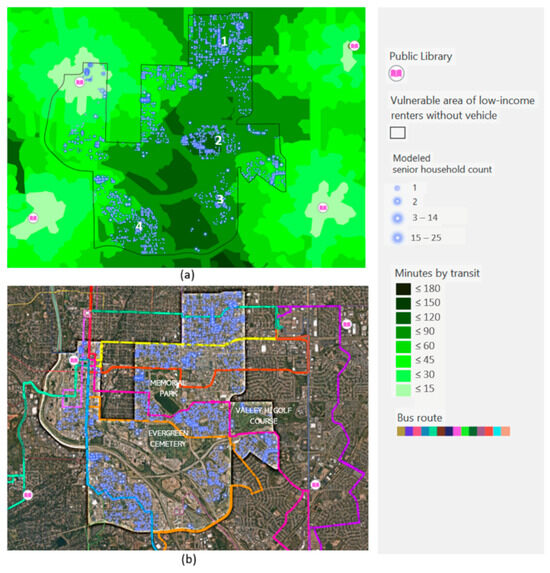
Figure 17.
(a) Senior household distribution and their access to the nearest library by travel time cost using buses in the vulnerable area with a high number of low-income renters without vehicles, and (b) the available bus routes.
7. Conclusions
The study introduces an analytical framework incorporating geospatial analysis and modeling techniques to better understand senior residential living in urban areas. Generating synthetic senior household data for land parcels, coupled with robust data-driven spatial clustering techniques and transportation network modeling, provides valuable insights into senior living from various geographical perspectives, including the spatial distribution of senior households at high spatial resolution, residential spatial segregation based on income, and access vulnerability.
We have applied the analytical framework to research seniors living in Colorado Springs. The findings provided compelling insights into senior living in this area by revealing its spatial distribution of households and their segregation based on income and access vulnerability. We want to emphasize again that our research focus for this paper is not to provide a comprehensive understanding of factors driving spatial segregation and vulnerability in Colorado Springs. Instead, we aim to establish a methodology that utilizes synthetic microdata and strong geospatial analysis techniques in senior research to uncover the spatial distribution and segregation of senior households systematically, using Colorado Springs as a case study. Our research findings indicate that in Colorado Springs, there are significant numbers of affluent senior households in areas with abundant access to nature, green spaces, and resources for active aging. Although these concentrations are predominant in certain areas, there are smaller clusters of senior households spread throughout the city. Our study also supports existing theories on spatial segregation and social inequality with a detailed analysis of income-based neighborhood types and access vulnerabilities. However, to make direct comparisons with other geographic regions, we must apply a synthetic data approach to different cities worldwide. This could be a promising direction for future research to gain deeper insights into the differences in high-resolution spatial distribution and segregation patterns among major cities globally.
One limitation of this work is that the senior household disaggregating model solely focuses on modeling senior household counts and does not consider the socioeconomic status and health characteristics of the distributed senior population. Additionally, our work here has been so far dedicated to developing a robust methodology to reveal senior-related spatial patterns. Given the extensive effort to accomplish this, a thorough analysis of interplaying factors explaining the spatial segregation process for the study area has not been included. We aim to continue this line of work and address this issue in the future.
This study represents the first effort to create synthetic spatial microdata for the elderly population in urban areas. The method presented here can be easily applied to other locations since the necessary input data are publicly available for most U.S. cities and globally. Our synthetic data approach can offer a detailed and reliable estimation of the distribution of senior households in large urban areas like Colorado Springs. Previous studies have been unable to accomplish this for any city due to limitations using small sample surveys or low-resolution administrative sources. Although our model is limited to disaggregating only senior household counts, it can be used as a baseline for future attempts to develop synthetic senior population data with more detailed characteristics. Our work contributes to the body of research methodology in senior studies globally and adds to the literature on spatial segregation and social inequality among seniors, specifically for Colorado Springs.
Applications and continuing development of the synthetic data approach presented here hold promise for future research on urban seniors. Detailed microdata can allow the examination of different types of senior residential neighborhoods beyond basic demographic and socioeconomic indicators. This can be a valuable resource for studies that analyze how local factors and neighborhood effects influence active aging and for simulating individual senior choices and behaviors.
Supplementary Materials
The following supporting information can be downloaded at: https://www.mdpi.com/article/10.3390/urbansci8030081/s1.
Author Contributions
Conceptualization, T.H.D.D., K.A.D. and G.B.-S.; methodology, T.H.D.D.; formal analysis, T.H.D.D. and K.A.D.; visualization, T.H.D.D. and K.A.D.; writing—original draft preparation, T.H.D.D.; writing—review and editing, T.H.D.D. and G.B.-S. All authors have read and agreed to the published version of the manuscript.
Funding
This research received no external funding.
Data Availability Statement
The original contributions presented in the study are included in the article/Supplementary Materials, further inquiries can be directed to the corresponding author.
Acknowledgments
We thank the University of Colorado at Colorado Springs’s Committee for Research and Creative Works (CRCW) for supporting a seed grant that helped initiate our research on aging. We also thank Rae Vigil, Public Works Asset Management, City of Colorado Springs, for providing us with access to the city-owned data, including orthoimages.
Conflicts of Interest
The authors declare no conflict of interest.
Appendix A
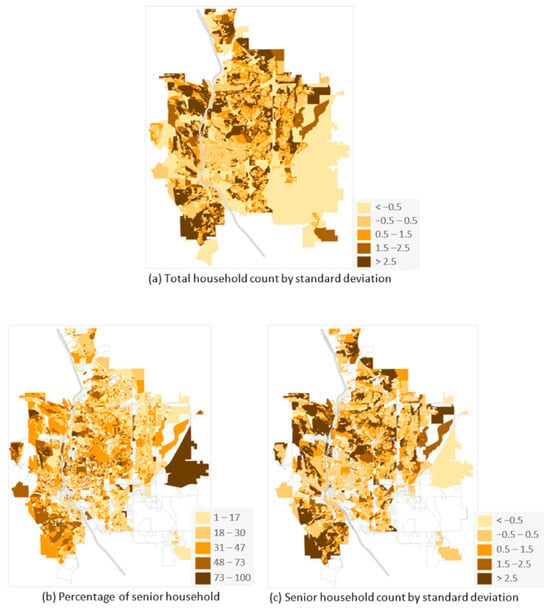
Figure A1.
Distribution of (a) total household count by standard deviation, (b) percentage of senior household, and (c) senior household count by standard deviation.
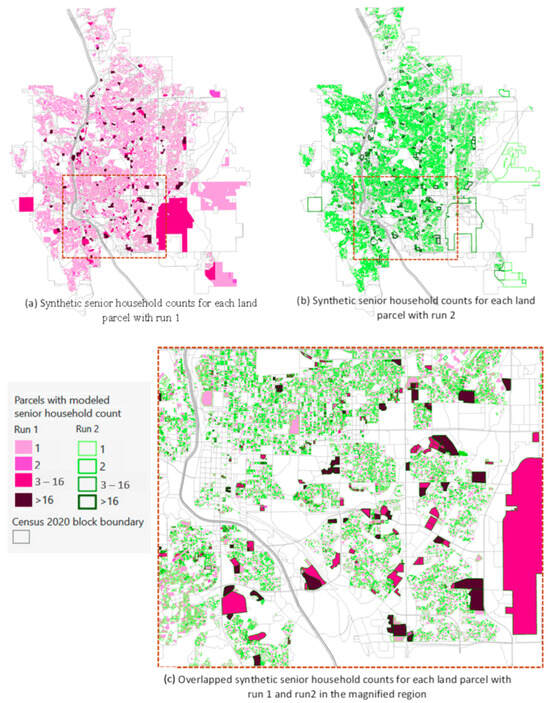
Figure A2.
Results of synthetic senior household counts for each land parcel with (a) run 1, (b) run 2, and (c) overlapping results within the magnified region.
References
- The United States Census Bureau. QuickFacts Colorado Springs City, Colorado. 2024. Available online: https://www.census.gov/quickfacts/fact/table/coloradospringscitycolorado/POP010220#POP010220 (accessed on 31 March 2024).
- Mather, M.; Scommegna, P. Fact Sheet: Aging in the United States. Population Reference Bureau. 2024. Available online: https://www.prb.org/resources/fact-sheet-aging-in-the-united-states/ (accessed on 31 March 2024).
- Herbert, C.; Molinsky, J.H. What Can Be Done to Better Support Older Adults To Age Successfully In Their Homes And Communities? Health Aff. 2019, 38, 860–864. [Google Scholar] [CrossRef] [PubMed]
- Davitt, J.K.; Madigan, E.A.; Rantz, M.; Skemp, L. Aging in Community: Developing a More Holistic Approach to Enhance Older Adults’ Well-Being. Res. Gerontol. Nurs. 2016, 9, 6–13. [Google Scholar] [CrossRef] [PubMed]
- Anetzberger, G.J. Community Resources to Promote Successful Aging. Clin. Geriatr. Med. 2002, 18, 611–625. [Google Scholar] [CrossRef] [PubMed]
- Lipsitz, L. When I’m 84: What Should Life Look Like in Old Age? J. Am. Geriatr. Soc. 2020, 68, 967–969. [Google Scholar] [CrossRef] [PubMed]
- McDonough, K.E.; Davitt, J.K. It Takes a Village: Community Practice, Social Work, and Aging-in-Place. J. Gerontol. Soc. Work. 2011, 54, 528–541. [Google Scholar] [CrossRef] [PubMed]
- Cachadinha, C.; Pedro, J.B.; Fialho, J.C. Social Participation of Community Living Older Persons: Importance, Determinants and Opportunities. 2011. Available online: http://repository.tudelft.nl/islandora/object/uuid%3A43c6504b-4cbe-4f01-8918-0b428cebbfbb?collection=research (accessed on 30 January 2024).
- Austin, C.D.; Camp, E.; Flux, D.; McClelland, R.W.; Sieppert, J.D. Community Development with Seniors in Their Neighborhoods: The Elder Friendly Communities Program. Fam. Soc. J. Contemp. Soc. Serv. 2005, 86, 401–409. [Google Scholar]
- Deng, G.; Mao, L. Spatially Explicit Age Segregation Index and Self-Rated Health of Older Adults in US Cities. ISPRS Int. J. Geo-Inf. 2018, 7, 351. [Google Scholar] [CrossRef]
- van Ham, M.; Tammaru, T.; Ubarevičienė, R.; Janssen, H. (Eds.) Urban Socio-Economic Segregation and Income Inequality: A Global Perspective; The Urban Book Series; Springer: Cham, Switzerland, 2021. [Google Scholar] [CrossRef]
- Préteceille, E. The Evolution of Social Segregation and Urban Inequalities: The Case of the Parisian Metropolis in Recent Decades. Caderno CRH 2003, 38, 27–48. [Google Scholar] [CrossRef]
- Piekut, A. Re-Theorising Spatial Segregation: A European Perspective. In Urban Inequality and Segregation in Europe and China; Pryce, G., Wang, Y.P., Chen, Y., Shan, J., Wei, H., Eds.; The Urban Book Series; Springer: Cham, Switzerland, 2021. [Google Scholar] [CrossRef]
- Gory, M.L.; Ward, R.A.; Mucatel, M. Patterns of Age Segregation. Sociol. Focus 1981, 14, 1–13. [Google Scholar] [CrossRef]
- Briggs, X. Social Capital and Segregation: Race, Connections, and Inequality in America. KSG Faculty Research Working Papers Series RWP02-011. February 2002. Available online: https://ssrn.com/abstract=320243 (accessed on 22 April 2024).
- Golant, M.S. Geographic inequalities in the availability of government-subsidized rental housing for low-income older persons in Florida. Gerontologist 2002, 42, 100–108. [Google Scholar] [CrossRef]
- Checa, J.; Nel·lo, O. Residential Segregation and Living Conditions. An Analysis of Social Inequalities in Catalonia from Four Spatial Perspectives. Urban Sci. 2021, 5, 45. [Google Scholar] [CrossRef]
- Smith, R.; Baik, S.; Lehning, A.; Mattocks, N.; Cheon, J.; Kim, K. Residential Segregation, Social Cohesion, and Aging in Place: Health and Mental Health Inequities. Gerontologist 2022, 62, 1289–1298. [Google Scholar] [CrossRef] [PubMed]
- Rasse, A. Spatial Segregation. In The Wiley Blackwell Encyclopedia of Urban and Regional Studies; John Wiley & Sons: Hoboken, NJ, USA, 2019. [Google Scholar]
- Alegría, T. Segregación Socioespacial Urbana, El ejemplo de Tijuana. Estud. Demográficos Urbanos 1994, 9, 411–428. [Google Scholar] [CrossRef]
- van Ham, M.; Manley, D.; Tammaru, T. Geographies of Socio-Economic Inequality. IFS Deaton Review of Inequalities. 2022. Available online: https://ifs.org.uk/inequality/geographies-of-socio-economic-inequality (accessed on 18 December 2023).
- Tammaru, T.; Knapp, D.; Silm, S.; van Ham, M.; Witlox, F. Spatial Underpinnings of Social Inequalities: A Vicious Circles of Segregation Approach. Soc. Incl. 2021, 9, 65–76. [Google Scholar] [CrossRef]
- Otero, G.; Volker, B.; Rozer, J. Space and Social Capital: Social Contacts in a Segregated City. Urban Geogr. 2021, 43, 1638–1661. [Google Scholar] [CrossRef]
- Liu, Y.; Dijst, M.; Stan Geertman, S. Residential Segregation and Well-being Inequality between Local and Migrant Elderly in Shanghai. Habitat Int. 2014, 42, 175–185. [Google Scholar] [CrossRef]
- Somenahalli, S.; Shipton, M. Examining the Distribution of the Elderly and Accessibility to Essential Services. Procedia-Soc. Behav. Sci. 2013, 104, 942–951. [Google Scholar] [CrossRef]
- Horner, M.W.; Duncan, M.; Wood, B.S.; Valdez-Torres, Y.; Stansbury, C.D. Do Aging Populations Have Differential Accessibility to Activities? Analyzing the Spatial Structure of Social, Professional, and Business Opportunities. Travel Behav. Soc. 2015, 2, 182–191. [Google Scholar] [CrossRef]
- Wen, C.; Albert, C.; von Haaren, C. Equality in Access to Urban Green Spaces: A Case Study in Hannover, Germany, with a Focus on the Elderly Population. Urban For. Urban Green. 2020, 55, 126820. [Google Scholar] [CrossRef]
- Ariga, T.; Matsuhashi, K. Urban Structure and the Number of Seniors with Poor Access to Transit: Spatial Analysis of the Greater Tokyo Region. Urban Reg. Plan. Rev. 2016, 3, 109–122. [Google Scholar] [CrossRef][Green Version]
- Huang, X.; Gong, P.; White, M. Study on Spatial Distribution Equilibrium of Elderly Care Facilities in Downtown Shanghai. Int. J. Environ. Res. Public Health 2022, 19, 7929. [Google Scholar] [CrossRef] [PubMed]
- Gupta, D.D.; Wong, D.W.S. Changing Age Segregation in the U.S.: 1990 to 2010. Res. Aging 2022, 44, 669–681. [Google Scholar] [CrossRef] [PubMed]
- Wong, D.W.S.; Gupta, D.D. Age-race-ethnicity Segregation in the United States: Where Do Minority Older Adults Stand? Popul. Space Place 2023, 29, 4. [Google Scholar] [CrossRef]
- Kelly, G.; Black, R. The Potential Value of a Geographic Information System For Public Service Planning for Older People in the African Region. Int. J. Care Caring 2023, 7, 364–372. [Google Scholar] [CrossRef]
- U.S. News & World Report. Best Places to Live in the U.S. in 2023–2024. 2024. Available online: https://realestate.usnews.com/places/rankings/best-places-to-live (accessed on 22 April 2024).
- Lulle, A. Geographical Gerontology: Perspectives, Concepts, Approaches. Soc. Cult. Geogr. 2019, 20, 1181–1182. [Google Scholar] [CrossRef]
- Graff, T.O.; Wiseman, R. Changing Concentrations of Older Americans. Geogr. Rev. 1978, 68, 379–393. [Google Scholar] [CrossRef]
- McCarthy, K.F. The Elderly Population’s Changing Spatial Distribution: Patterns of Change Since 1960; Rand: Santa Monica, CA, USA, 1983. [Google Scholar]
- Fuguitt, G.V.; Beale, C.L. The Changing Concentration of the Older Nonmetropolitan Population, 1960–1990. J. Gerontol. 1993, 48, S278–S288. [Google Scholar] [CrossRef] [PubMed]
- Caplan, Z.; Rabe, M. Older Population and Aging. United States Census Bureau. Report Number C2020BR-07. 2023. Available online: https://www.census.gov/library/publications/2023/decennial/c2020br-07.html (accessed on 24 April 2024).
- Séguin, A.M.; Apparicio, P.; Riva, M.; Negron-Poblete, P. The Changing Spatial Distribution of Montreal Seniors at the Neighbourhood Level: A Trajectory Analysis. Hous. Stud. 2016, 31, 61–80. [Google Scholar] [CrossRef]
- Channer, N.S.; Hartt, M.; Biglieri, S. Aging-In-Place and The Spatial Distribution of Older Adult Vulnerability in Canada. Appl. Geogr. 2020, 125, 102357. [Google Scholar] [CrossRef]
- Somenahalli, S.V.C.; Shipton, M.D.; Bruce, D. Investigating the Spatial Distribution of the Elderly and its Implications for Service Provision in Adelaide Metropolitan Area. In Proceedings of the 33rd Australasian Transport Research Forum, Canberra, Australia, 29 September–1 October 2010. [Google Scholar]
- Warnes, A.M.; Law, C.M. The Elderly Population of Great Britain: Locational Trends and Policy Implications. Trans. Inst. Br. Geogr. 1984, 37–59. [Google Scholar] [CrossRef]
- Li, Q.; Liu, Y.; Yang, L.; Ge, J.; Chang, X.; Zhang, X. The Impact of Urban Green Space on the Health of Middle-Aged and Older Adults. Front. Public Health 2023, 11, 1244477. [Google Scholar] [CrossRef]
- Shiode, N.; Morita, M.; Shiode, S.; Okunuki, K. Urban and Rural Geographies of Aging: A Local Spatial Correlation Analysis of Aging Population Measures. Urban Geogr. 2014, 35, 608–628. [Google Scholar] [CrossRef]
- Szołtysek, M.; Ogórek, B.; Poniat, R.; Gruber, S. Making a Place for Space: A Demographic Spatial Perspective on Living Arrangements among the Elderly in Historical Europe. Eur. J. Popul. Rev. Eur. De Démographie 2019, 36, 85–117. [Google Scholar] [CrossRef]
- Zhang, K.; Sun, H.; Li, X. Aging Population Spatial Distribution Discrepancy and Impacting Factor. Sustainability 2022, 14, 9528. [Google Scholar] [CrossRef]
- Losada, N.; EAlén, E.; Cotos-Yáñez, T.R.; Domínguez, T. Spatial Heterogeneity in Spain for Senior Travel Behavior. Tour. Manag. 2019, 70, 444–452. [Google Scholar] [CrossRef]
- Zhai, Y.; Li, D.; Wu, C.; Wu, H. Spatial Distribution, Activity Zone Preference, and Activity Intensity of Senior Park Users in a Metropolitan Area. Urban For. Urban Green. 2023, 79, 127761. [Google Scholar] [CrossRef]
- Thomson, C.N.; Hardin, P.J. Remote Sensing/GIS Integration to Identify Potential Low-Income Housing Sites. Cities 2000, 17, 97–109. [Google Scholar] [CrossRef]
- Boulos, M.N.K. Towards Evidence-Based, GIS-Driven National Spatial Health Information Infrastructure and Surveillance Services in The United Kingdom. Int. J. Health Geogr. 2024, 3, 1. [Google Scholar] [CrossRef] [PubMed]
- Logan, J.R. Relying on the Census in Urban Social Science. City Community 2018, 17, 540–549. [Google Scholar] [CrossRef]
- MacDonald, I.H.; Peters, A.H. Urban Policy and the Census; Esri Press: Redlands, CA, USA, 2011. [Google Scholar]
- Campos, F.G.; Barrozo, L.V.; Ruiz, T.; César, C.L.; Barros, M.B.; Carandina, L.; Goldbaum, M. Spatial Distribution of Elderly Individuals in a Medium-Sized City in São Paulo State, Brazil, According to Key Sociodemographic and Morbidity Characteristics. Cad. De Saude Publica 2009, 25, 77–86. [Google Scholar] [CrossRef][Green Version]
- Zacharias, D.; Athanasios, A. Monitoring of the Results through a Survey Concerning the Socioeconomic Characteristics of the Elderly Using Geographic Information Systems (GIS): A Case Study in Greece. Int. J. Innov. Econ. Dev. 2020, 6, 36–45. [Google Scholar] [CrossRef]
- Hermes, K.; Poulsen, M. A Review of Current Methods to Generate Synthetic Spatial Microdata Using Reweighting And Future Directions. Computers. Environ. Urban Syst. 2012, 36, 281–290. [Google Scholar] [CrossRef]
- Wang, F.; Liu, L. Computational Methods and GIS Applications in Social Science, 3rd ed.; C.R.C. Press: Boca Raton, FL, USA, 2023. [Google Scholar]
- UCGIS. Geographic Information Science & Technology Body of Knowledge Visualization and Search. 2024. Available online: https://gistbok-topics.ucgis.org/UCGIS (accessed on 15 December 2023).
- Openshaw, S. Ecological Fallacies and the Analysis of Areal Census Data. Environ. Plan. A 1984, 16, 17–31. [Google Scholar] [CrossRef]
- Openshaw, S. The Modifiable Areal Unit Problem. CATMOG #38; Geo Books: Norwich, UK, 1984. [Google Scholar]
- Omer, I.; Benenson, I. Investigating Fine-Scale Residential Segregation, by Means of Local Spatial Statistics. Geogr. Res. Forum 2002, 12, 41–60. [Google Scholar]
- Omer, I. Evaluating Accessibility Using House-level Data: A Spatial Equity Perspective, Computers. Environ. Urban Syst. 2006, 30, 254–274. [Google Scholar] [CrossRef]
- Lin, Y.; Xiao, N. Generating Small Areal Synthetic Microdata from Public Aggregated Data Using an Optimization Method. Prof. Geogr. 2023, 75, 905–915. [Google Scholar] [CrossRef]
- Pajares, E.; Nieto, R.M.; Meng, L.; Wulfhorst, G. Population Disaggregation on the Building Level Based on Outdated Census Data. ISPRS Int. J. Geo-Inf. 2021, 10, 662. [Google Scholar] [CrossRef]
- Monteiro, J.; Martins, B.; Murrieta-Flores, P.; Pires, J.M. Spatial Disaggregation of Historical Census Data Leveraging Multiple Sources of Ancillary Information. ISPRS Int. J. Geo-Inf. 2019, 8, 327. [Google Scholar] [CrossRef]
- Chapuis, K.; Taillandier, P.; Renaud, M.; Drogoul, A. Gen*: A Generic Toolkit to Generate Spatially Explicit Synthetic Populations. Int. J. Geogr. Inf. Sci. 2018, 32, 1194–1210. [Google Scholar] [CrossRef]
- Wu, S.S.; Qiu, X.; Wang, L. Population Estimation Methods in GIS and Remote Sensing: A Review. GISci. Remote Sens. 2005, 42, 80–96. [Google Scholar] [CrossRef]
- Eicher, C.L.; Brewer, C.A. Dasymetric Mapping and Areal Interpolation: Implementation and Evaluation. Cartogr. Geogr. Inf. Sci. 2001, 28, 125–138. [Google Scholar] [CrossRef]
- Jain, D.; Tiwari, G. Population Disaggregation to Capture Short Trips—Vishakhapatnam, India. Comput. Environ. Urban Syst. 2017, 62, 7–18. [Google Scholar] [CrossRef]
- Wheaton, W.D.; Cajka, J.C.; Chasteen, B.M.; Wagener, D.K.; Cooley, P.C.; Ganapathi, L.; Roberts, D.J.; Allpress, J.L. Synthesized Population Databases: A US Geospatial Database for Agent-Based Models; Methods Report; R.T.I. Press: Research Triangle Park, NC, USA, 2009; Volume 2009, p. 905. [Google Scholar] [CrossRef]
- Zhu, Y.; Ferreira, J. Synthetic Population Generation at Disaggregated Spatial Scales for Land Use and Transportation Microsimulation. Transp. Res. Rec. J. Transp. Res. Board 2014, 2429, 168–177. [Google Scholar] [CrossRef]
- Gallagher, S.; Richardson, L.F.; Ventura, S.L.; Eddy, W.F. SPEW: Synthetic Populations and Ecosystems of the World. J. Comput. Graph. Stat. 2018, 27, 773–784. [Google Scholar] [CrossRef]
- Ester, M.; Kriegel, H.-P.; Sander, J.; Xu, X. A Density-Based Algorithm for Discovering Clusters in Large Spatial Databases with Noise (PDF). In Proceedings of the Second International Conference on Knowledge Discovery and Data Mining (KDD-96), Portland, OR, USA, 2–4 August 1996; Simoudis, E., Han, J., Fayyad, U.M., Eds.; AAAI Press: Menlo Park, CA, USA, 1996; pp. 226–231, ISBN 1-57735-004-9. [Google Scholar]
- ESRI Inc. Density-Based Clustering. ESRI Online Documentation. 2024. Available online: https://pro.arcgis.com/en/pro-app/latest/tool-reference/spatial-statistics/densitybasedclustering.htm (accessed on 21 April 2024).
- ESRI Inc. How Multivariate Clustering Works. ESRI Online Documentation. 2024. Available online: https://pro.arcgis.com/en/pro-app/3.1/tool-reference/spatial-statistics/multivariate-clustering.htm (accessed on 25 May 2024).
- Lloyd, S.P. Least Squares Quantization in PCM. IEEE Trans. Inf. Theory 1982, 28, 129–137. [Google Scholar] [CrossRef]
- Cliff, A.D.; Ord, J.K. Spatial Processes: Models and Applications; Pion Limited: London, UK, 1981. [Google Scholar]
- Jiang, B. Spatial Clustering for Mining Knowledge in Support of Generalization Processes in GIS. In Proceedings of the GIS ICA Workshop on Generalisation and Multiple Representation, Leicester, UK, 20–21 August 2004; pp. 20–21. [Google Scholar]
- Grubesic, H.T.; Wei, R.; Murray, T.A. Spatial Clustering Overview and Comparison: Accuracy, Sensitivity, and Computational Expense. Ann. Assoc. Am. Geogr. 2014, 104, 1134–1156. [Google Scholar] [CrossRef]
- ESRI Inc. What Is a Network Dataset? ESRI Online Documentation. 2024. Available online: https://pro.arcgis.com/en/pro-app/3.1/help/analysis/networks/how-to-create-a-usable-network-dataset.htm (accessed on 25 May 2024).
- Cronkleton, E. What Is the Average Walking Speed of an Adult? Healthline. 2019. Available online: https://www.healthline.com/health/exercise-fitness/average-walking-speed (accessed on 22 April 2024).
- ESRI Inc. Service Area Analysis Layer. ESRI Online Documentation. 2024. Available online: https://pro.arcgis.com/en/pro-app/latest/help/analysis/networks/service-area-analysis-layer.htm (accessed on 22 April 2024).
Disclaimer/Publisher’s Note: The statements, opinions and data contained in all publications are solely those of the individual author(s) and contributor(s) and not of MDPI and/or the editor(s). MDPI and/or the editor(s) disclaim responsibility for any injury to people or property resulting from any ideas, methods, instructions or products referred to in the content. |
© 2024 by the authors. Licensee MDPI, Basel, Switzerland. This article is an open access article distributed under the terms and conditions of the Creative Commons Attribution (CC BY) license (https://creativecommons.org/licenses/by/4.0/).