Abstract
Neighborhood planning models are crucial for ensuring a balanced distribution of urban services. Though the 15-min city model is the most updated neighborhood model, some gaps in the literature on schools and walkability exist. This paper addresses these gaps, especially in developing countries where servicing is challenging. This study focuses on evaluating school services through the lens of the 15-min city model to investigate the socio-spatial distribution of school locations. This research employs a multi-phase approach that integrates qualitative and quantitative methods to develop a methodological framework that was applied to the case study of Nablus. As a result, this study marks the gaps between implementing local schools and measures of the 15-min model in terms of physical, functional, and socioeconomic urban characteristics, including density, diversity, and proximity. It reveals the impact of local neighborhood planning on schools’ efficiency in social sustainability, urban design quality, spatial coherence of schools, and coordination among schools and other services. Potential reforms in planning are provided.
Keywords:
15-min city; neighborhood planning; schools; walkability; spatial distribution; urban planning; GIS 1. Introduction
In developing countries, where resources are limited, the equitable distribution of primary services is increasingly critical [1,2,3]. Most services are unevenly distributed based on existing land use, leading to significant disparities: some areas are underserved, while others are overserved [4,5]. Neighborhood planning models are crucial for ensuring a balanced distribution of services [6,7,8,9]. However, these models are quite complex and still need to be explored, particularly when planners face the challenges of dealing with intricate contexts [10,11,12,13,14,15,16].
The neighborhood concept has been widely used in planning literature and practice, referring to a spatially subdivided area in urban and rural contexts [17]. Neighborhood planning emerged in the early 1900s after the Industrial Revolution to address the rapid urbanization and significant population increase [18]. Clarence Arthur Perry introduced the first diagrammatic representation of the neighborhood unit as a planning tool for metropolitan cities [19]. Grown as a pioneering attempt at New Urbanism [20], the neighborhood unit addressed how the most minor portion of the city, the neighborhood, could standardize livability. The neighborhood unit concept, viewed from morphological and analytical perspectives, focused on planned urban layouts emphasizing accessibility, proximity, and distribution of services around the center that prioritize schools [21].
The model’s spatial arrangement has changed continuously, where qualities of accessibility, proximity, and distribution of services have been iterated from one model to another to accommodate changes in transportation modes, contextual fitting, health and social reforms, and urban growth. Nickolaus Louis Engelhardt introduced further developments to Perry’s neighborhood unit in 1942. Engelhardt reconsidered the maximum walking distance to elementary schools and suggested considering other types of schools [17]. In 1980, Neo-traditional planning was established to address issues arising from suburbanization and car-focused urban planning in American cities [22,23,24,25], which included two models [26]: Traditional Neighborhood Development (TND) by Duany and Plater-Zyberk and Transit-Oriented Development (TOD) by Peter Calthorpe. Afterwards, came Doug Farr’s model, which integrated high-performance buildings and infrastructure with walkable, transit-oriented urbanism to create a sustainable environment [27]. The model prioritized the connection of human size to the urban-built environment in natural systems [28]. The “15-min city” was introduced by Professor Carlos Moreno in 2016 [29], proposing a framework where six decentralized social services, including schools, are located within 15 min in neighborhoods [30]. While many of the model’s principles stem from new urbanism [31], it is argued that it prioritizes walkability and cycling, in contrast to previous neighborhood planning models [32]. The time-space relationship had transitioned from a 5 min (in quarter-mile models) to a 10 min (in Neo-traditional) walk model to the recent latest upgrade of introducing a 15-min model. The incremental increase is logically justified to cope with population expansion and the associated urban growth in today’s urbanism. The denser a neighborhood is, the more service sizes and types it requires; therefore, the larger the responsive urban intervention becomes [33]. The 15-min city model emerged from setting a core intervention on the unhealthy current mobility means and mass production of automobiles [34]. Moreno suggested neighborhood planning that stimulated people-based cities [34] to substitute current mobility means with active mobility modes [35]. The 15-min model maximized user experience through walkability [36] while maximizing social coherence [37,38,39] and incorporating renewable energies and automated waste management [40,41].
The 15-min city model is based on four principles and six social functions [29]. The principles of proximity, density, diversity, and digitalization are complementary to the value of the city, and all of them are essential for the making of cities. A study in selected neighborhoods in Naples was conducted to address these principles using physical aspects, functional aspects, and socio-economic aspects [42]. Speaking about schools, the basis of Perry’s model, some research papers suggest that schools, including their playgrounds, can be potential mixed-use amenities that increase their activity period and usage for maintaining the model [29]. In Paris, where the concept originated [34], the ‘children’s streets’ initiative involves using parking plots of private cars in areas near schools for seasonal activities [43].
However, gaps in the literature exist among the studies that were conducted. The 15-min city planning model has yet to specify any particular learning typology in the literature. While learning services are crucial for all age groups, especially vulnerable populations that require social inclusion [34], the model still needs to identify distinctions in tackling these classifications. Until now, the literature on the 15-min model lacks regulating categories of schools under the model [44], walking distance measures relevant to age and gender [45], and does not address walkability in uneven terrains. Although schools are recognized as essential services [46], the 15-min city planning model acknowledges a fair distribution and an equal value of all service types. This explains why no literature shows the impact of the 15-min planning model on setting specific innovative plans for schools. Consequently, this paper aims to fill this gap, particularly in the context of developing countries where service delivery is often most challenging. By investigating the socio-spatial distribution of school locations, this research seeks to identify key deficiencies and offer recommendations for improvement.
2. Materials and Methods
Building on the development of neighborhood service models and the spatial planning of schools discussed in the literature, this paper introduces an assessment model for school services based on the 15-min city urban characteristics and principles. This model aims to investigate the socio-spatial distribution of school locations. The research methodology employed a multi-phase approach, incorporating both quantitative data (from secondary resources, literature, and maps) and qualitative data (through semi-structured interviews, surveys, and field observations). This comprehensive process progresses from data collection to analysis, ultimately leading to the results.
2.1. Data Collection
This research aims to investigate the socio-spatial distribution of school locations by collecting data from multiple sources, as shown in Figure 1. The research process started with semi-structured interviews with officials. Next, essential geospatial data were gathered from official local sources to establish a foundation for spatial analysis. Demographic data were obtained to enhance the spatial base with dynamic social information. Finally, extensive surveys and observations were conducted to validate the data and add detailed attributes, ensuring a comprehensive analysis.
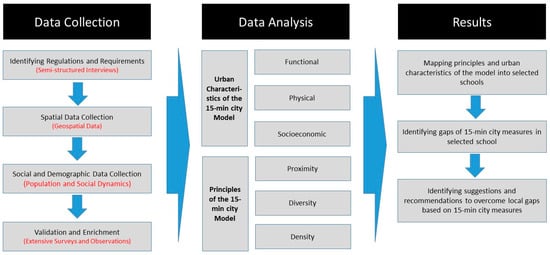
Figure 1.
Research methodology.
The initial phase involved conducting semi-structured interviews with key officials to explore the regulation of school locations and their spatial distribution. Interviews were conducted with the ex-mayor of Nablus and employees at the Directorate of Education. The discussions covered criteria for site selection, involved parties, spatial requirements, and funding for current and future school constructions in Nablus.
Subsequently, geospatial data were gathered from the Palestinian Ministry of Local Government Geospatial Portal (GeoMOLG), Palestine’s primary source of geospatial information. These data included the locations of schools, nearby gardens, clinics, the number of floors in buildings, slopes, and the quality of roads. The collected data were processed using ArcGIS software (version 10.7) and served as the foundation for the analysis.
Demographic data, such as age, gender, education, refugee status, family type, and family size, were obtained from the Palestinian Central Bureau of Statistics [47]. This demographic information was then integrated into the geospatial data attributes to enrich the analysis.
An extensive survey and observational study were then conducted to enhance the geospatial data with more detailed attributes. Data about school type were verified by direct contact. Validation also included documenting and updating physical and functional urban characteristics. Urban attributes associated with mobility, roads, topographical context, and commuting activity were investigated to cover the physical urban aspects of the 15-min city. This includes details like sidewalks, their type and quality, staircases, ramps, signage, existing road conditions, and accessibility and equity measures. This study also identified physical obstacles like street cracks, sewage, slopes, street finishing conditions, and other details affecting the safety and adequacy of walkability and accessibility. This process is related primarily to the investigation of the urban characteristics of the 15-min city model, highlighted in Figure 1. The mentioned detailed attributes assess the quality of the physical aspects of the 15-min city model and identify key factors for the inclusiveness of the addressed methods.
Other observational studies supported the investigation of proximity, one of the principles of the model. Walkability measurements were conducted using random sampling based on observations at school locations, encompassing various categories of students and groups, totaling approximately 30 individuals. This sample validates the data and adds a social dimension to the spatial information. This has tackled assessing local walkability by observing walking patterns, timings, shortcuts, and traffic. Actual speeds were also compared to age group speed literature. The collection of these data emphasizes the physical and subjective influences on walkability, which develops an understanding of the current mobility practice. The results of the local walkability study generated the service area needed for further spatial analysis used for comparisons and evaluations. Addressing these relevant data contributed to the research model formation and application success.
Table 1 classifies the methods used to measure each urban characteristic and each theoretical principle used for the assessment. Under each characteristic and principle, associated sub-measures are listed, followed by an assignment of the source for obtaining each. The classification of methods, as illustrated, assisted in establishing an organized process for conducting this study.

Table 1.
Data collection methods and key parameters.
2.2. Data Analysis
Data analysis involved mapping and analyzing the principles and urban characteristics of the 15-min city model, as shown in Figure 1. This process began by studying the urban characteristics of the 15-min city model, focusing on schools’ physical, functional, and socioeconomic features. Functional aspects include school distribution and type; physical aspects include mobility networks, parking areas, road types, and associated infrastructure attributes; and socioeconomic aspects include demographic data [42].
After analyzing the model’s urban characteristics, the model’s principles were assessed, including examining school proximity, diversity, and density data.
Proximity refers to the walking distance and time from and to schools. All locations hosting fundamental human interactions and liveability requirements should be close and accessible from each household [34].
Density is about integrating an optimal denser user rate in the spatial distribution of services [34], respecting the diverse needs of the local community. Density would enlarge the potential for investments, integration of businesses, and promotion of local services and employment opportunities [30].
Diversity consists of mixed-use, diverse bases of residential, commercial, recreational, educational, medical, and communal services [29]. The access network to these services includes diverse urban design interventions to maintain proper proximity considerations. Those interventions can also embrace the diversity of cultures, age groups, and genders of people to maintain social cohesion and inclusion [34].
Digitalization offers a technological network chain to facilitate accessibility routes to services. One application of the transferred information system is obtaining urban safety in the urban built model [29].
The analysis of this research study was divided into two parts: visual and numeric. Quantitative mapping of each urban characteristic and theoretical principle was conducted using ArcMap software. Buffer areas were visualized using the buffer (analysis) tool, and density was mapped using the kernel density tool. Differences in visual representation were controlled via the Symbology tab. These visual data, which included the mapping of the 15-min model’s principles and characteristics, helped identify graphical gaps in planning implementations. Geographical information on the location, quality, and quantity of schools, parks, clinics, streets and road networks, parking areas, slopes, and contours was collected and analyzed using GIS mappings. Service areas for schools were generated through GIS by specifying the distance radius and the center of the service area.
Numeric values associated with built-up densities of neighborhoods were processed spatially using GIS. This involved specifying buildings and their population data. Projections were calculated to account for recent changes, using an estimated growth rate of 2.56%. The formulas used were as follows: Estimated Growth = (Rate of annual growth × Original figure × Number of years gap) and Projection = Estimated Growth + Original figure. A raster map was produced to indicate how density changes from one area to another. Numeric values related to walkability observations were analyzed using the Euclidean distance model [48,49,50,51], comparing the calculated walkability distances of different age and gender groups to address gaps in the model’s walkability measures.
The paper establishes a connection between the two dimensions of urban characteristics of the 15-min city and the principles of the theoretical framework, despite their separate offerings. Building upon existing data collection and analysis, this paper develops an investigatory, tangible methodological framework model, as Figure 1 explains.
3. Results
3.1. Case Study
The proposed methodology was applied to the city of Nablus, Palestine. This city does not have organized urban planning and mainly depends on topography and jurisdiction to expand spontaneously [52]. Kendall (a British planner) established the first master plan for Nablus in 1947 [53]. Subsequent master plans lacked neighborhood planning, especially in service allocation [54] and other associated urban attributes such as visibility, walkability, etc. [55]. The city’s latest approved master urban plan was established in 2013 but was not updated to meet the needs of population growth and urbanization [52].
The location of schools is set by several measures, including closeness to green or sports areas, privacy and segregation, accessibility through walkability, and accessibility from main and local streets [56,57]. However, on a practical scale, the planning of schools is constrained by the capability of funding and land ownership. Thus, existing schools’ location and spatial measures do not necessarily coincide with local planning regulations. This paper investigates the impact of the existing planning on the servicing of schools.
Four neighborhoods—Al-Andalus, Al-Mohandeseen, Al-Taiba, and Nablus Al-Jadeedah (Figure 2)—were selected to investigate the spatial qualities of their schools within 15 min of active mobility. Cycling was excluded as the local citizens rarely rely on it for accessibility; hence, the paper focused on commuting by walking.
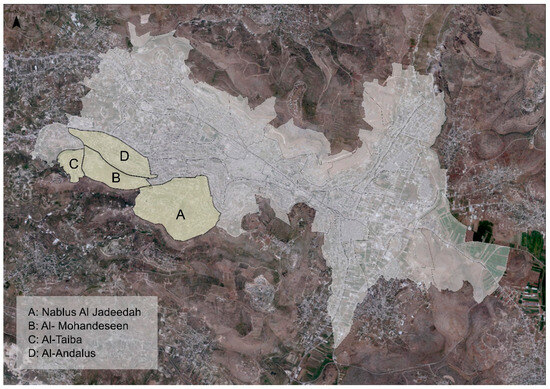
Figure 2.
Location of selected neighborhoods in Nablus.
The selection basis of the research areas includes neighborhood groups with different built-up densities and residential typologies, indicating different economic states of high- and middle-income residents. The municipality officially adopts those neighborhoods, and their boundaries are verified by the PCBS (set for local council election). This study targets students of three age groups: kindergarten students (ages 0 to 4), primary students (grades 1st to 9th)—ages (5 to 15), and secondary students (grades 10th to 12th)—ages (16 to 19). This study considers these different school levels to develop a holistic social investigation. The significant differences in the walkability measures of these groups allow for an in-depth analysis of how inclusive the 15-min city concept is.
The following section presents the application and the analysis of the assessment model’s measures. Gaps in the assessment are presented in the discussion.
3.2. Investigating Learning Urban Characteristics
Al-Andalus has 16 schools, Nablus Al-Jadeedah has 4, Al-Mohandeseen has 2, and Al-Taiba has none. Figure 3 indicates the schools’ closeness, density, and geographical distribution in the selected neighborhoods. Table 2 provides information on the names, administrative types, and targeted students’ gender and age groups of each school. The highest targeted school type is kindergarten, and the highest targeted student’s gender is mixed. Most of the schools are governmental, and most private schools are kindergartens.
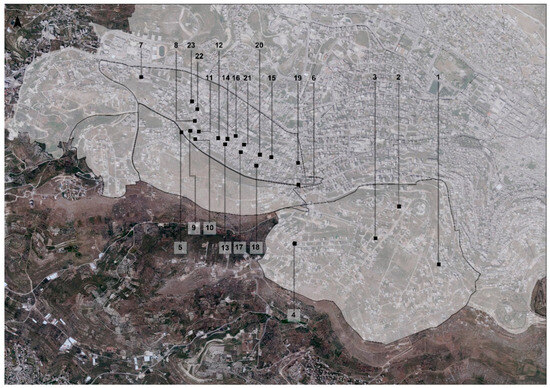
Figure 3.
Location of schools in selected neighborhoods.

Table 2.
Detailed description of schools.
3.3. Investigating Physical Urban Characteristics:
Investigating the physical urban characteristics of the research areas emphasizes the correlation between walkability and accessibility. Some physical attributes interfering with accessibility are covered: road condition and type, availability of sidewalks, stairs, ramps, crosswalks, topographic levels, etc. Walkability, convenience, walking speed, and urban infrastructure change depending on the concentration of these attributes. These aspects indicated the general evaluation level of walkability and the influence of the built infrastructure on the activeness of students walking to the assigned schools.
Table 3 provides the studied physical urban characteristics. It compares the 23 schools and summarizes the spatial and validation results of the surrounding road infrastructure, the needed services, and the accessibility condition of each school. Figure 4 illustrates the location of schools and road conditions in the neighborhoods based on the collected spatial data. Figure 5 illustrates the road types in the study area.

Table 3.
Walkability and physical urban characteristics of the selected schools.
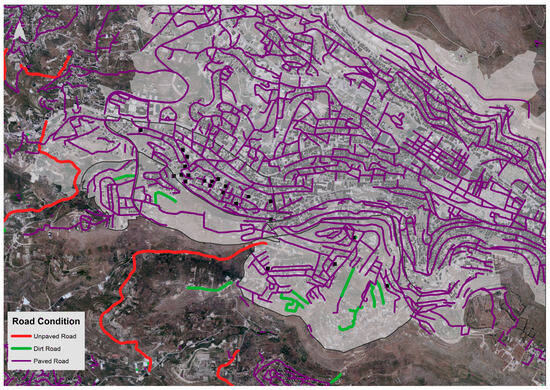
Figure 4.
Road conditions in selected neighborhoods.
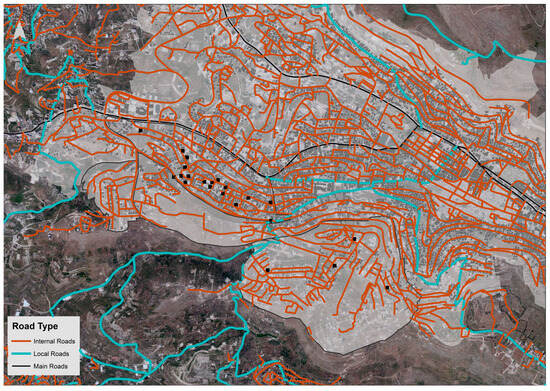
Figure 5.
Road types in selected neighborhoods.
All schools are accessed from internal and paved roads, indicating good infrastructure and accessibility. The slope and contour maps in Figure 6 show variations in the neighborhoods’ topographic heights. Three schools, among sixteen in Al-Andalus neighborhoods, lie within the high slope values; two schools are within the mild slope, and the remaining eleven are within the low slope. On the other hand, three schools in the Al-Jadeedah neighborhood lie at mild slope levels, and only one school is at low slope levels. The two schools of Al-Mohandeseen lie on high slopes. Table 3 specifies schools with challenging slopes around, which indicate the challenges in accessibility.
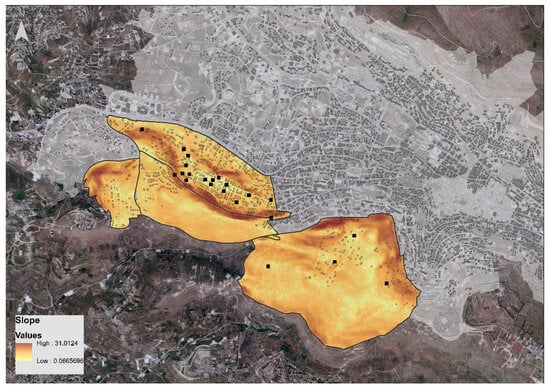
Figure 6.
Schools within the slope values of the selected neighborhoods.
3.4. Socioeconomic Investigation
Table 4 provides the socioeconomic data for each neighborhood in ascending order of five-year age gap: (0–4), (5–9), (10–14), etc. The Al-Andalus neighborhood has the highest population among other neighborhoods, and Al-Taiba has the least. Generally, all neighborhoods include more males than females, except for the Al-Taiba neighborhood. For the age category, kindergarten students score the highest among the other student categories in all neighborhoods, except for Al-Taiba, where ages (15–19) score the highest. Regarding educational status, the Al-Andalus neighborhood has the highest number of educated residents, while Al-Taiba has the least. Generally, the number of non-refugees exceeds the number of refugees across all neighborhoods. Most families in all neighborhoods are four, except in Al-Taiba, where most families are six.

Table 4.
Data on the selected neighborhood population (PCBS, 2017).
The walkability of these social groups may differ based on the location of housing and the closeness to schools.
3.5. Proximity Investigation
Results of local walkability observations found that kindergarten students usually walk with a guardian, who would rather drive to the school and walk from parking within a maximum distance of 100 m. Male students walked faster than female students in both individual and group patterns. Both male and female students tended to walk slower in groups than individually. Secondary school students walk faster than primary school students for both male and female students. Government school students tended to walk more than private school students.
These results obtained from observations of local walkability patterns are compared with the literature on walkability, presented in Table 5. Several researchers tackled the average speed of different age groups, which the paper aimed to verify. In the literature, 1.15 m per second was set as children’s speed mean [58], 1.30 m per second for ages (5 to 15) [59], and 1.36 m per second for young adults (16 to 19). Such a base puts the walking distance at 1015 m in 15 min for ages 0 to 4, 1170 m in 15 min for ages 5 to 15, and 1230 m in 15 min for ages 16 to 19. The comparison of local walkable (distance/15 mins) to that in the literature brought out two statements. First, the walkability of local secondary school students is higher than that assigned in the literature. However, it remains the same for primary school students.

Table 5.
Results of local walkability.
The local average walkable distance (m/15 min) was used as a service buffer area centered from each corresponding school. The calculated buffer area is used for the visual study of servicing in the sub-section of (E. Diversity investigation), where the service area of schools took into account the variation in walking distance associated with age groups and gender, together with speed alteration caused by the topographic nature of the city. This process aimed to develop a service buffer area related to local walkability patterns.
3.6. Diversity Investigation
3.6.1. Gender
Figure 7 displays a map showing male and female schools. Seven male schools’ service areas are shown (four in the Al-Andalus neighborhood, four in Nablus Al-Jadeedah, and two in Al-Mohandeseen). These schools’ service areas are spread across the four neighborhoods. The map indicates that male schools are mainly in the northwest.
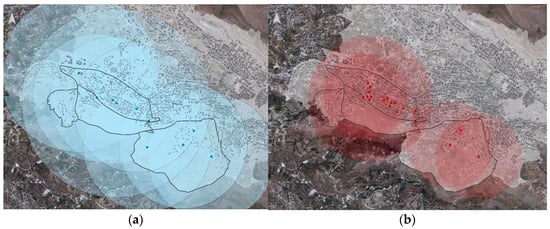
Figure 7.
Service area for school types by gender in selected neighborhoods: (a) male and (b) female.
The service areas of nineteen female schools are also spread across the same neighborhoods. The map indicates that most female schools are located northwest of the study area. This may suggest that female walkability is highly practiced there. Due to the ratio of female schools to male schools, the frequency of female walkability may be higher than that of males in this neighborhood.
According to the population pyramid table, Al-Andalus has the highest male and female populations. Therefore, it was expected to have the neighborhood with the most responsive schools, which indicates the skewness of school attractiveness.
3.6.2. Age Group
For children aged 0–4, Figure 8a shows ten kindergartens in Al-Andalus, two in Al-Mohandeseen, and two in Nablus Al-Jadeedah. These schools only cover a limited area of 100 m, which aligns with this age group’s walkability. According to the population pyramid table, Nablus Al-Jadeedah has the second-highest number of children aged 0–4 after Al-Andalus. Hence, the need for kindergartens in this area matches the distribution hierarchy.

Figure 8.
Service area for different school types by age category in selected neighborhoods: (a) kindergarten, (b) primary, and (c) secondary.
For children aged 5–15, Figure 8b shows that primary schools are distributed across all four neighborhoods. There are six primary schools in Al-Andalus, two in Nablus Al-Jadeedah, and one in Al-Mohandeseen. The schools in Al-Andalus are more attractive to students, resulting in a skew towards the northwest.
For those aged 16–19, Figure 8c shows that the service area of secondary schools needs to be completely covered in Nablus Al-Jadeedah. The three secondary schools in the four neighborhoods are located in Al-Andalus, where the highest number of residents aged 16–19 live.
3.7. Density Investigation
Population and built-up density refer to service allocation. Investigating density assists in assessing the quantity of services suitable for the population size.
Figure 9 indicates that the density in Al-Andalus is higher than in other neighborhoods due to the higher number of built-up areas and residents compared to neighborhood size. More schools are located in the densest neighborhoods, which matches the local planning reality of distributing more services according to population size. Still, this can only be generalized to some schools in other neighborhoods. Density can increase diversity in demographics, opting for more diversity in educational status, family size, family type, etc. However, in the local context, it may not result in diverse, responsive services.
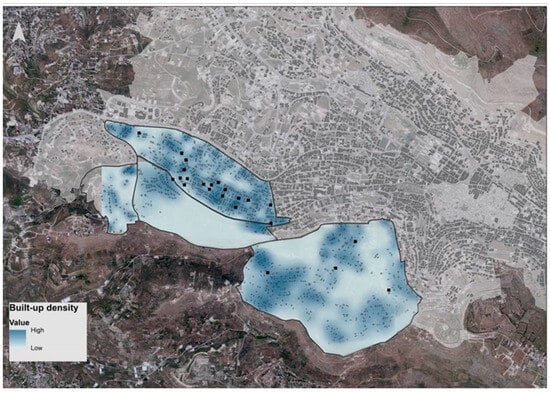
Figure 9.
Built-up densities within selected neighborhoods.
4. Discussion
After conducting school assessments using the developed methodological framework, this part discusses the gaps in measures in existing local schools.
4.1. Gaps to Physical Urban Characteristics and Functional Urban Characteristics
Most investigated parameters show that the school service area covers the four neighborhoods. However, expanding the servicing boundaries from one neighborhood to another could be more practical for several reasons. One is the gap between physical characteristics and the school’s required urban design. Schools lack urban security, which is evident from the lack of identification signs, speed limit signs, speed bumps, and crosswalks, which distort patterns of accessibility. The ease of moving from one neighborhood to another fills this gap.
Compared to other neighborhoods, Al-Andalus has more schools, greenery, healthcare facilities, and residents of all ages and genders, meeting the principles of proximity, diversity, and density of the 15-min city. However, the school district requires road transformation to create a walkable and people-based area that respects physical urban characteristics. This will lead to better holistic learning services and a better layout for diverse gender types and age categories. Local students’ social connections can be enhanced through walkable, sustainable, and safe boulevards.
4.2. Gaps to Socioeconomic Urban Characteristics, Density, and Diversity
Spatial analysis shows no connection between the distribution of schools and other services or densities in the neighborhoods. Some land parcels with the same density have more schools than others, often indicating over-servicing in some areas. The number of schools assigned to neighborhoods based on population (on planning) and land ownership (on practice) needs to be more cohesive with the size and boundary of the neighborhood; otherwise, it leads to an unequal and sometimes insufficient number of schools per neighborhood. This occurred in the Nablus Al-Jadeedah neighborhood, where the service area of secondary schools (16–19 age groups) is weak.
Though diversity exists in schools’ age and gender categories, students lack space for fundamental hybrid interactions, social sustainability, and daily after-school activities. The paper acknowledges diversity in demographics but excludes diversity in learning services. The latter can become part of future investigations.
4.3. Gaps to Accessibility, Proximity, and Distribution
Although the analysis showed that the service area of selected neighborhoods has 15-min accessibility, it does not necessarily mean that the schools are sufficient for residents of each neighborhood. Local schools welcome students from other neighborhoods, and it is unknown if the students residing near the schools have priority over others. This ratio can vary from one school to another. Similarly, the 15-min planning model does not specify if schools are only for residents of those neighborhoods or if residents of other neighborhoods are allowed, as long as the accessibility to both is within 15 min. This is a particular shortcoming of the 15-min model in Palestine. To address this, a policy on the registration of students in schools can be implemented. Students residing in the same neighborhood as the schools might have priority in registering. This creates an indirect restructuring of the walkability culture.
Regarding walkability, the 15-min measuring model analyzed the empirical case and developed visual outputs of each measure. However, walkability in the local context is a dynamic input to the model. Local walkability usually relies on habits and physical infrastructure. Given the irregular building arrangements in existing neighborhoods, it is challenging to predict the commuting patterns or the adequate means of mobility and accessibility from each house to each school. It must be noted that walking to a place can differ based on habits, subjective preferences, and physical factors influencing walkability and convenience. Moreover, walkability is initially a culture that society lacks, and the topographic nature and the city’s physical infrastructure have an impact on increasing it.
Comfort, which can be depicted based on the provision of greenery and shading devices, is another aspect that affects the flow and tendency of walkability. Safety is an aspect that is considered, especially for elders and kids. Though not controlled, climate only affects the physical environments around buildings; it restricts walkability, especially for those of long distances. These issues can be studied extensively under future research on walkability to ensure a 15-min walk to schools in different circumstances. Operating a well-studied road transformation with tactical urbanism and constructing a walkability guide for residents during different timings, days, and seasons is paramount.
It took much work to detect the spatial organization of schools, particularly the spatial relation of school location to the neighborhood boundaries. This impacts proximity to schools in some areas and raises issues in the local service distribution, especially the link of other services to the schools.
5. Conclusions
This study addressed significant gaps in the literature on school services within the 15-min city planning model, mainly focusing on the unique challenges faced in developing countries where service provision often needs to catch up to urban growth. By creating a comprehensive assessment framework, this research evaluated the socio-spatial distribution of school services, highlighting how current neighborhood planning practices fall short of supporting efficient, accessible, and equitable education infrastructure. The findings reveal that inadequate planning leads to a random distribution of schools, negatively affecting their walkability and overall accessibility, consequently impacting social sustainability, urban design quality, spatial coherence, and coordination with other urban services.
This study’s analysis demonstrated stark contrasts between neighborhoods, illustrating how Al-Taiba’s lack of schools is somewhat mitigated by the presence of schools in adjacent neighborhoods, enabling reasonable access despite local deficiencies. Conversely, Al-Andalus, with a higher number of schools, still needs to improve due to the poor condition of physical infrastructure, which prevents optimal service delivery and undermines the potential benefits of a high school density. These examples underscore the importance of not just the number of schools but also the quality and connectivity of the supporting infrastructure that allows these schools to function effectively within the community.
From these findings, it is clear that improving school service efficiency requires more than just increasing the number of schools; it necessitates strategic spatial neighborhood planning and targeted infrastructure enhancements. Practice recommendations include redistributing schools to match neighborhood needs better, which involves relocating schools from overserved areas to underserved ones and reorganizing schools based on specific criteria such as age groups or gender to serve the population better. Additionally, infrastructure improvements, such as safe walking paths, adequate lighting, and accessible public transport links, are critical for making schools more accessible and aligning with the 15-min city concept. Furthermore, schools could be repurposed as multifunctional community hubs that provide after-school programs, support services, and job opportunities, thereby enhancing their role in promoting social sustainability and community engagement.
This study also suggests that planning reforms should consider the adaptation of underutilized public buildings and open spaces for educational purposes, thereby extending the utility of existing infrastructure and addressing service gaps without the need for extensive new construction. For instance, neighborhoods like Nablus Al-Jadeedah, which are currently underserved, could greatly benefit from these adaptive strategies, which would provide immediate solutions and stimulate the development of supportive public infrastructure such as playgrounds, parks, and community centers. These changes would help create a more cohesive urban fabric where educational facilities are integrated into residents’ daily lives, contributing to the overall goals of the 15-min city.
To ensure the effectiveness of these strategies, it is vital to incorporate regular assessments and updates of neighborhood planning models. This includes using local, sustainable neighborhood assessment tools, such as the NSA models [60], to continuously evaluate walkability, accessibility, and the broader social, environmental, and physical attributes of school services within the urban context. These periodic reviews will help urban planners and policymakers adapt to changing conditions, such as population growth, shifts in demographic needs, and evolving urban landscapes, thereby ensuring that the planning of school services remains relevant and practical.
For future research, there is a need to explore innovative architectural and urban design paradigms that further integrate the principles of the 15-min city into the spatial planning of schools [61]. This could include investigating new forms of school designs that are more flexible, sustainable, and capable of adapting to various urban settings. Expanding this study to other cities within Palestine and beyond would also provide valuable insights into how different urban contexts influence the effectiveness of the 15-min city model in school service provision. Moreover, exploring the integration of digital technologies, such as GIS mapping and real-time data analytics, could enhance the precision and adaptability of planning tools used to optimize school locations and service delivery.
While the developed assessment model is a powerful tool for improving school service distribution within the 15-min city framework, its success is inherently linked to broader external factors. These include land ownership complexities, existing infrastructure conditions, financial and institutional capacities, and the dynamic nature of urban environments. Therefore, a one-size-fits-all approach is unlikely to succeed; each neighborhood must be treated uniquely, with solutions tailored to its specific characteristics and needs. By conducting regular reviews and adjustments of planning strategies, aligning them with sustainable neighborhood assessment models, and preparing for potential expansions in response to population growth, urban planners can better support the evolution of cities into more livable, accessible, and sustainable communities.
Author Contributions
Conceptualization, D.E. and Z.Z.; methodology, D.E., Z.Z., and S.Q.; software, D.E.; validation, D.E., Z.Z., S.Q., and I.S.; formal analysis, D.E.; investigation, D.E.; resources, D.E.; data curation, D.E. and Z.Z.; writing—original draft preparation, D.E. and Z.Z.; writing—review and editing, D.E., Z.Z., S.Q., and I.S.; visualization, D.E.; supervision, Z.Z. and I.S.; project administration, D.E. and Z.Z. All authors have read and agreed to the published version of the manuscript.
Funding
This research received no external funding.
Data Availability Statement
The data used in this research are presented in this paper.
Conflicts of Interest
The authors declare no conflicts of interest.
References
- van Rensburg, H.C. South Africa’s protracted struggle for equal distribution and equitable access—Still not there. Hum. Resour. Health 2014, 12, 26. Available online: http://www.human-resources-health.com/content/12/1/26%0AREVIEW (accessed on 1 July 2024). [CrossRef]
- Fianu, S.; Davis, L.B. A Markov decision process model for equitable distribution of supplies under uncertainty. Eur. J. Oper. Res. 2018, 264, 1101–1115. [Google Scholar] [CrossRef]
- Dinsa, G.D.; Dessie, E.; Hurlburt, S.; Gebreyohannes, Y.; Arsenault, C.; Yakob, B.; Girma, T.; Berman, P.; Kruk, M.E. Equitable Distribution of Poor Quality of Care? Equity in Quality of Reproductive Health Services in Ethiopia. Health Syst. Reform 2022, 8, e2062808. [Google Scholar] [CrossRef] [PubMed]
- Qanazi, S.; Hijazi, I.H.; Shahrour, I.; El Meouche, R. Exploring Urban Service Location Suitability: Mapping Social Behavior Dynamics with Space Syntax Theory. Land 2024, 13, 609. [Google Scholar] [CrossRef]
- Qanazi, S.; Hijazi, I.H.; Shahrour, I.; El Meouche, R. Investigating the Spatial Suitability of the Location of Urban Services Using Space Syntax Theory. Lect. Notes Netw. Syst. 2024, 906, 86–98. [Google Scholar] [CrossRef]
- Bibri, S.E.; Krogstie, J.; Kärrholm, M. Compact city planning and development: Emerging practices and strategies for achieving the goals of sustainability. Dev. Built Environ. 2020, 4, 100021. [Google Scholar] [CrossRef]
- Mouratidis, K.; Yiannakou, A. What makes cities livable? Determinants of neighborhood satisfaction and neighborhood happiness in different contexts. Land Use Policy 2022, 112, 105855. [Google Scholar] [CrossRef]
- Zeng, J.; Cui, X.; Chen, W.; Yao, X. Impact of urban expansion on the supply-demand balance of ecosystem services: An analysis of prefecture-level cities in China. Environ. Impact Assess. Rev. 2023, 99, 107003. [Google Scholar] [CrossRef]
- Mlcek, S.; Ismay, D. Balanced management in the delivery of community services through information and neighbourhood centres. Third Sect. Rev. 2015, 21, 31–50. Available online: https://search.informit.org/doi/abs/10.3316/ielapa.343260726934291 (accessed on 26 July 2024).
- Rohe, W.M. From Local to Global: One Hundred Years of Neighborhood Planning. J. Am. Plan. Assoc. 2009, 75, 209–230. [Google Scholar] [CrossRef]
- Hijazi, I.H.; Krauth, T.; Donaubauer, A.; Kolbe, T. 3dcitydb4bim: A System Architecture for Linking Bim Server and 3d Citydb for Bim-Gis-Integration. ISPRS Ann. Photogramm. Remote Sens. Spat. Inf. Sci. 2020, 4, 195–202. [Google Scholar] [CrossRef]
- Sirianni, C. Neighborhood Planning as Collaborative Democratic Design. J. Am. Plan. Assoc. 2007, 73, 373–387. [Google Scholar] [CrossRef]
- Rosen, G.; Avni, N. Negotiating Urban Redevelopment: Exploring the Neighborhood Council Planning Model. J. Plan. Educ. Res. 2019, 43, 416–427. [Google Scholar] [CrossRef]
- Qanazi, S.; Hijazi, I.; Toma, A.; Abujayyab, S.; Dehbi, Y.; Zabadae, S.; Li, X. COVID-19 severity and urban factors: Investigation and recommendations based on machine learning techniques. Palest. Med. Pharm. J. 2022, 7, 14. [Google Scholar] [CrossRef]
- Albrecht, F.; Moser, J.; Hijazi, I. Assessing façade visibility in 3D city models for city marketing. Int. Arch. Photogramm. Remote Sens. Spat. Inf. Sci. 2013, 40, 1–5. [Google Scholar] [CrossRef]
- Park, Y.; Rogers, G.O. Neighborhood Planning Theory, Guidelines, and Research. J. Plan. Lit. 2014, 30, 18–36. [Google Scholar] [CrossRef]
- Singhal, M. Neighborhood Unit and its Conceptualization in the Contemporary Urban Context. India J. 2011, 8, 81–87. [Google Scholar]
- Asfour, O.S.; Zourob, N. The neighbourhood unit adequacy: An analysis of the case of Gaza, Palestine. Cities 2017, 69, 1–11. [Google Scholar] [CrossRef]
- Shaikh, H.; Mahalle, S.; Sahu, S. Towards creating an Ideal Neighbourhood. Int. Res. J. Eng. Technol. 2019, 6, 6979–6982. Available online: www.irjet.net (accessed on 1 July 2024).
- Mehaffy, M.W.; Porta, S.; Romice, O. The ‘neighborhood unit’ on trial: A case study in the impacts of urban morphology. J. Urban. Int. Res. Placemaking Urban Sustain. 2015, 8, 199–217. [Google Scholar] [CrossRef]
- Perry, C. The Neighborhood Unit: A Scheme of Arrangement for the Family Life Community; Arno Press: New York, NY, USA, 1929; Available online: https://books.google.ps/books/about/The_Neighborhood_Unit_a_Scheme_of_Arrang.html?id=JhptGwAACAAJ&redir_esc=y (accessed on 9 March 2024).
- Basiago, A.D. The search for the sustainable city in 20th century urban planning. Environmentalist 1996, 16, 135–155. [Google Scholar] [CrossRef]
- Gillette, H. Civitas by Design: Building Better Communities, from the Garden City to the New Urbanism; University of Pennsylvania Press: Philadelphia, PA, USA, 2010; Available online: https://www.researchgate.net/publication/287053648_Civitas_by_design_Building_better_communities_from_the_Garden_City_to_the_New_Urbanism (accessed on 11 March 2024).
- Nasar, J.L. Does neotraditional development build community? J. Plan. Educ. Res. 2003, 23, 58–68. [Google Scholar] [CrossRef]
- Silver, C. New Urbanism and Planning History: Back to the Future. In Culture, Urbanism and Planning; Routledge: London, UK, 2006; pp. 179–193. [Google Scholar] [CrossRef]
- Furuseth, O.J. Neotraditional planning: A new strategy for building neighborhoods? Land. Use Policy 1997, 14, 201–213. [Google Scholar] [CrossRef]
- Farr, D. Sustainable Urbanism: Urban Design with Nature; Wiley and Sons: New York, NY, USA, 2007; Available online: https://www.wiley.com/en-us/Sustainable+Urbanism%3A+Urban+Design+With+Nature-p-9780471777519 (accessed on 11 March 2024).
- Farr, D. Sustainable Urbanism: Urban Design with Nature; Case Western Reserve University: Cleveland, OH, USA, 2009; Available online: https://www.youtube.com/watch?v=uSjurs4ZnlM (accessed on 1 April 2023).
- Allam, Z.; Moreno, C.; Chabaud, D.; Pratlong, F. Proximity-Based Planning and the ‘15-Minute City’: A Sustainable Model for the City of the Future. In The Palgrave Handbook of Global Sustainability; Springer International Publishing: Berlin/Heidelberg, Germany, 2021; pp. 1–20. [Google Scholar] [CrossRef]
- Allam, Z.; Bibri, S.E.; Chabaud, D.; Moreno, C. The ‘15-Minute City’ concept can shape a net-zero urban future. Humanit. Soc. Sci. Commun. 2022, 9, 126. [Google Scholar] [CrossRef]
- Yeung, P. How ‘15-Minute Cities’ Will Change the Way We Socialise. BBC. Available online: https://www.bbc.com/worklife/article/20201214-how-15-minute-cities-will-change-the-way-we-socialise (accessed on 10 May 2023).
- Allam, Z.; Nieuwenhuijsen, M.; Chabaud, D.; Moreno, C. The 15-minute city offers a new framework for sustainability, liveability, and health. Lancet Planet. Health 2022, 6, e181–e183. [Google Scholar] [CrossRef]
- Duany, A.; Defining, S.R. “Defining 15-Minute City”, Public Square CNU. Available online: https://www.cnu.org/publicsquare/2021/02/08/defining-15-minute-city (accessed on 1 April 2023).
- Moreno, C.; Allam, Z.; Chabaud, D.; Gall, C.; Pratlong, F. Introducing the ‘15-Minute City’: Sustainability, Resilience and Place Identity in Future Post-Pandemic Cities. Smart Cities 2021, 4, 93–111. [Google Scholar] [CrossRef]
- Abdelfattah, L.; Deponte, D.; Fossa, G. The 15-minute city: Interpreting the model to bring out urban resiliencies. Transp. Res. Procedia 2022, 60, 330–337. [Google Scholar] [CrossRef]
- Bibri, S.E. Data-driven smart sustainable cities of the future: Urban computing and intelligence for strategic, short-term, and joined-up planning. Comput. Urban. Sci. 2021, 1, 8. [Google Scholar] [CrossRef]
- Allam, Z.; Jones, D.S. Climate Change and Economic Resilience through Urban and Cultural Heritage: The Case of Emerging Small Island Developing States Economies. Economies 2019, 7, 62. [Google Scholar] [CrossRef]
- Culture, Z.A.O. Technology and Global Cities. In Cities and the Digital Revolution; Palgrave Pivot: London, UK, 2020; pp. 107–124. [Google Scholar] [CrossRef]
- Bibri, S.E.; Krogstie, J. Smart sustainable cities of the future: An extensive interdisciplinary literature review. Sustain. Cities Soc. 2017, 31, 183–212. [Google Scholar] [CrossRef]
- Bibri, S.E. Big Data Analytics and Context-Aware Computing: Characteristics, Commonalities, Differences, Applications, and Challenges. In Smart Sustainable Cities of the Future; Springer: Berlin/Heidelberg, Germany, 2018; pp. 481–533. [Google Scholar] [CrossRef]
- Allam, Z. Sustainability and Resilience in Megacities through Energy Diversification, Land Fragmentation and Fiscal Mechanisms. Sustain. Cities Soc. 2020, 53, 101841. [Google Scholar] [CrossRef]
- Gaglione, F.; Gargiulo, C.; Zucaro, F.; Cottrill, C. Urban accessibility in a 15-minute city: A measure in the city of Naples, Italy. Transp. Res. Procedia 2022, 60, 378–385. [Google Scholar] [CrossRef]
- Antunes, M.; Barroca, J.; Oliveria, D. 12 Trends Shaping the Future of Cities. Deloitte Insights. Available online: https://www2.deloitte.com/xe/en/insights/industry/public-sector/future-of-cities.html (accessed on 1 April 2023).
- Steuteville, R. The Once and Future Neighborhood|CNU. Available online: https://www.cnu.org/publicsquare/2019/01/29/once-and-future-neighborhood (accessed on 2 April 2024).
- Trudeau, D. New urbanism as sustainable development? Geogr. Compass 2013, 7, 435–448. [Google Scholar] [CrossRef]
- Clarke, R. Conversations: Does the 15-Minute City Work for Children and Caregivers? Cities4Children. Available online: https://cities4children.org/blog/conversations-does-the-15-minute-city-work-for-children-and-caregivers/ (accessed on 1 February 2023).
- Palestinian Central Bureau of Statistics. Available online: https://www.pcbs.gov.ps/site/1/default.aspx (accessed on 5 October 2023).
- Bramson, A.; Okamoto, K.; Hori, M. Comparing Methods for Measuring Walkability. Complex. Syst. 2021, 30, 539–565. [Google Scholar] [CrossRef]
- Qureshi, S.; Memon, I.A.; Aftab, M.; Talpur, H. Association between Objectively Measured Neighbourhood Built Environment and Walkability. Mehran Univ. Res. J. Eng. Technol. 2022, 41, 157–168. [Google Scholar] [CrossRef]
- Gori, S.; Nigro, M.; Petrelli, M. Walkability Indicators for Pedestrian-Friendly Design. Transp. Res. Rec. 2014, 2464, 38–45. [Google Scholar] [CrossRef]
- Rattan, A.; Campese, A.; Eden, C. Modelling Walkability; Esri ArcUser: CA, USA, 2012; pp. 30–33. Available online: http://www.esri.com/news/arcuser/0112/files/walkability.pdf (accessed on 1 July 2024).
- Tomorrow’s Nablus|Tomorrow’s Cities. Available online: https://tomorrowscities.org/tomorrows-nablus (accessed on 18 July 2024).
- Crookston, M. Echoes of Empire: British Mandate planning in Palestine and its influence in the West Bank today. Plan. Perspect. 2017, 32, 87–98. [Google Scholar] [CrossRef]
- Moghayer, T.J.T.; Daget, Y.T.; Wang, X. Challenges of urban planning in Palestine. IOP Conf. Ser. Earth Environ. Sci. 2017, 81, 012152. [Google Scholar] [CrossRef]
- Enab, D. Overlooking the Visibility of Mosques: From a Norm to a Harm on Developed Urbanism in Nablus City. In Proceedings of the International Conference of Contemporary Affairs in Architecture and Urbanism-ICCAUA, Alanya, Turkey, 23–24 May 2024; Volume 7, pp. 180–193. [Google Scholar] [CrossRef]
- Ministry of Local Government (MoLG). Standards and Guidelines Handbook for Urban Planning in Palestine; The General Administration of Organization and Urban Planning: Ramallah, Palestine, 2021. [Google Scholar]
- Ministry of Education (MoE). Guidelines for Schools Design: Future Schools in Palestine; NORAD: Ramallah, Palestine, 1998. [Google Scholar]
- Makalew, F.P.; Adisasmita, S.A.; Wunas, S.; Aly, S.H. Influence of elementary students walking speed to children pedestrian pathway planning. IOP Conf. Ser. Earth Environ. Sci. 2020, 419, 012096. [Google Scholar] [CrossRef]
- Cox, M. How Long Does It Take a Child to Walk a Mile?—Mission Momplex. Available online: https://missionmomplex.com/how-long-does-it-take-a-child-to-walk-a-mile/ (accessed on 26 July 2024).
- Enab, D.; Zawawi, Z.; Monna, S. Sustainable Urban Design Model for Residential Neighborhoods Utilizing Sustainability Assessment-Based Approach. Urban Sci. 2024, 8, 33. [Google Scholar] [CrossRef]
- Enab, D.; Zawawi, Z.; Mounajjed, N. Exploring an Architectural Paradigm for the 15-minute city planning model: Towards reforming gaps of services in Nablus. Najah Univ. J. Res. A (Nat. Sci.) 2024, 38, 67–76. [Google Scholar] [CrossRef]
Disclaimer/Publisher’s Note: The statements, opinions and data contained in all publications are solely those of the individual author(s) and contributor(s) and not of MDPI and/or the editor(s). MDPI and/or the editor(s) disclaim responsibility for any injury to people or property resulting from any ideas, methods, instructions or products referred to in the content. |
© 2024 by the authors. Licensee MDPI, Basel, Switzerland. This article is an open access article distributed under the terms and conditions of the Creative Commons Attribution (CC BY) license (https://creativecommons.org/licenses/by/4.0/).
