Fractal Analysis of Air Pollution Time Series in Urban Areas in Astana, Republic of Kazakhstan
Abstract
1. Introduction
- To apply the method of air pollution time series fractal analysis for the Hurst exponent calculation and long-memory identification to further study the Hurst indicator behavior research in dynamics.
- To analyze the change in the level of pollution of harmful substances in Astana considering weather conditions and the location of potential sources of pollution by coal combustion products during the heating season.
2. Materials and Methods
2.1. Literature Review
2.2. Experimental Methods and Area of Study
2.3. R/S Analysis Method
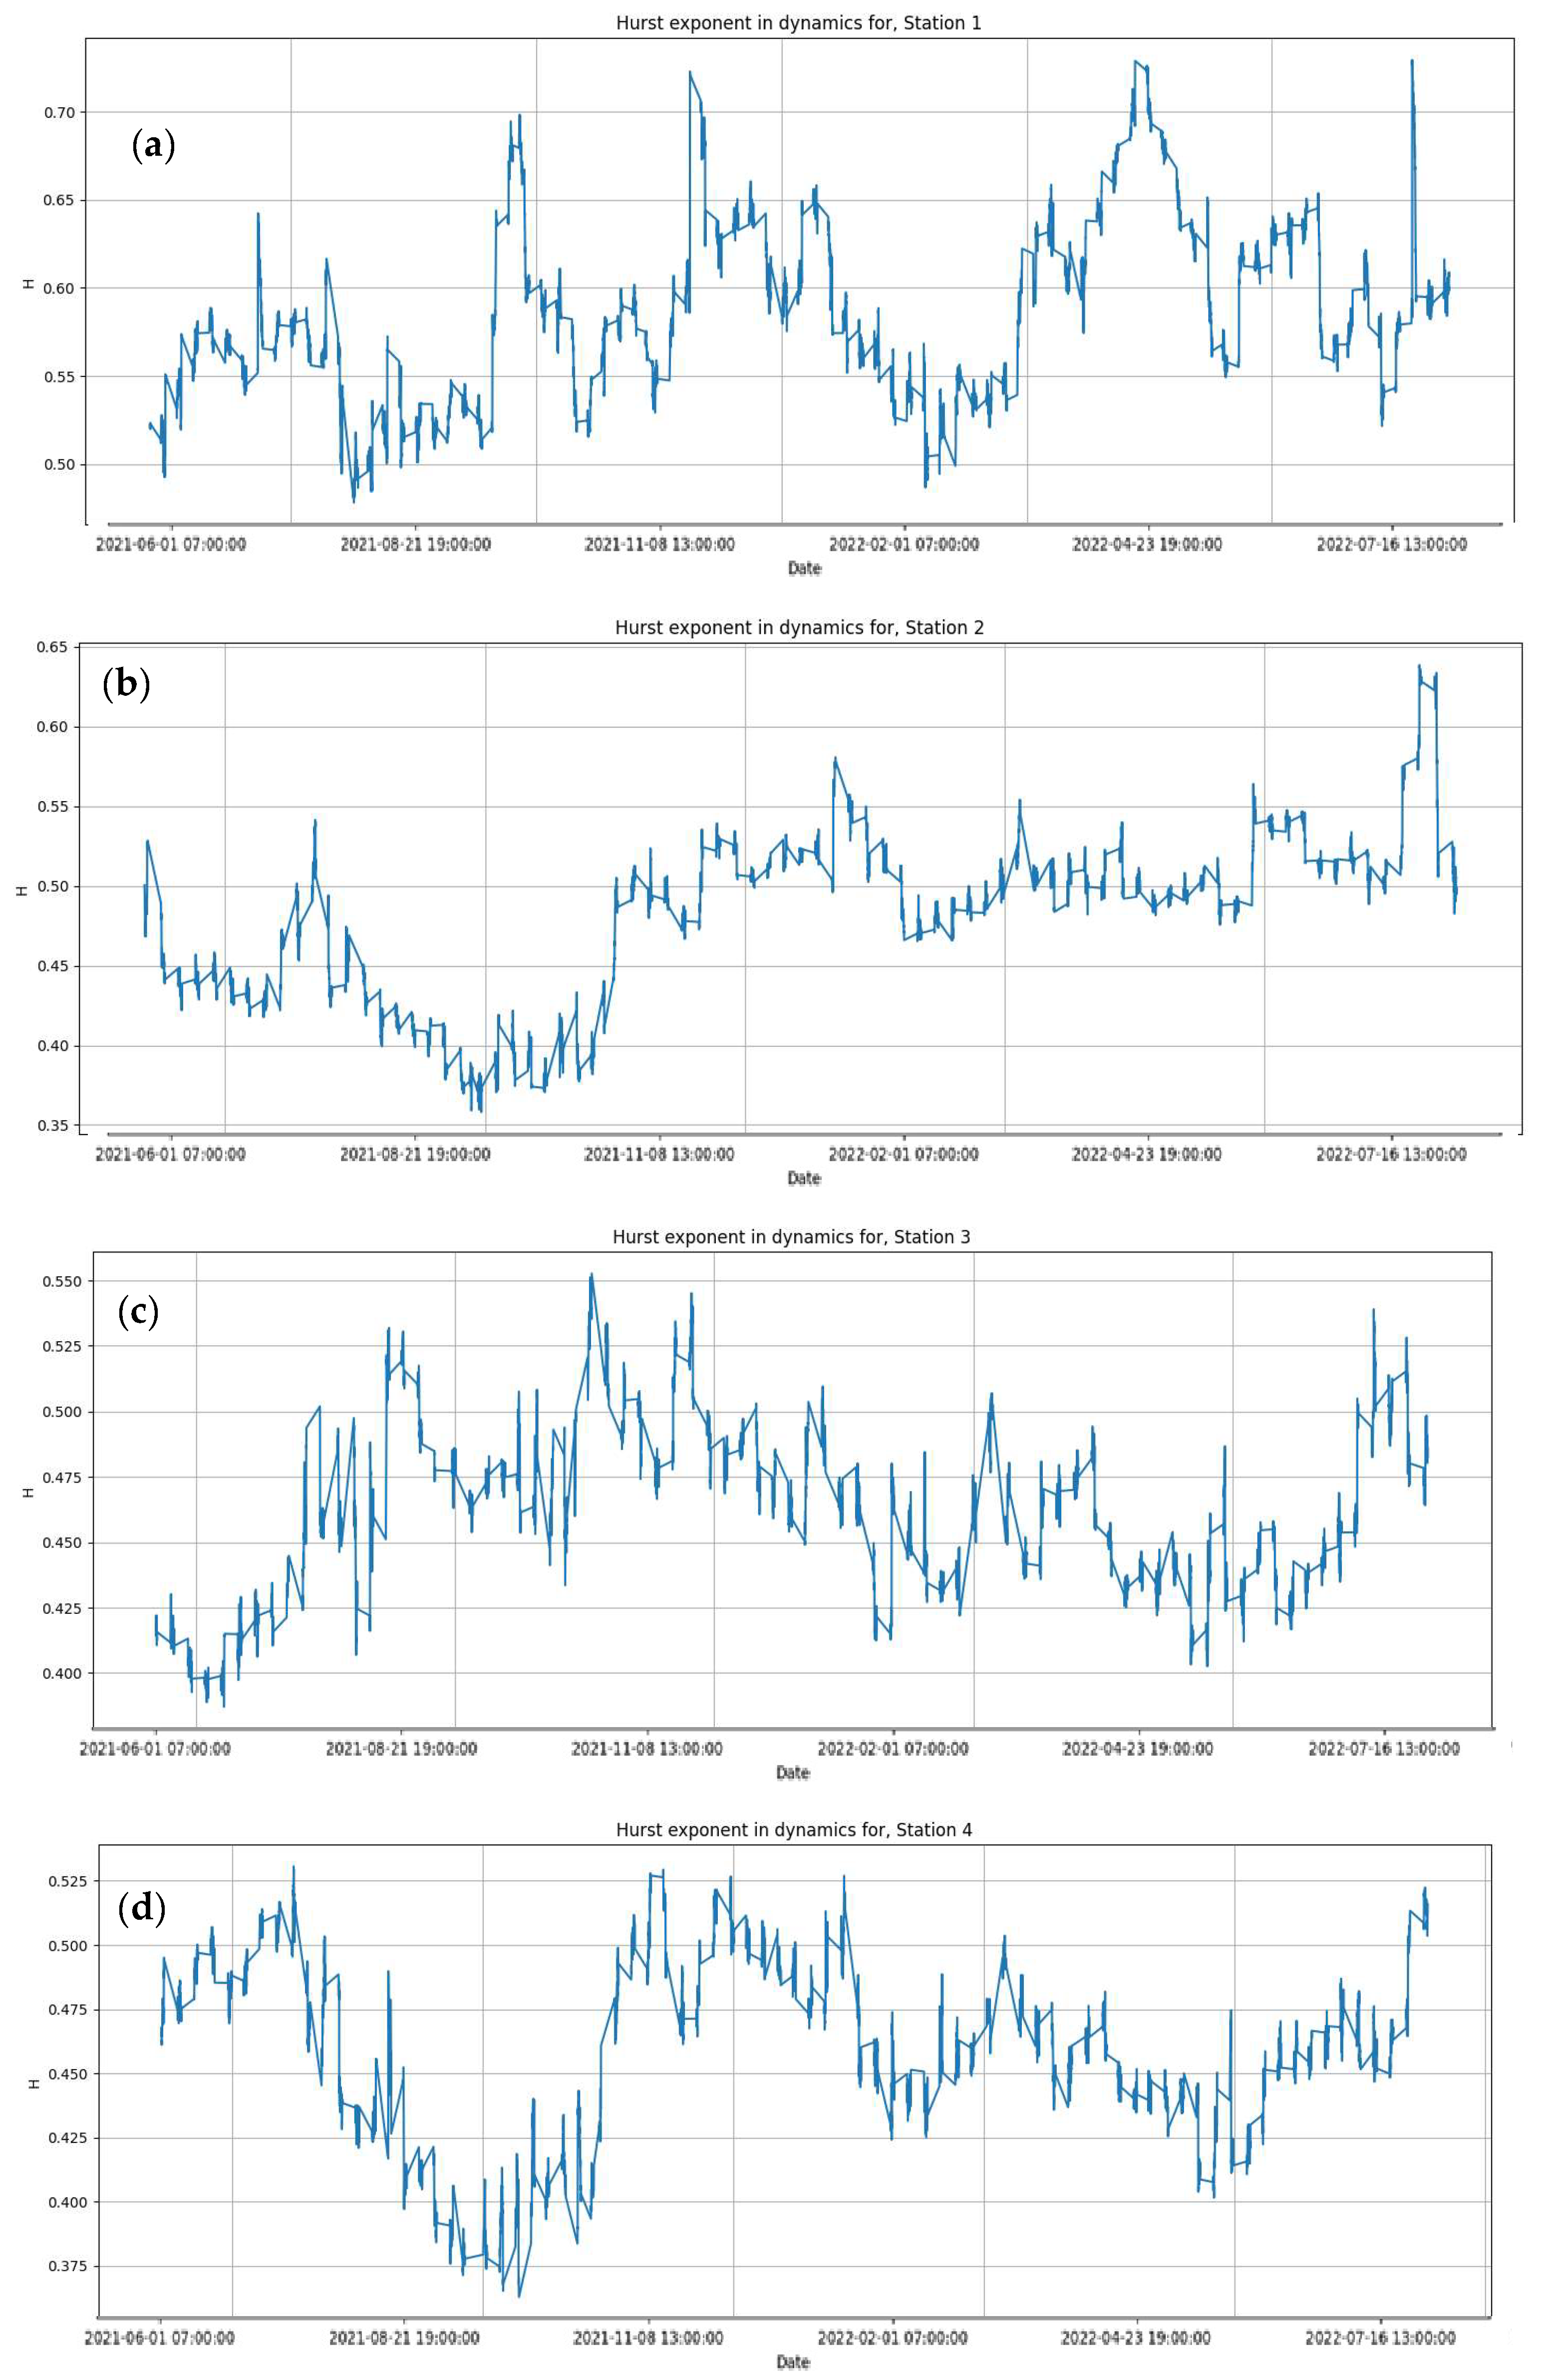
- If the Hurst index is a time series , then this may indicate the presence of long-term memory or persistent character in the series. In the context of environmental pollution, this may mean that high levels of pollution tend to remain at high levels for a long time or to recover again after periods of decrease. The tendency to change the level of pollution remains. If we talk about forecasting, the higher the value of the Hurst indicator, the more likely it is that the current trend will continue in the future . At the same time, the theoretical value of the threshold for identifying the boundary between random and persistent series is determined by the number of levels of the series , which are analyzed according to the formula [28,29]:
- 2.
- If the value of the Hurst index is , then the time series is random. In the context of time series of environmental pollution parameters, this may mean that the pollution level in a certain area is very unstable and is associated with emissions of pollutants abnormally in various concentrations, which is not regulated. On the other hand, it means a state of emergency or an accident, if before that the series had a clearly defined tendency to rise or fall. If , then the time series is ergodic. In the context of environmental pollution, this may mean that pollution tends to decrease temporarily after certain peaks or high values.
3. Results
3.1. Collection of Data
3.2. The Results of Fractal Analysis of Air Pollution Time Series in the City of Astan
4. Discussion
5. Conclusions
Supplementary Materials
Author Contributions
Funding
Data Availability Statement
Acknowledgments
Conflicts of Interest
References
- WHO. Air Pollution. 2024. Available online: https://www.who.int/health-topics/air-pollution#tab=tab_1 (accessed on 2 July 2024).
- Romanello, M.; Di Napoli, C.; Drummond, P.; Green, C.; Kennard, H.; Lampard, P.; Scamman, D.; Arnell, N.; Ayeb-Karlsson, S.; Ford, L.B.; et al. The 2022 report of the Lancet Countdown on health and climate change: Health at the mercy of fossil fuels. Lancet 2022, 400, 1619–1654. [Google Scholar] [CrossRef] [PubMed]
- Manisalidis, I.; Stavropoulou, E.; Stavropoulos, A.; Bezirtzoglou, E. Environmental and health impacts of air pollution: A review. Front. Public Health 2020, 8, 14. [Google Scholar] [CrossRef]
- GBD 2017 Diet Collaborators. Health effects of dietary risks in 195 countries, 1990–2017: A systematic analysis for the Global Burden of Disease Study 2017. Lancet 2019, 393, 1958–1972. [Google Scholar] [CrossRef] [PubMed]
- Pereira, F.; Nadeau, K. Climate Change, Fossil-Fuel Pollution, and Children’s Health. N. Z. J. Med. 2022, 386, 2303–2314. [Google Scholar] [CrossRef]
- ISO 37120:2018; Sustainable Cities and Communities? Indicators for City Services and Quality of Life. International Organization for Standardization (ISO): Geneva, Switzerland, 2018. Available online: https://www.iso.org/standard/68498.html (accessed on 2 July 2024).
- Wesz, J.G.B.; Miron, L.I.G.; Delsante, I.; Tzortzopoulos, P. Urban Quality of Life: A Systematic Literature Review. Urban Sci. 2023, 7, 56. [Google Scholar] [CrossRef]
- To, T.; Zhu, J.; Terebessy, E.; Zhang, K.; Fong, I.; Pinault, L.; Jerrett, M.; Robichaud, A.; Menard, R.; van Donkelaar, A.; et al. Does exposure to air pollution increase the risk of acute care in young children with asthma? An Ontario, Canada study. Environ. Res. 2021, 199, 111302. [Google Scholar] [CrossRef]
- Bureau of National Statistics of Agency for Strategic Planning and Reforms of the Republic of Kazakhstan. Astana City. Summary of the Socio-Economic Development of the Region. 2018. Available online: https://stat.gov.kz/en/region/astana/ (accessed on 2 July 2024).
- Global Wind Atlas. 2018. Available online: https://globalwindatlas.info/en (accessed on 2 July 2024).
- Kerimray, A.; Bakdolotov, A.; Sarbassov, Y.; Inglezakis, V.; Poulopoulos, S. Air pollution in Astana: Analysis of Recent Trends and Air Quality Monitoring System. Mater. Today Proc. 2018, 5, 22749–22758. [Google Scholar] [CrossRef]
- IQAir. Air Quality in Astana. Available online: https://www.iqair.com/us/kazakhstan/astana (accessed on 2 July 2024).
- IQAir. New WHO Air Quality Guidelines Will Save Lives. Available online: https://www.iqair.com/us/newsroom/2021-WHOair-quality-guidelines (accessed on 2 July 2024).
- The World Bank. Strengthening Public Finance for Inclusive and Resilient Growth. Public Finance Review. 2023. Available online: https://thedocs.worldbank.org/en/doc/90dbef81d187b403bbb2a9acc2f460d8-0080062024/original/Kazakhstan-PFR-full-Report-January-2024-en.pdf (accessed on 2 July 2024).
- Biloshchytskyi, A.; Kuchanskyi, O.; Andrashko, Y.; Yedilkhan, D.; Neftissov, A.; Biloshchytska, S.; Amirgaliyev, B.; Vatskel, V. Reducing Outdoor Air Pollutants through a Moss-Based Biotechnological Purification Filter in Kazakhstan. Urban Sci. 2023, 7, 104. [Google Scholar] [CrossRef]
- Biloshchytskyi, A.; Kuchansky, A.; Andrashko, Y.; Neftissov, A.; Vatskel, V.; Yedilkhan, D.; Herych, M. Building a model for choosing a strategy for reducing air pollution based on data predictive analysis. East.-Eur. J. Enterp. Technol. 2022, 117, 23–30. [Google Scholar] [CrossRef]
- He, Y.; Kuchansky, A.; Paliy, S.; Shabala, Y. Problems in Air Quality Monitoring and Assessment. In Proceedings of the 2021 IEEE International Conference on Smart Information Systems and Technologies (SIST), Nur-Sultan, Kazakhstan, 28–30 April 2021; pp. 28–30. [Google Scholar] [CrossRef]
- Bozkus, S.K.; Kahyaoglu, H.; Mahamane Lawali, A.M. Multifractal analysis of atmospheric carbon emissions and OECD industrial production index. Int. J. Clim. Chang. Strateg. Manag. 2020, 12, 411–430. [Google Scholar] [CrossRef]
- Wang, Q.; Zhao, T.; Wang, R.; Zhang, L. Backward Trajectory and Multifractal Analysis of Air Pollution in Zhengzhou Region of China. Math. Probl. Eng. 2022, 2022, 2226565. [Google Scholar] [CrossRef]
- Liu, X.; Hadiatullah, H.; Tai, P.; Xu, Y.; Zhang, X.; Schnelle-Kreis, J.; Schloter-Hai, B.; Zimmermann, R. Air pollution in Germany: Spatio-temporal variations and their driving factors based on continuous data from 2008 to 2018. Environ. Pollut. 2021, 276, 116732. [Google Scholar] [CrossRef]
- Gil-Alana, L.A.; Yaya, O.S.; Awolaja, O.G.; Cristofaro, L. Long Memory and Time Trends in Particulate Matter Pollution (PM2.5 and PM10) in the 50 U.S. States. J. Appl. Meteorol. Climatol. 2020, 59, 1351–1367. [Google Scholar] [CrossRef]
- Meraz, M.; Rodriguez, E.; Femat, R.; Echeverria, J.C.; Alvarez-Ramirez, J. Statistical persistence of air pollutants (O3, SO2, NO2 and PM10) in Mexico City. Phys. A Stat. Mech. Its Appl. 2015, 427, 202–217. [Google Scholar] [CrossRef]
- Nikolopoulos, D.; Moustris, K.; Petraki, E.; Koulougliotis, D.; Cantzos, D. Fractal and Long-Memory Traces in PM10 Time Series in Athens, Greece. Environments 2019, 6, 29. [Google Scholar] [CrossRef]
- Varotsos, C.; Ondov, J.; Efstathiou, M. Scaling properties of air pollution in Athens, Greece and Baltimore, Maryland. Atmos. Environ. 2005, 39, 4041–4047. [Google Scholar] [CrossRef]
- Xue, Y.; Pan, W.; Lu, W.Z.; He, H.D. Multifractal nature of particulate matters (PMs) in Hong Kong urban air. Sci. Total Environ. 2015, 532, 744–751. [Google Scholar] [CrossRef]
- Thompson, J.R.; Wilson, J.R. Multifractal detrended fluctuation analysis: Practical applications to financial time series. Comput. Simul. 2016, 126, 63–88. [Google Scholar] [CrossRef]
- Kantelhardt, J.W.; Zschiegner, S.A.; Koscielny-Bunde, E.; Havlin, S.; Bunde, A.; Stanley, H.E. Multifractal detrended fluctuation analysis of nonstationary time series. Phys. A Stat. Mech. Its Appl. 2002, 316, 87–114. [Google Scholar] [CrossRef]
- Anis, A.; Lloyd, E. The expected value of the adjusted rescaled Hurst Range of independent normal summands. Biometrika 1976, 63, 111–116. [Google Scholar] [CrossRef]
- Peters, E.E. Fractal Market Analysis: Applying Chaos Theory to Investment and Economics; John Wiley & Sons Inc.: Hoboken, NJ, USA, 1994; p. 336. [Google Scholar]
- Jia, L.; Cheng, P.; Yu, Y.; Chen, S.H.; Wang, C.X.; He, L.; Nie, H.T.; Wang, J.C.; Zhang, J.C.; Fan, B.G.; et al. Regeneration mechanism of a novel high-performance biochar mercury adsorbent directionally modified by multimetal multilayer loading. J. Environ. Manag. 2023, 326, 116790. [Google Scholar] [CrossRef] [PubMed]


| Indicator | Station | |||
|---|---|---|---|---|
| 1 | 2 | 3 | 4 | |
| Number of observations | 1384 | 1038 | 1038 | 1038 |
| Mean | 0.219487 | 0.225809 | 0.222071 | 0.225241 |
| Std | 0.354448 | 0.421328 | 0.366821 | 0.417980 |
| Min | 0.000000 | 0.000000 | 0.000000 | 0.000000 |
| Max | 3.400000 | 3.900000 | 3.400000 | 3.900000 |
| Indicator | Station | |||
|---|---|---|---|---|
| 1 | 2 | 3 | 4 | |
| Number of observations | 1280 | 1038 | 1038 | 1038 |
| Mean | 0.227144 | 0.222413 | 0.226039 | 0.221515 |
| Std | 0.216896 | 0.233680 | 0.234858 | 0.219416 |
| Min | 0.090833 | 0.082500 | 0.085000 | 0.095833 |
| Max | 1.084167 | 1.229167 | 1.141667 | 1.145833 |
| Thermal Power Plant | Maximum Capacity, Gcal/Year | Distance to the Observation Station, km | |||
|---|---|---|---|---|---|
| 1 | 2 | 3 | 4 | ||
| CHP 1 | 824 | 8.93 | 5.52 | 12.55 | 11.83 |
| CHP 2 | 1140 | 8.01 | 6.8 | 10.71 | 9.84 |
| CHP 2 WB | 795 | 8.04 | 6.71 | 10.81 | 9.94 |
| CHP 3 | 440 | 10.15 | 6.81 | 13.73 | 12.99 |
| South-west | 350 | 6.02 | 9.57 | 3.42 | 3.28 |
| Turan | 340 | 9.14 | 6.82 | 11.9 | 11.75 |
| Min distance | 6.02 | 5.52 | 3.42 | 3.28 | |
Disclaimer/Publisher’s Note: The statements, opinions and data contained in all publications are solely those of the individual author(s) and contributor(s) and not of MDPI and/or the editor(s). MDPI and/or the editor(s) disclaim responsibility for any injury to people or property resulting from any ideas, methods, instructions or products referred to in the content. |
© 2024 by the authors. Licensee MDPI, Basel, Switzerland. This article is an open access article distributed under the terms and conditions of the Creative Commons Attribution (CC BY) license (https://creativecommons.org/licenses/by/4.0/).
Share and Cite
Biloshchytskyi, A.; Neftissov, A.; Kuchanskyi, O.; Andrashko, Y.; Biloshchytska, S.; Mukhatayev, A.; Kazambayev, I. Fractal Analysis of Air Pollution Time Series in Urban Areas in Astana, Republic of Kazakhstan. Urban Sci. 2024, 8, 131. https://doi.org/10.3390/urbansci8030131
Biloshchytskyi A, Neftissov A, Kuchanskyi O, Andrashko Y, Biloshchytska S, Mukhatayev A, Kazambayev I. Fractal Analysis of Air Pollution Time Series in Urban Areas in Astana, Republic of Kazakhstan. Urban Science. 2024; 8(3):131. https://doi.org/10.3390/urbansci8030131
Chicago/Turabian StyleBiloshchytskyi, Andrii, Alexandr Neftissov, Oleksandr Kuchanskyi, Yurii Andrashko, Svitlana Biloshchytska, Aidos Mukhatayev, and Ilyas Kazambayev. 2024. "Fractal Analysis of Air Pollution Time Series in Urban Areas in Astana, Republic of Kazakhstan" Urban Science 8, no. 3: 131. https://doi.org/10.3390/urbansci8030131
APA StyleBiloshchytskyi, A., Neftissov, A., Kuchanskyi, O., Andrashko, Y., Biloshchytska, S., Mukhatayev, A., & Kazambayev, I. (2024). Fractal Analysis of Air Pollution Time Series in Urban Areas in Astana, Republic of Kazakhstan. Urban Science, 8(3), 131. https://doi.org/10.3390/urbansci8030131


