Article

Integrating Hyperspectral Reflectance and Physiological Parameters to Detect Urban Tree Stress: A Study of Drought and Simulated Acid Rain

1
Department of Forest and Environment System, Kangwon National University, Chuncheon 24341, Republic of Korea
2
Department of Ecological Landscape Architecture Design, Kangwon National University, Chuncheon 24341, Republic of Korea
*
Authors to whom correspondence should be addressed.
Urban Sci. 2024, 8(3), 106; https://doi.org/10.3390/urbansci8030106
Submission received: 24 June 2024 / Revised: 30 July 2024 / Accepted: 2 August 2024 / Published: 5 August 2024

Abstract

:
With urbanization and climate change worsening, urban trees are constantly exposed to environmental stress. To enhance the functionality and health of trees, it is crucial to rapidly and non-destructively detect and respond to tree stress. Research utilizing hyperspectral characteristics for detecting various stresses has recently been actively pursued. This study conducted comparative analysis using various leaf physiological parameters (chlorophyll content, chlorophyll fluorescence, leaf water, and gas exchange status) and hyperspectral data (VIS: visible ray; SWIR: short-wave infrared) to diagnose stress in Prunus yedoensis, commonly grown urban trees, by subjecting them simultaneously to different stresses (drought and simulated acid rain). The findings suggest that hyperspectral reflectance proved more responsive in identifying stress compared to the physiological parameters. Initially, VIS was more effective in detecting two stress responses than SWIR through a classification model (PLS-DA: partial least squares-discriminant analysis). Although SWIR initially faced challenges in simulated acid rain stress detection, spectral preprocessing (SNV: standard normal variate, + S.G 2nd: Savitzky–Golay 2nd derivative) enhanced its stress classification accuracy. Over time, the SWIR bands (1437 nm, 1667 nm, and 1949 nm) exhibited characteristics (such as moisture detection) more closely aligned with stress responses compared to VIS, as determined through PCA (principal component analysis). Hyperspectral reflectance also revealed the potential to measure chlorophyll fluorescence (Fo: minimum fluorescence). Building upon the foundational data of this study, the future potential of diagnosing urban tree stress using portable spectrometers is strong.

1. Introduction

Industrialization and urbanization have led to various environmental problems, such as climate change, acid rain, and air pollution [1,2,3]. Climate change is expected to continue in the future, with issues such as rising temperatures in various environments anticipated to worsen further [4,5]. Although acid rain peaked in the late 1960s and early 1970s and has significantly alleviated globally since then, the rainfall in urban and industrial areas in Korea still falls within the criteria for acid rain [3,6]. Climate change due to industrialization and urbanization is expected to cause more extreme environmental changes in the future [7,8]. Droughts caused by climate change and acid rain from air pollution are serious problems independently, but when they occur simultaneously, their combined impact on ecosystems can be complex and more severe [9]. This can have serious impacts on urban ecosystems and infrastructure. Therefore, it is important to study these interactions to develop appropriate response strategies.
Urban trees, with their physiological functions, can mitigate these problems, and the demand for urban trees is continuously increasing worldwide [10,11,12]. They offer various benefits, such as mitigating rising temperatures, increasing rainwater runoff, and reducing soil erosion, and providing aesthetic value [13,14]. However, urban trees are reported to be under stress from factors such as pests and diseases, xylem cavitation, hydraulic deterioration, tree growth, and photosynthesis in urban environments [1,7,15,16]. In particular, drought stress and acid rain stress are known to be major environmental factors that limit photosynthetic activity [17,18,19]. For these reasons, urban planners are conducting various simulation studies to select tree species suitable for growth under urban environmental stress [5,20,21]. However, as environmental changes become increasingly extreme, methods to maintain the vitality of the existing trees must also be devised. This should be addressed by non-destructively and quickly measuring trees’ physiology to respond at the early stages of stress.
There are destructive and non-destructive methods to measure tree physiology. The leaf chlorophyll or water content can be used to measure the vitality of trees using destructive methods [22,23]. Meanwhile, photosynthesis and the gas exchange parameters of leaves, such as chlorophyll fluorescence, stomatal conductance, and water use efficiency, can be measured non-destructively. These methods have been used in various plant physiological studies under different environmental conditions up to the present day [24,25,26,27]. However, the equipment capable of measuring multiple parameters simultaneously is very expensive, and individual equipment must be purchased for each parameter. Additionally, despite being non-destructive methods, they require significant time and labor, and real-time measurements can be challenging depending on the environment.
To address these issues, hyperspectral characteristics can be utilized. They offer the advantage of quickly and non-destructively measuring large amounts of data [28]. Each spectral band of hyperspectral spectra has unique characteristics. Different substances absorb or reflect light at different wavelengths. The absorption or reflectance characteristics of a specific substance are determined by its molecular and electronic structure. Leaf pigments, such as chlorophyll and carotenoids, respond in the visible light spectral range (VIS), while the water content of plant leaves responds in specific bands of the short-wave infrared spectral range (SWIR) [29]. Depending on spectral sensitivity, hyperspectral spectra may detect stress responses more quickly than the conventional measurement methods of determining physiological responses in trees.
Recently, the development and distribution of low-cost portable spectrometers have been accelerating. For example, a smartphone spectrometer for the non-destructive testing of fruit ripeness has been developed, costing approximately 6.25% of the traditional spectrometer products [30]. Additionally, a portable leaf spectrometer has been applied in various plant physiology studies [31,32]. With the increasing availability of low-cost portable instruments, it is essential to provide reference data on hyperspectral characteristics for various tree stresses to enhance the field applicability for diagnosing stress in individual trees.
This study conducted pot experiments on Prunus yedoensis, which is a commonly grown urban tree. Different abiotic stresses (drought and simulated acid rain stress) were simultaneously applied for 5 weeks. To understand the tree stress responses, the physiology and hyperspectral spectra were measured. The collected hyperspectral spectra were used to create a classification model to understand the responses of individual trees to the two stress treatments and a control. In the classification model, bands that significantly influenced spectrum classification were selected, and PCA (principal component analysis) was performed with the physiological parameters. By examining how the variables of the physiology and hyperspectral characteristics are classified and the trends that appear over time, the feasibility of using hyperspectral spectra to detect tree stress in the field was investigated.

2. Materials and Methods

2.1. Plant Materials and Growth Conditions

The plant materials consisted of two-year-old P. yedoensis, each with a height of 1.8 m, obtained from a nursery in Chuncheon, South Korea. The soil was a mixture of decomposed granite soil and bed soil in a 4:1 ratio. This soil mixture was filled to a height of 25 cm in plastic pots (height: 35 cm; upper diameter: 30 cm; lower diameter: 20 cm), and the saplings were transplanted into these pots. They underwent acclimatization in the greenhouse of the College of Forest and Environmental Sciences at Kangwon National University (37°45′39″ N, 127°10′13″ E) for one month in May 2020.
The experiment was conducted over 5 weeks starting from 20 August 2020. Fifteen saplings were selected for each treatment (CK: control; DT: drought treatment; SAT: simulated acid rain treatment), with three saplings chosen randomly per week (total n = 45). CK and SAT were watered daily at 10 AM and 4 PM using sprinklers, with approximately 12.5 mm per pot, considering the average summer rainfall in Chuncheon from 2010 to 2019 (787.66 mm from June to September). DT received no watering. Simulated acid rain was prepared by diluting H2SO4 1N: HNO3 1N in a 3:1 (V/V) ratio with groundwater based on the major ionic component concentrations of acidic precipitation from 2010 to 2019 [6]. The pH was set to 3.0, a level known to cause visible injuries [33]. Simulated acid rain was applied twice weekly as mist for 5 min using an automatic sprayer from the top of the saplings. During the five-week data collection period, the average temperature was 27.32 ± 3.64 °C, the average relative humidity was 69.33 ± 5.10%, and the average solar radiation was 181.4 ± 81.9 μmol m−2 s−1 (HOBO U12, Onset, Bourne, MA, USA). Soil moisture in the pots was maintained at an average of 56 ± 3% for CK and SAT and 13 ± 3% for DT (HB-300, Kett, Tokyo, Japan).

2.2. Physiological Measurements

To measure chlorophyll fluorescence, 30 leaves (10 leaves per plant) were selected for each treatment. The leaves were dark-adapted for 20 min using sample clips to block light. After 20 min, the sample clips were removed, and chlorophyll fluorescence was measured using a chlorophyll fluorescence meter (FluorPen FP-100, Photon Systems Instruments, Drásov, Czech), with a light intensity of 1500 μmol m−2 s−1. The chlorophyll fluorescence induction curve (OJIP) data were used to determine the minimum fluorescence (Fo), maximum fluorescence (Fm), and maximum PSII quantum yields (Fv/Fm, where Fv = Fm − Fo).
Stomatal conductance (Gs) was measured on the leaves used for chlorophyll fluorescence using a leaf porometer (SC-1, Decagon, Pullman, WA, USA). Before each weekly measurement, the desiccant in the sample chamber was replaced, and calibration was performed. The intercellular CO2 concentration (Ci) and water use efficiency (WUE) were measured using a portable infrared gas exchange analyzer (LCpro +, ADC BioScientific Ltd, Hoddesdon, UK) connected to a broadleaf chamber (portable leaf chamber PLC3) with a cross-sectional area of 6.25 cm2. Measurements were taken by supplying CO2 from the ambient air through a 3 m high air intake antenna until the CO2 concentration in the chamber matched the ambient CO2 concentration, and then placing the leaves in the leaf chamber. The light intensity was set at 1500 μmol m−2 s−1, and measurements were taken at 1 min intervals with three repetitions, collecting the average value for each leaf.
The chlorophyll contents were determined for the same leaves subjected to the non-destructive methods, including measuring chlorophyll a (Chl a), chlorophyll b (Chl b), and the total chlorophyll contents (Chl t). The collected leaves were standardized to a weight of 0.1 g per treatment and transferred to test tubes. Then, 10 mL of dimethyl sulfoxide (DMSO) was added to each sample. The samples were incubated in a water bath at 65 °C for 6 h to extract the pigments [34]. The extracted pigments were measured for absorbance using a UV/VIS spectrophotometer (Libra S80, Biochrom, Cambridge, UK), and the chlorophyll contents were calculated using Arnon’s [35] formula.
Chl a (mg g−1 FW) = 12.7 × A663 − 2.69 × A645
Chl b (mg g−1 FW) = 22.9 × A645 − 4.68 × A663
Chl t (mg g−1 FW) = 20.2 × A645 + 8.02 × A663
The relative water content (RWC) was measured using the leaves left after measuring the chlorophyll content with an infrared moisture analyzer (FD-660, Kett, Tokyo, Japan). The leaves were prepared by removing the midrib and using approximately 1 g of leaf tissue per measurement. First, the fresh weight (FW) and turgor weight (TW) soaked in distilled water for 6 h were measured. Then, the drained sample (TW) was heated using the built-in organic carbon heater (280 W × 2) at 105 °C for 20 min to determine the dry weight (DW). After obtaining the FW, TW, and DW, the RWC was calculated using the following formula.
RWC (%) = (FW − DW)/(TW − DW) × 100

2.3. Hyperspectral Reflectance

VIS (unit: 1 nm, 480 nm–750 nm) and SWIR (unit: 3 nm, 1100 nm–2300 nm) were measured using two spectrometers (USB4000 and NIRQest, Ocean Optics, Orlando, FL, USA) connected to a probe (QR400-7-VIS-BX, Ocean Optics, Orlando, FL, USA). After measuring the non-destructive physiological parameters, the probe was placed in contact with the adaxial surface of leaf to collect 300 reflectance spectra per treatment each week. The spectral parameter was set using commercial software Spectra Suite (ver 6.2, Ocean Optics, Orlando, FL, USA), with an integration time of 10 ms (VIS) and 100 ms (SWIR), 3 scans on average, and a boxcar width of 3 for graph smoothing. Calibration consisted of storing the samples in a dark state with the light source (HL-2000, Ocean Optics, Orlando, FL, USA) turned off for 0% reflectance, and then placing the probe on the reflection probe diffuse reflectance standard (WS-1-SL, Ocean Optics, Orlando, FL, USA) and turning on the light source to measure the 100% reflectance value.

2.4. Statistical Analysis

To observe the differences in physiological data among the treatments over time, one-way ANOVA (post hoc: Tukey HSD) was performed using SPSS (ver 24, IBM, Armonk, NY, USA). To compare the differences in spectra among the treatments over time, partial least squares discriminant analysis (PLS-DA) was performed. To compare the results of statistical preprocessing, the standard normal variate (SNV) and the SNV + Savitzky–Golay 2nd derivative (S.G 2nd; window size = 11; polynomial order = 2) were applied. The dataset included the stress treatment (DT: n = 75 + SAT: n = 75) spectra designated as Class 0 and the non-stress treatment (CK: n = 150) spectra designated as Class 1. To prevent overfitting and ensure the model’s applicability, 10-fold cross-validation (CV) was conducted. Binary classification was performed with a threshold of 0.5. To select the bands that significantly influenced stress classification, peaks with VIP (variable importance in projection) scores higher than 1 were chosen based on the results of the PLS-DA model. The selected bands, along with tree physiological parameters, were analyzed using PCA to identify the variables that affect stress group differentiation over time. The aforementioned spectral preprocessing, PLS-DA, and PCA were conducted using the PLS-Toolbox (ver 8.9.1, Eigenvector Research Incorporated, Manson, WA, USA) package in Matlab (ver R2020, MathWorks, Natick, MA, USA).

3. Results

3.1. Chlorophyll Content

During the experimental period, the CK tended to maintain values of 23.66 ± 6.96 mg g−1 for Chl a, 7.61 ± 2.62 mg g−1 for Chl b, 31.21 ± 9.37 mg g−1 for Chl t, and 3.21 ± 0.59 for Chl a/b (Figure 1). The reduction in chlorophyll content was more evident in the SAT than in the DT (Figure 1a–c). The SAT showed a significant difference from the CK and the DT starting from week 1, while the DT showed a significant difference from the CK starting from week 2. When subjected to stress, the SAT showed a significant increase in Chl a/b during week 1, followed by a continuous decline over time.

3.2. Chlorophyll Fluorescence

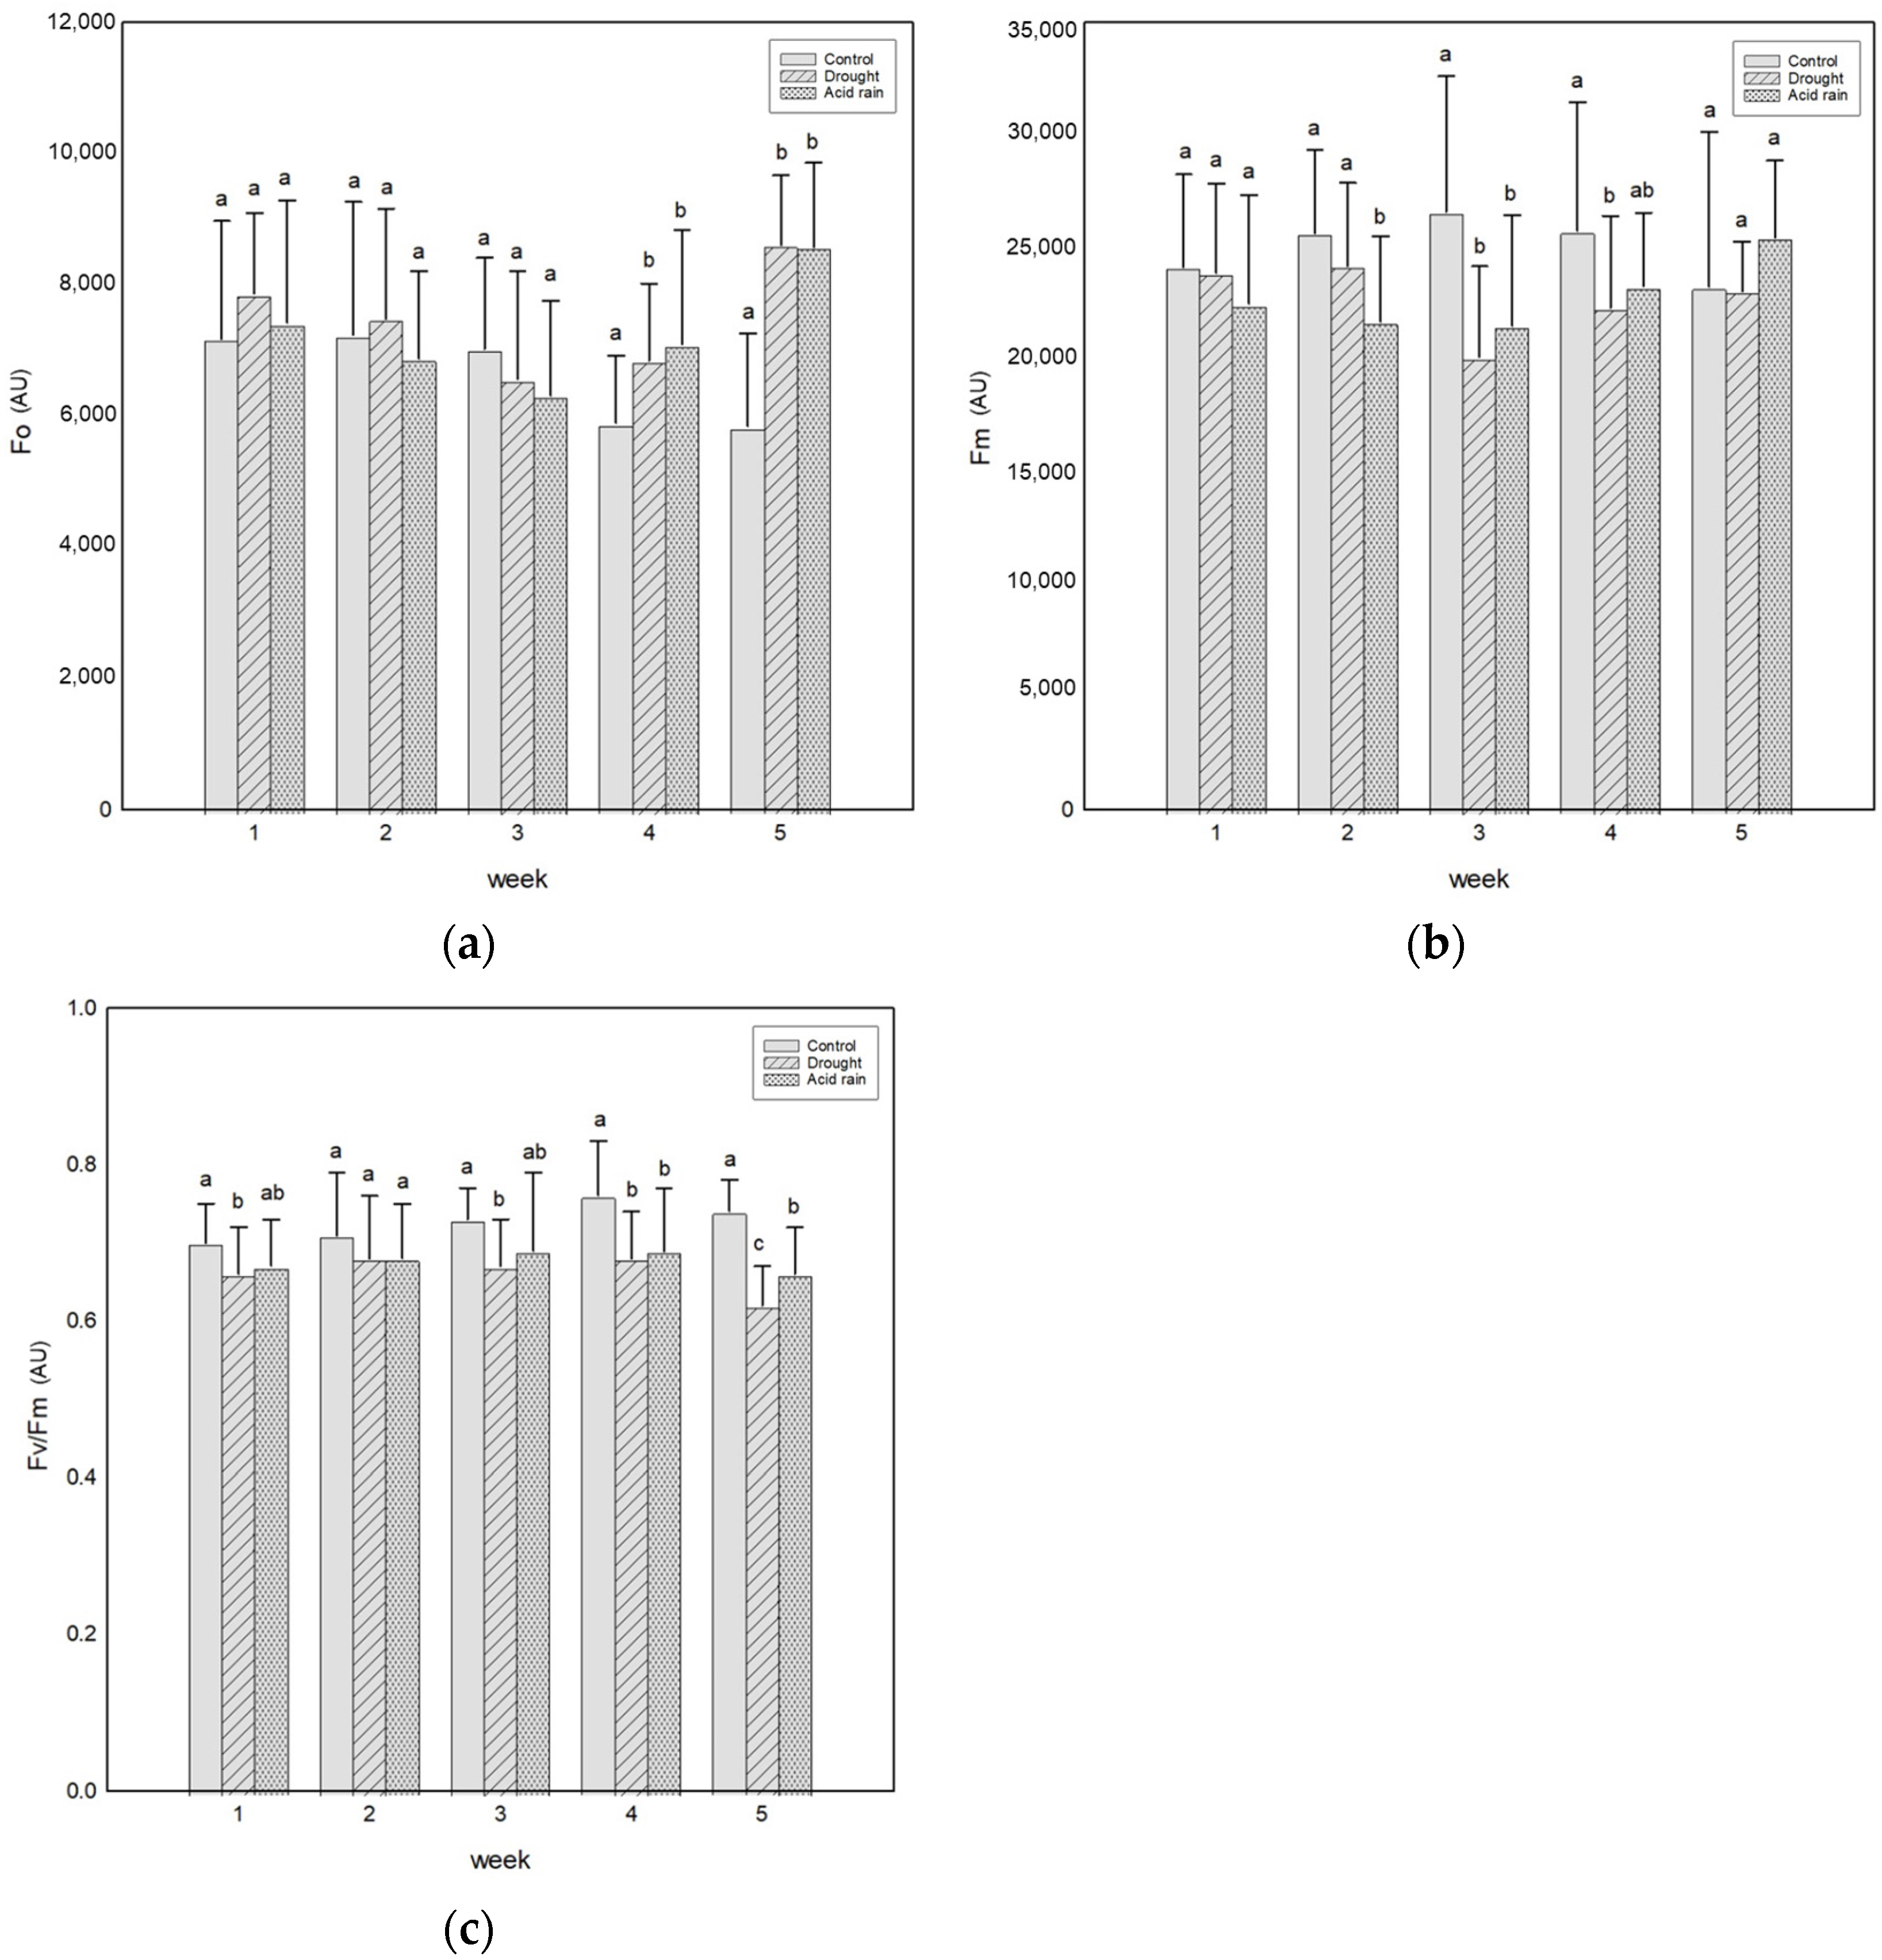
During the experimental period, the CK tended to maintain values of 6895.56 ± 1629.45 for Fo, 23,440.73 ± 4923.30 for Fm, and 0.70 ± 0.07 for Fv/Fm (Figure 2). Fo significantly increased in the stress treatments starting from week 4 (Figure 2a). Conversely, Fm tended to decrease in the stress treatments from weeks 2 to 4, but by week 5, there were no significant differences among the three treatments (Figure 2b). Unlike the chlorophyll content, Fv/Fm indicated that the DT suffered more stress than the SAT (Figure 2c). This suggests that despite significant chlorophyll degradation in the SAT, the undamaged areas exhibited the normal functioning of photosystem II.

3.3. Leaf Water and Gas Exchange Status

During the experimental period, the RWC in the CK was maintained at 66.51 ± 3.34% (Figure 3a). Significant differences were observed from week 3 onwards between the stress treatments and the CK, with the DT showing more stress than SAT. Gs in the CK tended to remain at an average of 286.97 ± 90.51 mmol m−2 (Figure 3b). From week 1, both the stress treatments had significantly lower values than the CK. After a sharp decline, the DT showed an increasing trend from weeks 1 to 4, while the SAT showed a decreasing trend. In week 5, the DT exhibited a sharp decline, significantly lower than that of the SAT. Ci in the CK was maintained at 327.76 ± 46.13 μmol m−2 s−1 (Figure 3c). The SAT showed a more significant decrease compared to those of the CK and the DT from week 2. The DT showed a significant difference from the CK starting from week 3. The WUE in the CK tended to remain at an average of 0.92 ± 1.29 μmol mmol−1 (net photosynthesis rate: 1.96 ± 2.64 μmol m−2 s−1) (Figure 3d). The DT increased until week 4, while the SAT showed a decreasing trend. Notably, the DT had higher values than that of the CK from weeks 2 to 4. However, in week 5, the DT decreased sharply. This trend was similar to that of Gs.

3.4. Hyperspectral Reflectance-Based Classification Model

The classification model created using three types of hyperspectral spectra showed that the preprocessed spectra models performed better than the raw spectra models (Table 1). For VIS, the model with SNV preprocessing was the most superior, while for SWIR, the model with SNV + S.G 2nd preprocessing had the best result.
The comparison between VIS and SWIR across the weeks showed distinct characteristics (Table 2). In the stress treatments, VIS in week 1 showed a higher probability for the SAT (average probability of three preprocessed spectra: 98%) compared to that of the DT (average probability of three preprocessed spectra: 86%). VIS is sensitive to the leaf pigments, so the initial damage from simulated acid rain appeared promptly. Over time, the DT showed a trend of a higher probability than that of SAT. It is considered that drought stress damage accumulated throughout the leaves, while the unaffected mesophyll cells in the SAT may have remained undamaged.
In SWIR week 1, the DT (average probability of three preprocessed spectra: 65%) showed higher probability than the SAT (average probability of three preprocessed spectra: 38%). Particularly in the early stages of the SAT, except for SNV + S.G 2nd spectra, the probability was relatively low. The raw and SNV spectra showed an increasing trend in probability over time. The SWIR, being sensitive to moisture, appears to be more responsive to drought damage initially. It is inferred that the increased damage observed is attributed to necrotic leaf cells induced by simulated acid rain, leading to the measurement of more desiccated areas [36].
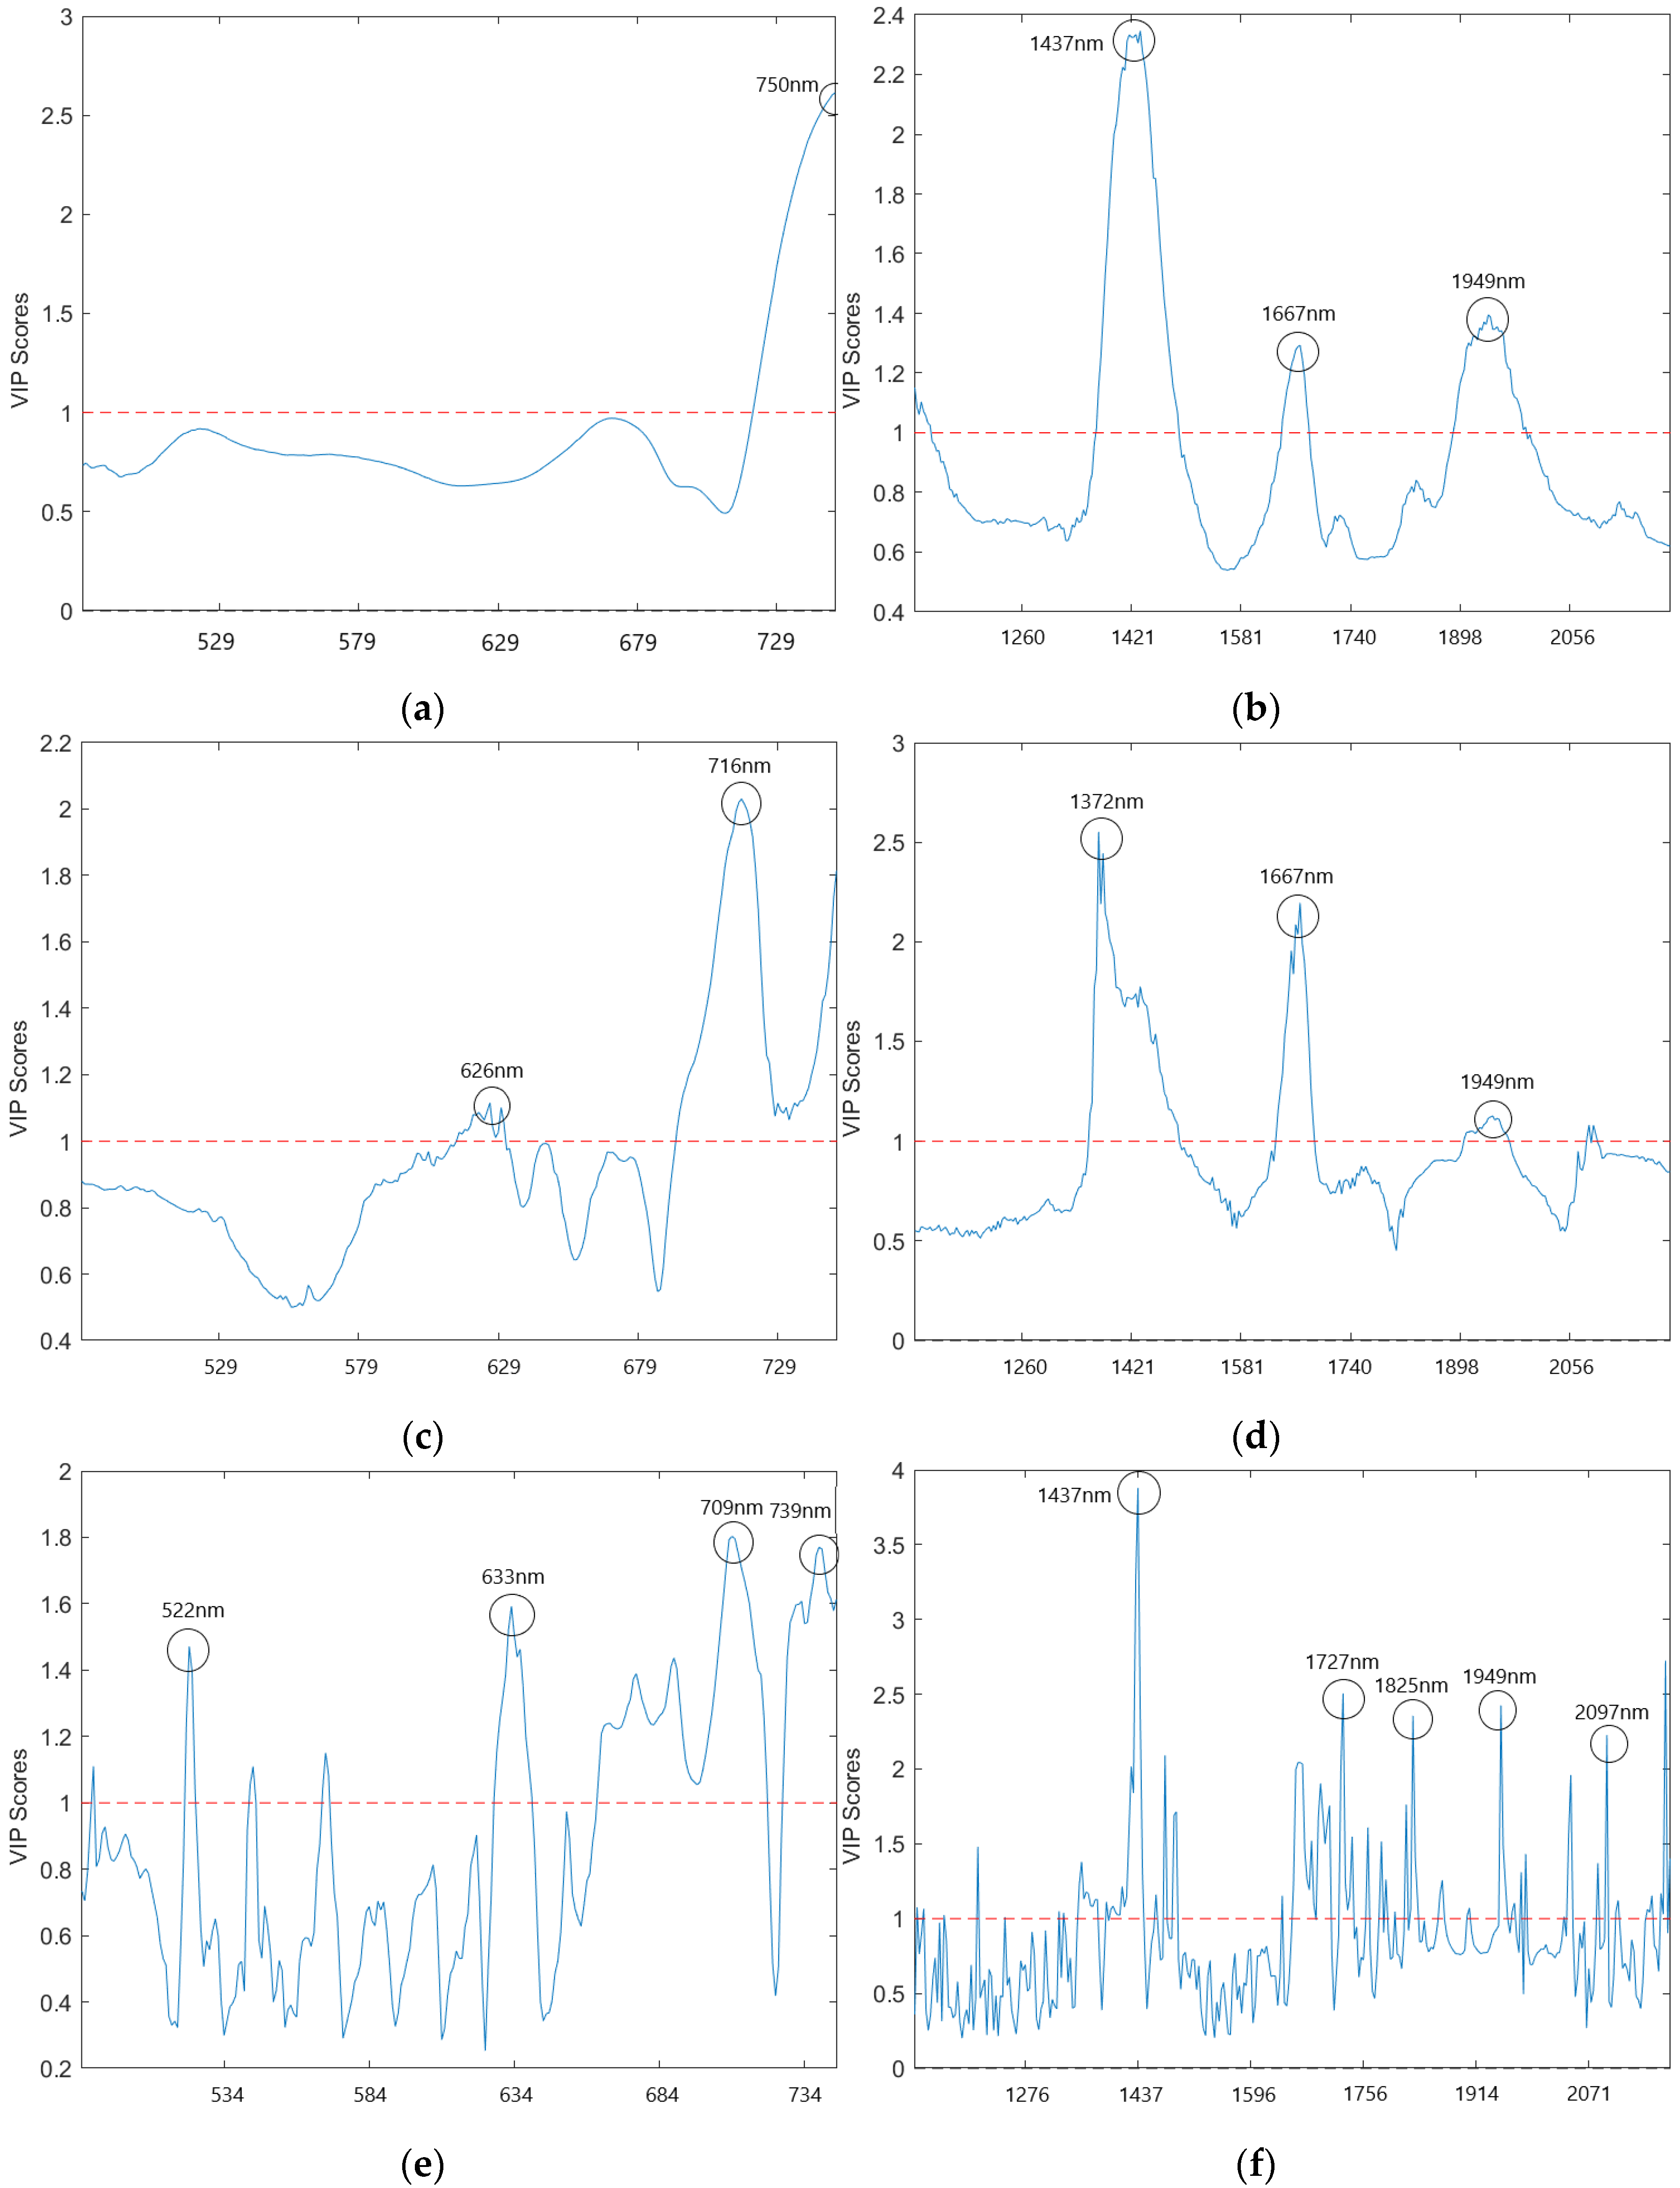
The bands that had a significant impact on stress classification were selected using the VIP scores (Figure 4). In the VIS raw spectra, a continuous increase in values was observed from 721 nm onwards, selecting the peak at 750 nm (Figure 4a). Peaks were observed in the VIS SNV spectra at 626 nm and 716 nm (Figure 4c). The VIS SNV + S.G 2nd spectra exhibited peaks at 633 nm, 709 nm, and 739 nm, corresponding to the red spectral range (Figure 4e). Peaks were also observed at 500 nm (green spectral range), with 522 nm being selected.
In the SWIR raw spectra, peaks were observed at 1437 nm, 1667 nm, and 1949 nm (Figure 4b). The SNV spectra exhibited peaks at 1372 nm, consistent with the raw spectra, and at 1667 nm and 1949 nm (Figure 4d). The SNV + S.G 2nd spectra showed more peaks compared to those of the VIS (Figure 4f). The top five bands selected based on high VIP scores were 1437 nm, 1727 nm, 1825 nm, 1949 nm, and 2097 nm. The peak at 1437 nm matched the peak in the raw spectra, while the peak at 1949 nm was consistent across all the spectra types.

3.5. Clustering between Physiological Parameters and Selected Bands

In week 1, distinct clusters were observed between the SAT and the CK (Figure 5a). The influence of the selected bands was shown to be more significant than the physiological parameters. Primarily, it seemed that the red spectral range (r750, S626, S716, and SS739) contributed to the separation of the CK from the SAT (Figure 5b). It has been reported that VIS utilizes the red spectral range to measure the major chlorophyll pigments [37,38].
In week 2, the CK and the SAT were classified into completely different clusters (Figure 5c). The CK exhibited a tendency, where Chl a, Chl b, Chl t, SS522, SS633, SS709, and SS1437 contributed to cluster classification (Figure 5d). Conversely, the SAT showed that S626, S716, SS739, and SS1825 had a significant impact on cluster classification.
In week 3, the three treatments were completely separated into distinct clusters (Figure 5e). The DT showed significant influence on cluster classification, with r750, S1372, SS1727, and SS1949 (Figure 5f). The SAT demonstrated a significant influence on cluster classification, with S626, S716, SS739, and SS1825. Both the DT and the SAT appeared to have a more substantial impact on the selected bands than on the physiological parameters.
In week 4, the DT and the SAT appeared to be closer in the clusters (Figure 5g). These stress treatments showed a tendency, where Chl a/b, Fo, WUE, r750, r1437, r1667, S626, S716, SS739, S1372, SS1727, SS1825, SS1949, and SS2097 contributed to cluster formation (Figure 5h).
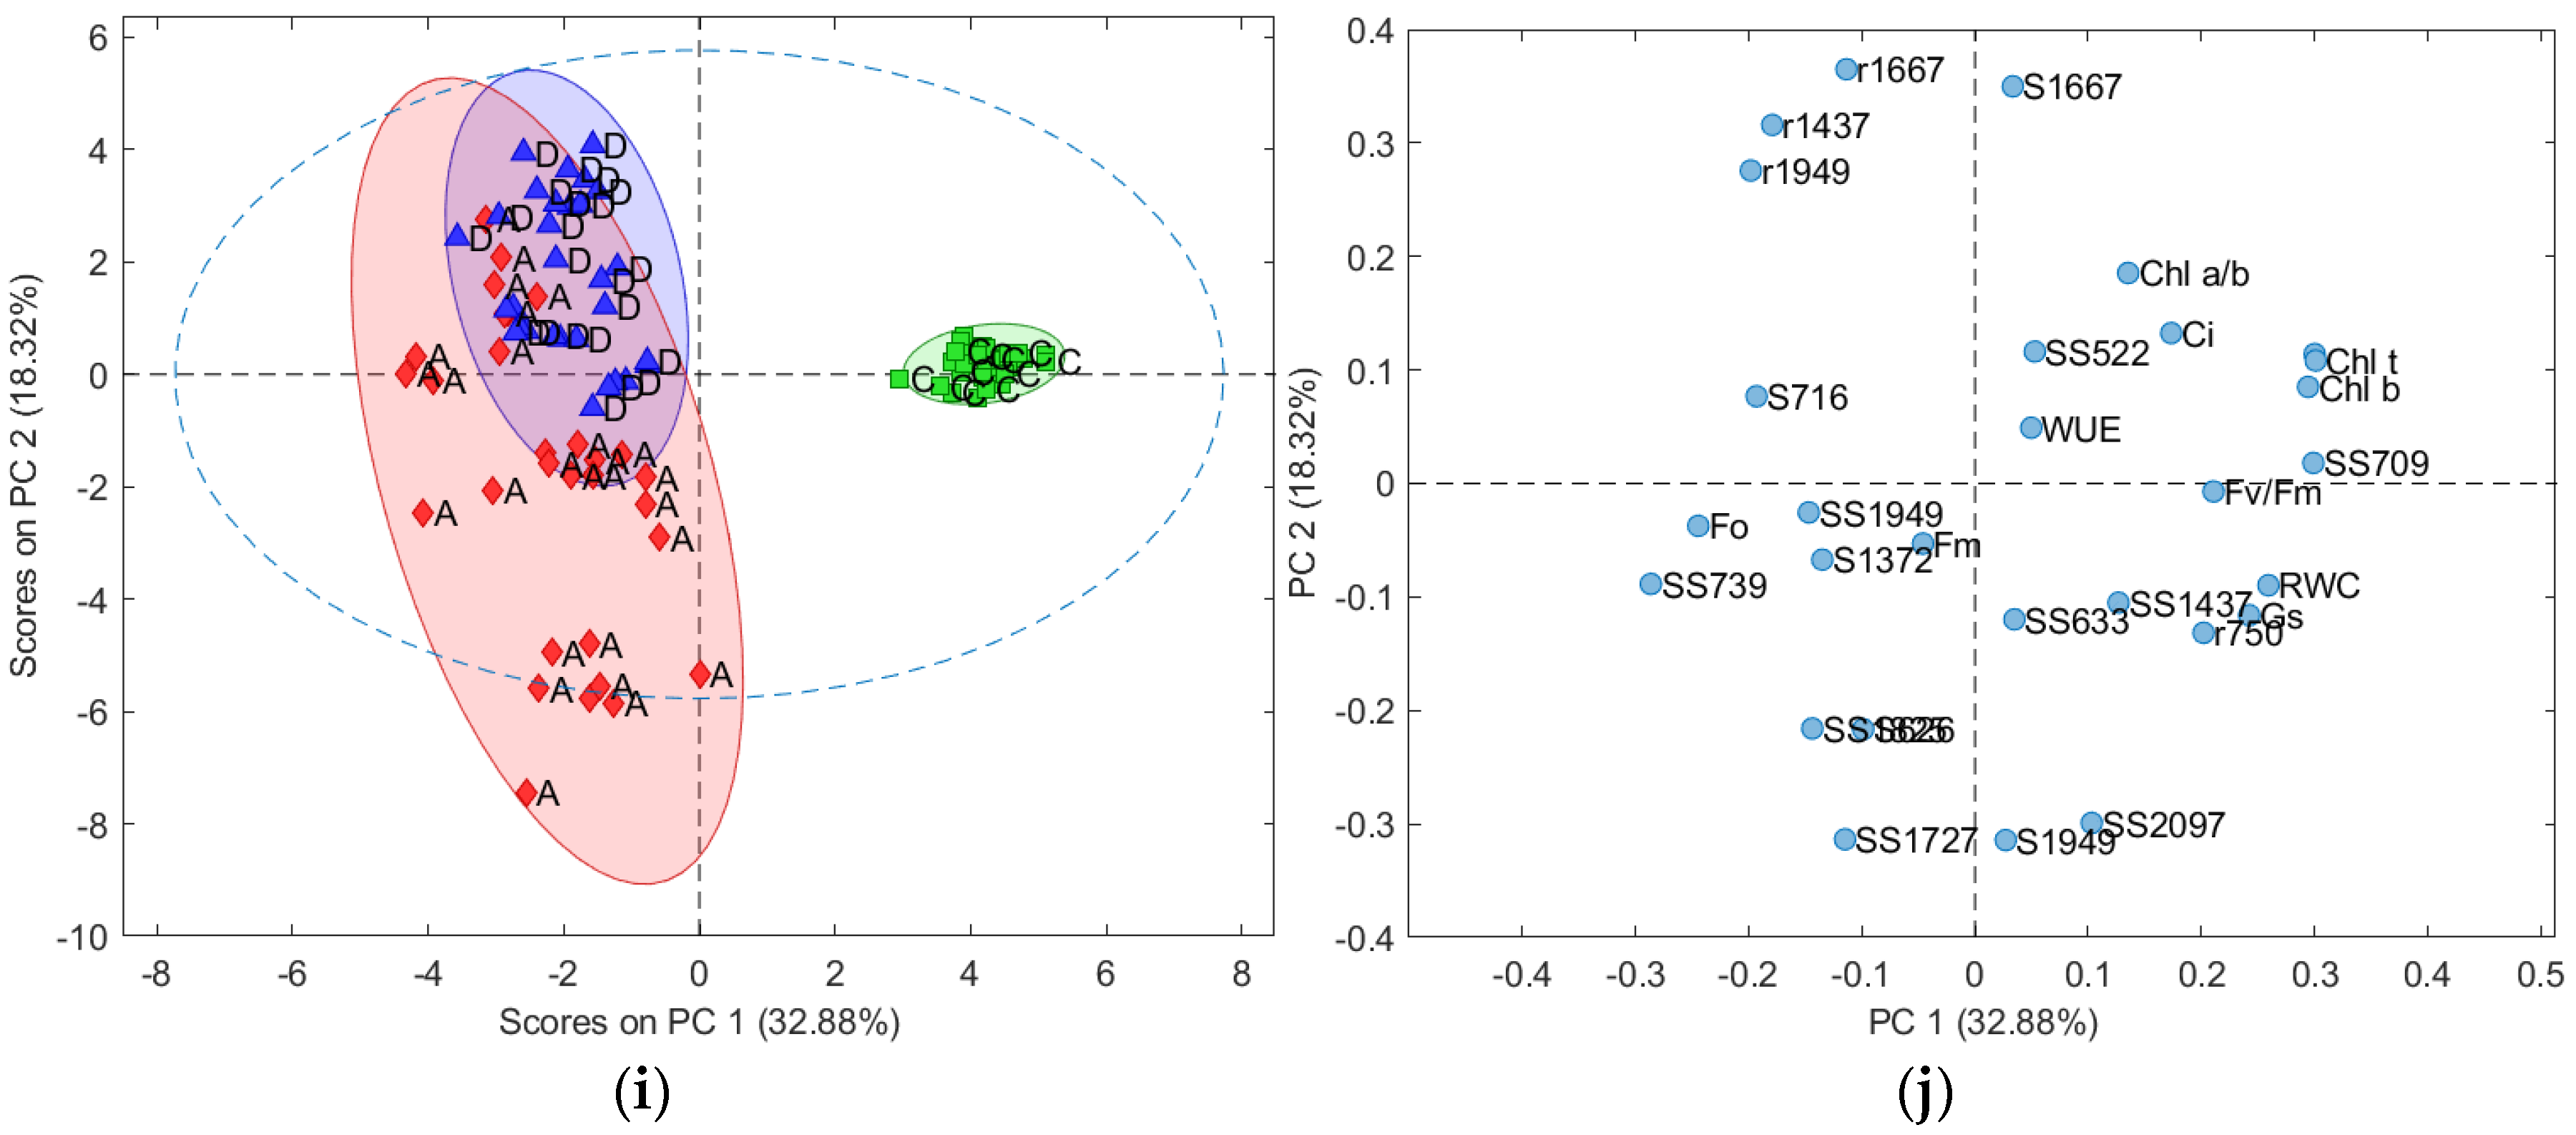
In week 5, the DT was found to be included in the SAT cluster (Figure 5i). S716, r1437, r1667, and r1949 seemed to significantly influence cluster formation in the DT (Figure 5j). The cumulative percentage (PC1 + PC2) was relatively low (<60%), which led to difficulties in identifying and interpreting the key parameters of the stress. This indicates that the stress responses observed between the hyperspectral reflectance and physiological parameters are diverse and exhibit complex patterns.

4. Discussion

The drought stress experiments using various tree species have shown that a water deficit damages the chloroplast membrane, leading to a reduction in the chlorophyll content [39]. The reduction in chlorophyll content due to simulated acid rain is reported to be caused by the leaching of Mg, one of the main components of chlorophyll [40]. Additionally, simulated acid rain is known to cause direct physical damage to leaves, including the cuticle and epidermal cells [41,42]. In this study, it is considered that the cumulative damage from simulated acid rain led to the more extensive destruction of Chl a, the main chlorophyll pigment, resulting in a decrease in Chl a/b.
Generally, under stress conditions, Fo tends to increase, while Fm and Fv/Fm tend to decrease [43,44]. Although the simulated acid rain treatment period differs, a previous study using E. glabripetalus reported a continuous decrease in Fv/Fm followed by recovery after a certain period [45]. When plants are under stress, defense mechanisms are triggered, leading to resistance against a certain level of stress [46]. In this study, although the SAT showed a more significant reduction in chlorophyll content compared to that of the DT, various metabolic responses, apart from chlorophyll fluorescence, may vary depending on the situation.
If chlorophyll is degraded, the photosynthesis efficiency decreases, which, in turn, affects the regulation of stomatal opening and closing, negatively impacting stomatal activity. This indicates that the gas exchange status tended to deteriorate more significantly in the early stages in the SAT compared to that of the DT. Additionally, gas exchange is generally reported to adapt more towards increasing photosynthetic efficiency rather than preventing water loss by reducing transpiration [47]. However, due to severe drought stress, a decrease in the carbon fixation and photosynthetic rates is considered to have resulted in a deteriorated gas exchange status [48]. In a study by Lee et al. [39], the intrinsic water use efficiency (WUEi) of P. yedoensis showed an increasing trend up to day 14 of drought treatment, but then dropped sharply by day 21, which closely aligns with the findings of this study. Among the physiological parameters, the extent of damage measured varied depending on the stress.
Applying S.G preprocessing involves using polynomial smoothing to reduce random noise in the spectrum and transform it into a different form compared to that of raw or SNV spectra, thereby emphasizing the peaks. It has been reported that adding S.G preprocessing improves the model performance of PLSR models [49,50]. In diagnosing stress, it is considered that the selection of preprocessing methods should be based on the hyperspectral characteristics and the type of stress targeted.
Among the physiological parameters, chlorophyll fluorescence (1. Fo; 2. Fm) appeared to influence the stress clusters in the PCA results. Jia et al. [51] were able to quantify the chlorophyll fluorescence parameters from hyperspectral reflectance at the leaf scale during winter wheat studies. Zheng et al. [52] demonstrated a significant correlation between hyperspectral reflectance-based vegetation indices and chlorophyll fluorescence parameters using S. salsa. Zhuang et al. [53] suggested that it is possible to track the chlorophyll fluorescence parameters by selecting specific bands from hyperspectral reflectance. The previous studies have mainly shown a significant correlation with Fv/Fm. It is anticipated that if additional data are collected in the future, correlation analysis can be performed with spectral bands and chlorophyll fluorescence parameters.
It was observed that as the stress intensified, the influence of the SWIR appeared to be more significant than that of VIS, similar to the stress classification probability results. The SWIR is considered more useful for diagnosing various stresses because it is more sensitive to structures and components that are not visible in the VIS range [54,55]. Particularly, adaxial reflectance at 1437 nm has been reported to show significant differences in field-grown wheat under contrasting water regimes [56]. Among the winter wheat genotypes, reflectance showed significant variation between 1663 nm and 1667 nm under dryland and irrigated conditions [57]. Latent bruise damage to apples is also reported to be well distinguished at 1667 nm [58]. Higher raw reflectance was observed within the 1500 nm–1800 nm and 1800 nm–2350 nm spectral regions at different groundwater levels, salt concentrations, and water/salt interactions in S. salsa [52]. The 1778 nm–1949 nm range comprises water absorption regions, where water can influence the presence of leaf pigments, proteins, and nitrogen [59]. These research cases provide evidence that enhances the applicability of the selected bands proposed in this study.

5. Limitations and Future Studies

In this study, the limited sample size made it difficult to develop a prediction model. Although the PCA results allowed us to observe the trend of stress responses in the tree physiological parameters over time, it was difficult to identify clear patterns. To practically validate measurability, it is deemed necessary to develop a regression model by selecting specific tree physiological parameters. For example, based on the results of this study, Fo had an impact on distinguishing the stress clusters and could be used as a reference tree physiological parameter. However, it is considered essential to conduct validation studies with a larger sample size. In the future, based on the results of this study, it is anticipated that collecting large volumes of data will be facilitated by using selected specific physiological parameters and spectral bands.
Generally, studies on diagnosing urban trees are predominantly conducted at high-altitude airborne levels, making individual tree analysis challenging [60,61]. Additionally, the non-contact methods must address the noise caused by various airborne particles [62]. Therefore, validation studies are deemed necessary to determine whether non-contact hyperspectral analysis can accurately represent actual tree physiology, which should be carried out through contact-based data collection. Establishing a data library will be essential to compare the healthy and stressed trees. If the bands suggested in this study are validated through continuous research, diagnosis using near-range hyperspectral imaging will also be feasible.

6. Conclusions

This study simultaneously treated P. yedoensis with a DT and an SAT and compared various physiological parameters and hyperspectral data over time. The physiological parameters exhibited various responses across the three treatments. Fm and the RWC showed more significant stress in the DT, while the chlorophyll content, Gs, Ci, and the WUE exhibited more considerable stress in the SAT. Hyperspectral reflectance was able to detect stress more sensitively compared to the physiological parameters. In the initial stages, VIR was more effective in detecting stress responses compared to the SWIR. While the SWIR initially struggled to detect stress, especially in the SAT, spectral preprocessing (SNV + S.G 2nd) enhanced its stress classification probability. Over time, the SWIR (1437 nm, 1667 nm, and 1949 nm) exhibited characteristics closer to the stress responses than VIS. The potential use of spectroscopy for measuring chlorophyll fluorescence (Fo) was particularly demonstrated. Based on the fundamental data of this study, it is anticipated that the diagnosis of urban tree stress using portable spectrometers could be feasible in the future.

Author Contributions

Conceptualization, U.J. and E.J.C.; methodology, U.J.; formal analysis, U.J.; investigation, U.J.; writing—original draft preparation, U.J.; writing—review and editing, Y.J.Y. and E.J.C.; visualization, U.J.; supervision, Y.J.Y. and E.J.C. All authors have read and agreed to the published version of the manuscript.

Funding

This research was supported by the Korea Forest Service (Korea Forestry Promotion Institute) under the Forest Science and Technology Research and Development Program (Project No. 2020244A00-2021-0001).

Data Availability Statement

The data presented in this study are available upon request from the corresponding authors.

Conflicts of Interest

The authors declare no conflicts of interest.

References

  1. Locosselli, G.M.; de Camargo, E.P.; Moreira, T.C.L.; Todesco, E.; de Fátima Andrade, M.; de André, C.D.S.; de André, P.A.; Singer, J.M.; Ferreira, L.S.; Saldiva, P.H.N.; et al. The role of air pollution and climate on the growth of urban trees. Sci. Total Environ. 2019, 666, 652–661. [Google Scholar] [CrossRef] [PubMed]
  2. Wadanambi, R.T.; Wandana, L.S.; Chathumini, K.K.G.L.; Dassanayake, N.P.; Preethika, D.D.P.; Arachchige, U.S. The effects of industrialization on climate change. J. Res. Technol. Eng. 2020, 1, 86–94. [Google Scholar]
  3. Likens, G.E. Acid rain. In Fundamentals of Ecosystem Science, 2nd ed.; Weathers, K.C., Strayer, D.L., Likens, G.E., Eds.; Academic Press: London, UK, 2021; pp. 293–299. [Google Scholar]
  4. Dyderski, M.K.; Paź, S.; Frelich, L.E.; Jagodziński, A.M. How much does climate change threaten European forest tree species distributions? Glob. Change Biol. 2018, 24, 1150–1163. [Google Scholar] [CrossRef] [PubMed]
  5. Rötzer, T.; Rahman, M.A.; Moser-Reischl, A.; Pauleit, S.; Pretzsch, H. Process based simulation of tree growth and ecosystem services of urban trees under present and future climate conditions. Sci. Total Environ. 2019, 676, 651–664. [Google Scholar] [CrossRef] [PubMed]
  6. National Institute of Environmental Research. Annual Report of Air Quality in Korea 2019; National Institute of Environmental Research: Incheon, Republic of Korea, 2020. (In Korean) [Google Scholar]
  7. Savi, T.; Bertuzzi, S.; Branca, S.; Tretiach, M.; Nardini, A. Drought-induced xylem cavitation and hydraulic deterioration: Risk factors for urban trees under climate change? New Phytol. 2015, 205, 1106–1116. [Google Scholar] [CrossRef] [PubMed]
  8. Stott, P. How climate change affects extreme weather events. Science 2016, 352, 1517–1518. [Google Scholar] [CrossRef] [PubMed]
  9. Lee, W.; Choi, H.M.; Kim, D.; Honda, Y.; Guo, Y.L.L.; Kim, H. Synergic effect between high temperature and air pollution on mortality in Northeast Asia. Environ. Res. 2019, 178, 108735. [Google Scholar] [CrossRef] [PubMed]
  10. Mullaney, J.; Lucke, T.; Trueman, S.J. A review of benefits and challenges in growing street trees in paved urban environments. Landsc. Urban Plan. 2015, 134, 157–166. [Google Scholar] [CrossRef]
  11. Rahman, M.A.; Moser, A.; Rötzer, T.; Pauleit, S. Microclimatic differences and their influence on transpirational cooling of Tilia cordata in two contrasting street canyons in Munich, Germany. Agric. For. Meteorol. 2017, 232, 443–456. [Google Scholar] [CrossRef]
  12. Pretzsch, H.; Biber, P.; Uhl, E.; Dahlhausen, J.; Schütze, G.; Perkins, D.; Rötzer, T.; Caldentey, J.; Koike, T.; van Con, T.; et al. Climate change accelerates growth of urban trees in metropolises worldwide. Sci. Rep. 2017, 7, 15403. [Google Scholar] [CrossRef]
  13. Smardon, R.C. Perception and aesthetics of the urban environment: Review of the role of vegetation. Landsc. Urban Plan. 1988, 15, 85–106. [Google Scholar] [CrossRef]
  14. Livesley, S.J.; McPherson, E.G.; Calfapietra, C. The urban forest and ecosystem services: Impact on urban water, heat, and pollution cycles at the tree, street, and city scale. J. Environ. Qual. 2016, 45, 119–124. [Google Scholar] [CrossRef] [PubMed]
  15. Tubby, K.V.; Webber, J.F. Pests and diseases threatening urban trees under a changing climate. For. Int. J. For. Res. 2010, 83, 451–459. [Google Scholar] [CrossRef]
  16. Wang, X.M.; Wang, X.K.; Su, Y.B.; Zhang, H.X. Land pavement depresses photosynthesis in urban trees especially under drought stress. Sci. Total Environ. 2019, 653, 120–130. [Google Scholar] [CrossRef] [PubMed]
  17. Bradford, K.J.; Hsiao, T.C. Physiological Responses to Moderate Water Stress. In Physiological Plant Ecology II; Lange, O.L., Nobel, P.S., Osmond, C.B., Ziegler, H., Eds.; Springer: Berlin/Heidelberg, Germany, 1982; pp. 263–324. [Google Scholar]
  18. Sun, Z.; Wang, L.; Chen, M.; Wang, L.; Liang, C.; Zhou, Q.; Huang, X. Interactive effects of cadmium and acid rain on photosynthetic light reaction in soybean seedlings. Ecotoxicol. Environ. Saf. 2012, 79, 62–68. [Google Scholar] [CrossRef] [PubMed]
  19. Polishchuk, O.V.; Vodka, M.V.; Belyavskaya, N.A.; Khomochkin, A.P.; Zolotareva, E.K. The effect of acid rain on ultrastructure and functional parameters of photosynthetic apparatus in pea leaves. Cell Tissue Biol. 2016, 10, 250–257. [Google Scholar] [CrossRef]
  20. Steiner, F. Frontiers in urban ecological design and planning research. Landsc. Urban Plan. 2014, 125, 304–311. [Google Scholar] [CrossRef]
  21. Kim, J.; Lee, D.K.; Kim, H.G. Suitable trees for urban landscapes in the Republic of Korea under climate change. Landsc. Urban Plan. 2020, 204, 103937. [Google Scholar] [CrossRef]
  22. Lichtenthaler, H.K. Chlorophylls and carotenoids: Pigments of photosynthetic biomembranes. Methods Enzymol. 1987, 148, 50–382. [Google Scholar]
  23. Flexas, J.; Galmes, J.; Ribas-Carbo, M.; Medrano, H. The effects of water stress on plant respiration. In Plant Respiration: From Cell to Ecosystem, 1st ed.; Lambers, H., Ribas-Carbo, M., Eds.; Springer: Dordrecht, The Netherlands, 2005; Volume 8, pp. 85–94. [Google Scholar]
  24. Sreeharsha, R.V.; Mudalkar, S.; Sengupta, D.; Unnikrishnan, D.K.; Reddy, A.R. Mitigation of drought-induced oxidative damage by enhanced carbon assimilation and an efficient antioxidative metabolism under high CO2 environment in pigeonpea (Cajanus cajan L.). Photosynth. Res. 2019, 139, 425–439. [Google Scholar] [CrossRef]
  25. Gonçalves, A.; Silva, E.; Brito, C.; Martins, S.; Pinto, L.; Dinis, L.T.; Luzio, A.; Martins-Gomes, C.; Fernandes-Silva, A.; Ribeiro, C.; et al. Olive tree physiology and chemical composition of fruits are modulated by different deficit irrigation strategies. J. Sci. Food Agric. 2020, 100, 682–694. [Google Scholar] [CrossRef] [PubMed]
  26. Zhang, C.; Yi, X.; Gao, X.; Wang, M.; Shao, C.; Lv, Z.; Chen, J.; Liu, Z.; Shen, C. Physiological and biochemical responses of tea seedlings (Camellia sinensis) to simulated acid rain conditions. Ecotoxicol. Environ. Saf. 2020, 192, 110315. [Google Scholar] [CrossRef] [PubMed]
  27. Ors, S.; Ekinci, M.; Yildirim, E.; Sahin, U.; Turan, M.; Dursun, A. Interactive effects of salinity and drought stress on photosynthetic characteristics and physiology of tomato (Lycopersicon esculentum L.) seedlings. S. Afr. J. Bot. 2021, 137, 335–339. [Google Scholar] [CrossRef]
  28. Fiorani, F.; Schurr, U. Future scenarios for plant phenotyping. Annu. Rev. Plant Biol. 2013, 64, 267–291. [Google Scholar] [CrossRef] [PubMed]
  29. Peñuelas, J.; Filella, I. Visible and near-infrared reflectance techniques for diagnosing plant physiological status. Trends Plant Sci. 1998, 3, 151–156. [Google Scholar] [CrossRef]
  30. Das, A.J.; Wahi, A.; Kothari, I.; Raskar, R. Ultra-portable, wireless smartphone spectrometer for rapid, non-destructive testing of fruit ripeness. Sci. Rep. 2016, 6, 32504. [Google Scholar] [CrossRef] [PubMed]
  31. Heller, C.R.; Nunez, G.H. Preplant Fertilization Increases Substrate Microbial Respiration but Does Not Affect Southern Highbush Blueberry Establishment in a Coconut Coir-based Substrate. HortScience 2022, 57, 17–21. [Google Scholar] [CrossRef]
  32. Xavier, J. Effect of heavy metals on the pigmentation and photosynthetic capability in Jacobaea maritima (L.) Pelser & Meijden. Plant Sci. Today 2023, 10, 192–197. [Google Scholar]
  33. Matsumura, H.; Izuta, T. Effects of simulated acid rain on Asian trees. In Air Pollution Impacts on Plants in East Asia, 1st ed.; Izuta, T., Ed.; Springer: Tokyo, Japan, 2017; pp. 237–247. [Google Scholar]
  34. Hiscox, J.D.; Israelstam, G.F. A method for the extraction of chlorophyll from leaf tissue without maceration. Can. J. Bot. 1979, 57, 1332–1334. [Google Scholar] [CrossRef]
  35. Arnon, D.I. Copper enzymes in isolated chloroplasts. Polyphenoloxidase in Beta vulgaris. Plant Physiol. 1949, 24, 1–15. [Google Scholar] [CrossRef]
  36. Kohno, Y.; Matsumura, H.; Kobayashi, T. Effect of simulated acid rain on the development of leaf injury in tree seedlings. J. Jpn. Soc. Air Pollut. 1994, 29, 206–219. (In Japanese) [Google Scholar]
  37. Porra, R.J. The chequered history of the development and use of simultaneous equations for the accurate determination of chlorophylls a and b. Photosynth. Res. 2002, 73, 149–156. [Google Scholar] [CrossRef]
  38. Blackburn, G.A. Hyperspectral remote sensing of plant pigments. J. Exp. Bot. 2007, 58, 855–867. [Google Scholar] [CrossRef]
  39. Lee, K.C.; Kweon, H.; Sung, J.W.; Kim, Y.S.; Song, Y.G.; Cha, S.; Koo, N. Physiological response analysis for the diagnosis of drought and waterlogging damage in Prunus yedoensis. For. Sci. Technol. 2022, 18, 14–25. [Google Scholar] [CrossRef]
  40. Morrison, I.K. Acid rain, forests and forestry. In Sixth North American Forest Soils Conference; Stone, E.L., Ed.; University of Tennessee: Knoxville, TN, USA, 1983; pp. 209–219. [Google Scholar]
  41. Neufeld, H.S.; Jernstedt, J.A.; Haines, B.L. Direct foliar effects of simulated acid rain: I. Damage, growth and gas exchange. New Phytol. 1985, 99, 389–405. [Google Scholar] [CrossRef]
  42. Sant’Anna-Santos, B.F.; da Silva, L.C.; Azevedo, A.A.; de Araujo, J.M.; Alves, E.F.; da Silva, E.A.M.; Aguiar, R. Effects of simulated acid rain on the foliar micromorphology and anatomy of tree tropical species. J. Exp. Bot. 2006, 58, 158–168. [Google Scholar] [CrossRef]
  43. Ranjbarfordoei, A.; Samson, R.; Van Damme, P. Chlorophyll fluorescence performance of sweet almond [Prunus dulcis (Miller) D. Webb] in response to salinity stress induced by NaCl. Photosynthetica 2006, 44, 513–522. [Google Scholar] [CrossRef]
  44. Viljevac Vuletić, M.; Mihaljević, I.; Tomaš, V.; Horvat, D.; Zdunić, Z.; Vuković, D. Physiological response to short-term heat stress in the leaves of traditional and modern plum (Prunus domestica L.) cultivars. Horticulturae 2022, 8, 72. [Google Scholar] [CrossRef]
  45. Liu, M.H.; Yi, L.T.; Yu, S.Q.; Yu, F.; Yin, X.M. Chlorophyll fluorescence characteristics and the growth response of Elaeocarpus glabripetalus to simulated acid rain. Photosynthetica 2015, 53, 23–28. [Google Scholar] [CrossRef]
  46. Roháček, K.; Soukupová, J.; Barták, M. Chlorophyll fluorescence: A wonderful tool to study plant physiology and plant stress. In Plant Cell Compartments-Selected Topics; Schoefs, B., Ed.; Research Signpost: Kerala, India, 2008; pp. 41–104. [Google Scholar]
  47. Kozlowski, T.T.; Pallardy, S.G. Physiological Regulation of Vegetative Growth. In Growth Control in Woody Plants; Kozlowski, T.T., Pallardy, S.G., Eds.; Academic Press: SanDiego, CA, USA, 1997; Volume Physiological Ecology; pp. 73–165. [Google Scholar]
  48. Chaves, M.M.; Oliveira, M.M. Mechanisms underlying plant resilience to water deficits: Prospects for water-saving agriculture. J. Exp. Bot. 2004, 55, 2365–2384. [Google Scholar] [CrossRef] [PubMed]
  49. Zhang, Q.; Li, Q.; Zhang, G. Rapid determination of leaf water content using VIS/NIR spectroscopy analysis with wavelength selection. Spectrosc. Int. J. 2012, 27, 93–105. [Google Scholar] [CrossRef]
  50. Liu, J.; Han, J.; Chen, X.; Shi, L.; Zhang, L. Nondestructive detection of rape leaf chlorophyll level based on Vis-NIR spectroscopy. Spectrochim. Acta A Mol. Biomol. 2019, 222, 117202. [Google Scholar] [CrossRef] [PubMed]
  51. Jia, M.; Li, D.; Colombo, R.; Wang, Y.; Wang, X.; Cheng, T.; Zhu, Y.; Yao, X.; Xu, C.; Ouer, G.; et al. Quantifying chlorophyll fluorescence parameters from hyperspectral reflectance at the leaf scale under various nitrogen treatment regimes in winter wheat. Remote Sens. 2019, 11, 2838. [Google Scholar] [CrossRef]
  52. Zheng, W.; Lu, X.; Li, Y.; Li, S.; Zhang, Y. Hyperspectral identification of chlorophyll fluorescence parameters of Suaeda salsa in coastal wetlands. Remote Sens. 2021, 13, 2066. [Google Scholar] [CrossRef]
  53. Zhuang, J.; Wang, Q. Hyperspectral Indices Developed from Fractional-Order Derivative Spectra Improved Estimation of Leaf Chlorophyll Fluorescence Parameters. Plants 2024, 13, 1923. [Google Scholar] [CrossRef] [PubMed]
  54. López-Maestresalas, A.; Keresztes, J.C.; Goodarzi, M.; Arazuri, S.; Jarén, C.; Saeys, W. Non-destructive detection of blackspot in potatoes by Vis-NIR and SWIR hyperspectral imaging. Food Control 2016, 70, 229–241. [Google Scholar] [CrossRef]
  55. Braga, P.; Crusiol, L.G.T.; Nanni, M.R.; Caranhato, A.L.H.; Fuhrmann, M.B.; Nepomuceno, A.L.; Neumaier, N.; Farias, J.R.B.; Koltun, A.; Gonçalves, L.S.A.; et al. Vegetation indices and NIR-SWIR spectral bands as a phenotyping tool for water status determination in soybean. Precis. Agric. 2021, 22, 249–266. [Google Scholar] [CrossRef]
  56. Vergara-Díaz, O.; Chairi, F.; Vicente, R.; Fernandez-Gallego, J.A.; Nieto-Taladriz, M.T.; Aparicio, N.; Kefauver, S.C.; Araus, J.L. Leaf dorsoventrality as a paramount factor determining spectral performance in field-grown wheat under contrasting water regimes. J. Exp. Bot. 2018, 69, 3081–3094. [Google Scholar] [CrossRef] [PubMed]
  57. Ajayi, S.; Reddy, S.K.; Gowda, P.H.; Xue, Q.; Rudd, J.C.; Pradhan, G.; Liu, S.; Stewart, B.A.; Biradar, C.; Jessup, K.E. Spectral reflectance models for characterizing winter wheat genotypes. J. Crop Improv. 2016, 30, 176–195. [Google Scholar] [CrossRef]
  58. Nturambirwe, J.F.I.; Perold, W.J.; Opara, U.L. Classification learning of latent bruise damage to apples using shortwave infrared hyperspectral imaging. Sensors 2021, 21, 4990. [Google Scholar] [CrossRef] [PubMed]
  59. Salghuna, N.N.; Prasad, P.R.C.; Nidamanuri, R.R. Semi-empirical model for upscaling leaf spectra (SEMULS): A novel approach for modeling canopy spectra from in situ leaf reflectance spectra. Geocarto Int. 2021, 36, 1665–1684. [Google Scholar] [CrossRef]
  60. Degerickx, J.; Roberts, D.A.; McFadden, J.P.; Hermy, M.; Somers, B. Urban tree health assessment using airborne hyperspectral and LiDAR imagery. Int. J. Appl. Earth Obs. Geoinf. 2018, 73, 26–38. [Google Scholar] [CrossRef]
  61. Wei, S.; Yin, T.; Yuan, B.; Ow, G.L.F.; Yusof, M.L.M.; Gastellu-Etchegorry, J.P.; Whittle, A.J. Estimation of chlorophyll content for urban trees from UAV hyperspectral images. Int. J. Appl. Earth Obs. Geoinf. 2024, 126, 103617. [Google Scholar] [CrossRef]
  62. Qamar, F.; Sharma, M.S.; Dobler, G. The impacts of air quality on vegetation health in dense urban environments: A ground-based hyperspectral imaging approach. Remote Sens. 2022, 14, 3854. [Google Scholar] [CrossRef]
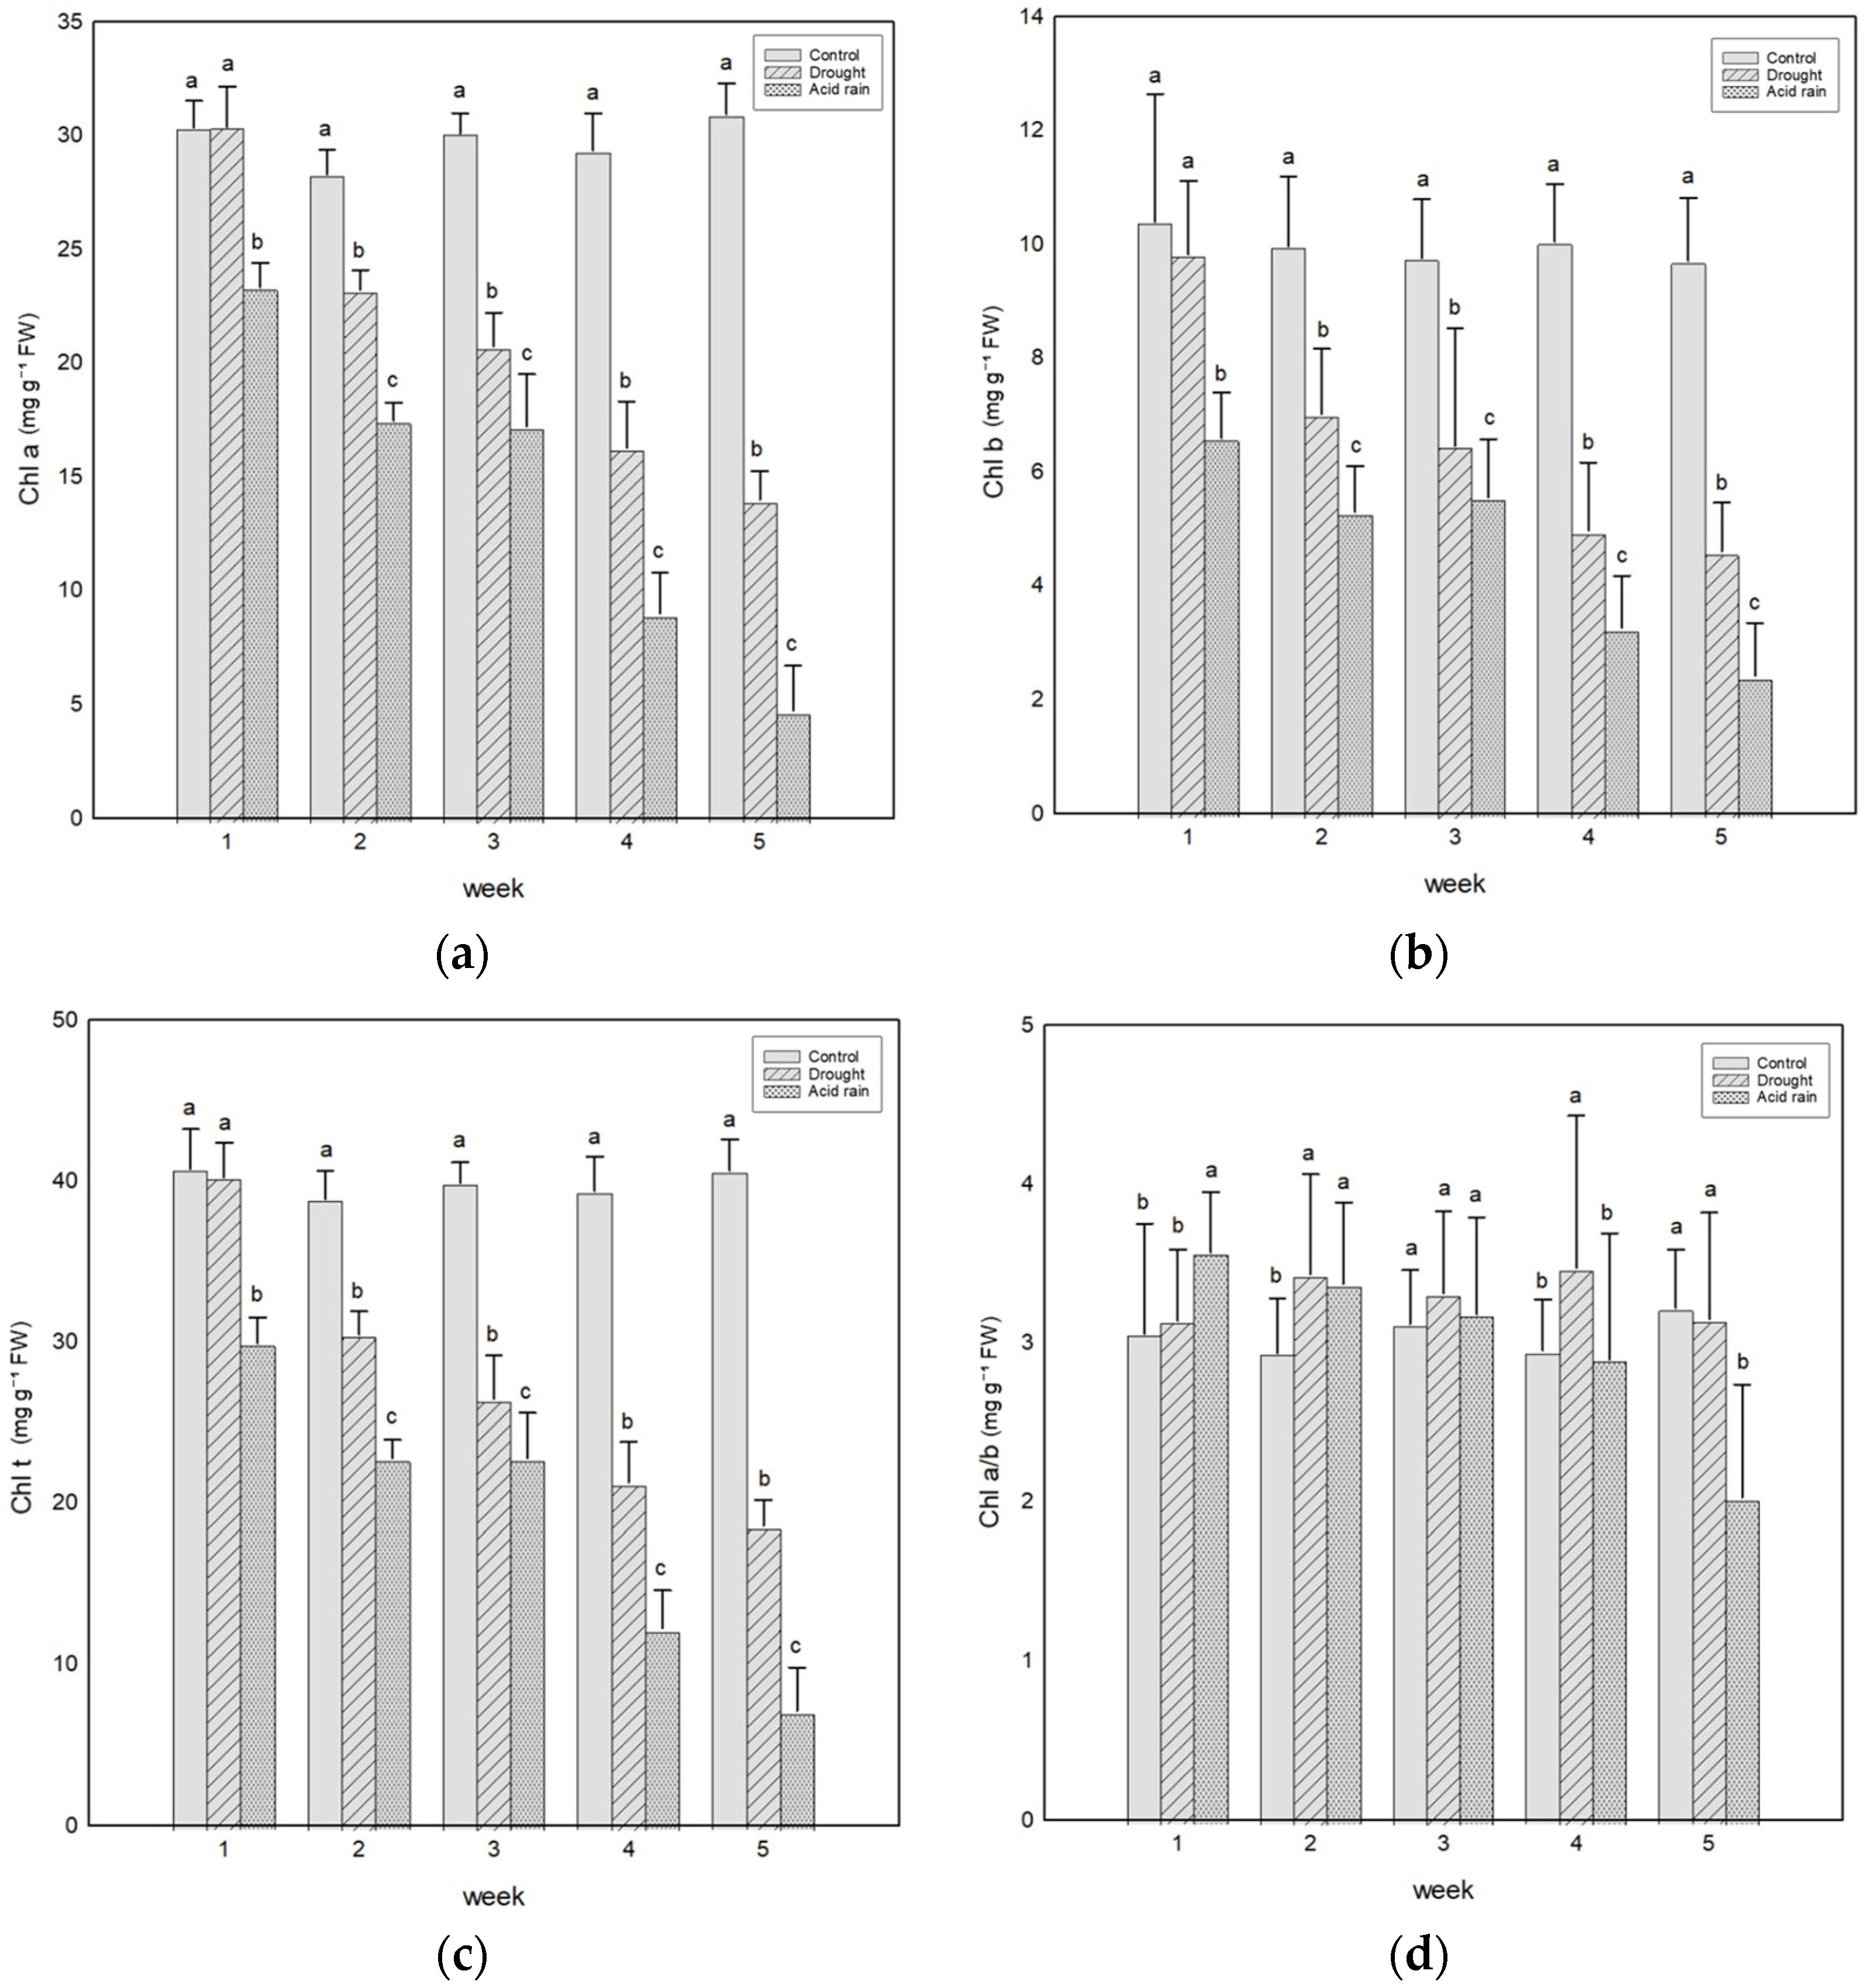
Figure 1. Change in chlorophyll contents of P. yedoensis under three treatments. (a): Chl a; (b): Chl b; (c): Chl t; (d): Chl a/b. Chl: chlorophyll; FW: fresh weight. Error bars (SD) with different letters are significantly different at p < 0.05, which were tested with one-way ANOVA test and Tukey HSD test.
Urbansci 08 00106 g001
Figure 2. Change in chlorophyll fluorescence of P. yedoensis under three treatments. (a): Fo; (b): Fm; (c): Fv/Fm. Fo: minimum fluorescence; Fm: maximum fluorescence; Fv/Fm: maximum PSII quantum yield; AU: arbitrary unit. Error bars (SD) with different letters are significantly different at p < 0.05, which were tested with one-way ANOVA test and Tukey HSD test.
Urbansci 08 00106 g002
Figure 3. Change in leaf water and gas exchange status of P. yedoensis under three treatments. (a): RWC; (b): Gs; (c): Ci; (d): WUE. RWC: relative water content; Gs: stomatal conductance; Ci: intercellular CO2 concentration; WUE: water use efficiency. Error bars (SD) with different letters are significantly different at p < 0.05, which were tested with one-way ANOVA test and Tukey HSD test.
Urbansci 08 00106 g003
Figure 4. VIP scores from PLS-DA model of stress treatments. (a): VIS raw spectra; (b) SWIR raw spectra; (c) VIS SNV spectra; (d) SWIR SNV spectra; (e) VIS SNV + S.G 2nd spectra; (f) SWIR SNV + S.G 2nd spectra.
Urbansci 08 00106 g004
Figure 5. Results of PCA using physiological parameters and selected bands from VIP scores. (a) Score plot of week 1; (b) loading plot of week 1; (c) score plot of week 2; (d) loading plot of week 2; (e) score plot of week 3; (f) loading plot of week 3; (g) score plot of week 4; (h) loading plot of week 4; (i) score plot of week 5; (j) loading plot of week 5. C (green): CK; D (blue): DT; A (red): SAT. r: raw; S: SNV; SS: SNV + S.G 2nd.
Urbansci 08 00106 g005aUrbansci 08 00106 g005bUrbansci 08 00106 g005c
Table 1. Performance for the CV classification model.
VISSWIR
RawSNVSNV
+ S.G 2nd
RawSNVSNV
+ S.G 2nd
Num. LVs384434
Sensitivity0.9350.9700.9450.8150.6800.850
Specificity0.8800.9000.8730.9130.9000.913
Class Error0.0930.0650.0910.1360.2100.118
Accuracy0.9230.9470.9350.8600.7730.880
VIS: visible ray; SWIR: short-wave infrared; SNV: standard normal variate; S.G 2nd: Savitzky–Golay 2nd derivative.
Table 2. Stress classification probability of weekly measurements.
Treatment
(Class)
WeekVISSWIR
RawSNVSNV
+ S.G 2nd
RawSNVSNV
+ S.G 2nd
CK
(Class 1)
10.7350.6870.5970.7330.6980.696
20.9030.9060.9090.8120.7790.798
30.9561.001.000.8070.7780.848
40.6850.9990.9990.8110.7640.934
50.9610.9630.9310.6240.6330.909
DT
(Class 0)
10.8350.8980.8610.6880.5360.715
20.6820.9590.7860.8460.7370.872
30.6800.8560.7380.9120.6550.846
40.7870.9650.9750.7390.7910.692
50.9140.9890.9850.8640.8370.852
SAT
(Class 0)
10.9860.9690.9840.1790.1830.786
20.9960.9970.9890.6870.5580.989
30.9740.9840.9780.9210.6990.967
40.8510.9160.9850.8330.8520.780
50.8680.9770.9460.9880.9060.940
VIS: visible ray; SWIR: short-wave infrared; SNV: standard normal variate; S.G 2nd: Savitzky–Golay 2nd derivative; CK: control; DT: drought treatment; SAT: simulated acid rain treatment. Non-stress is classified as Class 1, and stress (DT + SAT) is classified as Class 0. Value means the probability of each week spectra discriminated Class 0 or 1 from CV model.
Disclaimer/Publisher’s Note: The statements, opinions and data contained in all publications are solely those of the individual author(s) and contributor(s) and not of MDPI and/or the editor(s). MDPI and/or the editor(s) disclaim responsibility for any injury to people or property resulting from any ideas, methods, instructions or products referred to in the content.