
The Contribution of Open Source Software in Identifying Environmental Crimes Caused by Illicit Waste Management in Urban Areas


National Research Council of Italy, Water Research Institute, V.le F. De Blasio 5, 70132 Bari, Italy
*
Author to whom correspondence should be addressed.
Urban Sci. 2024, 8(1), 21; https://doi.org/10.3390/urbansci8010021
Submission received: 30 January 2024
/
Revised: 29 February 2024
/
Accepted: 18 March 2024
/
Published: 19 March 2024
Abstract
:This study focuses on the analysis, implementation and integration of techniques and methods, also based on mathematical algorithms and artificial intelligence (AI), to acquire knowledge of some phenomena that produce pollution with an impact on environmental health, and which start from illicit practices that occur in urban areas. In many urban areas (or agroecosystems), the practice of illegal waste disposing by commercial activities, by abandoning it in the countryside rather than spending economic resources to ensure correct disposal, is widespread. This causes an accumulation of waste in these areas (which can also be protected natural areas), which are then also set on fire to reduce their volume. Obviously, the repercussions of such actions are many. The burning of waste releases contaminants into the environment such as dioxins, polychlorinated biphenyls and furans, and deposits other elements on the soil, such as heavy metals, which, by leaching and percolating, contaminate water resources such as rivers and aquifers. The main objective is the design and implementation of monitoring programs against specific illicit activities that take into account territorial peculiarities. This advanced approach leverages AI and GIS environments to interpret environmental states, providing an understanding of ongoing phenomena. The methodology used is based on the implementation of mathematical and AI algorithms, integrated into a GIS environment to address even large-scale environmental issues, improving the spatial and temporal precision of the analyses and allowing the customization of monitoring programs in urban and peri-urban environments based on territorial characteristics. The results of the application of the methodology show the percentages of the different types of waste found in the agroecosystems of the study area and the degree of concentration, allowing the identification of similar areas with greater criticality. Subsequently, through network and nearest neighbour analysis, it is possible to start targeted checks.
1. Introduction
Managing waste from commercial activities within a city represents a crucial challenge to ensure a healthy and sustainable environment. Often, commercial activities generate a significant amount of waste which, if not managed properly, can lead to public health and environmental problems [1,2]. Lack of awareness and sustainable practices can also contribute to the increase in the volume of non-recyclable waste that has to be sent to landfills with high costs. To address these aspects, local administrations should more aggressively promote clear policies and regulations to incentivize companies to adopt responsible and sustainable waste management practices. Awareness and training projects can play a fundamental role in educating companies on the correct disposal of waste and the adoption of reduction and recycling practices [3,4,5]. Collaboration between local authorities, businesses and the community is essential to effectively address the problem; tax incentives for those who adopt sustainable policies and sanctions for those who do not comply with regulations can constitute a further stimulus for responsible waste management. Addressing the waste problem, therefore, requires an integrated approach and the active participation of all interested parties to ensure a cleaner and more resilient city.
In the context of environmental crimes relating to waste disposal, some sectors have stood out for known cases of incorrect behaviour. The problem of the improper disposal of used tyres has emerged, often abandoned in inappropriate places, causing environmental and health risks [6,7,8]. Others have also been involved in the illegal dumping of construction waste, contributing to soil and water pollution [9,10]. In the textile industry, incidents of uncontrolled disposal of harmful chemicals have occurred, raising concerns about water quality and public health [11]. Even those who use toxic colours and solvents have often violated environmental regulations, compromising the quality of air and soil [12,13].
These cases highlight the need to strengthen controls and sanctions to discourage illegal practices. The uncontrolled abandonment of hazardous waste in the city and in peri-urban areas that belong to agroecosystems can have serious consequences for the environment, with significant impacts not only on public health, but also on water, soil and ecosystem services. These wastes, containing harmful chemicals, can cause a variety of problems, including:
- Soil degradation due to the presence of chemicals in hazardous waste, which can infiltrate the soil, compromising its quality. This can affect plant growth, compromise soil fertility and lead to long-lasting problems for agriculture [18];
It is imperative to monitor the phenomena occurring in such peri-urban areas to gain insights into their causes and optimize available resources, both in terms of manpower and tools. Understanding the origins of these phenomena is essential for effective management and mitigation strategies. By allocating resources efficiently, it is possible to enhance the ability to address environmental challenges and promote sustainable development in these areas. Through systematic monitoring and analysis, it is possible to identify key drivers of change and implement targeted interventions to minimize negative impacts on human and ecosystem health.
To monitor the spatial distribution of these phenomena that compromise the quality of environmental matrices, it is certainly useful to use a Geographic Information System (GIS). It is a software-based platform that integrates geographic data and textual attributes to analyse, interpret and visualize information about specific locations. This tool allows you to map, manage and analyse geospatial data, resulting in a more in-depth knowledge of the territory useful from various points of view. Creating a database that stores information on environmental crimes over time through a GIS is of fundamental importance for several reasons. First, a GIS database allows you to record the precise location of each environmental offence, facilitating the identification of spatial patterns and trends over time [23]. This information is crucial for understanding the geographic spread of environmental problems and for developing targeted intervention strategies. Furthermore, a GIS allows you to integrate data from various sources, providing a complete and interconnected view of the situation. Mapping environmental crimes through GIS software also helps assess the extent of impact on human health, water, soil and biodiversity in different residential and peri-urban areas. This supports resource planning for environmental restoration operations over time. Sharing and facilitating access to data through a GIS system promotes collaboration between local authorities, environmental organizations and the community, contributing to a more effective and transparent management of environmental issues. A GIS geodatabase for monitoring environmental crimes represents a crucial tool for sustainable environmental management.
OpenStreetMap (OSM) is a collaborative, open-source geographic database that contains information about streets, buildings, points of interest, and more around the world [24]. OSM’s goal is to create a free and clear map of the world, accessible to anyone [25]. The OSM database consists of a vast collection of geographic data collected by a global community of users. This data can be used to create custom maps, navigation applications and more. OSM users can add new elements to the map, such as roads, buildings and points of interest, using an intuitive web interface. Additionally, data can be downloaded in various formats to be used in external applications. OSM’s database is completely open and free, meaning anyone can access the data and use it for any purpose. OSM has become a valuable resource for many projects, including urban planning, emergency management and GPS navigation. Additionally, many companies use OSM data to improve their maps and applications. OSM is a collaborative and open-source geographic database that offers a vast range of geographic data that is free and accessible to all, and whose data can be used for various purposes, including those related to understanding illicit waste abandonment phenomena.
Crime mapping is a practice that mainly uses GIS and geodatabase tools to visualize and analyse data relating to crime in a specific geographical area. This technique allows the spatial distribution of mapped crimes, allowing law enforcement and analysts to identify patterns and trends. By identifying clusters of criminal activity, crime mapping can be useful for identifying risk areas and optimizing the distribution of resources, as well as predicting the location of certain crimes using artificial intelligence algorithms (AI) [26,27]. When it comes to identifying perpetrators, crime mapping can integrate additional data such as surveillance cameras or eyewitness testimony to identify potential suspects. Furthermore, through the analysis of temporal and spatial patterns of past criminal activities, crime mapping can help predict possible illicit actions, helping authorities focus their attention on certain critical areas and periods. Crime mapping proves to be a valuable tool for improving crime prevention, identifying those responsible and predicting illegal activities.
The crime mapping activity is also supported by the practice of Open Source Intelligence (OSINT), which consists of an information collection approach that exploits public data sources accessible to anyone [28]. It is an analysis process that relies on information from open sources, such as websites, social media, news reports, public documents such as public government reports, and grey literature such as technical reports and business documents, to gain an in-depth understanding. OSINT is particularly used in security, intelligence and investigations, offering a transparent and open methodology to acquire relevant data without depending exclusively on secret sources. The practice of OSINT is critical in a digitalized era, where access to public information can play a key role in risk assessment, threat analysis and informed decision-making.
Open Source Intelligence (OSINT) has proven to be a valuable tool in identifying polluters in numerous cases. For example, through monitoring social media and online reports, it was possible to identify companies or individuals responsible for illegal discharges of harmful substances into waterways. In some cases, satellite images have provided crucial evidence to locate illegal landfill sites and identify those responsible [29]. Furthermore, OSINT analysis has helped gather information on uncontrolled toxic waste disposal practices by industries, allowing authorities to intervene promptly. Reviewing public documents, such as environmental permits and regulatory agency reports, through open sources has helped identify violations of environmental regulations. In some contexts, the community itself, through online reporting and photographic documentation, has played an active role in revealing illicit activities responsible for pollution [30].
A significant example of such activities is Bellingcat [31]. It is an independent investigative organization that uses open sources and digital analysis techniques to investigate international events, conflicts and human rights violations. Founded in 2014, Bellingcat became known for its investigations into the poisoning cases of Sergei Skripal and Alexei Navalny, as well as human rights abuses in Syria and Yemen. The organization uses a wide range of open sources, including satellite imagery, online video and social media information, to create detailed and accurate reporting.
This scientific article reports an innovative approach that highlights the possible combination of open data and open source software. This approach stands out for its novelty in leveraging these technologies together. The main objective is to provide comprehensive support for the crucial task of identifying individuals or entities responsible for environmental pollution. By utilizing open data and open source software tools, a transparent and accessible framework for tracking and analysing environmental data is offered. This methodology enables not only the identification of pollution sources, but also facilitates the implementation of effective measures to control and mitigate the effects of pollution in agroecosystem areas. Thus, our work represents a significant advancement in addressing environmental challenges by harnessing the power of open technologies for greater transparency, accountability and environmental management.
2. Materials and Methods
In this section, various aspects, including the study area’s geographical and environmental characteristics, the field activities undertaken, and the systematic data processing workflow applied for comprehensive analysis and interpretation of the results, are reported.
2.1. Study Area
The Puglia region is located in the south-east of Italy, and covers an area of approximately 19,000 km2. It is a very populous region, with a density of around 200 inhabitants per km2. The Apulian territory is characterized by a varied landscape, ranging from the splendid coasts of the Adriatic Sea and the Ionian Sea to the hills and mountains of the hinterland.
The territory is characterized by a strong presence of businesses of various types; in particular, it stands out for the presence of numerous companies active in the agri-food, manufacturing, textile, mechanical and advanced technology sectors.
The main industrial areas are concentrated in the provincial capitals, where numerous companies active in the manufacturing, mechanical, energy and advanced technology sectors are located. Among these, Taranto is of notable importance for its industrial centre, with a strong presence of companies active in the steel, chemical and petrochemical sectors.
2.2. On-Field Mapping Activities
The mapping activities of a potentially polluted site start both following reports and following routine monitoring activities. Once on the site, its main characteristics are noted, such as the nature of the soil, variations in the terrain (such as differences in height or water courses), the position of any relevant elements (such as wells or cisterns) and, naturally, a first description of the different types of waste encountered. It is necessary to use tools such as GPS to obtain precise and georeferenced measurements. Once all the necessary data has been collected, it is possible to proceed with the creation of the map using cartography software. At this stage, it is important to verify the precision of the data collected and correct any errors before finalizing the map (Figure 1).
2.3. Creation of the Interoperability ICT Platform for the Acquired Data
All of the different formats of acquired data are registered into in the ICT platform for data management, which allows them to be processed. The created ICT-platform allows you to manage and integrate data from different sources and formats, ensuring compatibility and interoperability between them. This type of system is particularly useful when having to work with data coming from different systems or with different formats to simplify data management, reducing processing times and costs and improving work efficiency.
The ICT platform created for this specific purpose is an application based on GNU/Linux server with a MySQL database, and uses computer technologies, programming languages and libraries such as VFront, PHP, JavaScript and Python. It offers a robust and flexible approach to developing dynamic and interactive web systems. Choosing a GNU/Linux operating system provides a stable and secure platform, optimized for running web servers. MySQL is a reliable open-source database that allows you to effectively and scalably manage application data. Using VFront as a graphical interface for the database simplifies data management and visualization, making it easier to create forms and queries, while PHP is a server-side scripting language providing effective interaction between the front end and the application backend. JavaScript integration helps create a more dynamic and interactive user experience, improving application responsiveness without requiring full-page refreshes. Finally, the use of Python can be exploited to implement advanced features related to data management with a spatial component by interfacing with the GDAL libraries and for the automation of processes on the server.
The architecture based on open-source technologies promotes community collaboration, code transparency and reduced licensing costs. Furthermore, the combination of these technologies offers a versatile and scalable development environment, providing a solid foundation for creating a powerful and efficient web application.
2.4. Data Processing Workflow
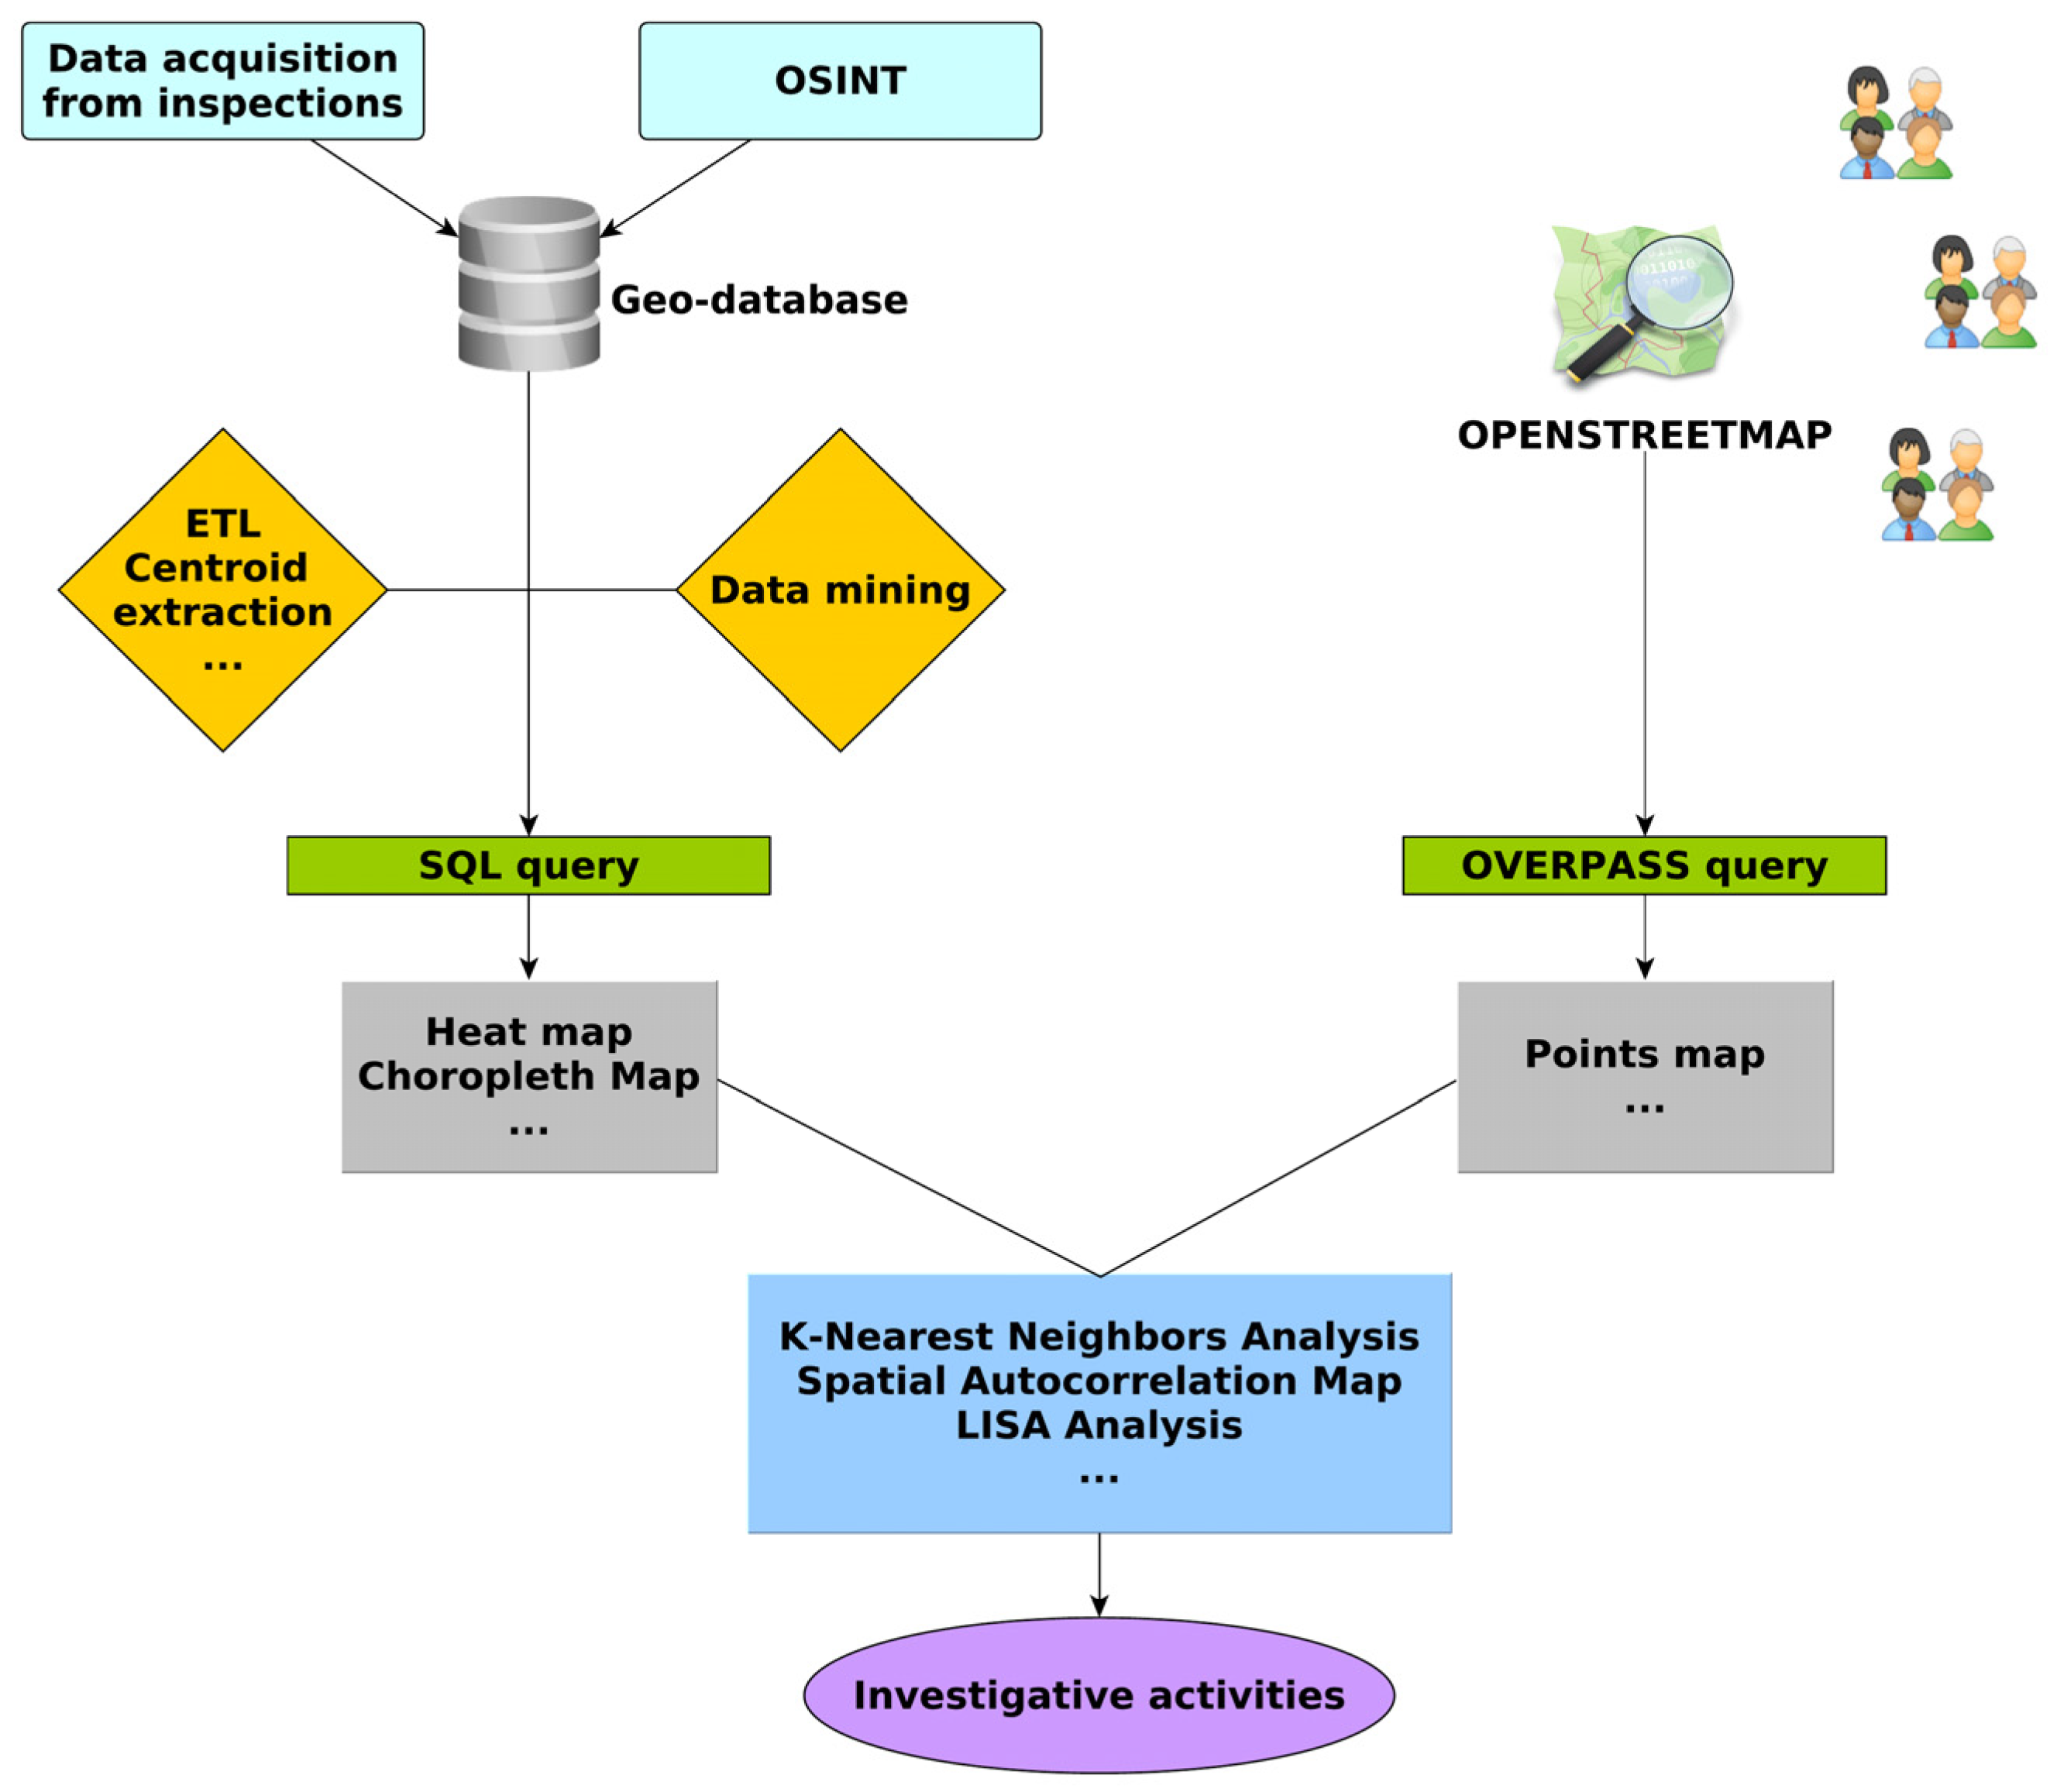
The workflow followed is shown below (Figure 2).
The workflow reports the developed analysis methodology: first of all, the acquisition of data can take place both following field inspections and the application of OSINT techniques in the field of environmental crimes [32], and also using the open data of the OpenStreetMap project [33]. These algorithms are designed to extract meaningful information from a wide range of sources, including social media, websites, online forums and more. A common example of an OSINT algorithm is the web data extraction algorithm, which uses web scraping techniques to collect information from public web pages [34,35].
Subsequently, with the application of suitable data processing techniques, the different sources of information can produce thematic maps, for example, heat or choropleth maps, but also maps of points with georeferenced attributes.
The next phase involves the integration of the obtained maps and the application of data analysis techniques, for example, network and distance analysis in order to start targeted investigative activities. In this phase, AI algorithms can also be used for the classification of homogeneous areas and, therefore, to concentrate the investigations on multiple areas characterized by comparable situations [36]. If historical data is available, forecasting algorithms can also be applied [27] based on machine learning [26].
Some examples of processing that may be useful for these purposes are shown below.
2.4.1. How to Build a Very Simple Query for OSM
The basic structure of a query in Overpass, the programming language based on the C programming language useful for creating queries on OSM data, is composed of three main parts: the prefix, the body and the suffix. The prefix defines the type of data you want to retrieve from the map. For example, if you want to obtain all nodes, you use the prefix “node”. Other common prefixes include “way” for streets and “relation” for relationships. The body of the query specifies the search criteria to filter the desired data. This may include filters based on geographic location, tag type, or other properties of items on the map. The suffix defines how the data should be returned by the query. For example, you can specify whether you want to obtain only the IDs of the corresponding items, or also other information such as geographical coordinates or associated tags.
Here is an example of a simple Overpass query that retrieves all nodes with the tag “shop” that correspond to tire dealers in the specified area:
- [out:json];
- (
- node[“shop”=“tyres”];
- way[“shop”=“tyres”];
- relation[“shop”=“tyres”];
- );
- out center;
In this example, ‘[out:json]’ indicates that you want the results in the format JSON. ‘node[“shop”=“tyres”]’ filters only nodes with the tag “shop”=“tyres”. In the end, “out;” indicates that you want to return all attributes of the matching nodes. You can combine multiple filters and options to create more complex and detailed queries in Overpass [37].
Subsequently, it is possible to carry out, depending on your needs, various further processing, as described below. Some examples of further elaborations are provided in the next paragraphs.
2.4.2. Heat Map
Heat maps are graphical representations that show the distribution of certain data or values on a map or grid. Areas with higher values are usually represented with warm colours (such as red or orange), while areas with lower values are represented with cool colours (such as blue or green). Heat maps are often used to analyse and visualize geographic data, such as population density or the distribution of a particular phenomenon over a specific geographic area.
2.4.3. Choropleth Map
The choropleth map represents geographical data through the colouring of geographical areas based on the values of a specific variable. This technique offers an immediate visualization of the spatial variations of a feature, making it easy to understand patterns and differences in the geographic distributions of the data.
2.4.4. Nearest Neighbours Clusters Map
The nearest neighbours cluster map identifies groups of geographic points close to each other. This technique uses spatial distance to identify similar data aggregations, helping to identify patterns and structures in a geographic context.
2.4.5. Spatial Autocorrelation Map
The spatial autocorrelation map examines the spatial relationship between observations of a variable. It shows whether similar objects tend to concentrate or disperse in a specific geographic space, highlighting patterns that can be relevant for analysis and decisions.
2.4.6. K-Nearest Neighbours Analysis
K-nearest neighbours analysis evaluates the relationship between a point and its k closest points in space. This technique is often used to classify or predict values based on the characteristics of surrounding points.
2.4.7. Local Indicators of Spatial Autocorrelation (LISA) Analysis
LISA analyses local spatial autocorrelation, identifying specific areas where clusters of similar values are observed. It helps identify areas with significant patterns of similarity or dissimilarity to surrounding areas.
3. Results of a Case Study
As a case study, some elaborations carried out on a very current topic in the territory of the Puglia Region are reported. The focus is on the abandonment of waste produced by commercial activities in peri-urban areas affected by the presence of agroecosystems whose quality constantly risks being compromised. In the Puglia Region, there is an active database that contains monitoring data of the sites in the area affected by the presence of abandoned waste. Information relating to the type and quantity of waste is recorded on these sites. In total, to date, there are 1778 sites, each characterized by its extension and various types of waste. The breakdown by province is shown in Figure 3. From the processing of the dataset, it is possible to deduce that this phenomenon occurs in peri-urban areas, especially up to approximately 1 km from the town (over 90% of cases). The waste mainly recovered is municipal waste subject to separate collection (95%), construction waste (80%), WEEE (70%), tyres (60%), textile and packaging waste (50%), asbestos (40%), batteries and accumulators (30%), cars (10%), and other (10%).
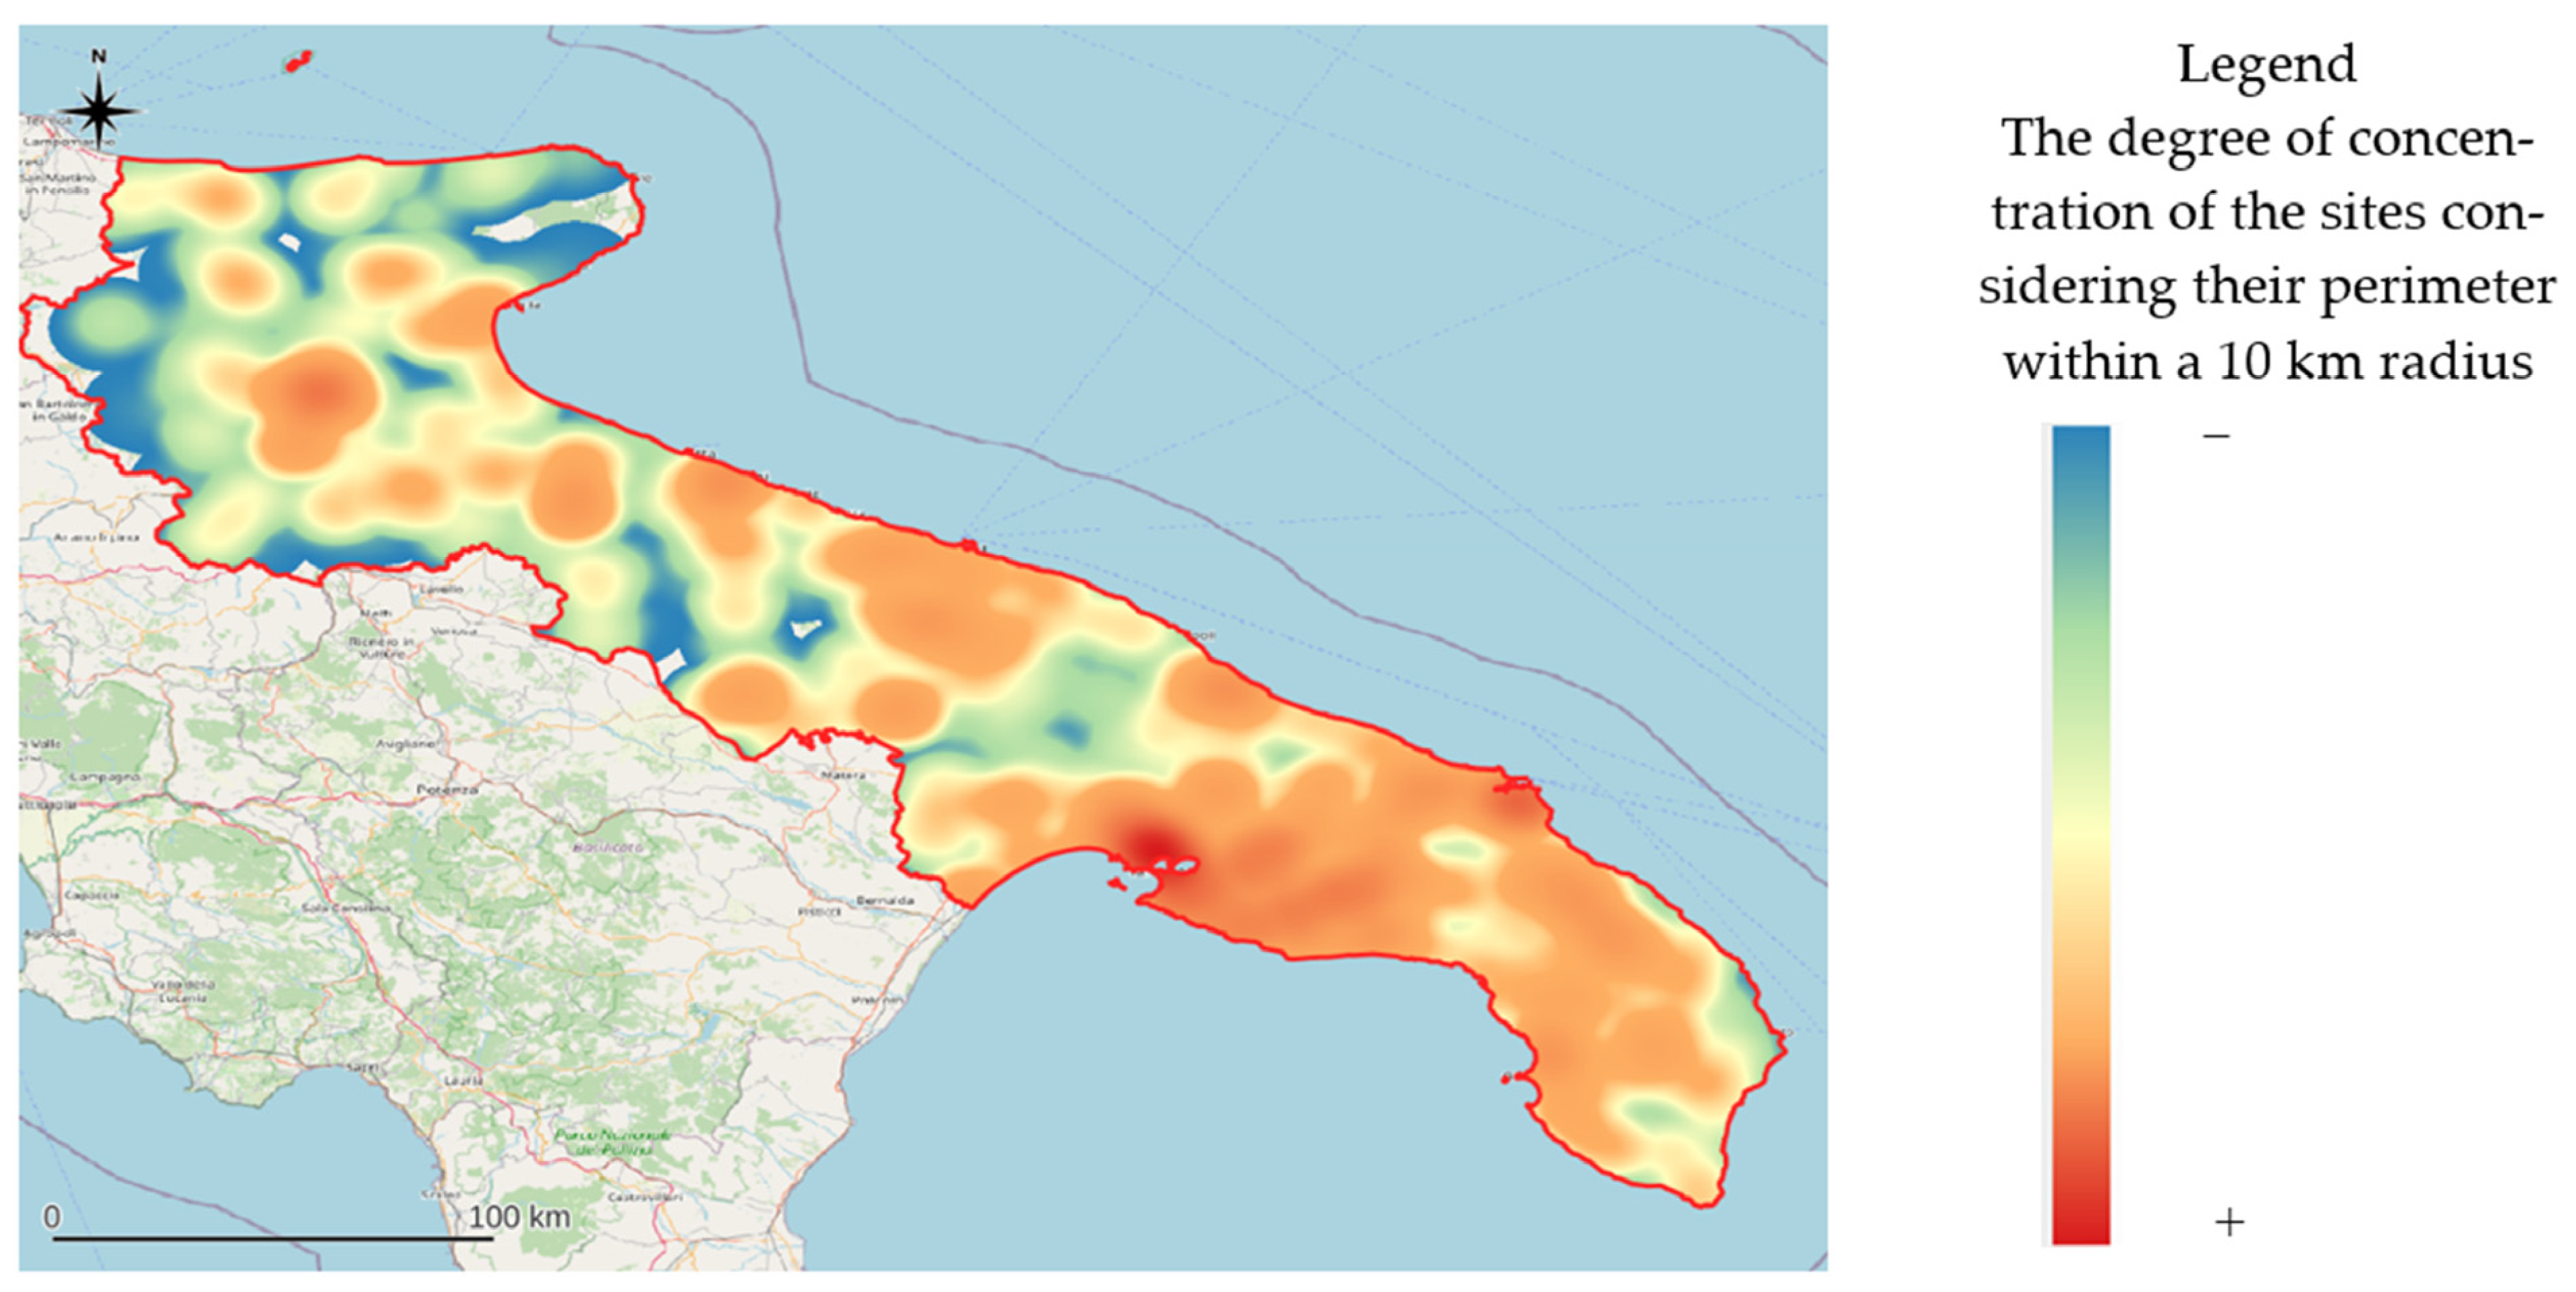
This result allows us to process the information by extracting its centroid from each geometry to associate the information relating to the perimeter from the area. It is thus possible to create heat maps considering a radius of 10 km; the result is shown in Figure 4. Subsequently, by generating contour lines, it is possible to obtain a perimeter of the areas in the regional territory most affected by this sad phenomenon (Figure 5).
Subsequently, by processing this data in the form of a choropleth map, it is possible to identify a scale of emergencies and, therefore, be able to tackle the problem by concentrating on each municipal limit. The advantage of this approach is that tackling a problem at a municipal level, guided by the determination of a single mayor, represents a decidedly more effective strategy than fragmented management by several mayors in overlapping territories. The coherence of actions taken by a single mayor eliminates potential conflicts arising from territorial overlaps, creating an environment in which resources and efforts can be directed more effectively. Figure 6 shows the classification with the Choropleth map and the overlap with the previously identified areas. This allows the identified areas to be extended by including more administrative limits to better manage the problem.
In addition, the results obtained through the application of the LISA Analysis are reported (Figure 7). The main interpretation to give to this result is related to the identification of homogeneous areas in which these problems must be addressed coherently.
Subsequently, always using these information levels and extracting useful information, i.e., the sites containing waste such as tyres, textiles and construction waste, it is possible to create a layer of points where these types of waste are mainly found. Now, by extrapolating the information of interest from OSM, i.e., the commercial activities that produce these materials, a distance analysis based on the network analysis [38] method can be carried out. In Figure 8, the results of this analysis in cartographic form are reported.
From the simplified graphic display alone, it is possible to identify the proximity relationships between types of activities and waste found. Of course, this result does not constitute proof, but at least it is a useful indication to guide the investigations of the police. It is, therefore, possible to optimize resources (time and men) for specific investigations.
4. Discussion
The applications of GIS techniques and methodologies to identify those responsible for pollution and improve waste management play a crucial role in promoting sustainable environmental practices [39]. The use of geographic information systems (GIS) allows a visual and analytical representation of the sources of pollution, facilitating the identification of those responsible through the detailed mapping of industrial activities, discharge points and areas of high environmental risk [40,41].
The ability to analyse the spatial distribution of waste using GIS contributes significantly to the efficient management of landfills and the monitoring of waste production [42]. Mapping areas of illegal disposal allows the authorities to intervene promptly, limiting the environmental impact and identifying any regulatory violations.
The integration of temporal data in the GIS context allows you to follow the evolution of activities and environmental impacts over time. This dynamic approach offers a comprehensive view of trends, allowing you to anticipate potential problems and adopt preventive strategies to improve waste management and reduce pollution.
Furthermore, geographical analysis through GIS allows for the evaluation of the environmental impact of human activities, contributing to a better understanding of the cause–effect relationships between industrial activities and the effects on the surrounding ecosystem. This supports informed decisions and more effective environmental policies [43].
Environmental Impact Assessment (EIA) of human activities on water and soil resources is a key process for understanding and mitigating the negative effects of human activities on the environment. Factors such as pollution due to landfills, including illegal ones, industrial, agricultural or urban waste, variation in water flow and excessive withdrawal of water resources are considered. Similarly, in soil EIA, impacts such as contamination by chemicals, loss of fertility and destruction of natural habitat are assessed. The EIA process supports informed decisions through the collection and analysis of detailed data, based on which potential environmental impacts are identified. This data feeds predictive models that evaluate the occurrence of impacts under different conditions. This approach allows decision-making bodies to implement preventive or corrective measures, improving the sustainability of human activities [44,45,46].
Prediction of the quality of environmental matrices, such as air, water or soil, constitutes an innovative and crucial approach to monitoring the effectiveness of environmental measures and controls. Through the application of artificial intelligence (AI) algorithms, it is possible to develop predictive models that anticipate changes in environmental quality, allowing continuous and real-time evaluation of the effectiveness of the strategies adopted. Machine learning algorithms, including those based on neural networks and regression models, can analyse historical and real-time data to identify complex patterns and correlations. This allows us to anticipate changes in environmental quality, evaluate the impact of implemented measures, and identify specific areas where these measures may need further adaptation. The use of AI in environmental forecasting allows for more dynamic and reactive management, improving the timeliness of responses to changes in environmental matrices [47]. For example, in the case of a sudden increase in pollutants, algorithms can identify the source and suggest immediate corrective actions. This approach in the city context can be easily achieved through the creation of Digital Twin [48]. AI-powered predictive models not only verify the effectiveness of environmental measures and controls, but also support future planning, allowing authorities and organizations to adapt their strategies to constantly improve the quality of the environment [49].
In addition, the use of data mining techniques to detect the presence of contaminant associations represents an innovative and advanced approach to the management of environmental resources and risk analysis [50]. Through data mining algorithms, it is possible to explore large sets of environmental data, identifying complex patterns and correlations between different contaminants. These predictive models allow us to recognize associations that are not evident through traditional approaches, providing a more complete view of the complexity of pollution. The ability to identify associations of contaminants is fundamental for the timely and targeted management of environmental resources. Data mining allows for the identification of synergistic or antagonistic interactions between pollutants, allowing authorities to focus monitoring and mitigation efforts where they are most needed. Furthermore, environmental risk analysis benefits greatly from data mining, which provides a solid basis for evaluating the cumulative consequences of different contaminant associations. This approach improves the precision of risk estimates, allowing for more effective and targeted management of critical environmental situations.
Remaining in the field of AI, the further implementation of computer vision algorithms for monitoring urban ecosystems represents a fundamental resource to support the conservation and sustainable management of natural resources [51] compatible with the growth needs of an urban environment. Through the analysis of images and data relating to aquatic and terrestrial habitats, computer vision offers an advanced approach to assessing the state of urban ecosystems. Thanks to these algorithms, it is possible to rapidly detect changes in environmental characteristics, identify plant or animal species, and evaluate urban biodiversity. Computer vision allows you to automate the monitoring process, reducing the manual workload and allowing broader and more timely coverage of the areas of interest. Monitoring urban ecosystems through computer vision not only provides real-time data on environmental health, but also supports the design of targeted conservation strategies [52]. For example, the identification of critical habitats or the assessment of the impacts of human activities becomes more efficient, allowing for more careful and sustainable management of natural resources [53,54].
Crime mapping activities with the production of choropleth maps, which visually represent the spatial distribution of crimes in a specific area, are fundamental for the strategic installation of cameras and the prediction of crimes, thus contributing to sustainable urban. Through the analysis of crime mapping data, authorities can identify high-risk areas and focus the installation of cameras in strategic locations, improving surveillance and deterring potential criminal activity.
The production of choropleth maps, which represent the density of crime in specific geographical areas, offers a clear view of criminal trends over time, allowing for more accurate prediction of future events [55]. These maps can inform urban planning, allowing authorities to take targeted preventive measures and optimize resources for more efficient and sustainable management of the urban environment. Furthermore, community engagement through visual information facilitates safety awareness, promoting active participation in building safer and more resilient communities.
Through this practice, it is possible to model and predict chronic hot spots using Kernel Density Smoothing. Kernel Density Smoothing (KDS) is a widely utilized technique for spatial data smoothing. In the realm of crime prediction, this approach accommodates the stochastic nature of future crime locations by assuming that forthcoming crimes will likely transpire in proximity to existing ones, following a spatial distribution or probability that diminishes with increasing distance from current crime locations. In addition, it is possible to develop early warning methods based on GIS crime maps. This represents an innovative and effective approach to preventing crime. Using GIS, crime data can be analysed and mapped to identify spatial and temporal patterns. By integrating spatial analysis techniques with predictive models, it is possible to identify areas at risk and predict potential criminal hotspots. Early warning methods based on GIS maps allow law enforcement to make informed decisions and efficient allocation of resources, improving the timeliness of emergency responses and facilitating active crime prevention. These advanced approaches provide detailed insight into criminal dynamics, enabling proactive management to create safer and more resilient communities [56,57,58,59].
5. Conclusions
In this work, a data processing workflow has been developed based on open data and open source software to provide valuable insights supporting investigations by law enforcement agencies in identifying the culprits that illegally dispose of waste from various commercial activities, thus causing significant harm to human and ecosystem health. Using open data and open source software, this approach ensures transparency, accessibility, and cost-effectiveness in analysing and interpreting data. This innovative workflow empowers law enforcement efforts by facilitating the detection of patterns and trends indicative of illicit waste disposal practices. This approach enhances our ability to safeguard public health and preserve the integrity of ecosystems.
The application of GIS techniques in identifying polluters and improving waste management not only provides a detailed picture of environmental issues, but is also a proactive tool to promote more sustainable and conscious practices, contributing to environmental protection long-term. These tools are also very useful in the environmental impact assessment on water and soil resources, which is essential to sustainably manage anthropic activities, promoting informed decisions that take environmental impacts into account and favour harmonious coexistence between the development of humankind and the conservation of natural resources. Addressing multidimensional problems with tools capable of considering the “big picture” is essential in the complex and interconnected era in which we live in close connection with the environment. Contemporary problems, such as climate change, sustainability and public health, are inherently multidimensional, involving multiple variables and interactions. Approaches that take into account the big picture, such as AI associated with data viewable in a GIS environment, offer a complete vision, allowing you to understand the complexity of the challenges and adopt more effective solutions.
From the reported case study, it is possible to infer that integrating technologies such as spatial machine learning allows you to analyse large data sets and predict future patterns based on complex spatial relationships. The use of advanced algorithms for spatial analysis can reveal hidden trends, supporting informed decisions and planning strategies. Multidimensional tools, such as integrated models and geographic information systems, allow you to analyse complex data, highlight relationships and understand dynamics that might otherwise be missed. Addressing the big picture facilitates long-term planning and the prevention of unintended consequences. Multidimensional problems often have transversal impacts on different areas, and only by addressing them in their entirety can we hope to implement sustainable and resilient solutions over time.
On the other hand, the use of artificial intelligence techniques presents several drawbacks and challenges: there are worries regarding the potential for AI systems to perpetuate biases or discrimination, especially in decision-making processes. Furthermore, there are ethical dilemmas surrounding the accountability and transparency of AI algorithms, which can impact trust and acceptance among users and stakeholders.
Author Contributions
Conceptualization, C.M. and V.F.U.; methodology, C.M.; software, C.M. and V.F.U.; validation, C.M. and V.F.U.; formal analysis, C.M.; investigation, V.F.U.; resources, V.F.U.; data curation, C.M.; writing—original draft preparation, C.M. and V.F.U.; writing—review and editing, C.M. and V.F.U.; visualization, C.M. and V.F.U.; supervision, C.M. and V.F.U.; project administration, V.F.U.; funding acquisition, V.F.U. All authors have read and agreed to the published version of the manuscript.
Funding
This research was funded by the Collaboration Agreement between the Puglia Region, the Police Forces, and IRSA-CNR for the monitoring of polluted sites.
Data Availability Statement
The datasets presented in this article are not readily available because the data is confidential.
Conflicts of Interest
The authors declare no conflicts of interest.
References
- Noor, T.; Javid, A.; Hussain, A.; Bukhari, S.M.; Ali, W.; Akmal, M.; Hussain, S.M. Types, sources and management of urban wastes. Urban Ecol. Emerg. Patterns Soc. Syst. 2020, 239–263. [Google Scholar] [CrossRef]
- Déportes, I.; Benoit-Guyod, J.L.; Zmirou, D. Hazard to man and the environment posed by the use of urban waste compost: A review. Sci. Total Environ. 1995, 172, 197–222. [Google Scholar] [CrossRef] [PubMed]
- de Magalhães, R.F.; Danilevicz, Â.D.M.F.; Saurin, T.A. Reducing construction waste: A study of urban infrastructure projects. Waste Manag. 2017, 67, 265–277. [Google Scholar] [CrossRef] [PubMed]
- Henden Şolt, H.B. Evaluation of the Zero Waste Project in Istanbul District Municipalities from the Perspective of Sustainable Urban Planning. Sustainability 2023, 15, 11896. [Google Scholar] [CrossRef]
- Cointreau, S.J. Environmental Management of Urban Solid Wastes in Developing Countries: A Project Guide (Technical Report); International Bank for Reconstruction and Development: Washington, DC, USA, 1982. [Google Scholar]
- Teerioja, N.; Moliis, K.; Kuvaja, E.; Ollikainen, M.; Punkkinen, H.; Merta, E. Pneumatic vs. door-to-door waste collection systems in existing urban areas: A comparison of economic performance. Waste Manag. 2012, 32, 1782–1791. [Google Scholar] [CrossRef] [PubMed]
- Farré, J.A.; Mateu, C.; Teixidó, M.; Cabeza, L.F. Pneumatic Urban Waste Collection Systems: A Review. Appl. Sci. 2023, 13, 877. [Google Scholar] [CrossRef]
- Lindner, C. Global Garbage: Urban Imaginaries of Waste, Excess and Abandonment; Taylor & Francis Group, Ed.; Routledge: London, UK, 2018; ISBN 1138546453. [Google Scholar]
- Boadi, K.O.; Kuitunen, M. Urban waste pollution in the Korle Lagoon, Accra, Ghana. Environmentalist 2002, 22, 301–309. [Google Scholar] [CrossRef]
- Firdaus, G. Ahmad Management of Urban Solid Waste Pollution in Developing Countries. Int. J. Environ. Res. 2010, 4, 795–806. [Google Scholar]
- Kouamé, P.K.; Dongo, K.; Nguyen-Viet, H.; Zurbrügg, C.; Lüthi, C.; Hattendorf, J.; Utzinger, J.; Biémi, J.; Bonfoh, B. Ecohealth Approach to Urban Waste Management: Exposure to Environmental Pollutants and Health Risks in Yamoussoukro, Côte d’Ivoire. Int. J. Environ. Res. Public Health 2014, 11, 10292–10309. [Google Scholar] [CrossRef]
- Aslanidis, P.S.C.; Golia, E.E. Urban Sustainability at Risk Due to Soil Pollution by Heavy Metals—Case Study: Volos, Greece. Land 2022, 11, 1016. [Google Scholar] [CrossRef]
- Raza, S.T.; Hafeez, S.; Ali, Z.; Nasir, Z.A.; Butt, M.M.; Saleem, I.; Wu, J.; Chen, Z.; Xu, Y. An Assessment of Air Quality within Facilities of Municipal Solid Waste Management (MSWM) Sites in Lahore, Pakistan. Processes 2021, 9, 1604. [Google Scholar] [CrossRef]
- Massarelli, C.; Binetti, M.S.; Triozzi, M.; Uricchio, V.F. A First Step towards Developing a Decision Support System Based on the Integration of Environmental Monitoring Activities for Regional Water Resource Protection. Hydrology 2023, 10, 174. [Google Scholar] [CrossRef]
- Akhtar, N.; Syakir Ishak, M.I.; Bhawani, S.A.; Umar, K. Various Natural and Anthropogenic Factors Responsible for Water Quality Degradation: A Review. Water 2021, 13, 2660. [Google Scholar] [CrossRef]
- Onyemesili, O.O.; Egbueri, J.C.; Ezugwu, C.K. Assessing the pollution status, ecological and health risks of surface waters in Nnewi urban, Nigeria: Implications of poor waste disposal. Environ. Forensics 2022, 23, 346–360. [Google Scholar] [CrossRef]
- Pastor, J.; Hernández, A.J. Heavy metals, salts and organic residues in old solid urban waste landfills and surface waters in their discharge areas: Determinants for restoring their impact. J. Environ. Manag. 2012, 95, S42–S49. [Google Scholar] [CrossRef] [PubMed]
- Anikwe, M.A.N.; Nwobodo, K.C.A. Long term effect of municipal waste disposal on soil properties and productivity of sites used for urban agriculture in Abakaliki, Nigeria. Bioresour. Technol. 2002, 83, 241–250. [Google Scholar] [CrossRef] [PubMed]
- Sadeghdoust, F.; Ghanavati, N.; Nazarpour, A.; Babaenejad, T.; Watts, M.J. Hazard, ecological, and human health risk assessment of heavy metals in street dust in Dezful, Iran. Arab. J. Geosci. 2020, 13, 681. [Google Scholar] [CrossRef]
- Kabir, M.H.; Kormoker, T.; Islam, M.S.; Khan, R.; Shammi, R.S.; Tusher, T.R.; Proshad, R.; Islam, M.S.; Idris, A.M. Potentially toxic elements in street dust from an urban city of a developing country: Ecological and probabilistic health risks assessment. Environ. Sci. Pollut. Res. 2021, 28, 57126–57148. [Google Scholar] [CrossRef] [PubMed]
- Bonthoux, S.; Brun, M.; Di Pietro, F.; Greulich, S.; Bouché-Pillon, S. How can wastelands promote biodiversity in cities? A review. Landsc. Urban Plan. 2014, 132, 79–88. [Google Scholar] [CrossRef]
- Emmanuel, E.; Balthazard-Accou, K.; Joseph, O. Impact of urban wastewater on biodiversity of aquatic ecosystems. Environ. Manag. Sustain. Dev. Hum. Health 2008, 399–422. [Google Scholar] [CrossRef]
- Bielecka, E. GIS Spatial Analysis Modeling for Land Use Change. A Bibliometric Analysis of the Intellectual Base and Trends. Geosciences 2020, 10, 421. [Google Scholar] [CrossRef]
- OpenStreetMap. Available online: https://www.openstreetmap.org/about (accessed on 30 January 2024).
- Neis, P.; Zipf, A. Analyzing the Contributor Activity of a Volunteered Geographic Information Project—The Case of OpenStreetMap. ISPRS Int. J. Geo-Inf. 2012, 1, 146–165. [Google Scholar] [CrossRef]
- Saraiva, M.; Matijošaitienė, I.; Mishra, S.; Amante, A. Crime Prediction and Monitoring in Porto, Portugal, Using Machine Learning, Spatial and Text Analytics. ISPRS Int. J. Geo-Inf. 2022, 11, 400. [Google Scholar] [CrossRef]
- Dakalbab, F.; Abu Talib, M.; Abu Waraga, O.; Bou Nassif, A.; Abbas, S.; Nasir, Q. Artificial intelligence & crime prediction: A systematic literature review. Soc. Sci. Humanit. Open 2022, 6, 100342. [Google Scholar] [CrossRef]
- Wekesa, E.N.; DeCusatis, C.; Zhu, A. A Black Box Comparison of Machine Learning Reverse Image Search for Cybersecurity OSINT Applications. Electronics 2023, 12, 4822. [Google Scholar] [CrossRef]
- Massarelli, C. Fast detection of significantly transformed areas due to illegal waste burial with a procedure applicable to Landsat images. Int. J. Remote Sens. 2018, 39, 754–769. [Google Scholar] [CrossRef]
- Massarelli, C.; Matarrese, R.; Uricchio, V.F.; Muolo, M.R.; Laterza, M.; Ernesto, L. Detection of asbestos-containing materials in agro-ecosystem by the use of airborne hyperspectral CASI-1500 sensor including the limited use of two UAVs equipped with RGB cameras. Int. J. Remote Sens. 2017, 38, 2135–2149. [Google Scholar] [CrossRef]
- Bellingcat—The Home of Online Investigations. Available online: https://www.bellingcat.com/ (accessed on 30 January 2024).
- McClanahan, B.; Brisman, A. Green Criminology for Social Sciences: Introduction to the Special Issue. Soc. Sci. 2020, 9, 170. [Google Scholar] [CrossRef]
- OpenStreetMap. Available online: https://www.openstreetmap.org/copyright (accessed on 22 June 2022).
- Santos, F.; Acosta, N. An Approach Based on Web Scraping and Denoising Encoders to Curate Food Security Datasets. Agriculture 2023, 13, 1015. [Google Scholar] [CrossRef]
- Blazquez, D.; Domenech, J.; Garcia-Alvarez-Coque, J.M. Assessing Technology Platforms for Sustainability with Web Data Mining Techniques. Sustainability 2018, 10, 4497. [Google Scholar] [CrossRef]
- Alamanos, A.; Rolston, A.; Papaioannou, G. Development of a Decision Support System for Sustainable Environmental Management and Stakeholder Engagement. Hydrology 2021, 8, 40. [Google Scholar] [CrossRef]
- Overpass API—OpenStreetMap Wiki. Available online: https://wiki.openstreetmap.org/wiki/Overpass_API (accessed on 30 January 2024).
- Zeng, F.; Lee, S.H.N.; Lo, C.K.Y. The Role of Information Systems in the Sustainable Development of Enterprises: A Systematic Literature Network Analysis. Sustainability 2020, 12, 3337. [Google Scholar] [CrossRef]
- Asadi, S.S.; Vuppala, P.; Reddy, M.A. Remote Sensing and GIS Techniques for Evaluation of Groundwater Quality in Municipal Corporation of Hyderabad (Zone-V), India. Int. J. Environ. Res. Public Health 2007, 4, 45–52. [Google Scholar] [CrossRef]
- Bocher, E.; Guillaume, G.; Picaut, J.; Petit, G.; Fortin, N. NoiseModelling: An Open Source GIS Based Tool to Produce Environmental Noise Maps. ISPRS Int. J. Geo-Inf. 2019, 8, 130. [Google Scholar] [CrossRef]
- Xie, Y.; Xie, B.; Wang, Z.; Gupta, R.K.; Baz, M.; Alzain, M.A.; Masud, M. Geological Resource Planning and Environmental Impact Assessments Based on GIS. Sustainability 2022, 14, 906. [Google Scholar] [CrossRef]
- Aslam, B.; Maqsoom, A.; Tahir, M.D.; Ullah, F.; Ur Rehman, M.S.; Albattah, M. Identifying and Ranking Landfill Sites for Municipal Solid Waste Management: An Integrated Remote Sensing and GIS Approach. Buildings 2022, 12, 605. [Google Scholar] [CrossRef]
- Parra, L. Remote Sensing and GIS in Environmental Monitoring. Appl. Sci. 2022, 12, 8045. [Google Scholar] [CrossRef]
- Chandrasekaran, H.; Subramani, S.E.; Partheeban, P.; Sridhar, M. IoT- and GIS-Based Environmental Impact Assessment of Construction and Demolition Waste Dump Yards. Sustainability 2023, 15, 13013. [Google Scholar] [CrossRef]
- Zarubin, M.; Statsenko, L.; Spiridonov, P.; Zarubina, V.; Melkoumian, N.; Salykova, O. A GIS Software Module for Environmental Impact Assessment of the Open Pit Mining Projects for Small Mining Operators in Kazakhstan. Sustainability 2021, 13, 6971. [Google Scholar] [CrossRef]
- Massarelli, C.; Losacco, D.; Tumolo, M.; Campanale, C.; Uricchio, V.F. Protection of Water Resources from Agriculture Pollution: An Integrated Methodological Approach for the Nitrates Directive 91/676/EEC Implementation. Int. J. Environ. Res. Public Health 2021, 18, 13323. [Google Scholar] [CrossRef] [PubMed]
- Miller, T.; Durlik, I.; Nska Adrianna, K.; Kisiel, A.; Cembrowska-Lech, D.; Spychalski, I.; Tú Nski, T. Predictive Modeling of Urban Lake Water Quality Using Machine Learning: A 20-Year Study. Appl. Sci. 2023, 13, 11217. [Google Scholar] [CrossRef]
- Park, J.; Yang, B. GIS-Enabled Digital Twin System for Sustainable Evaluation of Carbon Emissions: A Case Study of Jeonju City, South Korea. Sustainability 2020, 12, 9186. [Google Scholar] [CrossRef]
- Flores, V.; Bravo, I.; Saavedra, M. Water Quality Classification and Machine Learning Model for Predicting Water Quality Status—A Study on Loa River Located in an Extremely Arid Environment: Atacama Desert. Water 2023, 15, 2868. [Google Scholar] [CrossRef]
- Massarelli, C.; Campanale, C.; Triozzi, M.; Uricchio, V.F. Dynamics of pesticides in surface water bodies by applying data mining to spatiotemporal big data. A case study for the Puglia Region. Ecol. Inform. 2023, 78, 102342. [Google Scholar] [CrossRef]
- Ragazzi, M.; Katsoyiannis, I.; Magaril, E.; Viotti, P.; Al-Kayiem, H.H.; Schiavon, M.; Ionescu, G.; Sliusar, N.; Malik, M.; Sharma, S.; et al. Waste Classification for Sustainable Development Using Image Recognition with Deep Learning Neural Network Models. Sustainability 2022, 14, 7222. [Google Scholar] [CrossRef]
- Massarelli, C.; Campanale, C.; Uricchio, V.F. A Handy Open-Source Application Based on Computer Vision and Machine Learning Algorithms to Count and Classify Microplastics. Water 2021, 13, 2104. [Google Scholar] [CrossRef]
- Morell, M.; Portau, P.; Perelló, A.; Espino, M.; Grifoll, M.; Garau, C. Use of Neural Networks and Computer Vision for Spill and Waste Detection in Port Waters: An Application in the Port of Palma (MaJorca, Spain). Appl. Sci. 2022, 13, 80. [Google Scholar] [CrossRef]
- Valente, M.; Silva, H.; Caldeira, J.M.L.P.; Soares, V.N.G.J.; Gaspar, P.D. Detection of Waste Containers Using Computer Vision. Appl. Syst. Innov. 2019, 2, 11. [Google Scholar] [CrossRef]
- Yang, B. GIS Crime Mapping to Support Evidence-Based Solutions Provided by Community-Based Organizations. Sustainability 2019, 11, 4889. [Google Scholar] [CrossRef]
- Bowers, K.J.; Johnson, S.D.; Pease, K. Prospective Hot-Spotting: The Future of Crime Mapping? Br. J. Criminolo 2004, 44, 641–658. [Google Scholar] [CrossRef]
- Cohen, J.; Gorr, W.L.; Olligschlaeger, A. Leading Indicators and Spatial Interactions: A Crime Forecasting Model for Proactive Police Deployment. Geogr. Anal. 2007, 39, 105–127. [Google Scholar] [CrossRef]
- Gorr, W.L. Forecast Accuracy Measures for Exception Reporting Using Receiver Operating Charac-teristic Curves. Int. J. Forecast. 2009, 25, 48–61. [Google Scholar] [CrossRef]
- Mohler, G.O.; Short, M.B.; Brantingham, P.J.; Schoenberg, F.P.; Tita, G.E. Self-Exciting Point Process Modeling of Crime. J. Am. Stat. Assoc. 2011, 106, 100–108. [Google Scholar] [CrossRef]
Figure 1.
Examples of waste found during the site characterization phase. (a) Various plastic materials, if burned, produce dioxins and polychlorinated biphenyls; (b) tyres, if burned, release dioxins and furans; (c) partially burned waste abandoned in natural areas; (d) various waste of electronic devices that can release harmful gases.

Figure 2.
Workflow used for data processing and information extraction.

Figure 3.
Breakdown by province of the number of active sites (a) and reclaimed sites (b).
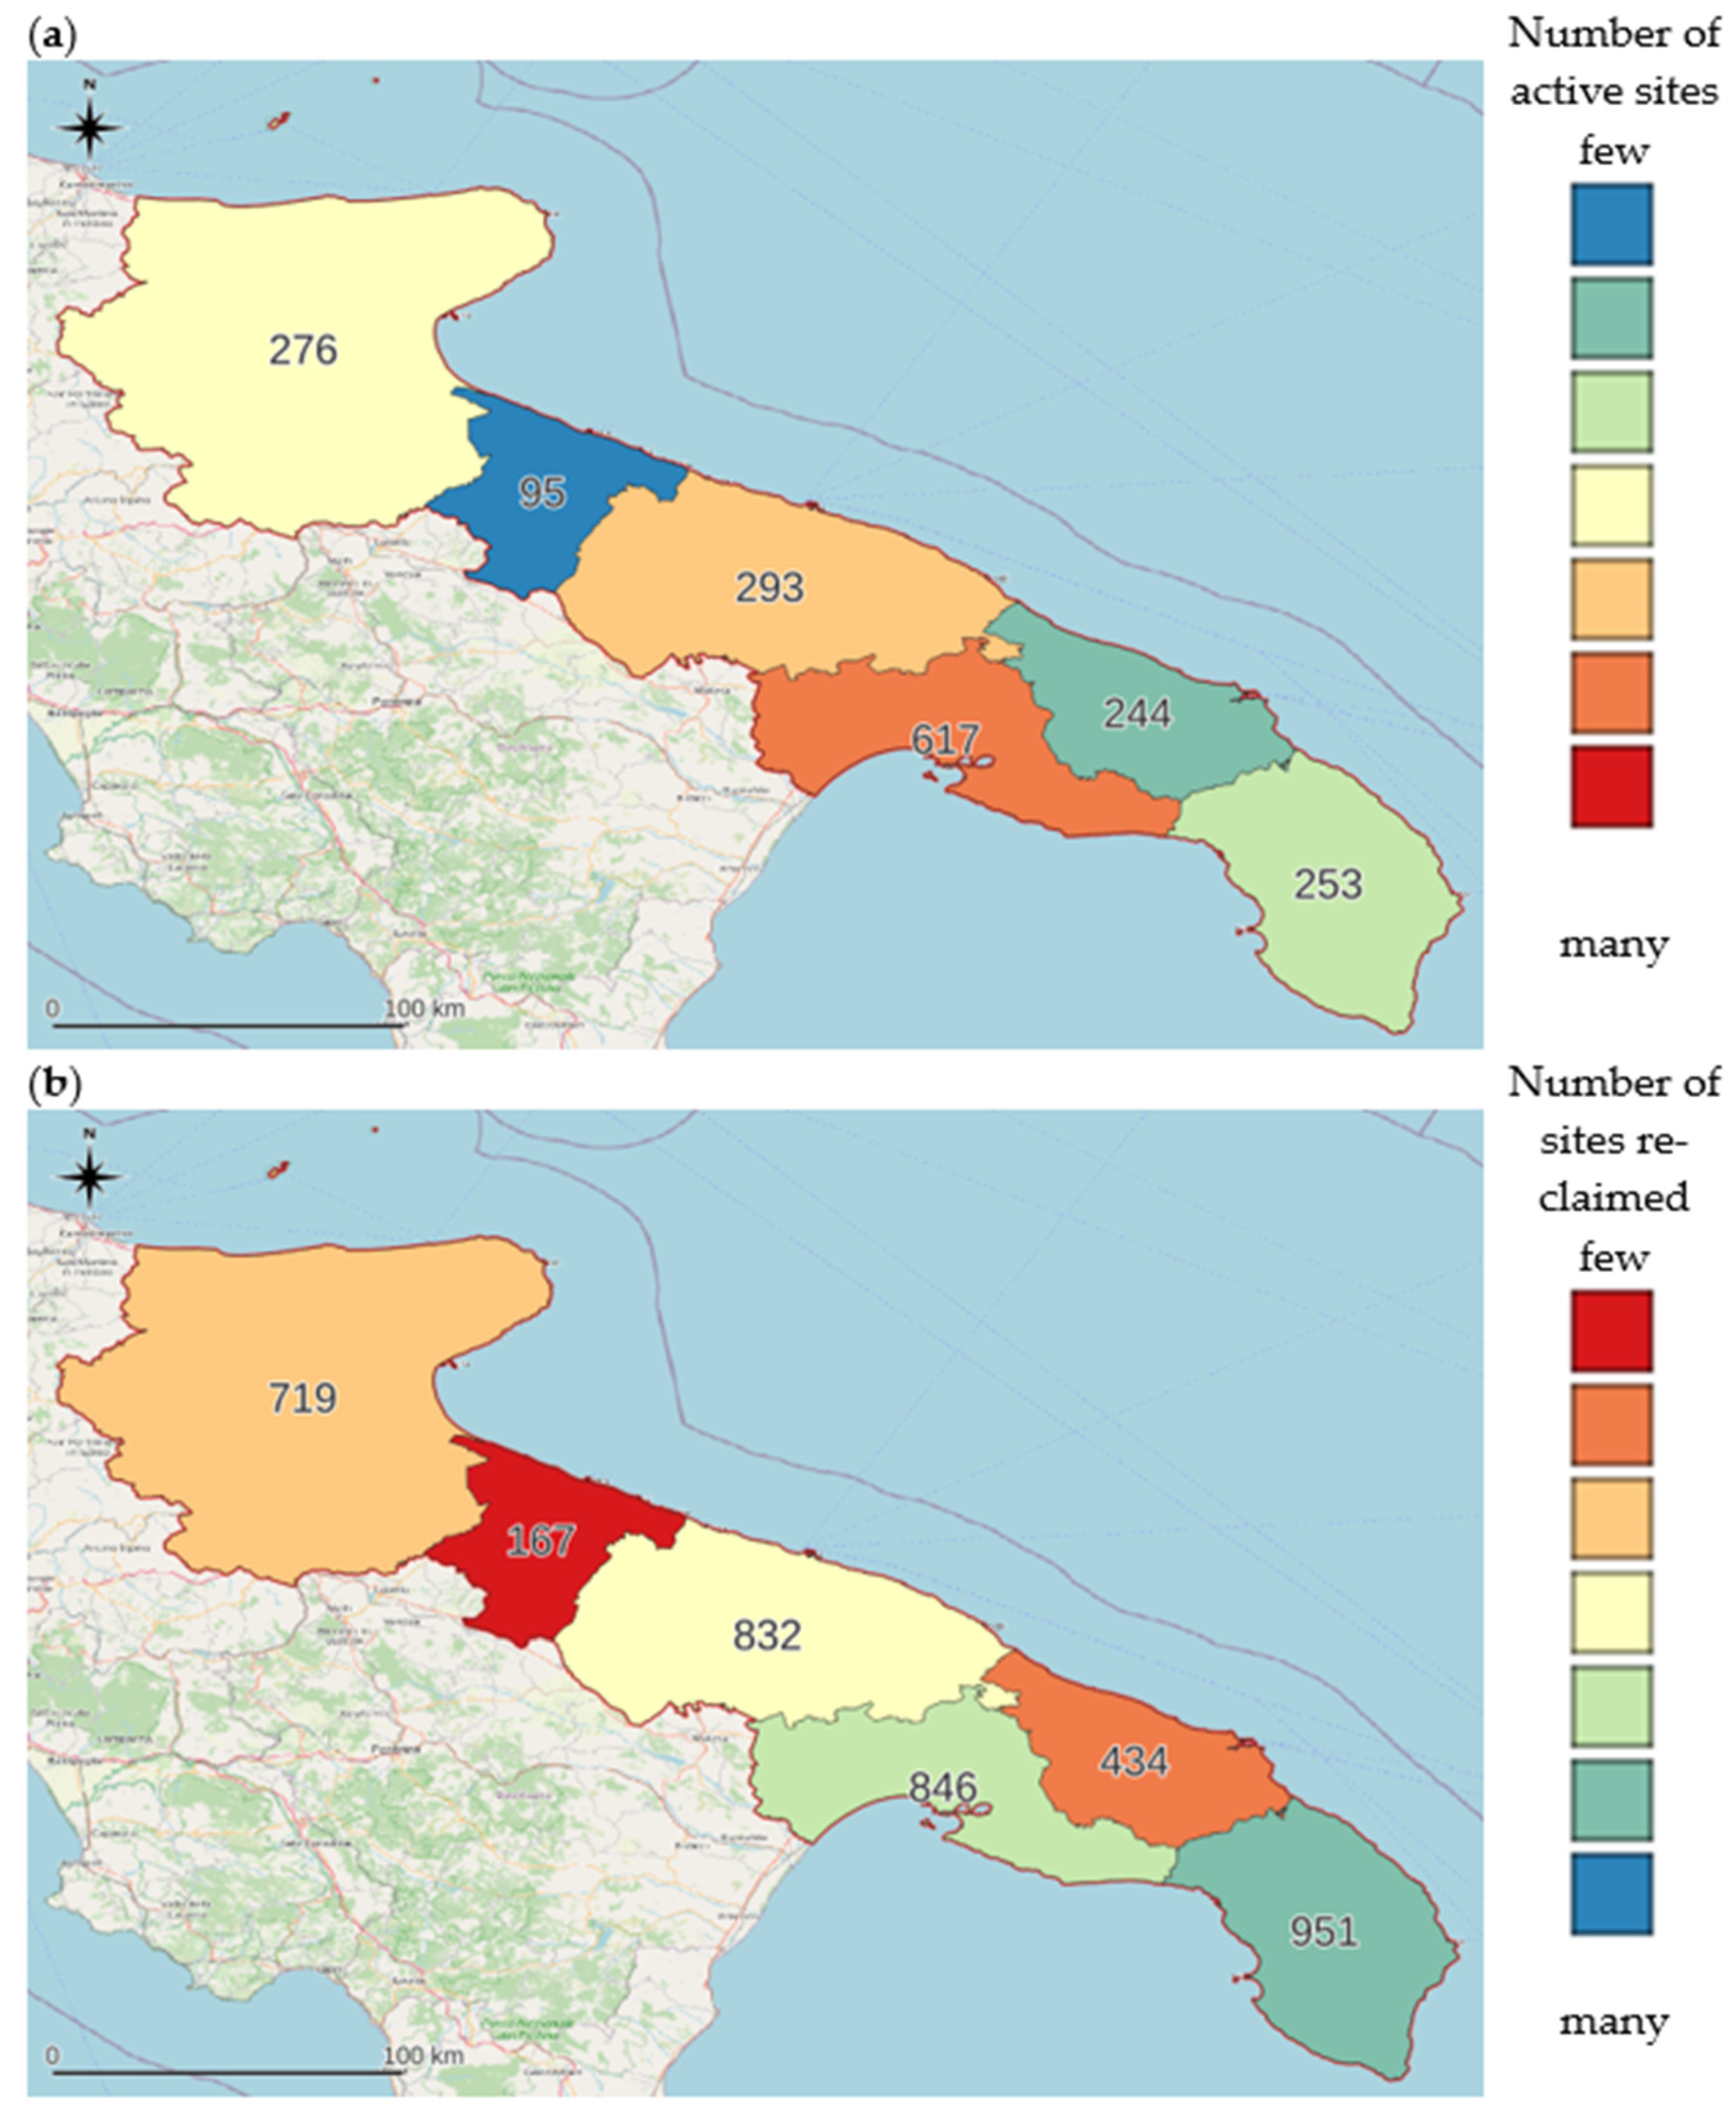
Figure 4.
Heat map of the presence of sites affected by waste abandonment.

Figure 5.
Areas most affected by the phenomenon of waste abandonment in peri-urban areas in the Puglia region, generated with contour lines.
Figure 5.
Areas most affected by the phenomenon of waste abandonment in peri-urban areas in the Puglia region, generated with contour lines.
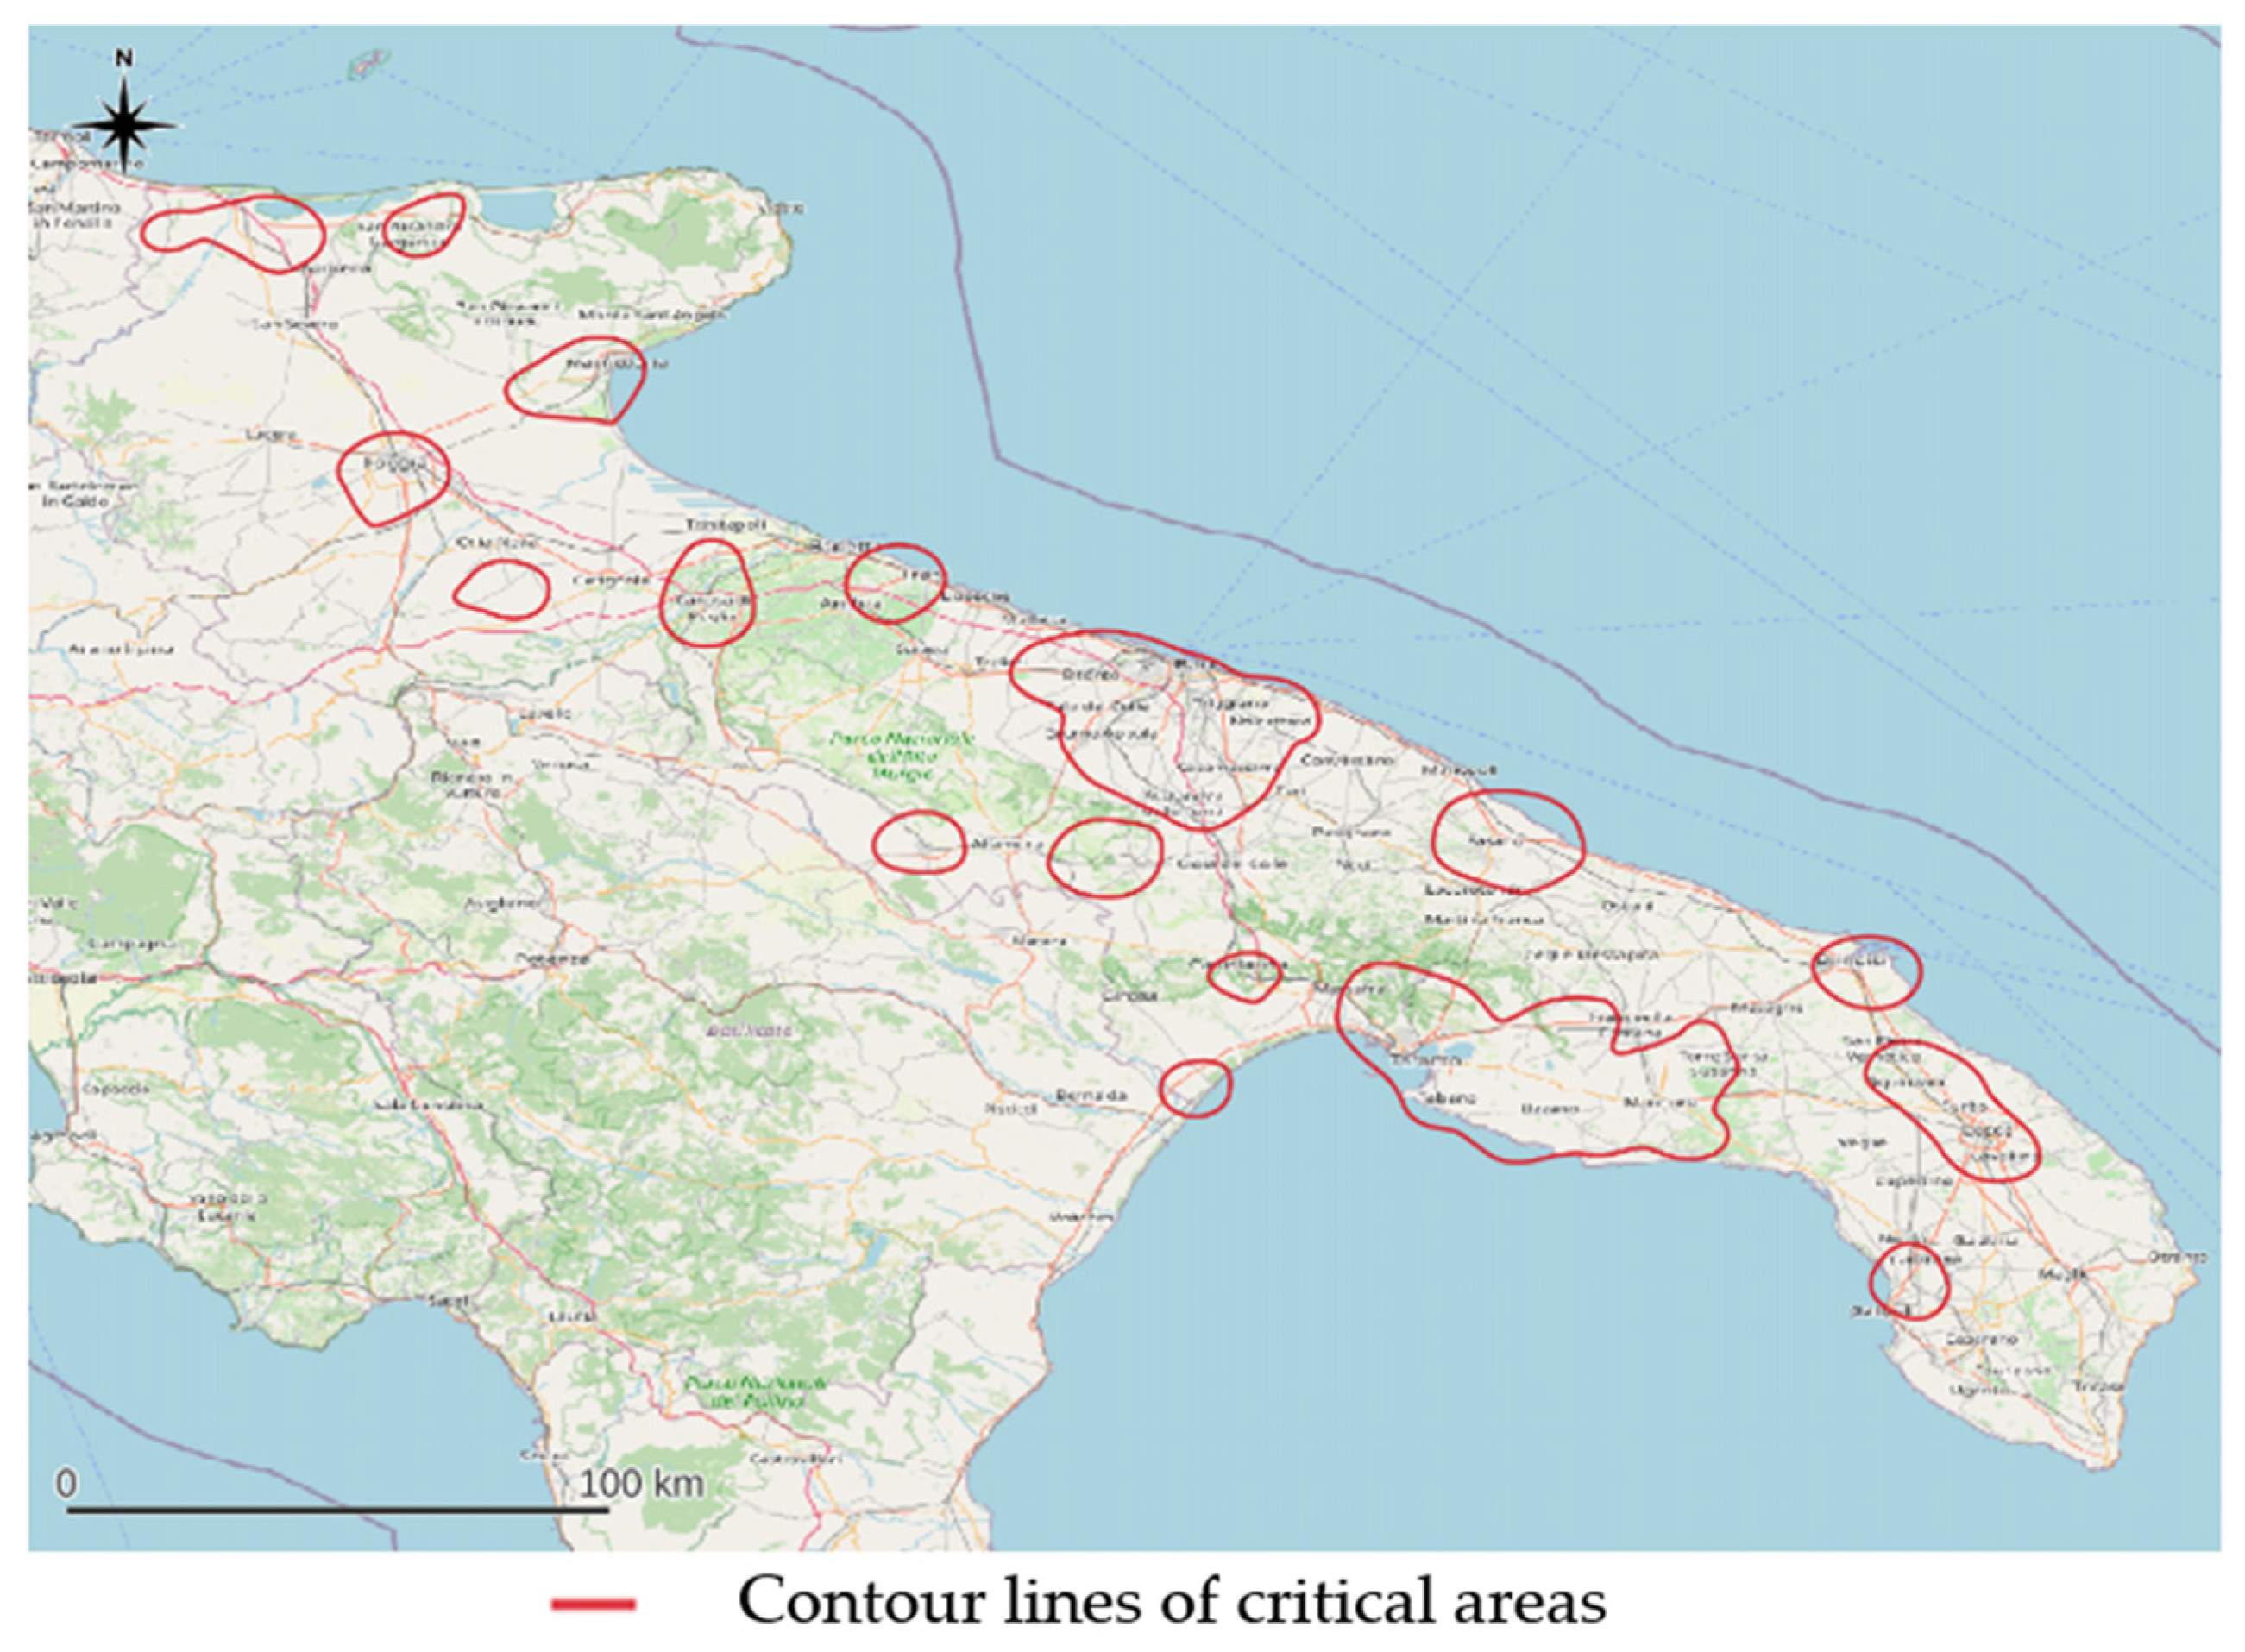
Figure 6.
Choropleth maps (a) of the distribution of sites with waste and (b) with the areas of greatest concentration as highlighted in the heat map processing.
Figure 6.
Choropleth maps (a) of the distribution of sites with waste and (b) with the areas of greatest concentration as highlighted in the heat map processing.

Figure 7.
Results of the LISA Analysis and identification of homogeneous macro-areas of intervention.
Figure 7.
Results of the LISA Analysis and identification of homogeneous macro-areas of intervention.
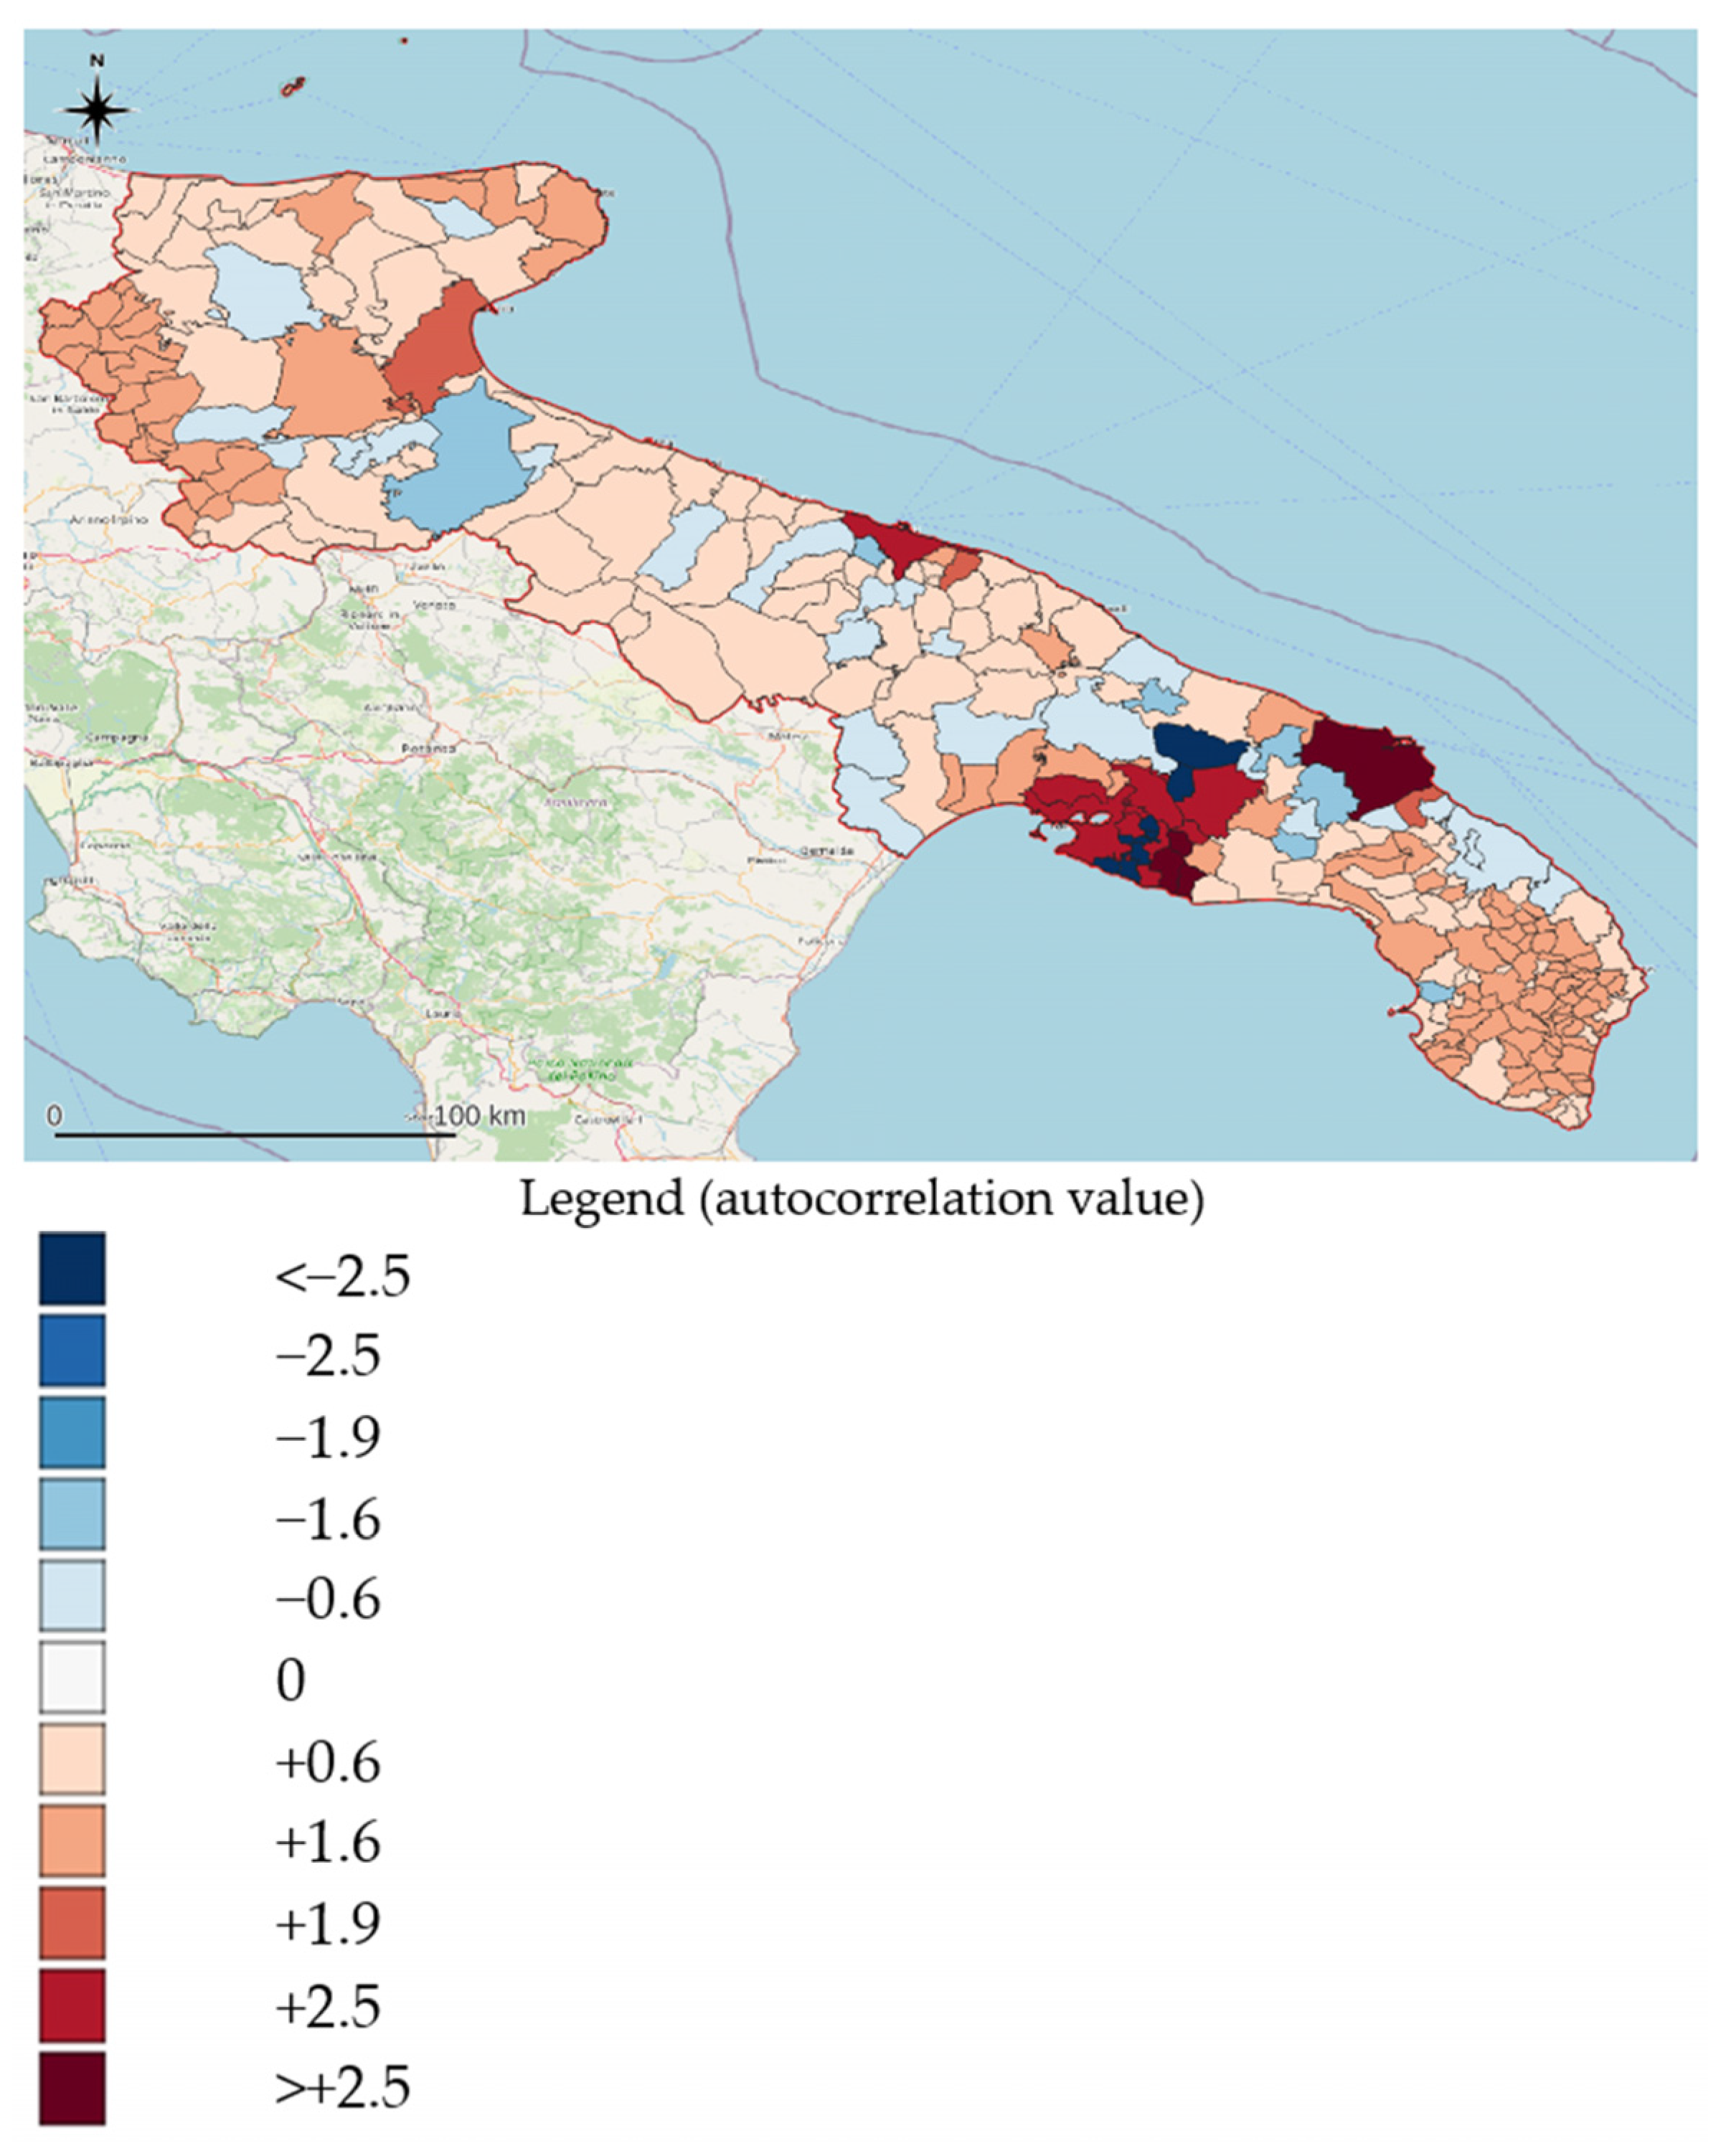
Figure 8.
Network analysis by interoperating data relating to abandonments in peri-urban areas with those of open source databases such as OpenStreetMap.
Figure 8.
Network analysis by interoperating data relating to abandonments in peri-urban areas with those of open source databases such as OpenStreetMap.

Disclaimer/Publisher’s Note: The statements, opinions and data contained in all publications are solely those of the individual author(s) and contributor(s) and not of MDPI and/or the editor(s). MDPI and/or the editor(s) disclaim responsibility for any injury to people or property resulting from any ideas, methods, instructions or products referred to in the content. |
© 2024 by the authors. Licensee MDPI, Basel, Switzerland. This article is an open access article distributed under the terms and conditions of the Creative Commons Attribution (CC BY) license (https://creativecommons.org/licenses/by/4.0/).
Share and Cite
MDPI and ACS Style
Massarelli, C.; Uricchio, V.F. The Contribution of Open Source Software in Identifying Environmental Crimes Caused by Illicit Waste Management in Urban Areas. Urban Sci. 2024, 8, 21. https://doi.org/10.3390/urbansci8010021
AMA Style
Massarelli C, Uricchio VF. The Contribution of Open Source Software in Identifying Environmental Crimes Caused by Illicit Waste Management in Urban Areas. Urban Science. 2024; 8(1):21. https://doi.org/10.3390/urbansci8010021
Chicago/Turabian StyleMassarelli, Carmine, and Vito Felice Uricchio. 2024. "The Contribution of Open Source Software in Identifying Environmental Crimes Caused by Illicit Waste Management in Urban Areas" Urban Science 8, no. 1: 21. https://doi.org/10.3390/urbansci8010021