Article

Enhancing the Definitions of Climate-Change Loss and Damage Based on Land Conversion in Florida, U.S.A.

1
Department of Forestry and Environmental Conservation, Clemson University, Clemson, SC 29634, USA
2
Department of Biological Science and Biotechnology, Minnan Normal University, Zhangzhou 363000, China
3
University Key Lab for Geomatics Technology and Optimized Resources Utilization in Fujian Province, Fuzhou 350002, China
4
University of Arkansas Agricultural Experiment Station, Arkansas Forest Resources Center, University of Arkansas at Monticello, Monticello, AR 71655, USA
5
Department of Environmental Engineering and Earth Sciences, Clemson University, Anderson, SC 29625, USA
6
Geography Department, Portland State University, Portland, OR 97202, USA
7
School of Law, Emory University, Atlanta, GA 30322, USA
*
Author to whom correspondence should be addressed.
Urban Sci. 2023, 7(2), 40; https://doi.org/10.3390/urbansci7020040
Submission received: 25 January 2023 / Revised: 11 March 2023 / Accepted: 15 March 2023 / Published: 19 April 2023

Abstract

:
Loss and damage (L&D) from climate change result from past and current greenhouse gas (GHG) emissions. Current definitions of L&D exclude GHG emissions even though they represent L&D to human beings and the environment. This study’s objective was to identify and quantify the L&D from GHG emissions associated with land developments using the state of Florida (FL) in the United States of America (USA) as a case study. All land developments in FL caused various L&D (20,249.6 km2, midpoint 3.0 × 10¹¹ of total soil carbon (TSC) losses with midpoint $50.3B (where B = billion = 109, USD) in social costs of carbon dioxide emissions, SC-CO2), while “new” land developments (1703.7 km2) in the period from 2001 to 2016 caused a complete loss of midpoint 2.8 × 10¹⁰ kg of TSC resulting in midpoint $4.5B SC-CO2. These emissions are currently not accounted for in FL’s total carbon footprint (CF). Climate-change-related damages in FL include permanent losses (e.g., land losses), with 47 out of 67 FL’s counties potentially affected by the projected sea-level rise and repairable damages (e.g., destruction from hurricanes). Based on the fixed social cost of carbon (C), there appears to be a disconnect between the value attributed to soil-based emissions and the actual market-driven losses from climate-change-associated costs. The social cost of C could be scaled based on the vulnerability of a particular community and the market-based cost of L&D mitigation. Programs for compensation on the international level should be carefully designed to help people who have suffered climate-related L&D, without creating reverse climate change adaptation (RCCA), where compensation causes people to remain in areas that are vulnerable to climate-related L&D.

1. Introduction

Loss and damage (L&D) from climate change is a human construct with a wide range of interpretations that is commonly used in various domestic and international contexts, including the Warsaw International Mechanism (WIM) on Loss and Damage (L&D) as part of the United Nations (UN) Framework Convention on Climate Change (UNFCC) [1]. Although there is no precise definition of L&D, it typically refers to the loss as a permanent loss (e.g., land loss from sea-level rise, etc.) and damage as repairable damage (e.g., hurricane property damage, etc.) (Figure 1). These L&D are often understood as the impacts on human populations and infrastructure and are unlikely to consider ecological losses (e.g., plant and animal biodiversity). The construct of L&D can be framed in various ways with the two most common framings: (1) liability and compensation, and (2) risk and insurance [1]. Although L&D is included in various international agreements (e.g., Paris Agreement [2] on L&D (Article 8), COP27 agreement on L&D [3]), it typically refers to minimal financial support and “does not provide or involve a basis for any liability or compensation [2]”.
Previous research has developed methods to document, evaluate, and limit L&D for susceptible communities, such as Small Island Developing States (SIDS); however, significant L&D is expected to occur, exceeding current adaptation and mitigation efforts [4]. Scientific analysis of extreme weather events is making progress in identifying linkages to human-caused climate change, which will help improve attribution science for specific L&D types and events [5]. One critical aspect of L&D is the increased exposure to climate-linked extreme weather events because of growing populations and new infrastructure [6]. Research focusing on methods to finance L&D has identified levies on GHG emissions as one potential funding source to pay for L&D for SIDS [7]. Loss and damage are often depicted as a consequence of climate change [8]; however, this attribution omits GHG emissions which cause climate change (Figure 1). This study proposes to acknowledge the role of GHG emissions in climate change for L&D attribution purposes. While attributing L&D to climate change can be ambiguous and complex, there may be more transparent and quantifiable ways to identify and assign responsibility for GHG emissions. The responsibility for GHG emissions could fund compensation (e.g., payments) for L&D. For example, modern remote sensing techniques and publicly available soil spatial data can be used to estimate the amount, spatial distribution, and social cost of GHG emissions. Climate change-related L&D to the built environment can be documented by remote sensing techniques and valued using market-based tools. These market-based tools may be challenging to apply to the L&D of ecosystems and their services enveloping these built environments. This study uses FL as an example of a method to link soil-based GHG emissions from land conversions to L&D. In addition, FL’s experience demonstrates the flaws of some proposals to protect against climate L&D.

The Role of Soils in Florida’s Actions to Reduce Greenhouse Gas (GHG) Emissions

On 13 July 2007, the State of FL issued Executive Order number 07-127, “Establishing Immediate Actions to Reduce Greenhouse Gas Emissions within Florida”, which sets GHG emission reduction targets by 2017 to reduce GHG emissions to 2000 levels; by 2025, to reduce GHG emissions to 1990 levels; by 2050, to reduce GHG emissions by 80% of 1990 levels [9]. “Florida’s Energy and Climate Change Action Plan” listed the principal sources of Florida’s 2005 gross GHG emissions, which include transport (36%), electricity consumption (42%), industrial process (4%), residential/commercial fuel use (2%), industrial fuel use (4%), agriculture and forest fires (6%), waste (5%), and fossil fuel industry (0.5%) [10]. This list does not include soil-based GHG emissions from land conversions.
Florida’s pedodiversity (soil diversity) is represented by seven soil orders, belonging to slightly weathered soils (Entisols, Inceptisols, Histosols), moderately weathered soils (Alfisols, Mollisols), and strongly weathered soils (Spodosols, Ultisols) with different soil ecosystem services and disservices (ES/ED) and climate change vulnerabilities (Table 1 and Figure 2). The state of FL has picked Myakka as the State Soil (soil order: Spodosols) because of its area extent in the state [11].
Table 1. Soil diversity (pedodiversity) is represented by taxonomic diversity at the soil order level in Florida (USA) [12].
StocksArea
Soil OrderGeneral Characteristics and Constraints (km2)
Slightly Weathered48,618.0
EntisolsEmbryonic soils with an ochric epipedon29,900.8
InceptisolsYoung soils with an ochric or umbric epipedon6946.3
HistosolsOrganic soils with ≥20% organic carbon11,770.8
Moderately Weathered20,810.8
AlfisolsClay-enriched B horizon with B.S. ≥35%15,372.5
MollisolsCarbon-enriched soils with B.S. ≥50%5438.3
Strongly Weathered58,525.5
SpodosolsCoarse-textured soils with albic and spodic horizons27,984.5
UltisolsHighly leached soils with B.S. <35%30,541.0
Note: B.S. = base saturation.
Figure 2. General soil map of Florida (USA) (Latitude: 24°27′ N to 31°00′ N; Longitude: 80°02′ W to 87°38′ W) from the SSURGO database [13] with county boundaries overlaid [14].
Urbansci 07 00040 g002
Florida has been experiencing a wide range of climate change impacts: increasing atmospheric and ocean temperatures; extreme weather events; rising sea levels and loss of land because of retreating shores; coastal flooding; bleaching of coral reefs; ocean acidification; and reduction in freezing days [15]. These climate-change-related L&D generate economic and non-economic (incalculable) losses [8]. Figure 3 demonstrates permanent land and urban losses because of sea-level rise in the vicinity of Naples, FL. Figure 4 gives an example of repairable urban damages from Hurricane Ian in the vicinity of Fort Myers Beach, FL. Hurricane Ian (October 2022) generated more than $63B (where B = billion = 109) in insurance losses, with an overall economic impact of over $100B, estimated using market-based tools [16]. Florida’s L&D are exceptionally high considering the state’s vulnerability to climate change [17] and skyrocketing population growth [18] with a relatively high proportion of private land ownership (70.8%) [19].
The present study hypothesizes that L&D is a consequence of climate change from GHG emissions, which can be quantified and valued based on the social cost of emissions (e.g., the social cost of CO2 emissions, SC-CO2, etc.). Land conversion most likely causes a permanent loss of soil C and limits any future soil C sequestration potential because of the consequences of land development (e.g., buildings, impervious areas, etc.). Losses of soil C can be quantified and valued as SC-CO2 at a fixed rate of $46 per metric ton of CO2 [22], which can be potentially used to compensate for L&D. However, one limitation of using a fixed cost of SC-CO2 is that it is not market-based, and therefore does not scale to actual L&D damages, which are valued based on the market cost of compensation and repair for L&D. This fixed SC-CO2 value likely does not include the many non-economic L&D (e.g., losing family members, loss of culture, the trauma of migration, etc.). Although this fixed valuation of SC-CO2 is far from perfect, it could provide a starting point to generate money for L&D compensation. Our study will demonstrate how soil spatial data and remote sensing analysis can be used to estimate soil-based GHG emissions as monetary valuations of the social costs of carbon dioxide (SC-CO2) emissions which could be used as part of voluntary or regulatory fund generation mechanisms for L&D compensation.
This study’s objective was to determine the value of soil organic carbon (SOC), soil inorganic carbon (SIC), and total soil carbon (TSC) for the state of FL (USA) and evaluate its change over 15 years based on the avoided emissions provided by C sequestration and the social cost of C (SC-CO2), which is assumed to be $46 per metric ton (tonne) of emitted CO2 (applicable for the year 2025 based on 2007 U.S. dollars using an average discount rate of 3% by the US Environmental Protection Agency (EPA)) [22]. This study provides monetary value estimates of SOC, SIC, and TSC both throughout the state of FL and by various aggregation levels using the State Soil Geographic (STATSGO) and Soil Survey Geographic Database (SSURGO) databases and earlier information developed by Guo et al. (2006) [23].

2. Materials and Methods

Monetary values for SOC, SIC, and TSC in FL were estimated using biophysical (science-based) and administrative (boundary-based) accounting (Figure 2 and Table 2).
Reported contents (kg m−2) of SOC, SIC, and TSC were obtained from Guo et al. (2006) [23] and valued based on EPA’s social cost of carbon (SC-CO2) of $46 per metric ton of CO2 [22] (Table 3). EPA’s SC-CO2 value is intended to be a comprehensive estimate of climate change damages. However, the monetary value likely underestimates the true damages and costs associated with CO2 emissions due to the exclusion of various important climate change impacts typically recognized in the scientific literature [22]. Area-normalized monetary values ($ m−2) were calculated using Equation (1), and total monetary values were summed over the appropriate area(s) (noting that a metric ton is equivalent to 1 megagram (Mg) or 1000 kg (kg), and SC = soil carbon, e.g., SOC, SIC, or TSC):
$ m 2 = SOC / SIC / TSC   Content , kg m 2 × 1   Mg 10 3   kg × 44   Mg   CO 2 12   Mg   SC × $ 46 Mg   CO 2    
For example, for the soil order Inceptisols, Guo, et al. (2006) [23] reported a midpoint SOC content of 8.9 kg m−2 for the upper 2-m soil depth (Table 3). Using this SOC content in Equation (1) results in an area-normalized SOC value of $1.50 m−2. Multiplying the SOC content and its corresponding area-normalized value each by the total area of Inceptisols present in FL (6946.3 km2) results in an estimated SOC stock of 6.2 × 10¹⁰ kg with an estimated monetary value of $10.4B.
Land use/land cover (LULC) changes in FL were analyzed between 2001 and 2016 using classified land cover data from the Multi-Resolution Land Characteristics Consortium (MRLC) [25]. Changes in land cover, with their associated soil types, were calculated in ArcGIS Pro 2.6 [26] by comparing the 2001 and 2016 data, converting the land cover to vector format, and unioning the data with the soils layer in the Soil Survey Geographic (SSURGO) Database [13].

3. Results

The total estimated midpoint storage and monetary SC-CO2 value for TSC in the state of FL were 3.1 × 10¹² kg C, and $514.8B (i.e., 514.8 billion U.S. dollars, where B = billion = 109), respectively. Of these total amounts, SOC accounted for 2.7 × 10¹² kg C, $455.2B (88% of the total value), while SIC accounted for 3.5 × 10¹¹ kg C, $59.6B (12% of the total value). Previously, we have reported that among the 48 conterminous states of the U.S., FL ranked 6th for TSC [27], 3rd for SOC [28], and 28th for SIC [24] for the SC-CO2 values.

3.1. Storage and Value of SOC by Soil Order and County for Florida

Soil orders having the highest midpoint storage and monetary value for SOC were Histosols (1.7 × 10¹² kg C, $278.0B), Spodosols (3.4 × 10¹¹ kg C, $57.9B), and Entisols (2.4 × 10¹¹ kg C, $40.4B) (Table 4). Sixty-one percent of SOC is associated with the soil order of Histosols, which are often organic soils found in wetland areas. Although they are not the most prevalent soil order (9% of the total area of FL) in the state, their high SOC content makes them a significant contributor to SOC stocks. Histosols are often found in low-lying coastal areas, which makes them vulnerable to sea level rise and development. The counties with the highest midpoint SOC values were Palm Beach (4.1 × 10¹¹ kg C, $68.5B), Miami-Dade (9.0 × 10¹⁰ kg C, $15.1B), and Brevard (8.6 × 10¹⁰ kg C, $14.5B).

3.2. Storage and Value of SIC by Soil Order and County for Florida

Soil orders having the highest midpoint storage and monetary value for SIC were Entisols (1.4 × 10¹¹ kg C, $24.5B), Alfisols (6.6 × 10¹⁰ kg C, $11.0B), and Mollisols (6.3 × 10¹⁰ kg C, $10.5B) (Table 4). The counties having the highest midpoint SIC values were Palm Beach (1.6 × 10¹⁰ kg C, $2.7B), Collier (1.6 × 10¹⁰ kg C, $2.7B), and Polk (1.5 × 10¹⁰ kg C, $2.6B).

3.3. Storage and Value of TSC (SOC + SIC) by Soil Order and County for Florida

Soil orders having the highest midpoint storage and monetary value for TSC were Histosols (1.7 × 10¹² kg C, $282.8B), Entisols (3.8 × 10¹¹ kg C, $64.9B), and Spodosols (3.6 × 10¹¹ kg C, $60.7B) (Table 4). Histosols contributed 55% to the total avoided SC-CO2 for TSC because of their high soil C content (142.5 kg m−2) and value ($24.03 m−2) (Table 3). The counties with the highest midpoint TSC values were Palm Beach (4.2 × 10¹¹ kg C, $71.3B), Miami-Dade (9.6 × 10¹⁰ kg C, $16.2B), and Brevard (9.6 × 10¹⁰ kg C, $16.1B).

3.4. Land Use/Land Cover Change in Florida by Soil Order from 2001 to 2016

Florida had LULC changes over the 15 years examined (Table 5, Figure 5), causing soil based GHG emissions. Changes varied by LULC classification and soil order, with most soil orders having losses in “low disturbance” LULC classes (e.g., evergreen forest, hay/pasture) while increasing the areas associated with “developed” LULC classes. The largest increases were in high-intensity (+31.5 %), and medium-intensity (+31.1%) developed LULC classes (Table 5). Changes in LULC were different by soil order as well. In the high-intensity developed LULC class, the largest increases were observed in the soil orders of Inceptisols (+64.7%), Histosols (+55.7%), and Alfisols (+51.9%). Alfisols are agriculturally important soils and should be reserved for agricultural purposes. The increase in the development of Histosols is alarming because these C-rich soils are often found in wetlands and should be protected at both state and federal regulatory levels. The total increase in developed area (2001–2016) was 1676.3 km2 with 2.7 × 10¹⁰ kg C losses and $4.5B in associated SC-CO2 (Table 6). The SC-CO2 of this lost soil C is 0.8% of the total remaining soil TSC, which represents a dramatic loss given the geologic timescale of soil formation.
Overall, FL’s forest LULC extent was lowered in the evergreen and mixed forest categories between 2001 and 2016 (Table 5), which are the dominant forest types and likely represent reduced overall C sequestration in these forests. There was a large increase in deciduous forests (+24%); however, it represents a small portion of the total forest lands. Florida’s Energy and Climate Change Action Plan [10] has the goal of having no overall loss of forest to non-forested land covers by 2015 to protect sequestered C and to limit losses in soil C, but it does not appear FL is on track to meet its goal. There was a slight increase in woody wetlands (+1.1%) and a loss of emergent herbaceous wetlands (−8.1%; Table 5). Concerning the action plan, the loss of wetlands goes against the plan’s intent to prevent C release from wetland development [10]. The hay/pasture LULC class had a considerable reduction (−7.6%), which is counter to the FL Action Plan’s goal of limiting this conversion.

4. Discussion

4.1. Significance of Results for Florida’s Actions to Reduce Greenhouse Gas (GHG) Emissions and Loss and Damage (L&D) from Land Developments

The state of FL recognizes the dangers of climate change by trying to identify GHG sources, setting up GHG emission reduction targets, and creating a working plan for reducing GHG emissions. Our study identified an important omission of GHG source from soil-based emissions from land conversions to developments, which needs to be accounted for in the state’s GHG inventory, reduction targets, and plan. These GHG sources and emissions not only contribute to state and world L&D, but they also constitute L&D themselves. Our study results provide the following evidence for these claims:
(1) 
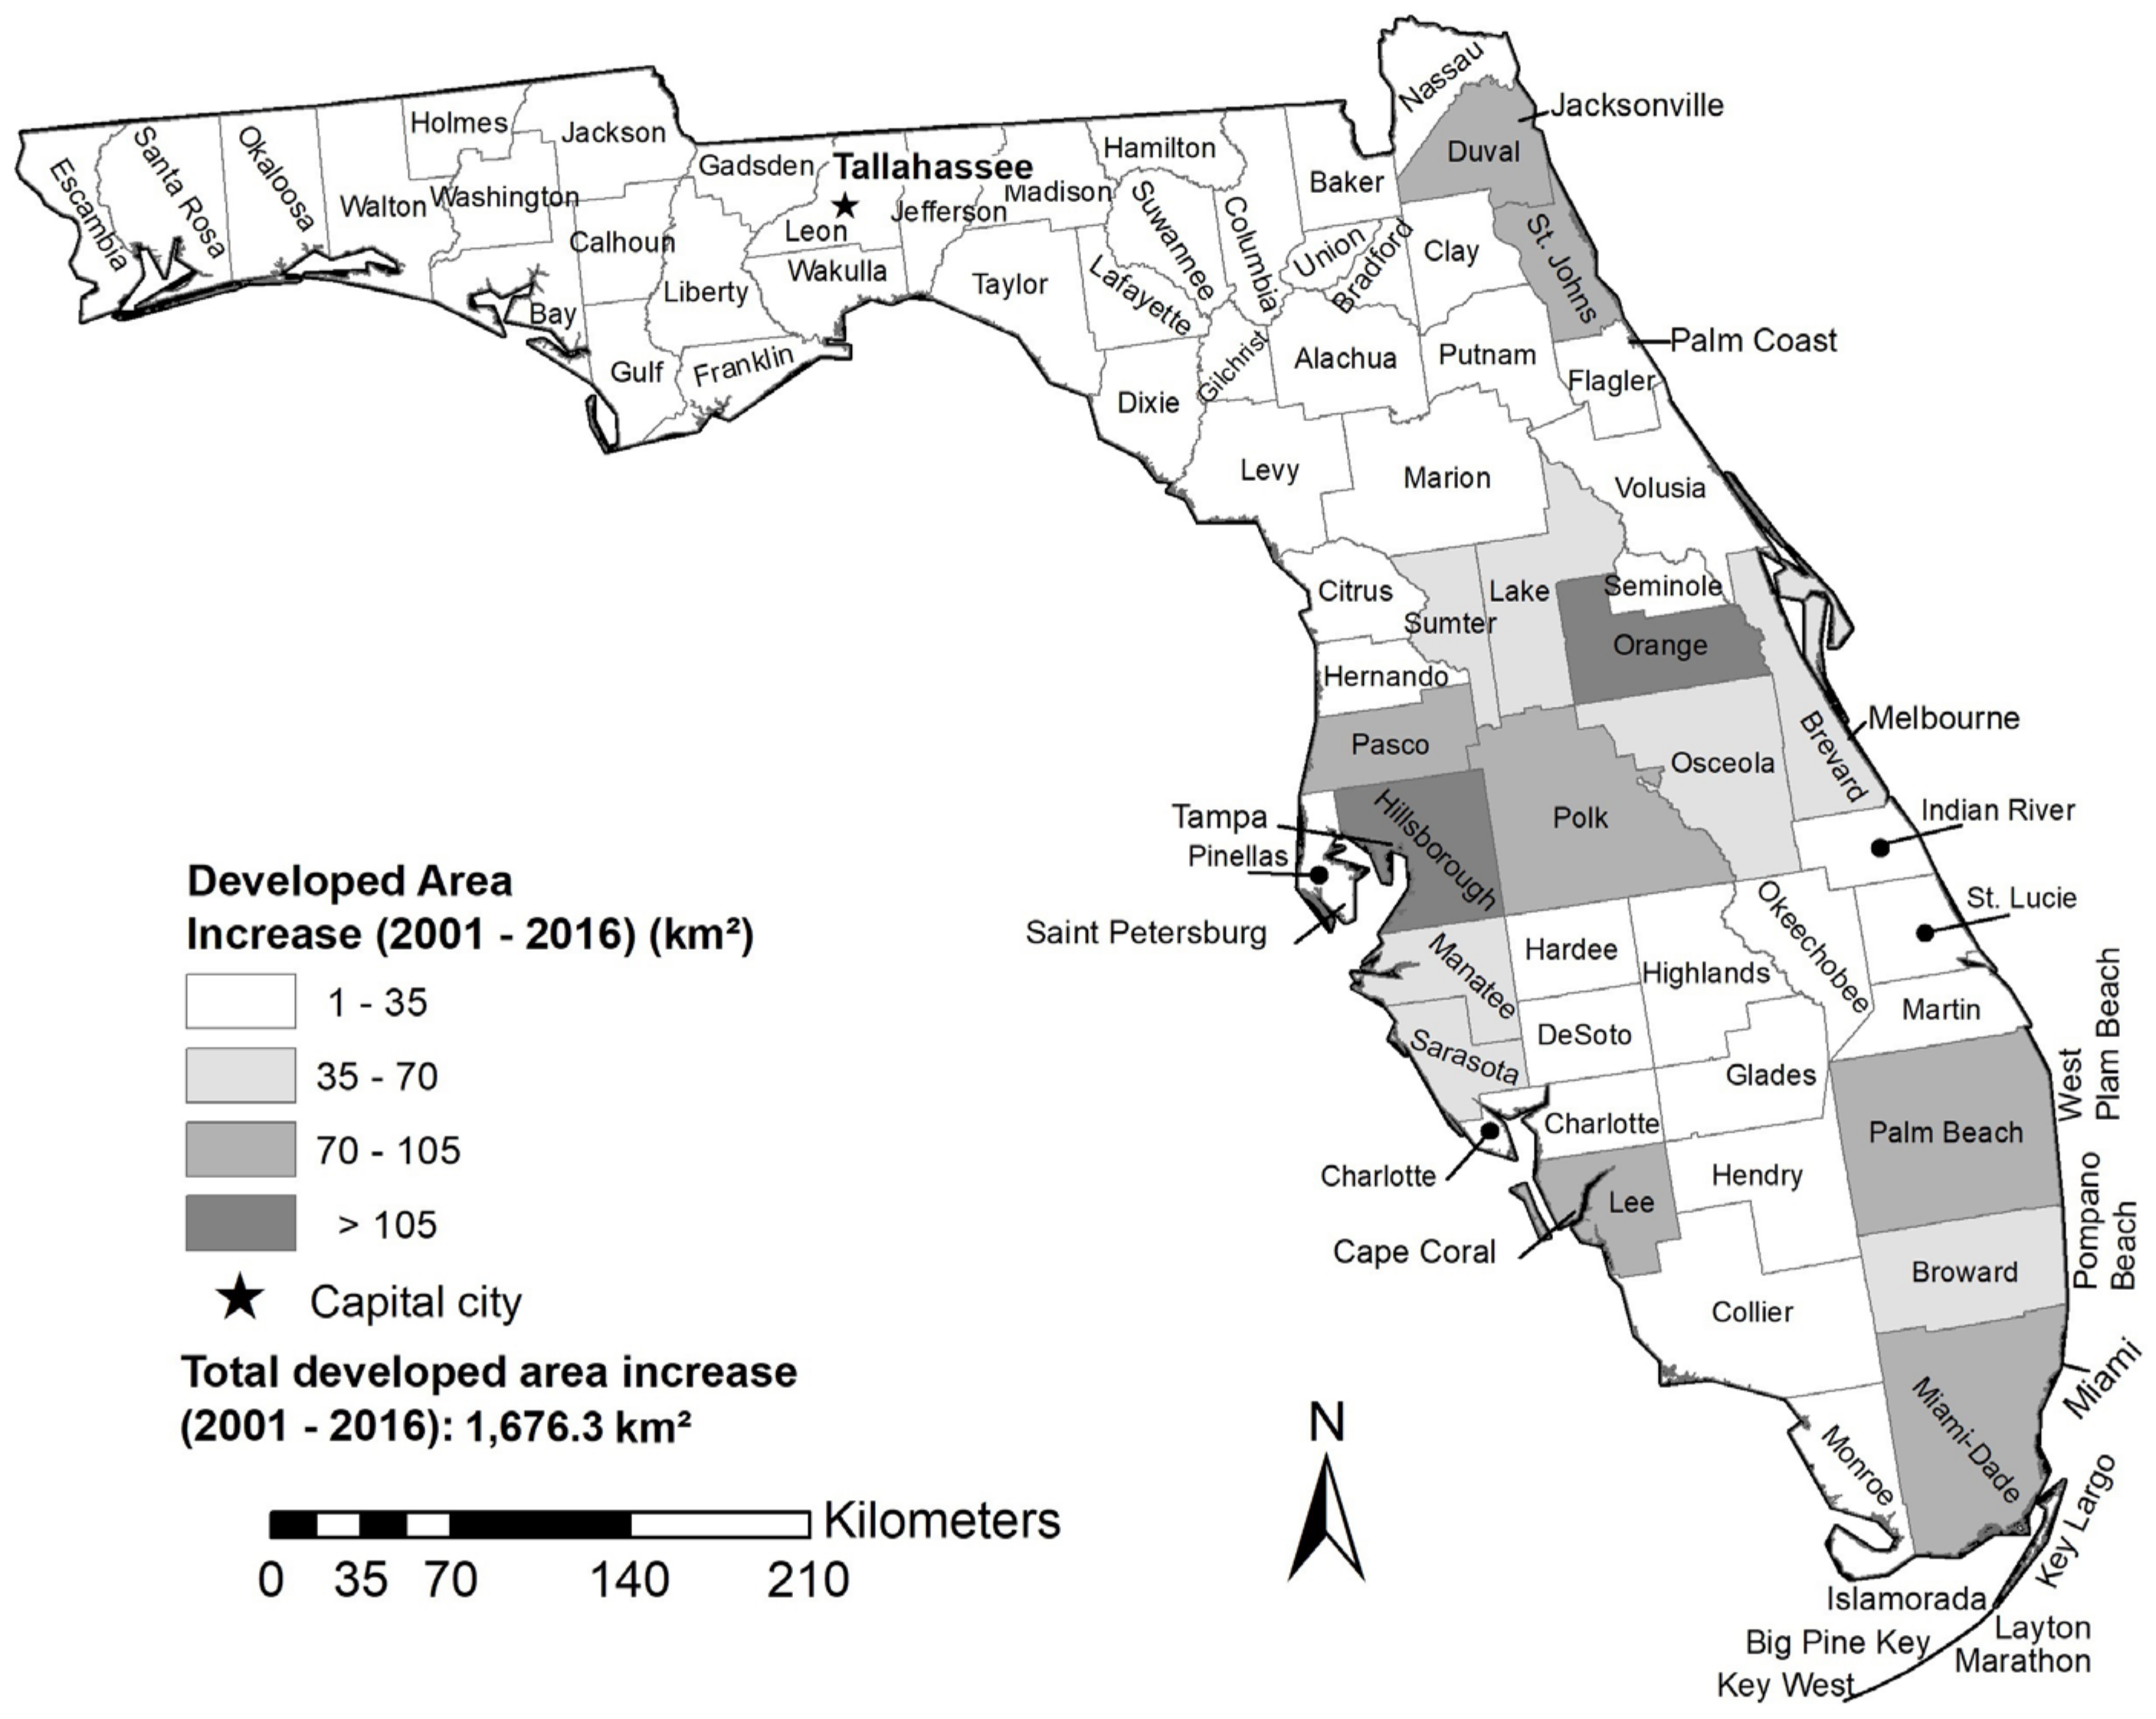
Loss and damage of land for soil carbon (C) sequestration potential because of land developments in the state of FL (USA), with a total of 20,249.6 km2 converted to developments prior and through 2016 (Table S3). Counties with some of the largest area losses to developments were Palm Beach County (1139.9 km2), Hillsborough (1001.7 km2), and Lee (900.5 km2). New developments from 2001 to 2016 resulted in a total of 1676.3 km2 converted to developments. Counties with some of the largest area losses to developments were Orange (137.4 km2), Hillsborough (105.9 km2), and Lee (96.3 km2). Most of the developments occurred around existing urban areas at the expense of forests and cultivated areas (Figure 6).
(2) 
Loss and damage of soil carbon (C) because of land developments prior and through 2016 in the state of Florida (USA) with a midpoint total of 3.0 × 10¹¹ kg in C losses (Table S3). Counties with some of the highest soil C losses were Palm Beach (2.3 × 10¹⁰ kg C), Broward (1.6 × 10¹⁰ kg C), and Orange (1.5 × 10¹⁰ kg C). New developments from 2001 to 2016 resulted in a total of 2.7 × 10¹⁰ kg in C losses. Counties with some of the highest soil C losses were Orange (2.5 × 10⁹ kg C) and Miami-Dade (2.4 × 10⁹ kg C) (Figure 7).
(3) 
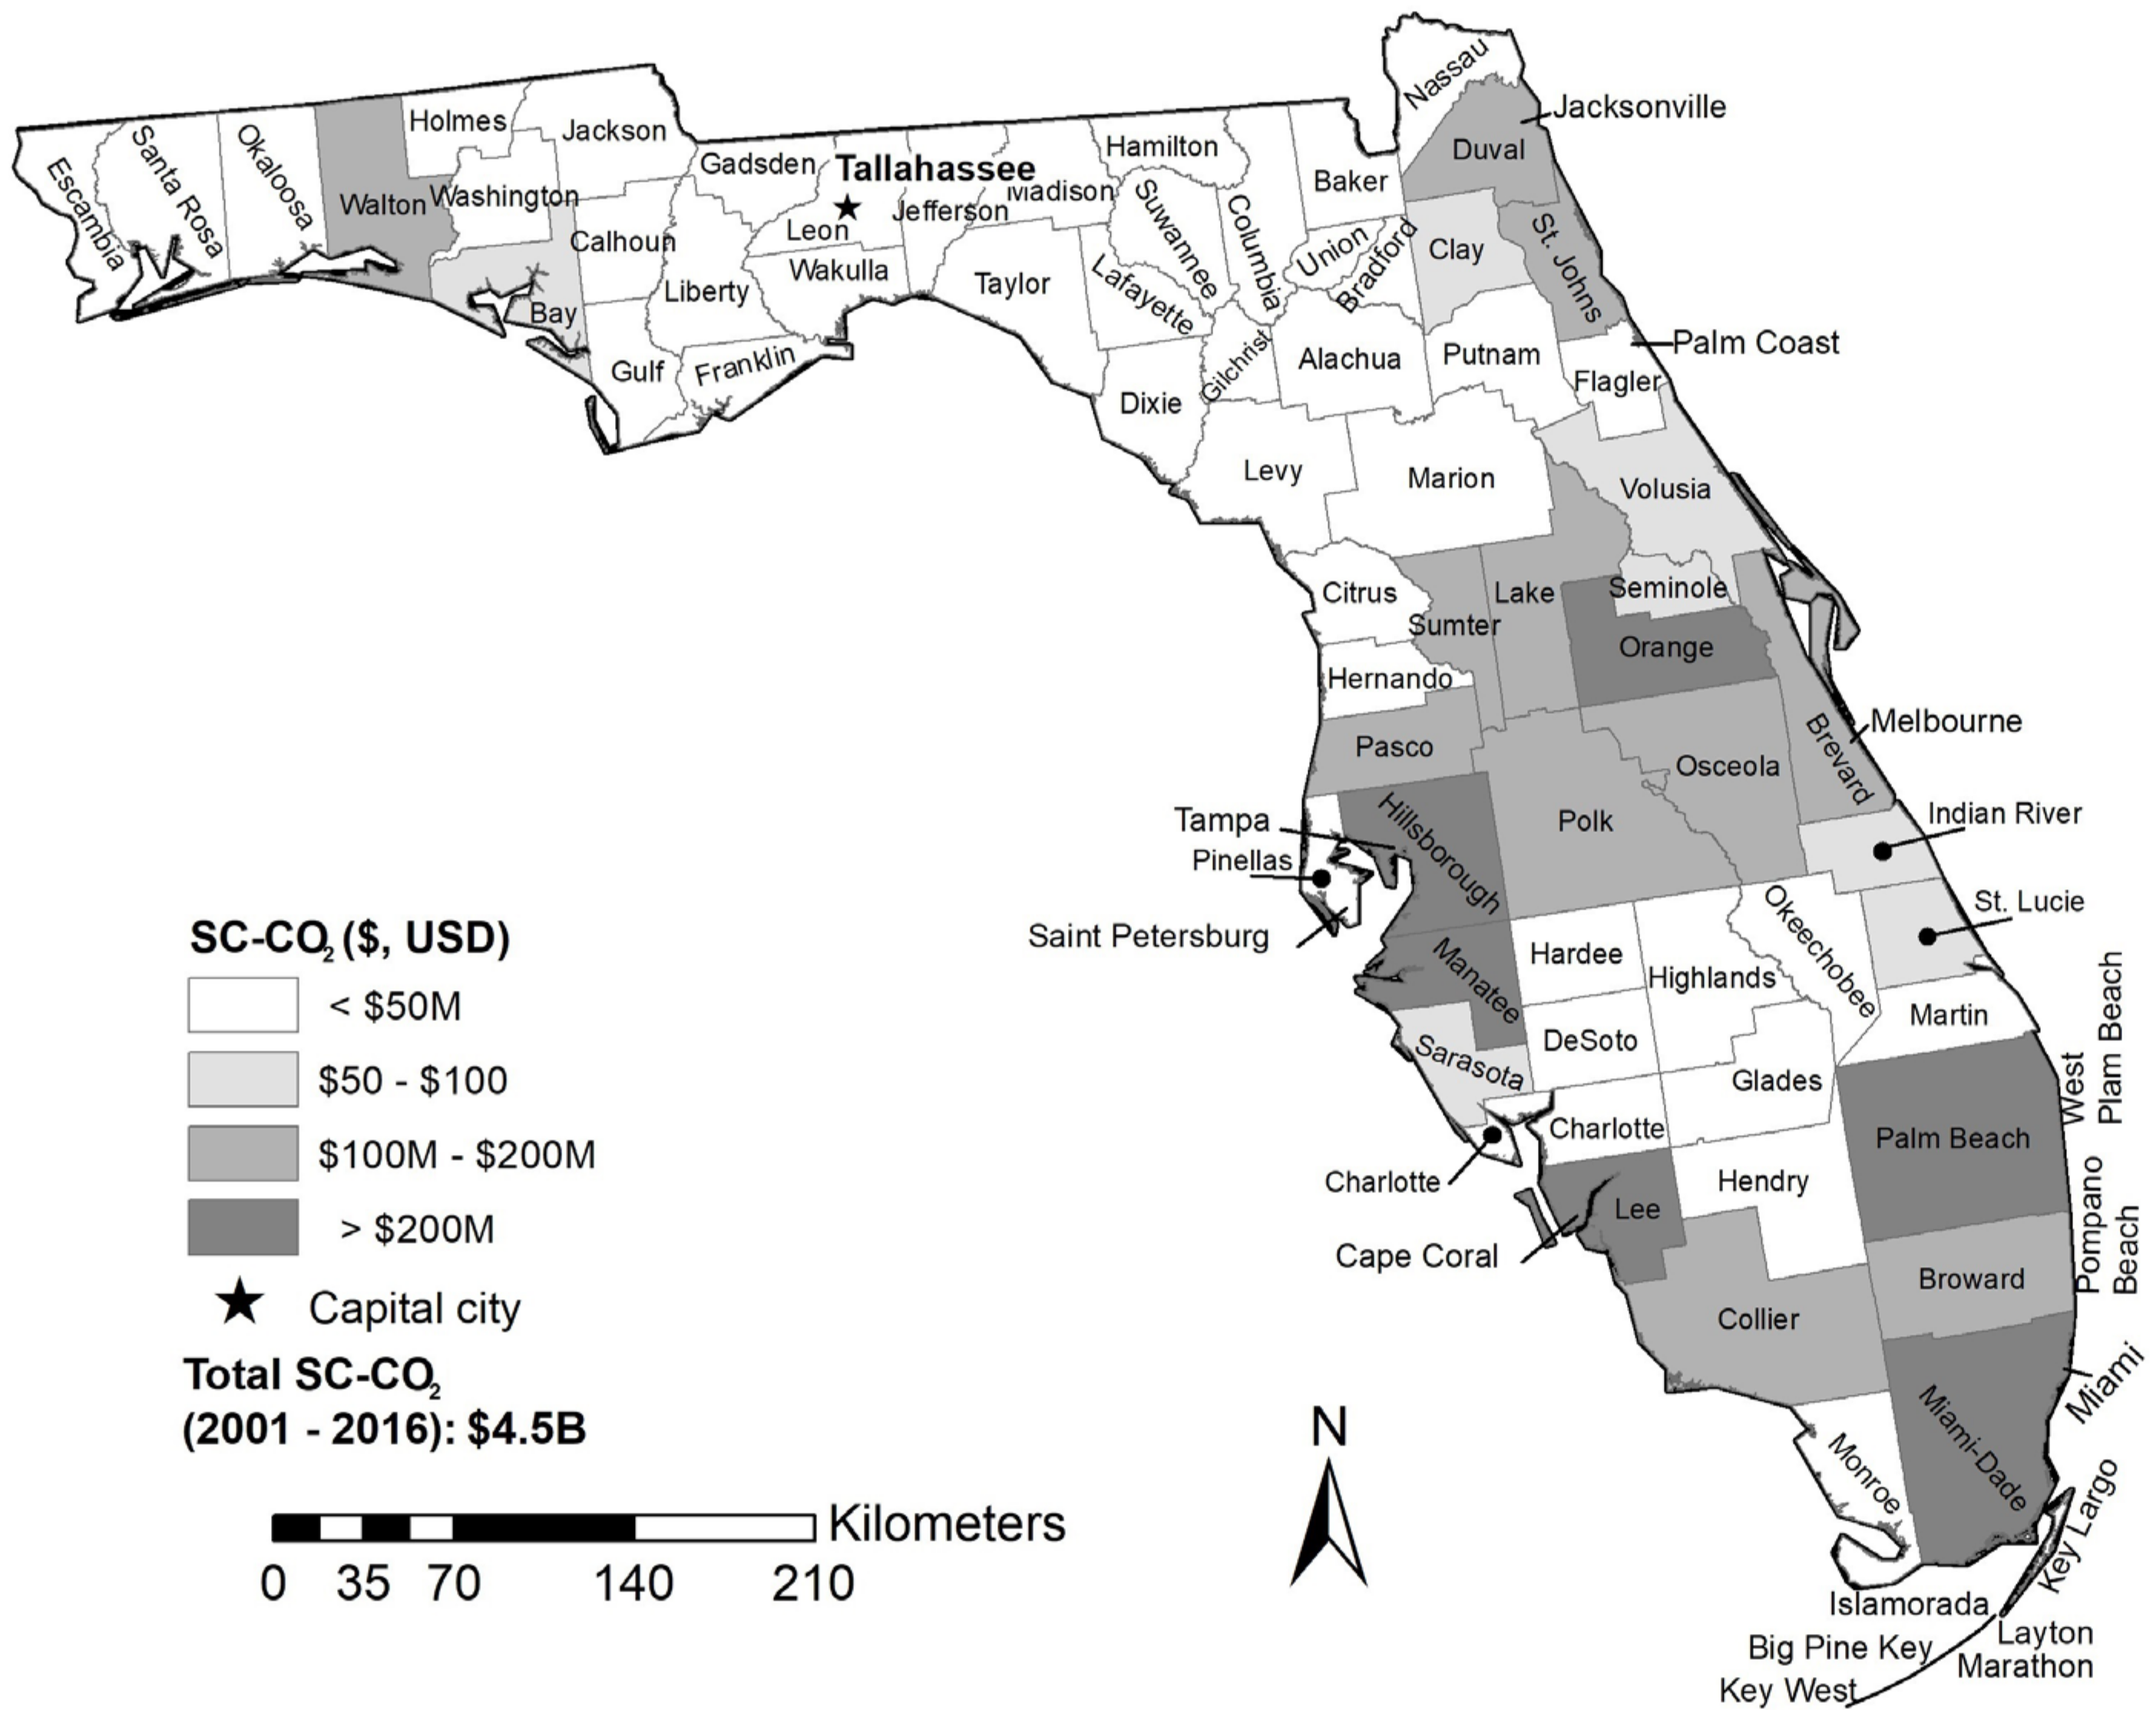
Loss and damage associated with the “realized” social costs of soil carbon (C) (SC-CO2) because of land developments prior and through 2016 in the state of FL (USA) with a midpoint total of $50.3B SC-CO2 (Table S3). Counties with some of the highest costs were Palm Beach ($3.8B), Broward ($2.6B), and Orange ($2.5B). New developments from 2001 to 2016 resulted in $4.5B SC-CO2. Counties with some of the highest costs were Orange ($417.5M), Miami-Dade ($411.3M), and Palm Beach ($255.7M) (Figure 8).
It is important to note that Figure 6, Figure 7 and Figure 8 have different patterns and meanings in terms of L&D. A map of L&D of land for soil carbon (C) sequestration potential because of land developments provides areas and shows patterns of L&D to help quantify and understand trends in L&D (Figure 6). The associated tables of LULC changes identify which C sequestering LULC types are being decreased and if these trends are sustainable. A map of L&D of soil carbon (C) because of land developments can be used to determine how much C should be sequestered to compensate for this loss (Figure 7). Lastly, a map of L&D associated with the social costs of soil carbon (C) (SC-CO2) because of land developments (Figure 8) provides a monetary estimate of past damages associated with these land developments, which can be solicited to fund compensation for climate change-related L&D (e.g., property loss from sea level rise, etc.). Our study shows that there may be a potential underestimate and undervaluing of L&D interpreted because of climate change only. Our study results demonstrate that L&D should constitute both L&D from GHG emissions from land conversions (Figure 6, Figure 7 and Figure 8) and L&D because of climate change (Figure 9 and Table 7). This study found a problem because the GHG emissions from land are assumed to be a fixed cost, based on an EPA social cost estimate, while L&D from climate change can be valued using market tools.

4.2. Significance of Results in Florida’s Loss and Damage (L&D) from Climate Change

Loss and damage from climate change are different from L&D from GHG emissions. For example, Figure 9 and Table 7 demonstrate potential land loss because of sea level rise that will have consequences to both built environments and the soil C sequestration potential in 47 out of 67 FL counties [30]. This loss could further limit the opportunity to mitigate GHG emissions and the related climate change impacts. Current land cover for the state of FL (Table 8) shows limited opportunities for soil C sequestration through reforestation because of a lack of available land without impacting agricultural lands. Lands potentially available (8.9%) for additional C sequestration through forestry are barren lands (0.5%), shrub/scrub (5.1%), and herbaceous (3.3%) (Table 8) are limited. In addition, continued development pressures (almost 1,000 people move to FL every day) will likely target the same lands that could be used to sequester C [18,31]. Much of recent and future development in FL is in locations that coincide with high L&D from climate change (Figure 8 and Figure 9).
With no payments required (e.g., taxes, fees, etc.) for GHG emissions from land developments, there are no disincentives to stop developments with high soil-based SC-CO2 and in climate risk-prone areas. The government of FL has allocated one billion US dollars to improve climate resilience without a state-wide plan based on actual vulnerability to climate change L&D [32]. These funds are to be allocated to harden existing infrastructure (e.g., moving roads, improving seawalls, installing pumps, etc.). This amount of funding is likely not at the proper scale to address the risks and does not link land development to risk and GHG emissions. Furthermore, it does not serve to direct development or relocate people away from areas with high L&D risk. Decisions about locations for mitigation efforts should consider the “moral hazard” of supporting the continued occupation and future development in areas with a high risk of L&D [32]. Enabling communities in these high L&D areas can lead to several impacts that go beyond the financial cost, including loss of human life, damage to the culture, and the human trauma associated with L&D.
Florida’s home insurance market is the “most unstable in the US,” and it is often limited to the state’s Citizens Property Insurance Corps, which has become the only available insurance option to cover wind damage from extreme weather events as private insurance companies leave the state after repeated heavy payouts [33]. Flood risk insurance is underwritten by US taxpayers through the National Flood Insurance Program (NFIP); however, many FL homeowners elect not to have flood insurance and rely on after-disaster federal assistance when water damage occurs [33]. The state’s Citizens Property Insurance Corps has a solvency mechanism to raise funds needed to cover disaster claims through an additional insurance policy tax [33]. The FL legislature is considering changes to require flood insurance, direct homeowners to private insurance when available, and strengthen the insurance market by providing reinsurance [34].
Figure 9. Projections of future sea rise and land loss due to climate change in Florida (USA).
Urbansci 07 00040 g009
Table 7. Selected county area loss (%) due to sea rise in the state of Florida (USA) (based on original ArcGIS Pro 2.6 [26] analysis of data from the National Oceanic and Atmospheric Administration (NOAA) [30]).
Selected Counties
(Affected by Sea Rise)
County Area Loss due to Sea Rise (%)
1 foot3 feet6 feet9 feet
Citrus5.710.915.418.9
Clay6.06.97.99.3
Collier6.89.915.723.5
Dixie5.611.017.121.6
Duval11.513.315.618.5
Franklin8.615.921.831.2
Gulf 7.615.823.332.6
Lee3.16.513.422.0
Levy6.510.815.620.8
Miami-Dade8.216.829.341.7
Monroe42.251.852.352.6
Pinellas4.87.216.423.9
Putnam12.213.815.217.0
St. Johns10.612.915.418.4
Taylor3.46.510.313.6
Volusia11.214.719.023.5
Wakulla5.78.514.319.7
Note: 47 out of 67 Florida’s counties are potentially affected by the projected sea-level rise.
Table 8. Land use/land cover (LULC) by soil order in Florida (USA) in 2016.
NLCD Land Cover Classes
(LULC)
2016 Total
Area by LULC
(km2)
Degree of Weathering and Soil Development
SlightModerateStrong
EntisolsInceptisolsHistosolsAlfisolsMollisolsSpodosolsUltisols
2016 Area by Soil Order (km2)
Barren land617.3296.219.227.234.1 9.6 159.2 71.8
Woody wetlands34,436.85111.53152.85823.55155.4 3201.26427.25565.2
Shrub/Scrub6518.01533.9138.149.1452.2 52.51606.42685.6
Mixed forest1079.9245.830.77.9101.0 17.0 283.0 394.7
Deciduous forest621.292.618.87.362.0 9.6 186.3 244.7
Herbaceous4226.91186.098.646.4380.3 39.7 827.01648.9
Evergreen forest25,882.65516.21002.0396.02317.4 304.3 5532.0 10,814.6
Emergent herbaceous wetlands8422.21742.1952.42771.11108.4 705.8 943.9 198.6
Hay/Pasture16,583.34387.1593.5319.22526.8 431.0 5559.9 2765.8
Cultivated crops9316.42059.7179.61891.41255.1 233.1 1376.4 2321.0
Developed, open space10,187.23462.0393.9226.71094.4 211.0 2563.8 2235.4
Developed, medium intensity2930.01317.3108.364.3251.2 71.6 704.6412.7
Developed, low intensity6254.82564.2234.2121.5574.7 131.5 1612.2 1016.5
Developed, high intensity877.6386.224.219.159.5 20.2 202.8 165.5
Totals127,954.329,900.86946.311,770.815,372.55438.327,984.530,541.0

4.3. Significance of Results in a Broader Context

4.3.1. Enhancing the Definitions of Climate-Change Loss and Damage (L&D)

The topic of L&D is at the center of climate change-related discussions worldwide. Many countries are experiencing climate change-related L&D and require financial resources to pay for them. The Paris Agreement has a special full article solely dedicated to L&D, which broadly states that “parties recognize the importance of averting, minimizing and addressing loss and damage associated with the adverse effects of climate change, including extreme weather events and slow onset events, and the role of sustainable development in reducing the risk of loss and damage [2]”. This document is somewhat general in nature and focuses primarily on climate change impacts, which can complicate the process of attributing the sources (Figure 10) and addressing the underlying causes of climate change. It does not mention the GHG emissions explicitly, which can complicate climate change attribution efforts, including assigning responsibility for climate change [35]. According to Baldrich (2021) [36], the relatively new legal science of “attribution science is divided into three types: (1) source attribution, (2) climate attribution, and (3) impact attribution”. Mikhailova et al. (2022) [37] demonstrated the importance of source attribution in “detecting and attributing sources of climate change impacts”. Using the state of Delaware as an example, Mikhailova et al. (2022) [37] demonstrated a “methodology to determine the source attribution of soil-based GHG emissions linked to land cover change, which could be used for current or future impact attribution”.
The most common question about L&D is: Who should pay for climate change-related L&D? [38]. This question misses the key concept of source attribution of GHG emissions, which can be quantified and provide a much clearer attribution route compared to many of the climate change impacts. The above question can be rephrased to: “Who should pay for GHG emissions and climate change L&D?” Traditionally, environmental law has relied on the polluter-pays-principle (PPP) [39], which could be incorporated into the global climate change agreements.
Our study identified a gap in the understanding of L&D because of the different per- spectives on L&D (e.g., economics, law, trading, human rights, etc.) [40,41]. According to Palekienė et al. (2014) [40], the concepts of L&D are used both in the economic and legal spheres with considerable overlap. Zhai (2022) [42] reported that the construct of L&D is often viewed as either “damages to human beings” or “damage to the environment”. Climate-change related L&D is an emerging field of study that lacks empirical data on how climate impacts harm natural and human systems [43].
Most of the many varied definitions of L&D are focused on the damages that impact humans, which causes a problem because this only considers the climate change L&D without considering GHG emissions, which cause these climate change L&D. Our study proposes to enhance the range of L&D definitions to recognize and include the “damage to the environment” from the GHG emissions as a component of the L&D (Figure 10). This study develops a new perspective on what comprises L&D by providing empirical data through detailed spatial accounting for GHG emissions because of land developments. It is important to expand the definition of L&D because it links climate change causation with impact, so that future GHG emissions can be reduced to curtail future L&D. Legal remedies for L&D are emerging and could be based on levels of GHG emissions by individuals, companies, or governments [44]. This L&D includes physical damage to the existence and function of ecosystems (e.g., coastal ecosystems and sea level rise).
Figure 10. Enhancing (new addition in red) the current different definitions of climate change-related loss and damage (L&D) (adapted from Boyd et al., 2021 [45]).
Urbansci 07 00040 g010

4.3.2. The “Moral Hazard” Issues Related to Loss and Damage (L&D)

Compensation for climate L&D was first proposed by small island nations that were inundated by rising sea levels because of climate change. In a report in 1991, they argued that the large countries that had emitted the GHG that caused the islands’ severe L&D from rising sea levels should provide compensation to the islands; those who create the L&D should pay for the L&D [46]. The calls for compensation for L&D gained traction and have been discussed at various international conferences. For example, the concept has been discussed at the various annual United Nations (UN) Climate Change Conferences, beginning in 2007 with COP13. At COP21 in 2015, the Paris Agreement endorsed a mechanism for compensation for L&D. In 2022’s COP27, pledges were made by developed countries for such compensation, and there were promises to create 2023’s COP28-specific mechanisms for collecting and distributing the compensatory funds [3].
So far, only words have been distributed, not money, and political and economic issues could conceivably derail further progress. But the world is on the brink of beginning a program to compensate some countries who incur L&D because of other countries’ GHG emissions. Care must be exercised to ensure that such programs do not cause unintended harm. The L&D from climate change stem not only from the resulting flooding and severe weather. In addition, growing L&D is also often caused by growing exposure [47]. For example, one hundred years ago in FL, an increase in seawater level or a hurricane would have caused L&D with little value. Relatively few people lived on Florida’s coast, and few homes and businesses were located there. Even a catastrophic hurricane or flood would cause little property damage because there was little property there to damage.
In contrast, in recent decades, exposure has increased dramatically, with Florida’s population has risen steeply, especially along the FL coast, accompanied by a large rise in development. Consequently, the L&D from climate change—from rising sea levels and frequent hurricanes—is far larger now than it would have been 50 years ago if the same climate changes had occurred then. Fifty years ago, much potential L&D could have been reduced by adaptation—so-called Climate Change Adaptation (CCA) [48,49]. For example, to respond to moderate rises in sea levels, the few eroded beaches near population centers could be repaired. Likewise, to allow homes and commercial buildings to survive increasing numbers of hurricanes, building codes could require stouter structures.
In contrast, since then, FL has engaged in Reverse Climate Change Adaption (RCCA): instead of becoming more resilient to climate change over the last decades, FL has become more vulnerable. This is because many more people and businesses have moved directly into the precise coastal areas where climate change threatens the most.
Populations in Florida’s vulnerable zones have grown so much that the areas may effectively be beyond adaptation so that there are now “unavoided or unavoidable impacts that go beyond adaptation” [50]. Many people and businesses have moved close to the water and have invested greatly there. The land and the real estate there had become so valuable that it may be practically and politically impossible to avoid large regular climate-related L&D. Fifty years ago, when there were relatively few people on the FL coast, it might have been possible to require them to move inland and prevent further development in vulnerable areas. Now, however, this is much more difficult--as difficult as requiring New Yorkers to evacuate Manhattan. Instead, what will now occur is regular disasters with large L&D and continual expensive rebuilding. This will be accompanied by ever more expensive and ineffective attempts to adapt. Sea walls will grow ever higher and more expensive in a losing battle to hold back a rising sea.
An important reason that FL has engaged in this unfortunate reverse CCA is the moral hazard (increased risk from behavior that is caused by having insurance) that results from U.S. policy for providing aid after natural disasters. As already mentioned, the U.S. effectively provides free insurance for FL homeowners for natural disasters. Indeed, the federal government often insures homeowners and investors from natural disasters at more than 100%; the federal government’s compensation amounts are often greater than the losses, so homeowners and investors profit from the disaster. “In many cases, communities actually come out economically better off following a disaster, after copious amounts of public aid flow in and literally build the town back better” [51].
This moral hazard encourages people to live in areas of FL that experience disasters, even though the expected costs from the disasters will be high. This is because the people will not pay the costs. Instead, the federal government effectively provides free insurance, paying the costs and even providing more than the costs. When people are completely insured so that they do not incur the costs of an activity, they do too much of the activity. This is precisely the situation on the FL coast. If people had to pay the full costs of living in FL hurricane zones with flooding because of rising sea levels, then far fewer people would live there. Instead, the federal government’s free insurance permits the people to consider only the benefits of living on the coast and ignore the costs; the federal government will reimburse any costs. Indeed, the moral hazard is especially great because the federal government will reimburse an amount above the actual costs. That is, the federal government pays people to move to areas where L&D will be highest; the federal government reimburses all the L&D from living in a vulnerable area, plus provides an additional subsidy for moving there. People respond to these incentives and move to disaster areas.
Far more people live on Florida’s coasts than if they had to pay the full costs—that is, if either they had to pay for their own rebuilding after a natural disaster, or they had to pay the full costs of insurance. A vicious cycle is established. Environmental disasters occur. The government pays huge amounts of relief money. Even more, people move to vulnerable areas. More disasters occur. The government pays out ever larger amounts: payouts from the U.S. Federal Emergency Management Agency (FEMA) over the last two years were more than $160 billion, dwarfing previous years’ payouts [51].
The experience in FL is a stark intranational warning of how international programs for compensation for L&D could increase harm from climate change rather than reduce them. The program by which the federal government compensates FL property owners for L&D from climate-related natural disasters is similar to the programs that are urged on wealthy polluting countries to compensate less developed countries for climate-related L&D. Indeed, the L&D movement began with attempts by small island nations to obtain compensation from wealthy nations for the climate-related L&D that the wealthy nations’ GHG emissions had caused. In 2022’s COP27, wealthy nations began making pledges for compensating developing nations for climate-related L&D, and expectations are that, at 2023’s COP28, details will be worked out for distributing the aid [3]. Likewise, many lawsuits by cities and states against oil companies seek to obtain compensation for climate-related L&D [52,53]. Such lawsuits could result in judgments that would provide substantial compensation to those in less-developed nations who have suffered damages because of climate change.
The U.S. experience demonstrates that such compensation, although well-meaning, might have the unintended consequence of increasing future L&D, leading to more death and destruction, not less. Without compensation, people or businesses in low-income countries would have little choice but to move away from areas that are vulnerable to climate-related L&D. Affordable insurance would probably be unavailable on the private market—as in FL [51]. Any family or business that remained in a vulnerable coastal area would be exposing themselves to the substantial risk of permanently losing all of their property and belongings. Economic incentives would thus cause many of these people and businesses to locate to safer, less-vulnerable areas—on higher ground and away from areas exposed to hurricanes.
In contrast, if compensation were provided—either through voluntary contributions from developed countries or from court judgments—people would lack incentives to leave vulnerable areas. Just as in FL, the prospect of generous compensation would create incentives to remain in danger’s path. Indeed, compensation as generous as in FL would induce additional people and businesses to move into vulnerable areas. The moral hazard from the expected compensation would cause people to do exactly the opposite of what should be done to avoid death and destruction: as in FL, generous compensation would cause people to move to danger rather than away from it. Compensation that might seem just and generous would instead lead to further harm and devastation. Just as federal compensation caused Florida’s population to remain in coastal areas in flood and hurricane zones, compensation could cause populations of small island nations to remain and rebuild after floods rather than move to safer areas. This would render these populations exposed to even greater death and loss as seas continue to rise and hurricanes worsen.
Accordingly, international programs for compensation of L&D should be constructed carefully to avoid the harms that the moral hazard from such programs might create. Such programs should ensure that they do not inadvertently induce people to remain in high-risk areas, exposing them and their countries’ economies to existential risk. For example, such programs could insist that, to receive compensation, countries and their inhabitants relocate to safer areas where they are not exposed to future climate-related L&D. For example, perhaps the award of compensation funds should be conditioned on not being used for rebuilding in vulnerable areas. To receive the funds, countries should be required to move their populations away from vulnerable coasts. Likewise, to receive funds, inhabitants of small islands without higher ground should be required to leave the islands. If these conditions are not imposed, compensation may well be counterproductive; although it might compensate current victims of climate change, it could induce future injury and damages as people remain in dangerous areas.
In the U.S., FEMA, in halting steps, is attempting to reduce the moral hazard created by its compensation programs. For example, instead of providing funds for owners of destroyed homes to rebuild, FEMA is experimenting instead with buying the destroyed homes and returning the property to a natural shoreline [46]. Although the homeowners are protected from loss by the government’s buyout, the buyout prevents the homeowner from continuing to live on the vulnerable property.

5. Conclusions

Climate change-related L&D is a consequence of GHG emissions and is often framed in terms of liability, compensation, risk, and insurance. Greenhouse gas emissions are not only the cause of climate change but L&D itself. To make progress on climate change, it is necessary to link emissions with L&D. This link may not prove that a particular L&D was caused by an emission event. However, given the global nature of climate change; it is reasonable to associate decisions that result in GHG emissions with L&D by considering nearby GHG emissions or GHG emissions within a particular administrative boundary. In this way, climate change mitigation planning can both attribute past emissions while limiting future emissions in the communities most impacted by L&D. This study examined the soil-based CO2 emissions from land developments in FL and concluded that developments caused the following L&D: loss of land for future C sequestration, loss of soil C from these developed lands, which resulted in “realized” social costs of CO2 emissions. Soil C loss in FL has been occurring at a rapid rate considering the geologic time scale of soil formation. These findings have the following implications for the related topics of liability, compensation, risk, and insurance. The state of FL recognizes its liability for GHG emissions as indicated by Executive Order number 07-127, “Establishing Immediate Actions to Reduce Greenhouse Gas Emissions within FL,” which requires a more complete accounting for GHG gases. In this respect, our study identified a gap in FL’s GHG accounting because of the exclusion of soil-based emissions from the state’s emission footprint. Our study quantified and valued soil-based emissions based on a fixed value of the social cost of CO2 from the US EPA; however, there are no current mechanisms to assign responsibility or collect these or other funds for L&D compensation. Compensation for much of the climate change-associated L&D in FL from extreme weather events comes from the federal government and is therefore borne by the US taxpayers and the victims. The costs to address L&D are market-based, while the calculated social cost of emissions is fixed and does not scale to the true cost of L&D. Our study showed that the main areas of development in FL are located around existing urban areas and high climate change impact risk areas. Our findings show that this rapid expansion of development in and around urban areas with high climate change risks will likely strain existing insurance resources. In the broader context, the problem of who should pay for climate-related L&D worldwide, cannot be solved unless the “polluter-pays-principle” is followed to ensure accountability and fairness. Our study also argued that the L&D definitions should be enhanced to incorporate “damage to the environment” from these GHG emissions as a component of the L&D that recognizes the GHG emissions as L&D that cause further human and environmental L&D. Exclusion of GHG L&D causes an unnecessary disconnect between the cause and the L&D impacts. This helps to identify the responsible parties for L&D due to climate change.
In addition, Florida’s experience demonstrates the flaws of some proposals to protect against climate L&D. Many proposals recommend that less-developed countries that have suffered climate-change L&D because of GHG emissions from developed countries should receive compensation from the developed countries. However, these proposals for providing what are, in effect, insurance payments to less-developed countries may create inefficient incentives for rebuilding in disaster-prone areas rather than moving to safer areas. Florida’s experience demonstrates this problem, where subsidized federal insurance and disaster relief cause continual rebuilding in flood-prone areas. Instead, this FL case study shows that any compensation programs for L&D should prohibit rebuilding in disaster-prone areas so as to prevent moral hazard and reverse climate change adaptation.

Supplementary Materials

The following supporting information can be downloaded at: https://www.mdpi.com/article/10.3390/urbansci7020040/s1, Table S1. Distribution of soil carbon regulating ecosystem services in the state of Florida (USA) by soil order; Table S2. Increases in developed land and maximum potential for realized social costs of carbon (C) due to complete loss of total soil carbon (TSC) of developed land by soil order in Florida (USA) from 2001 to 2016; Table S3. Developed land and maximum potential for realized social costs of carbon (C) due to complete loss of total soil carbon (TSC) of developed land by soil order in Florida (USA) prior and through 2016.

Author Contributions

Conceptualization, E.A.M.; methodology, E.A.M., M.A.S. and H.A.Z.; formal analysis, E.A.M. and S.J.K.; writing—original draft preparation, E.A.M. and G.C.P.; writing—review and editing, E.A.M., C.J.P., G.C.P., G.B.S. and M.A.S.; visualization, H.A.Z., L.L. and Z.H. All authors have read and agreed to the published version of the manuscript.

Funding

This research received no external funding.

Institutional Review Board Statement

Not applicable.

Informed Consent Statement

Not applicable.

Data Availability Statement

Not applicable.

Acknowledgments

We thank the reviewers for their constructive comments and suggestions.

Conflicts of Interest

The authors declare no conflict of interest.

Glossary

BSBase saturation
CFCarbon footprint
CCAClimate Change Adaptation
CO2Carbon dioxide
COPConference of the Parties
EDEcosystem disservices
ESEcosystem services
EPAEnvironmental Protection Agency
FLFlorida
GHGGreenhouse Gases
L&DLoss and damage
LULCLand use/land cover
NOAANational Oceanic and Atmospheric Administration
NRCSNatural Resources Conservation Service
PPPPolluter-pays-principle
RCCAReverse Climate Change Adaptation
SC-CO2Social cost of carbon emissions
SDGsSustainable Development Goals
SOCSoil organic carbon
SICSoil inorganic carbon
SOMSoil organic matter
SSURGO
STATSGO
Soil Survey Geographic Database
State Soil Geographic Database
TSCTotal soil carbon
USDAUnited States Department of Agriculture
WIMWarsaw International Mechanism

References

  1. Vanhala, L.; Hestbaek, C. Framing climate change loss and damage in UNFCCC negotiations. Glob. Environ. Polit. 2016, 16, 111–129. [Google Scholar] [CrossRef]
  2. United Nations. Paris Agreement. 2015. Available online: https://unfccc.int/sites/default/files/english_paris_agreement.pdf (accessed on 30 November 2022).
  3. UN Climate Press Release. COP27 Reaches Breakthrough Agreement on New “Loss and Damage” Fund for Vulnerable Countries. 20 November 2022. Available online: https://unfccc.int/news/cop27-reaches-breakthrough-agreement-on-new-loss-and-damage-fund-for-vulnerable-countries (accessed on 30 November 2022).
  4. Martyr-Koller, R.; Thomas, A.; Schleussner, C.F.; Nauels, A.; Lissner, T. Loss and damage implications of sea-level rise on Small Island Developing States. Curr. Opin. Environ. Sustain. 2021, 50, 245–259. [Google Scholar] [CrossRef]
  5. Clarke, B.; Otto, F.; Stuart-Smith, R.; Harrington, L. Extreme weather impacts of climate change: An attribution perspective. Environ. Res. Clim. 2022, 1, 012001. [Google Scholar] [CrossRef]
  6. Bouwer, L.M. Observed and Projected Impacts from Extreme Weather Events: Implications for Loss and Damage. In Loss and Damage from Climate Change; Climate Risk Management, Policy and Governance; Mechler, R., Bouwer, L., Schinko, T., Surminski, S., Linnerooth-Bayer, J., Eds.; Springer: Cham, Switzerland, 2019. [Google Scholar] [CrossRef]
  7. Lai, M.; Robinson, S.A.; Salas, E.; Thao, W.; Shorb, A. Climate justice for small island developing states: Identifying appropriate international financing mechanisms for loss and damage. Clim. Policy 2022, 22, 1213–1224. [Google Scholar] [CrossRef]
  8. Bhandari, P.; Warszawski, N.; Cogan, D.; Gerholdt, R. What Is “Loss and Damage” from Climate Change? 6 Key Questions, Answered. World Resources Institute. 2022. Available online: https://www.wri.org/insights/loss-damage-climate-change (accessed on 30 November 2022).
  9. State of Florida Executive Order No. 07-127. Establishing Immediate Actions to Reduce Greenhouse Gas Emissions within Florida. Available online: https://www.fsec.ucf.edu/en/media/enews/2007/pdf/07-127-emissions.pdf (accessed on 30 November 2022).
  10. Governor’s Action Team on Energy and Climate Change. Florida’s Energy & Climate Change Action Plan. 15 October 2008. Available online: https://drought.unl.edu/archive/plans/Climate/state/FL_2008.pdf (accessed on 30 November 2022).
  11. Soil Science Society of America. n.d. USDA. Myakka—Florida State Soil. Available online: https://www.soils4teachers.org/files/s4t/k12outreach/fl-state-soil-booklet.pdf (accessed on 1 December 2022).
  12. Mikhailova, E.A.; Zurqani, H.A.; Post, C.J.; Schlautman, M.A.; Post, C.J. Soil diversity (pedodiversity) and ecosystem services. Land 2021, 10, 288. [Google Scholar] [CrossRef]
  13. Soil Survey Staff; Natural Resources Conservation Service; United States Department of Agriculture. n.d.a.; Soil Survey Geographic (SSURGO) Database. Available online: https://nrcs.app.box.com/v/soils (accessed on 10 September 2021).
  14. The United States Census Bureau. TIGER/Line Boundary Shapefiles. 2018. Available online: https://www.census.gov/geographies/mapping-files/time-series/geo/tiger-line-file.2018.html (accessed on 10 September 2022).
  15. EPA—United States Environmental Protection Agency. What Climate Change Means for Florida. EPA 430-F-16-011. August 2016. Available online: https://digital.library.unt.edu/ark:/67531/metadc949070/ (accessed on 5 December 2022).
  16. Reyes, M. Hurricane Ian Will Cost US Insurers $63 Billion, Risk Modeler Says. Bloomberg. September 2022. Available online: https://www.bloomberg.com/news/articles/2022-09-30/hurricane-ian-to-cost-us-insurers-63-billion-risk-modeler-says (accessed on 5 December 2022).
  17. Sklar, F.H.; Carlson, C.; Coronado-Molina, C.; Maran, A.C. Coastal ecosystem vulnerability and sea level rise (SLR) in South Florida: A mangrove transition projection. Front. Ecol. Evol. 2021, 9, 1–17. [Google Scholar] [CrossRef]
  18. Sullivan, B. Florida’s Population has Skyrocketed. That could Make Hurricane Ian more Destructive. National Public Radio (NPR). Available online: https://www.npr.org/2022/09/28/1125469629/hurricane-ian-florida-cost (accessed on 5 December 2022).
  19. U.S. Bureau of the Census. Statistical Abstract of the United States: 1991. Washington, DC. 1991; p. 201. Available online: https://www.census.gov/library/publications/1991/compendia/statab/111ed.html (accessed on 10 December 2021).
  20. Sea Level Rise Viewer by the U.S. National Oceanic and Atmospheric Administration. Available online: https://coast.noaa.gov/digitalcoast/tools/slr.html (accessed on 5 December 2022).
  21. ESRI Hurricane Ian National Oceanic and Atmospheric Administration Imagery Viewer. Available online: https://disasterresponse.maps.arcgis.com/apps/instant/media/index.html?appid=4debf5ef1d4c493489f8c9de66107931 (accessed on 5 December 2022).
  22. EPA—United States Environmental Protection Agency. The Social Cost of Carbon. EPA Fact Sheet. 2016. Available online: https://19january2017snapshot.epa.gov/climatechange/social-cost-carbon_.html (accessed on 15 September 2022).
  23. Guo, Y.; Amundson, R.; Gong, P.; Yu, Q. Quantity and spatial variability of soil carbon in the conterminous United States. Soil Sci. Soc. Am. J. 2006, 70, 590–600. [Google Scholar] [CrossRef]
  24. Groshans, G.R.; Mikhailova, E.A.; Post, C.J.; Schlautman, M.A.; Zhang, L. Determining the value of soil inorganic carbon stocks in the contiguous United States based on the avoided social cost of carbon emissions. Resources 2019, 8, 119. [Google Scholar] [CrossRef]
  25. Multi-Resolution Land Characteristics Consortium—MRLC. Available online: https://www.mrlc.gov/ (accessed on 1 September 2021).
  26. ESRI (Environmental Systems Research Institute). ArcGIS Pro 2.6. Available online: https://pro.arcgis.com/en/pro-app/2.6/get-started/whats-new-in-arcgis-pro.htm (accessed on 1 March 2022).
  27. Mikhailova, E.A.; Groshans, G.R.; Post, C.J.; Schlautman, M.A.; Post, C.J. Valuation of total soil carbon stocks in the contiguous United States based on the avoided social cost of carbon emissions. Resources 2019, 8, 157. [Google Scholar] [CrossRef]
  28. Mikhailova, E.A.; Groshans, G.R.; Post, C.J.; Schlautman, M.A.; Post, G.C. Valuation of soil organic carbon stocks in the contiguous United States based on the avoided social cost of carbon emissions. Resources 2019, 8, 153. [Google Scholar] [CrossRef]
  29. Soil Survey Staff; Natural Resources Conservation Service; United States Department of Agriculture. Photos of Soil Orders. Available online: https://www.nrcs.usda.gov/wps/portal/nrcs/detail/soils/edu/?cid=nrcs142p2_053588 (accessed on 20 September 2022).
  30. National Oceanic and Atmospheric Administration (NOAA). Climate.gov. Available online: https://www.climate.gov/maps-data (accessed on 2 October 2022).
  31. Roberts, D. Florida’s Fatal Attraction. The Atlantic. 2022. Available online: https://www.theatlantic.com/ideas/archive/2022/10/florida-hurricane-ian-damage-desantis/671630/ (accessed on 10 December 2022).
  32. Bruggers, J.; Green, A. Florida Commits $1 Billion to Climate Resilience. But After Hurricane Ian, Some Question the State’s Development Practices. 2022. Inside Climate News. Available online: https://insideclimatenews.org/news/08102022/florida-commits-1-billion-to-climate-resilience-but-after-hurricane-ian-some-question-the-states-development-practices/ (accessed on 10 December 2022).
  33. Grabar, H. What Happens When You Add a Hurricane Crisis to an Insurance Crisis? Slate. 2022. Available online: https://slate.com/business/2022/10/florida-hurricane-ian-insurance-homeowners-crisis.html (accessed on 10 December 2022).
  34. Mower, L. Florida Lawmakers Reveal Proposed Changes to Property Insurance Laws. Miami Herald. 2022. Available online: https://www.miamiherald.com/news/politics-government/state-politics/article269839242.html (accessed on 12 December 2022).
  35. Burger, M.; Wentz, J.; Horton, R. The law and science of climate change attribution. Columbia J. Environ. Law 2020, 45, 57–240. [Google Scholar]
  36. Baldrich, R. The Role of Climate Science in Litigation against Carbon Majors. ISIpedia. 2021. Available online: https://www.isipedia.org/story/the-role-of-climate-science-in-litigation-against-carbon-majors/ (accessed on 12 December 2022).
  37. Mikhailova, E.A.; Lin, L.; Hao, Z.; Zurqani, H.A.; Post, C.J.; Schlautman, M.A.; Post, G.C.; Shepherd, G.B. Delaware’s Climate Action Plan: Omission of source attribution from land conversion emissions. Laws 2022, 11, 41. [Google Scholar] [CrossRef]
  38. Roberts, J.T.; Natson, S.; Hoffmeister, V.; Durand, A.; Weikmans, R.; Gewirtzman, J.; Huq, S. How will we pay for loss and damage? Ethics Policy Environ. 2017, 20, 208–226. [Google Scholar] [CrossRef]
  39. Khan, M.R. Polluter-pays-principle: The cardinal instrument for addressing climate change. Laws 2015, 4, 638–653. [Google Scholar] [CrossRef]
  40. Palekienė, O.; Bruneckienė, J.; Simanavičienė, Ž. Critical analysis of loss and damage concepts under process of economic 720 assessment. Procedia-Soc. Behav. Sci. 2014, 156, 304–309. [Google Scholar] [CrossRef]
  41. Broberg, M.; Romera, B.M. Loss and damage after Paris: More bark than bite? Clim. Policy 2020, 20, 661–668. [Google Scholar] [CrossRef]
  42. Zhai, T. Double-faceted environmental civil liability and the separate-regulatory paradigm: An inspiration for China. Sustainability 2022, 14, 4369. [Google Scholar] [CrossRef]
  43. Van der Geest, K.; Warner, K. Loss and damage from climate change: Emerging perspectives. Int. J. Glob. Warm. 2015, 8, 133–140. [Google Scholar]
  44. Doelle, M.; Seck, S. Loss and damage from climate change: From concept to remedy? Clim. Policy 2020, 20, 669–680. [Google Scholar] [CrossRef]
  45. Boyd, E.; Chaffin, B.C.; Dorkenoo, K.; Jackson, G.; Harrington, L.; N’Guetta, A.; Johansson, E.L.; Nordlander, L.; De Rosa, S.P.; Raju, E.; et al. Loss and damage from climate change: A new climate justice agenda. One Earth 2021, 4, 1365–1370. [Google Scholar] [CrossRef]
  46. Mechler, R.; Calliari, E.; Bouwer, L.M.; Schinko, T.; Surminski, S.; Linnerooth-Bayer, J.; Huggel, C.; Wallimann-Helmer, I. Science for Loss and Damage. Findings and Propositions. In Loss and Damage from Climate Change; Mechler, R., Bouwer, T.S., Surminski, S., Linnerooth-Bayer, J., Eds.; Springer Open: Cham, Switzerland, 2019; Chapter 1; pp. 3–38. [Google Scholar]
  47. Van den Homberg, M.; McQuistan, C. Technology for Climate Justice: A Reporting Framework for Loss and Damage as Part of Key Global Agreements. In Loss and Damage from Climate Change; Mechler, R., Bouwer, T.S., Surminski, S., Linnerooth-Bayer, J., Eds.; Springer Open: Cham, Switzerland, 2019; Chapter 22; pp. 513–545. [Google Scholar] [CrossRef]
  48. Schäfer, L.; Balogun, K. Stocktaking of Cimate Risk Assessment Approaches Related to Loss and Damage; UNUEHS Working Paper, No. 20; United Nations University Institute of Environment and Human Security: Bonn, Germany, 2015; Available online: https://collections.unu.edu/eserv/UNU:3300/Stocktaking_of_climate_risk_WP_No_20.pdf (accessed on 15 January 2023).
  49. Loss and Damage Financing Must Push beyond Market-Based Measures. Climate Analytics. 29 January 2018. 736. Available online: http://theenergymix.com/2018/01/29/loss-and-damage-financing-must-push-beyond-market-based-measures/ (accessed on 15 January 2023).
  50. Verheyen, R.; Roderick, P. Beyond Adaptation—The Legal Duty to Pay Compensation for Climate Change Damage; Climate Change Programme Discussion Paper; WWF-UK: Surrey, UK, 2008; p. 2008. [Google Scholar]
  51. Bagenstose, K. A climate reckoning for US housing: Too many homes in harm’s way, ‘too many zeros’ in the costs. USA Today, 5 November 2022.
  52. Supran, G.; Rahmstorf, S.; Oreskes, N. Assessing ExxonMobil’s Global Warming Projections. Science 2023, 379, 1–9. [Google Scholar] [CrossRef] [PubMed]
  53. Greta Thunberg Sues Sweden for Climate Inaction, But Have Climate Change Lawsuits Made Any Impact? Outlook. 25 November 2022. Available online: https://www.outlookindia.com/international/greta-thunberg-sues-sweden-for-climate-inaction-but-have-climate-change-lawsuits-made-any-impact--news-240153 (accessed on 15 January 2023).
Figure 1. Loss and damage (L&D) are caused by greenhouse gas emissions (GHG) and climate change, with L&D as the intersection of loss and damage.
Urbansci 07 00040 g001
Figure 3. Example of losses. Photos in the vicinity of Naples, FL (USA): (a) 2022 sea levels (b) simulation of sea level rise of 1.5 m based on an intermediate-high scenario for the year 2100 showing permanent projected loss (created using the Sea Level Rise Viewer by the U.S. National Oceanic and Atmospheric Administration: https://coast.noaa.gov/digitalcoast/tools/slr.html (accessed on 15 January 2023) [20].
Urbansci 07 00040 g003
Figure 4. Example of damages. Photos in the vicinity of Fort Myers Beach, FL (USA): (a) 2022 before Hurricane Ian (b) damages after Hurricane Ian (2022) (obtained from the ESRI Hurricane Ian National Oceanic and Atmospheric Administration Imagery Viewer: https://disasterresponse.maps.arcgis.com/apps/instant/media/index.html?appid=4debf5ef1d4c493489f8c9de66107931 (accessed on 15 January 2023) [21].
Urbansci 07 00040 g004
Figure 5. Land cover map of Florida (USA) for 2016 (Latitude: 24°27′ N to 31°00′ N; Longitude: 80°02′ W to 87°38′ W) (based on data from MRLC [25]).
Urbansci 07 00040 g005
Figure 6. Loss and damage (L&D) of land for soil carbon (C) sequestration potential because of land developments in the state of Florida (USA) from 2001 to 2016.
Urbansci 07 00040 g006
Figure 7. Loss and damage (L&D) of soil carbon (C) because of land developments in the state of Florida (USA) from 2001 to 2016. M = million = 106.
Urbansci 07 00040 g007
Figure 8. Loss and damage (L&D) associated with the social costs of soil carbon (C) (SC-CO2) because of land developments in the state of Florida (USA) from 2001 to 2016. M = million = 106, B = billion = 109.
Urbansci 07 00040 g008
Table 2. An overview of the accounting framework (including loss and damage, L&D) used by this study (adapted from Groshans et al. (2019) [24]) for the state of Florida (USA).

OWNERSHIP (e.g., government, private, foreign, shared, single, etc.)
 
Time
(e.g., information disclosure, etc.)
STOCKS/SOURCE ATTRIBUTIONFLOWSVALUE
Biophysical Accounts
(Science-Based)
Administrative Accounts
(Boundary-Based)
Monetary
Account(s)
Benefit(s)/
Damages
Total Value
Soil extent:Administrative extent:Ecosystem good(s) and
service(s):
Sector:Types of value:
Composite (total) stock: Total soil carbon (TSC) = Soil organic carbon (SOC) + Soil inorganic carbon (SIC)
Past
(e.g., post-development disclosures)

Current (e.g., status)

Future
(e.g., pre-development disclosures)
Environment:“Avoided” or “realized” social cost of carbon (SC-CO2) emissions:
 
 
- Soil orders (Entisols, Inceptisols, Histosols, Alfisols, Mollisols, Spodosols, Ultisols)- State (Florida);
- County
(67 counties)
- Regulation (e.g., carbon sequestration);
- Provisioning (e.g., food production)
- Carbon gain
(sequestration);
- Carbon loss
- $46 per metric ton of CO2 applicable for the year 2025 (2007 U.S. dollars with an average discount rate of 3% [22])
Conflicts of Interest (COI)
Loss and Damage (L&D)
Table 3. Area-normalized content (kg m−2) and monetary values ($ m−2) of soil organic carbon (SOC), soil inorganic carbon (SIC), and total soil carbon (TSC = SOC + SIC) by soil order using data developed by Guo et al. (2006) [23] for the upper 2-m of soil and an avoided social cost of carbon (SC-CO2) of $46 per metric ton of CO2, applicable for 2025 (2007 U.S. dollars with an average discount rate of 3% [22]).
Soil OrderSOC Content (kg m−2)
SOC Value ($ m−2)
SIC Content (kg m−2)
SIC Value ($ m−2)
TSC Content (kg m−2)
TSC Value ($ m−2)
Minimum—Midpoint—Maximum Values
Entisols1.8—8.0—15.8
0.3—1.35—2.66
1.9—4.8—8.4
0.32—0.82—1.42
3.7—12.8—24.2
0.62—2.17—4.08
Inceptisols2.8—8.9—17.4
0.47—1.50—2.93
2.5—5.1—8.4
0.42—0.86—1.42
5.3—14.0—25.8
0.89—2.36—4.35
Histosols63.9—140.1—243.9
10.78—23.62—41.14
0.6—2.4—5.0
0.10—0.41—0.84
64.5—142.5—248.9
10.88—24.03—41.98
Alfisols2.3—7.5—14.1
0.39—1.27—2.38
1.3—4.3—8.1
0.22—0.72—1.37
3.6—11.8—22.2
0.61—1.99—3.74
Mollisols5.9–13.5–22.8
1.00—2.28—3.85
4.9–11.5–19.7
0.83—1.93—3.32
10.8–25.0–42.5
1.82—4.21—7.17
Spodosols2.9—12.3—25.5
0.49—2.07—4.30
0.2—0.6—1.1
0.03—0.10—0.19
3.1—12.9—26.6
0.52—2.17—4.49
Ultisols1.9—7.1—13.9
0.32—1.20—2.34
0.0—0.0—0.0
0.00—0.00—0.00
1.9—7.1—13.9
0.32—1.20—2.34
Note: Entisols, Inceptisols, Alfisols, Mollisols, Spodosols, and Ultisols are mineral soils. Histosols are mostly organic soils.
Table 4. Distribution of soil carbon regulating ecosystem services in the state of Florida (USA) by soil order (photos courtesy of USDA/NRCS [29]).
Soil Regulating Ecosystem Services in the State of Florida
Degree of Weathering and Soil Development
Slight
37%
Moderate
16%
Strong
46%
EntisolsInceptisolsHistosolsAlfisolsMollisolsSpodosolsUltisols
23%5%9%12%4%22%24%
Urbansci 07 00040 i001Urbansci 07 00040 i002Urbansci 07 00040 i003Urbansci 07 00040 i004Urbansci 07 00040 i005Urbansci 07 00040 i006Urbansci 07 00040 i007
Midpoint storage and social cost of soil organic carbon (SOC): 2.7 × 10¹² kg C, $455.2B
2.4 × 10¹¹ kg 6.2 × 10¹⁰ kg 1.7 × 10¹² kg 1.2 × 10¹¹ kg 7.3 × 10¹⁰ kg 3.4 × 10¹¹ kg 2.2 × 10¹¹ kg
$40.4B$10.4B$278.0B$19.5B$12.4B$57.9B$36.6B
9%2%61%4%3%13%8%
Midpoint storage and social cost of soil inorganic carbon (SIC): 3.5 × 10¹¹ kg C, $59.6B
1.4 × 10¹¹ kg3.5 × 1010 kg2.8 × 1010 kg6.6 × 1010 kg6.3 × 1010 kg1.7 × 1010 kg0
$24.5B$6.0B$4.8B$11.0B$10.5B$2.8B$0
41%10%8%19%18%5%0%
Midpoint storage and social cost of total soil carbon (TSC): 3.1 × 10¹² kg C, $514.8B
3.8 × 10¹¹ kg9.7 × 1010 kg1.7 × 1012 kg1.8 × 1011 kg1.4 × 1011 kg3.6 × 1011 kg2.2 × 1011 kg
$64.9B$16.4B$282.8B$30.9B$22.9B$60.7B$36.6B
13%3%55%6%4%12%7%
Sensitivity to climate change
LowLowHighHighHighLowLow
SOC and SIC sequestration (recarbonization) potential
LowLowLowLowLowLowLow
Note: Entisols, Inceptisols, Alfisols, Mollisols, Spodosols, and Ultisols are mineral soils. Histosols are mostly organic soils. B = billion = 109. See Supplemental Table S1 for minimum and maximum values.
Table 5. Land use/land cover (LULC) changes (%) by soil order in Florida (USA) from 2001 to 2016.
NLCD Land Cover Classes
(LULC)
Change in Area, 2001–2016
(%)
Degree of Weathering and Soil Development
SlightModerateStrong
EntisolsInceptisolsHistosolsAlfisolsMollisolsSpodosolsUltisols
Change in Area, 2001–2016 (%)
Barren land−0.8−3.5−5.4122.95.016.8−5.3−2.9
Woody wetlands1.10.30.52.82.11.60.7−0.1
Shrub/Scrub14.58.3−4.76.0−1.4−3.14.731.6
Mixed forest−0.61.14.5−13.84.18.518.0−12.8
Deciduous forest24.025.332.417.336.639.933.613.8
Herbaceous5.415.9−8.310.0−5.8−21.1−6.710.2
Evergreen forest−5.0−7.31.0−0.31.34.4−4.1−6.3
Emergent herbaceous wetlands−8.1−5.9−5.4−6.9−13.2−9.6−11.6−4.5
Hay/Pasture−7.6−7.9−10.1−9.1−6.3−5.3−5.4−11.7
Cultivated crops0.70.31.1−1.8−0.9−5.1−0.35.4
Developed, open space2.41.34.84.43.53.33.42.0
Developed, medium intensity31.126.241.436.545.127.838.625.2
Developed, low intensity9.27.512.811.914.89.010.97.1
Developed, high intensity31.526.964.755.751.939.842.218.3
Note: Entisols, Inceptisols, Alfisols, Mollisols, Spodosols, and Ultisols are mineral soils. Histosols are mostly organic soils.
Table 6. Increases in developed land and maximum potential for realized social costs of carbon (C) due to complete loss of total soil carbon (TSC) of developed land by soil order in Florida (USA) from 2001 to 2016.
NLCD Land Cover Classes
(LULC);
Developed Area Increase
between 2001 and 2016 (km2);
Midpoint Complete Loss of Total Soil Carbon (kg);
Midpoint SC-CO2 ($ = USD)
Degree of Weathering and Soil Development
SlightModerateStrong
EntisolsInceptisolsHistosolsAlfisolsMollisolsSpodosolsUltisols
Developed Area Increase between 2001 and 2016 (km2)
Midpoint Complete Loss of Total Soil Carbon (kg)
Midpoint SC-CO2 ($ = USD)
Developed, open space45.418.09.637.06.783.442.9
242.9 km2 (4.2 × 10⁹ kg C)5.8 × 1082.5 × 1081.4 × 1094.4 × 1081.7 × 1081.1 × 1093.0 × 108
$705.7M$98.5M$42.4M$230.6M$73.6M$28.1M$181.0M$51.5M
Developed, medium intensity273.431.717.278.115.6196.283.0
695.2 km2 (1.1 × 10¹⁰ kg C)3.5 × 1094.4 × 1082.4 × 1099.2 × 1083.9 × 1082.5 × 1095.9 × 108
$1.8B$593.3M$74.9M$412.7M$155.4M$65.6M$425.7M$99.6M
Developed, low intensity177.926.512.974.210.8158.367.6
528.2 km2 (8.2 × 10⁹ kg C)2.3 × 1093.7 × 1081.8 × 1098.8 × 1082.7 × 1082.0 × 1094.8 × 108
$1.4B$386.1M$62.6M$309.5M$147.6M$45.5M$343.6M$81.2M
Developed, high intensity81.89.56.820.35.860.225.6
210.0 km2 (3.5 × 10⁹ kg C)1.0 × 1091.3 × 1089.8 × 1082.4 × 1081.4 × 1087.8 × 1081.8 × 108
$590.5M$177.5M$22.4M$164.6M$40.4M$24.2M$130.6M$30.7M
Totals578.585.746.5209.638.8498.1219.1
1676.3 km2 (2.7 × 10¹⁰ kg C)7.4 × 1091.2 × 1096.6 × 1092.5 × 1099.7 × 1086.4 × 1091.6 × 109
$4.5B$1.3B$202.3M$1.1B$417.1M$163.4M$1.1B$263.0M
Note: Entisols, Inceptisols, Alfisols, Mollisols, Spodosols, and Ultisols are mineral soils. Histosols are mostly organic soils. M = million = 106, B = billion = 109. See Supplemental Table S2 for minimum and maximum values.
Disclaimer/Publisher’s Note: The statements, opinions and data contained in all publications are solely those of the individual author(s) and contributor(s) and not of MDPI and/or the editor(s). MDPI and/or the editor(s) disclaim responsibility for any injury to people or property resulting from any ideas, methods, instructions or products referred to in the content.

