Urban Resilience and Climate Change: Developing a Multidimensional Index to Adapt against Climate Change in the Iranian Capital City of Tehran

 , ,
, ,
Abstract
:1. Introduction
2. Materials and Methods
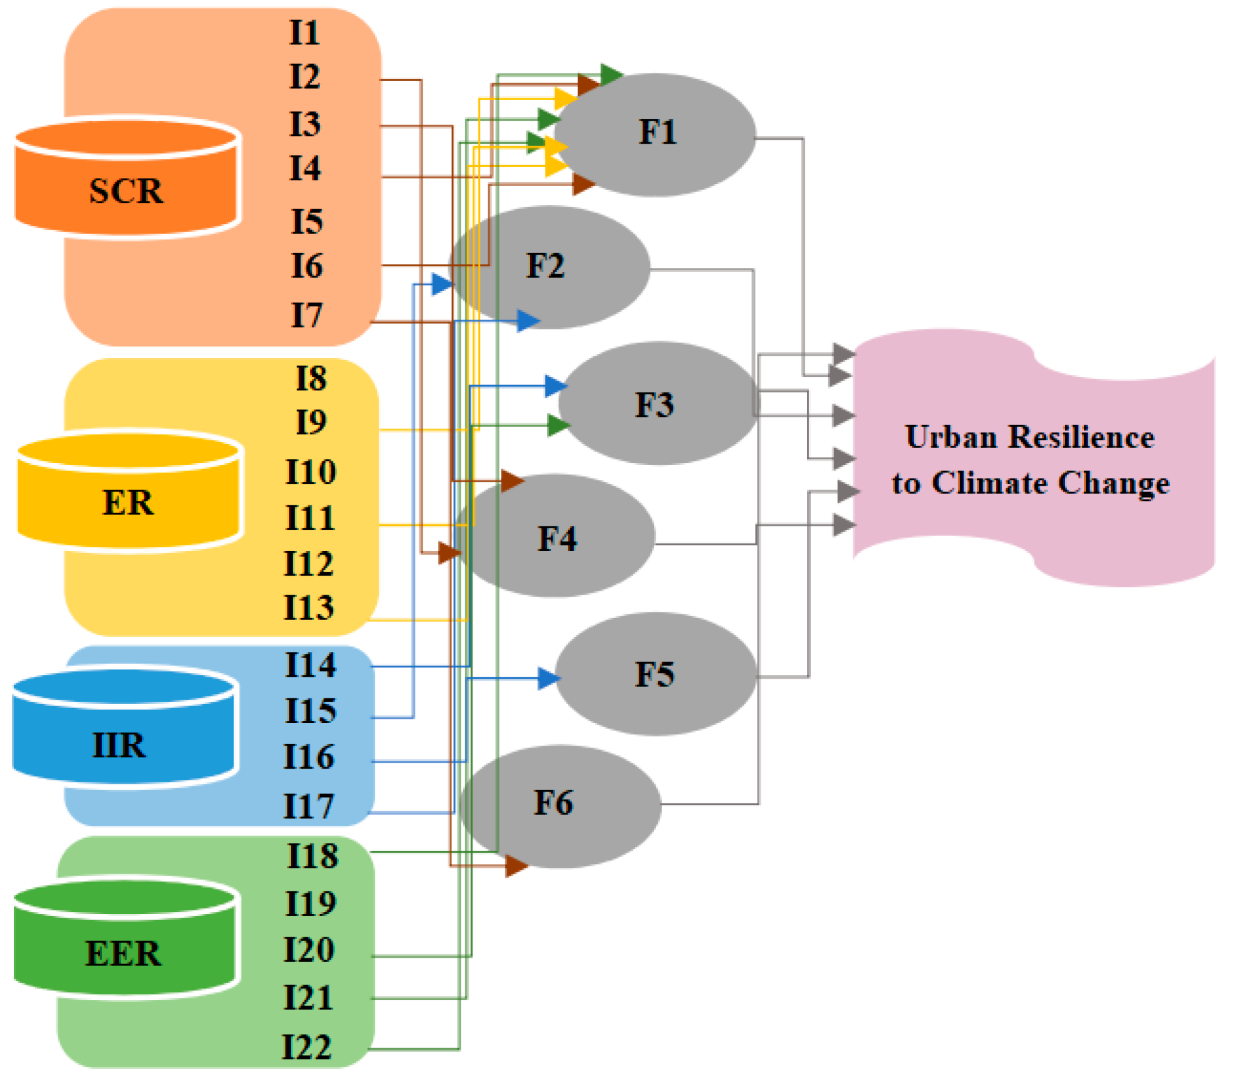
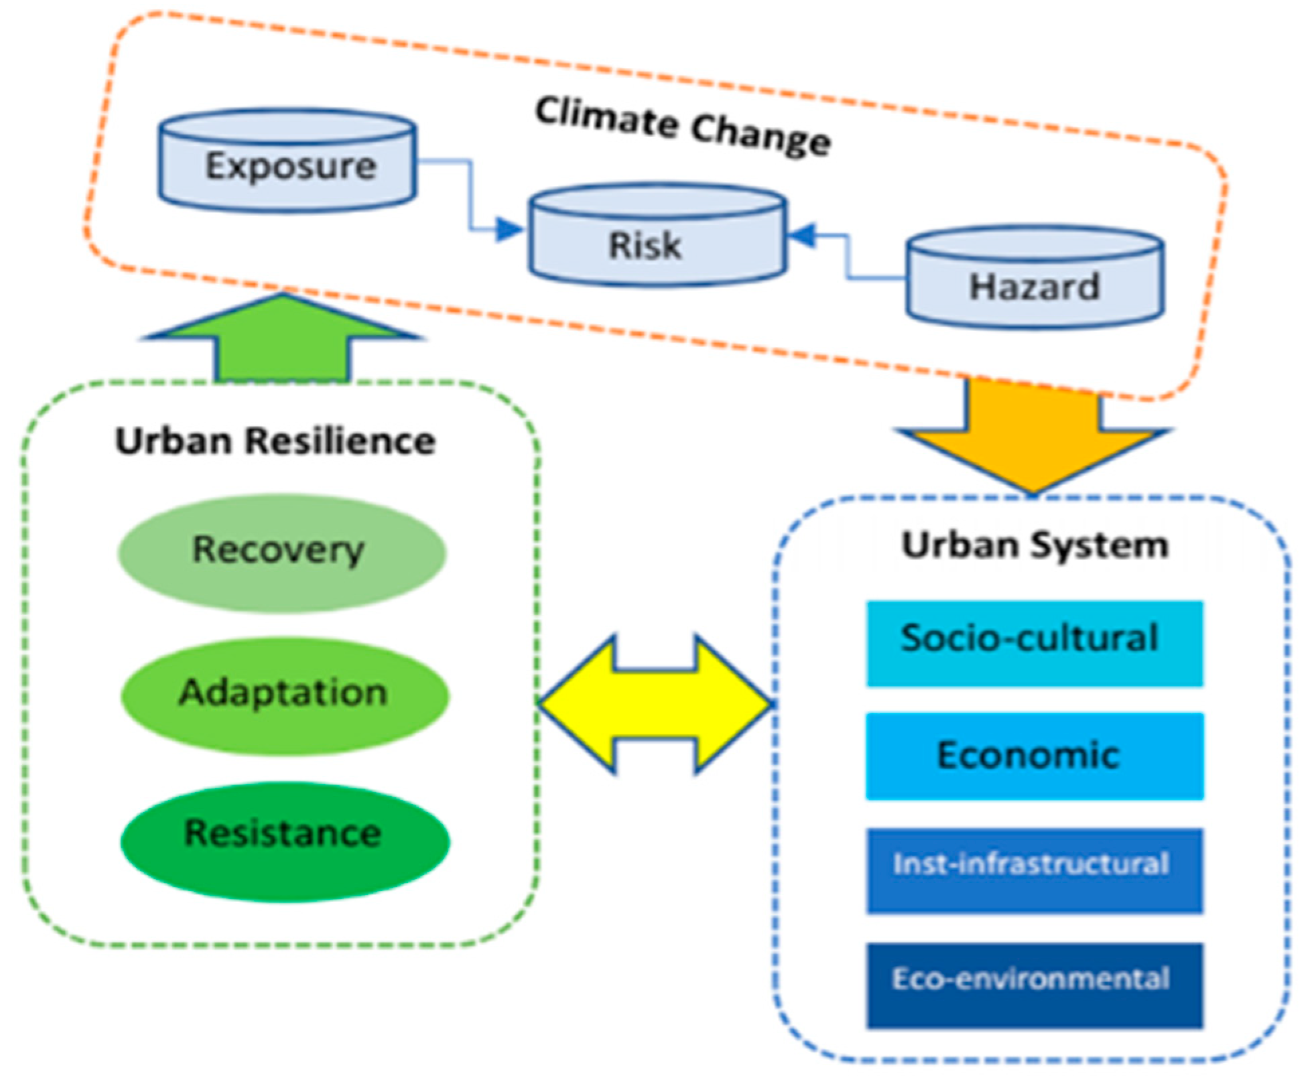
2.1. Conceptual Framework
2.2. Study Area
2.3. Data in Use, Variable Selection
2.4. Climate Resilience Index (CRI)
2.5. Multivariate Analysis
2.6. Data Pre-Processing
2.7. Conducting the Factor Analysis
2.8. Visualization
3. Results
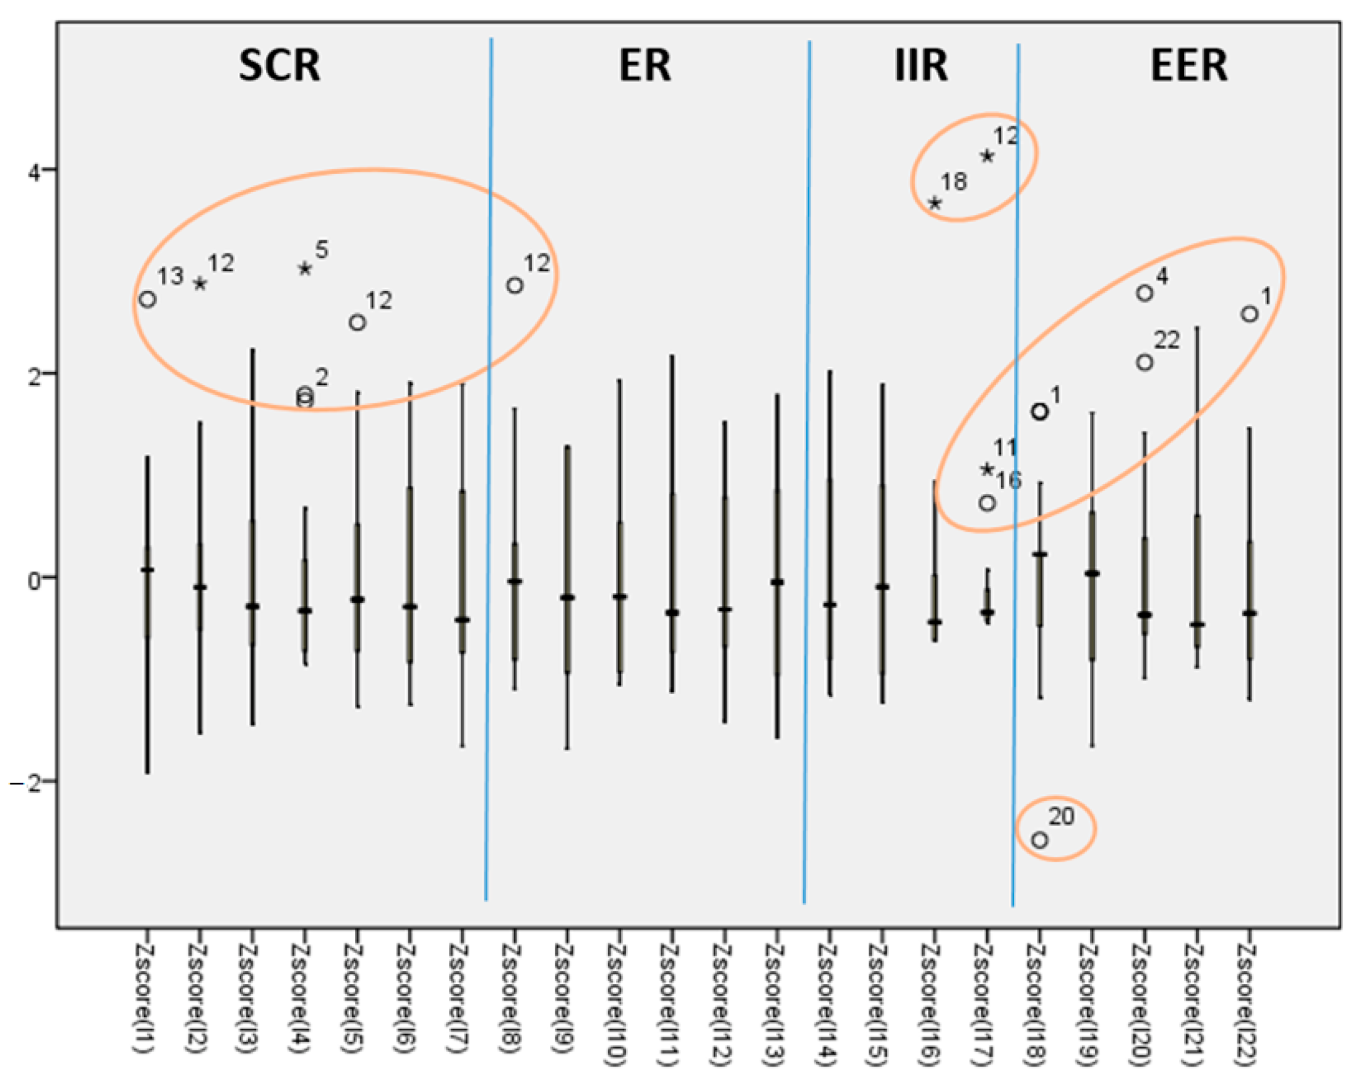
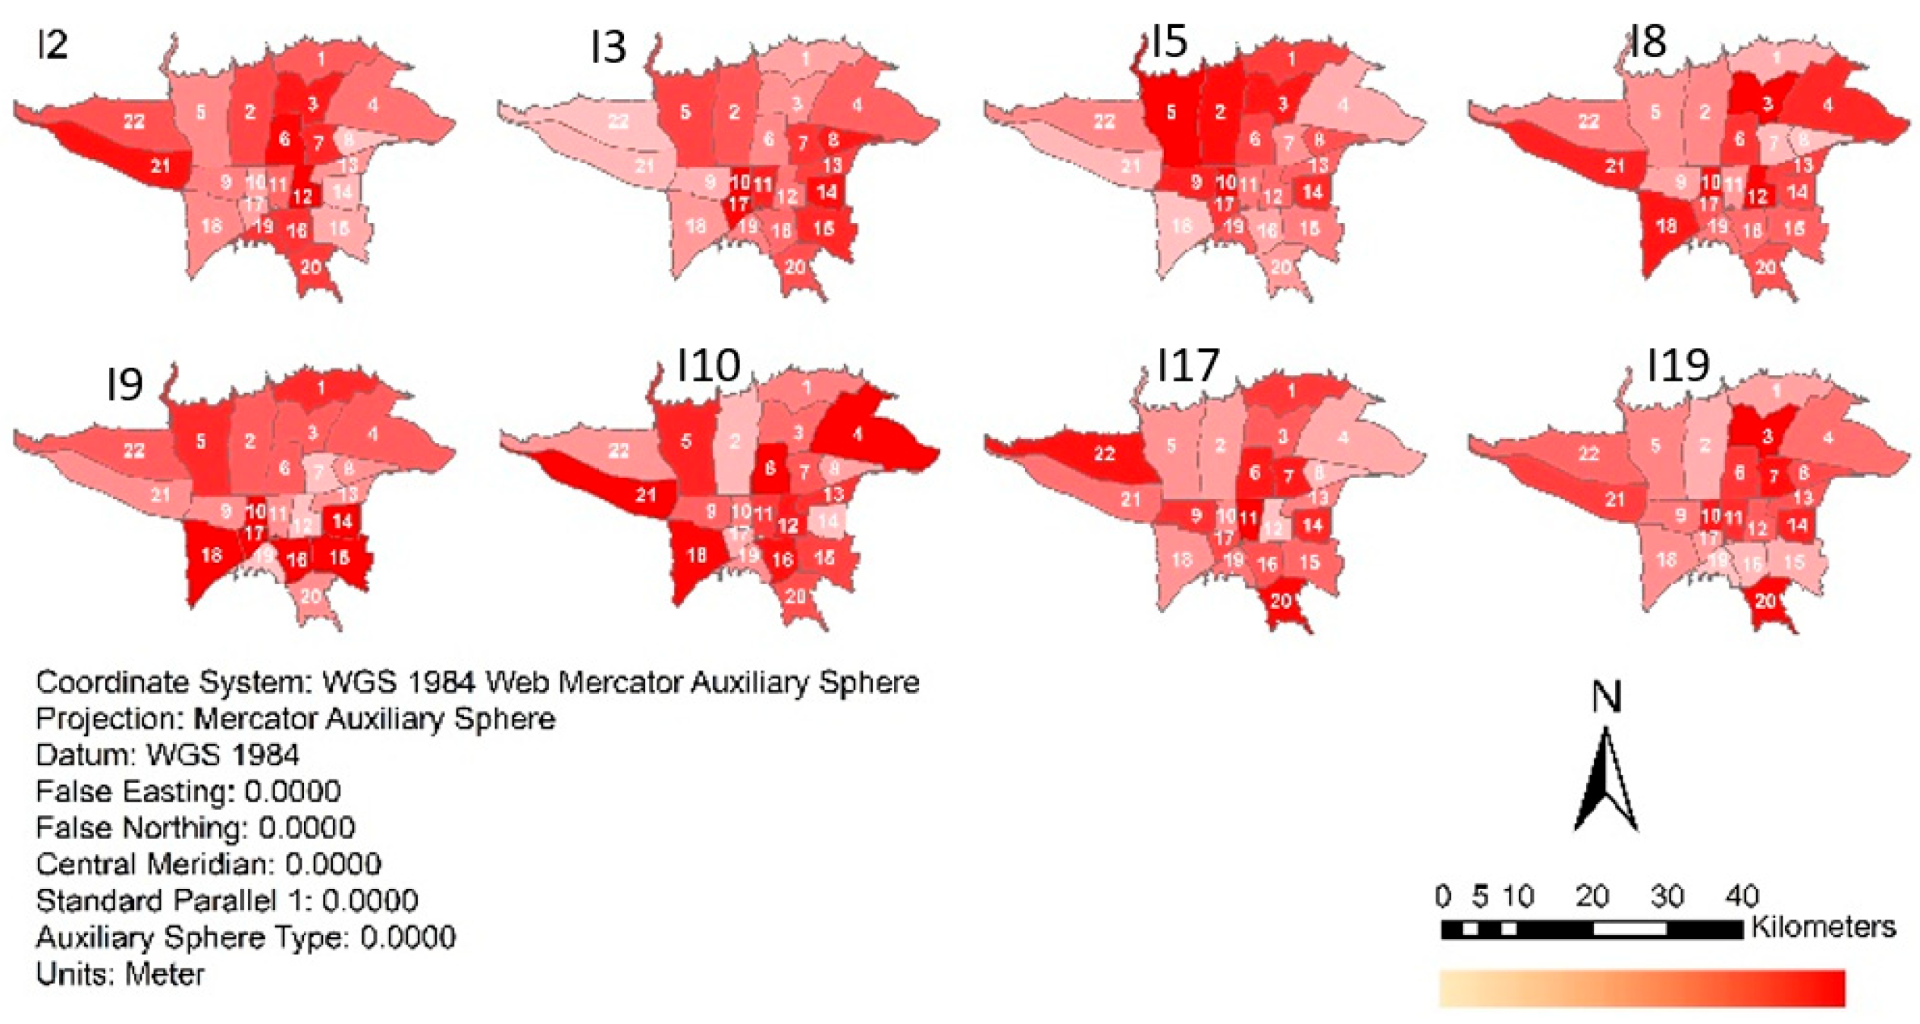
3.1. Baseline Situations
3.2. Factor Analysis
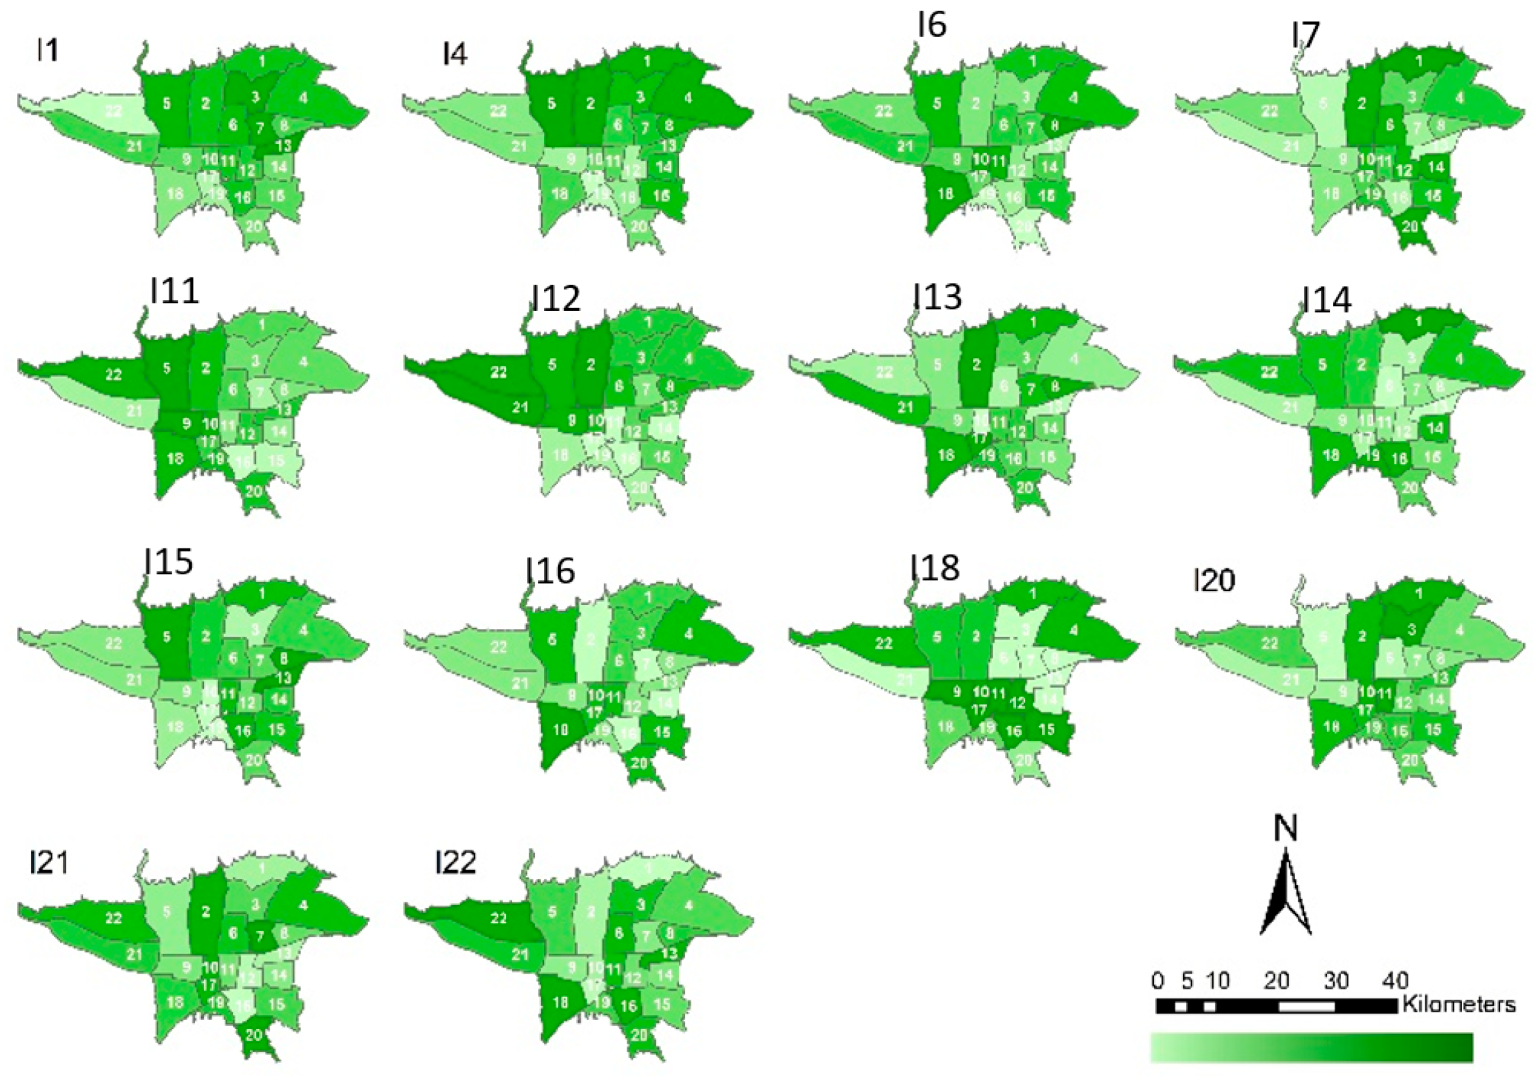
3.3. Variable Loadings (Resilience Dimensions and Indicators)
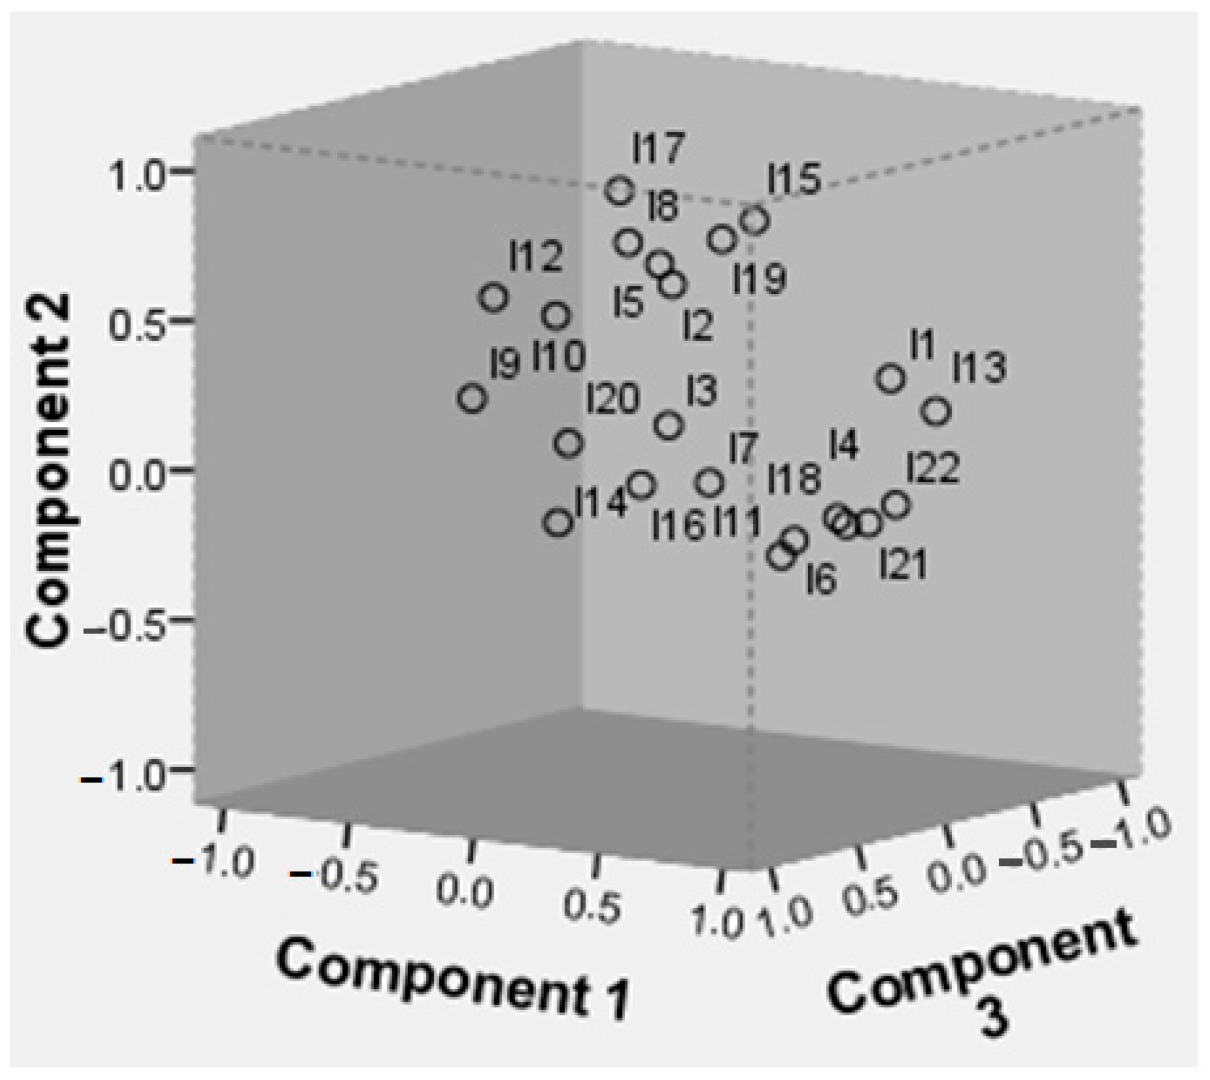
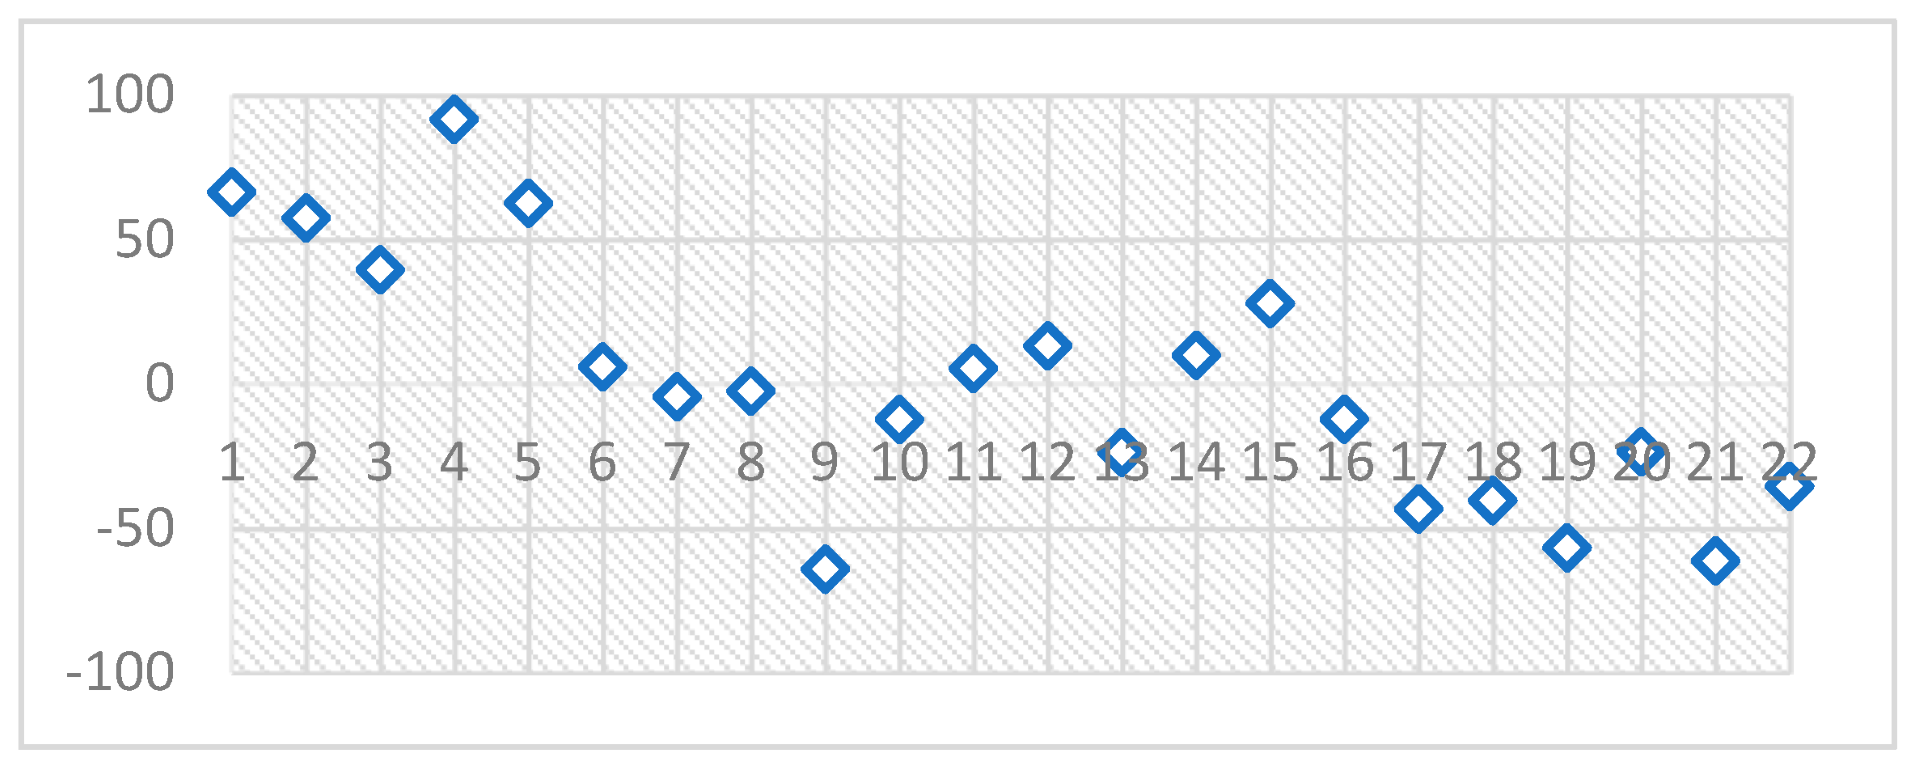
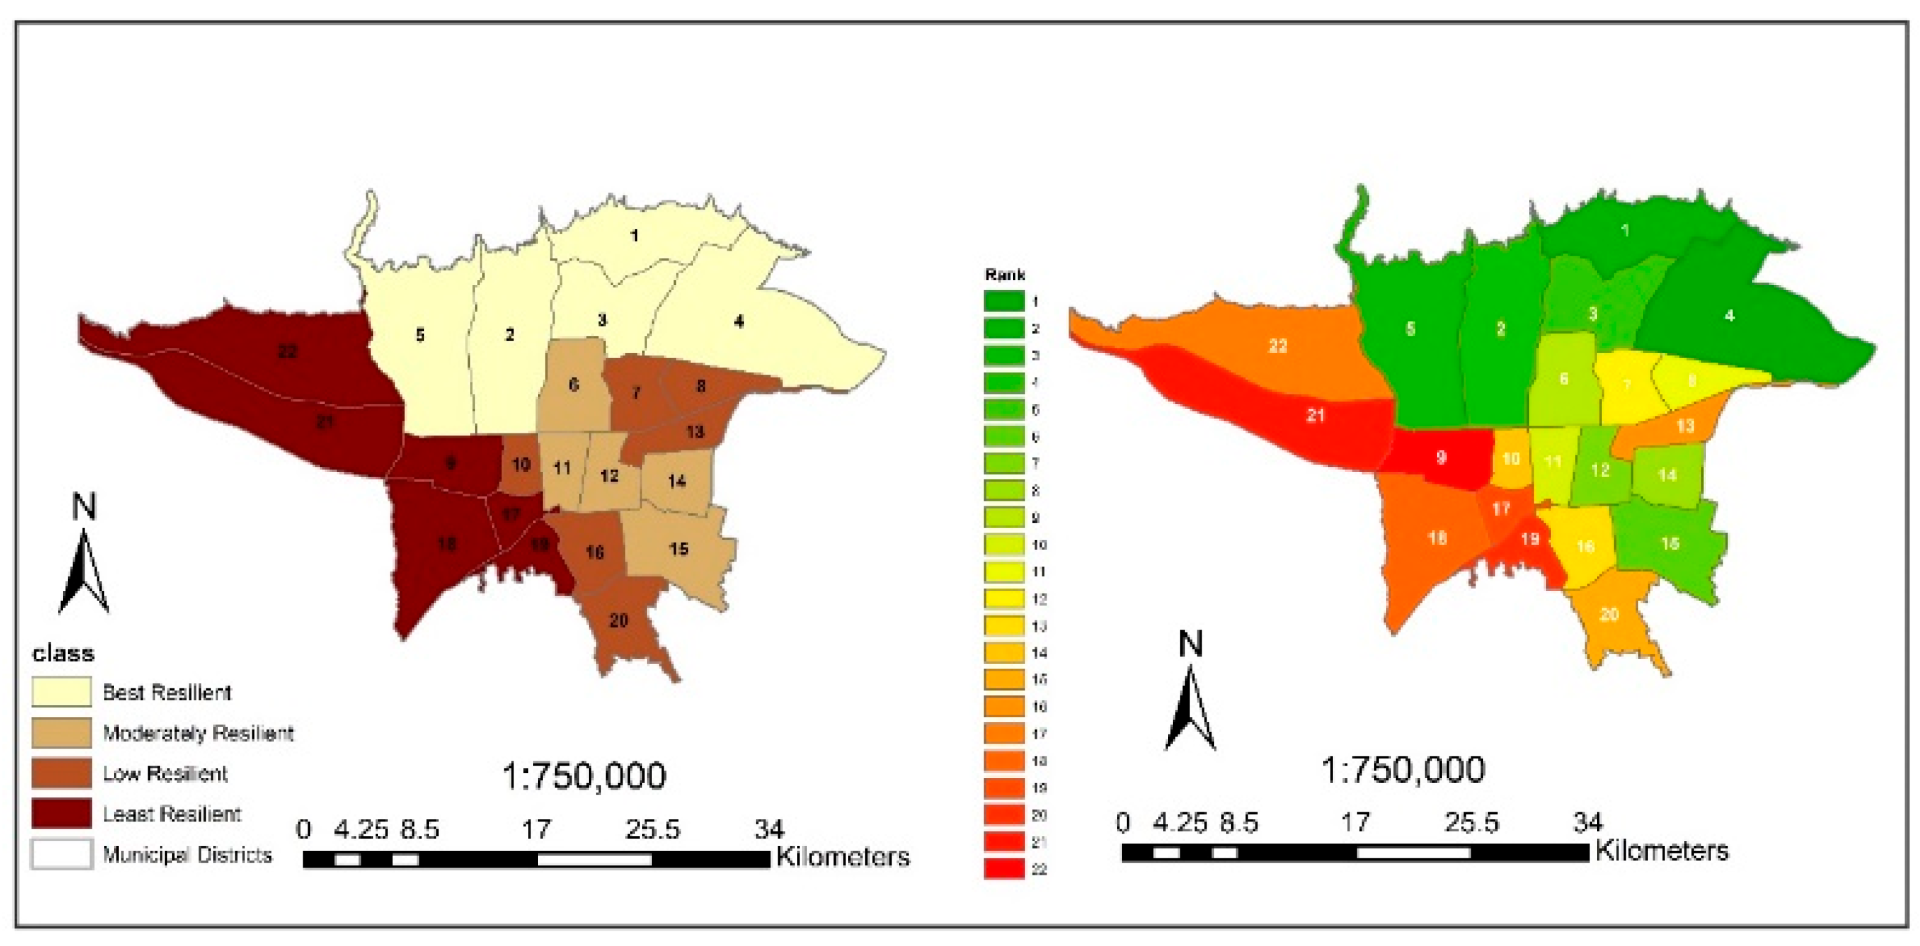
3.4. Sample Loadings (Districts)
3.5. Mapping CRI
4. Discussion
4.1. Variable Loadings
4.2. Sample Loadings
5. Conclusions
Author Contributions
Funding
Institutional Review Board Statement
Informed Consent Statement
Data Availability Statement
Conflicts of Interest
Appendix A

| r | I1 | I2 | I3 | I4 | I5 | I6 | I7 | I8 | I9 | I10 | I11 | I12 | I13 | I14 | I15 | I16 | I17 | I18 | I19 | I20 | I21 | I22 |
|---|---|---|---|---|---|---|---|---|---|---|---|---|---|---|---|---|---|---|---|---|---|---|
| I1 | 1.000 | 0.116 | −0.005 | 0.320 | 0.118 | 0.133 | 0.161 | 0.028 | −0.305 | −0.136 | 0.153 | −0.212 | 0.564 | −0.282 | 0.366 | −0.074 | 0.041 | 0.227 | 0.399 | −0.260 | 0.245 | 0.357 |
| I2 | 1.000 | −0.601 | −0.218 | 0.520 | −0.018 | −0.106 | 0.111 | −0.218 | −0.213 | 0.023 | 0.018 | −0.032 | −0.163 | 0.399 | −0.098 | 0.575 | −0.041 | 0.216 | 0.078 | 0.052 | 0.038 | |
| I3 | 1.000 | −0.005 | −0.051 | −0.335 | 0.072 | 0.584 | 0.508 | 0.673 | −0.312 | 0.264 | 0.060 | −0.202 | −0.032 | −0.069 | 0.029 | −0.188 | 0.441 | −0.289 | −0.336 | −0.280 | ||
| I4 | 1.000 | −0.532 | 0.760 | 0.007 | −0.304 | −0.574 | −0.386 | 0.675 | −0.381 | 0.675 | 0.405 | 0.225 | 0.029 | −0.262 | 0.552 | −0.369 | 0.149 | 0.776 | 0.688 | |||
| I5 | 1.000 | −0.529 | −0.094 | 0.568 | 0.127 | 0.371 | −0.563 | 0.148 | −0.076 | −0.398 | 0.204 | −0.237 | 0.586 | −0.339 | 0.578 | −0.327 | −0.324 | −0.342 | ||||
| I6 | 1.000 | 0.228 | −0.540 | −0.751 | −0.579 | 0.812 | −0.415 | 0.515 | 0.494 | 0.271 | −0.042 | −0.347 | 0.632 | −0.578 | 0.421 | 0.864 | 0.825 | |||||
| I7 | 1.000 | −0.014 | −0.103 | −0.070 | 0.258 | −0.111 | 0.102 | −0.115 | −0.058 | −0.048 | −0.182 | 0.292 | −0.048 | 0.117 | 0.239 | 0.302 | ||||||
| I8 | 1.000 | 0.465 | 0.752 | −0.507 | 0.405 | −0.058 | −0.396 | 0.271 | −0.224 | 0.719 | −0.308 | 0.645 | −0.200 | −0.477 | −0.416 | |||||||
| I9 | 1.000 | 0.769 | −0.562 | 0.643 | −0.581 | −0.107 | −0.220 | 0.319 | 0.216 | −0.595 | 0.349 | −0.130 | −0.828 | −0.805 | ||||||||
| I10 | 1.000 | −0.516 | 0.569 | −0.240 | −0.157 | 0.068 | 0.009 | 0.474 | −0.447 | 0.471 | −0.212 | −0.579 | −0.589 | |||||||||
| I11 | 1.000 | −0.495 | 0.466 | 0.370 | 0.108 | 0.033 | −0.346 | 0.586 | −0.573 | 0.405 | 0.720 | 0.746 | ||||||||||
| I12 | 1.000 | −0.380 | 0.170 | 0.292 | 0.228 | 0.482 | −0.647 | 0.358 | 0.005 | −0.560 | −0.584 | |||||||||||
| I13 | 1.000 | −0.149 | 0.524 | −0.035 | −0.089 | 0.530 | 0.159 | −0.045 | 0.695 | 0.791 | ||||||||||||
| I14 | 1.000 | 0.047 | 0.180 | −0.197 | −0.024 | −0.567 | 0.525 | 0.240 | 0.044 | |||||||||||||
| I15 | 1.000 | −0.064 | 0.516 | 0.179 | 0.425 | 0.332 | 0.236 | 0.331 | ||||||||||||||
| I16 | 1.000 | −0.118 | −0.129 | −0.029 | −0.086 | −0.066 | −0.062 | |||||||||||||||
| I17 | 1.000 | −0.206 | 0.488 | −0.055 | −0.248 | −0.262 | ||||||||||||||||
| I18 | 1.000 | −0.297 | 0.338 | 0.749 | 0.817 | |||||||||||||||||
| I19 | 1.000 | −0.323 | −0.421 | −0.301 | ||||||||||||||||||
| I20 | 1.000 | 0.167 | 0.203 | |||||||||||||||||||
| I21 | 1.000 | 0.909 | ||||||||||||||||||||
| I22 | 1.000 |
| Functional Zone | District | Factor Loadings | Resilience Score | CRI Class * | Rank | ||||||
|---|---|---|---|---|---|---|---|---|---|---|---|
| Code | Area | f1 | f2 | f3 | f4 | f5 | f6 | ||||
| WWZ (15,991 ha~26%) | D1 | 3454.6% | 1.841 | 0.101 | −0.077 | −0.453 | 0.155 | 1.001 | 66.409 | 1 | 2 |
| D5 | 5910.10% | 1.958 | −0.806 | 0.097 | 0.341 | −0.305 | −1.469 | 62.580 | 1 | 3 | |
| D3 | 2938.5% | 1.036 | 0.377 | −0.406 | −0.597 | 0.745 | 1.232 | 39.461 | 1 | 5 | |
| D2 | 4956.8% | 1.519 | −0.322 | 0.390 | −0.220 | 0.628 | −0.721 | 57.474 | 1 | 4 | |
| ECZ (17,487 ha~29%) | D15 | 2846.5% | −0.363 | 0.473 | 1.888 | 1.265 | 0.290 | −0.468 | 27.922 | 2 | 6 |
| D4 | 7243.12% | 1.608 | 0.662 | 1.784 | 0.317 | −0.239 | 0.764 | 91.568 | 1 | 1 | |
| D22 | 6140.10% | −0.406 | −1.058 | 1.785 | −1.330 | −1.625 | 1.338 | −35.458 | 4 | 17 | |
| CZ (11,198 ha~18%) | D6 | 2144.4% | 0.423 | 0.787 | −1.000 | −1.325 | 0.088 | 0.018 | 5.878 | 2 | 9 |
| D7 | 1537.3% | 0.129 | 0.038 | −1.519 | −0.023 | 1.091 | −0.258 | −4.508 | 3 | 12 | |
| D8 | 1324.2% | 0.322 | −0.838 | −0.772 | 1.339 | −0.892 | −1.492 | −2.551 | 3 | 11 | |
| D10 | 806.1% | −0.377 | −0.164 | −0.846 | 1.904 | −0.757 | 1.426 | −12.315 | 3 | 14 | |
| D11 | 1187.2% | −0.136 | 0.853 | −0.701 | 0.567 | −0.201 | −0.491 | 5.321 | 2 | 10 | |
| D12 | 1356.2% | −0.739 | 3.409 | −0.194 | −0.705 | −0.911 | −0.248 | 13.195 | 2 | 7 | |
| D13 | 1389.2% | −0.027 | −0.421 | −1.509 | −0.061 | 0.131 | 1.398 | −23.698 | 3 | 16 | |
| D14 | 1456.2% | −0.369 | −0.030 | 0.401 | 1.705 | 0.652 | −0.354 | 10.008 | 2 | 8 | |
| DTZ (9435 ha~15%) | D16 | 1645.3% | −0.809 | 0.814 | 0.141 | −0.238 | 0.934 | −0.225 | −12.240 | 3 | 13 |
| D17 | 827.1% | −1.197 | −0.436 | 0.017 | 1.324 | −0.695 | 1.555 | −43.241 | 4 | 19 | |
| D18 | 3785.6% | −1.155 | −0.919 | 0.365 | −0.501 | 3.092 | 0.243 | −40.275 | 4 | 18 | |
| D19 | 1149.2% | −1.208 | −0.637 | 0.522 | −0.730 | 0.020 | −0.288 | −56.716 | 4 | 20 | |
| D20 | 2028.3% | −0.919 | 0.217 | 1.027 | −0.329 | −0.077 | −1.631 | −23.578 | 3 | 15 | |
| NZ (7151 ha~12%) | D21 | 5196.8% | −0.495 | −1.255 | −0.106 | −1.706 | −0.845 | −0.253 | −61.163 | 4 | 21 |
| D9 | 1955.3% | −0.636 | −0.842 | −1.287 | −0.540 | −1.279 | −1.079 | −64.074 | 4 | 22 | |
References
- Serre, D.; Heinzlef, C. Assessing and mapping urban resilience to floods with respect to cascading effects through critical infrastructure networks. Int. J. Disaster Risk Reduct. 2018, 30, 235–243. [Google Scholar] [CrossRef]
- Leichenko, R. Climate change and urban resilience. Curr. Opin. Environ. Sustain. 2011, 3, 164–168. [Google Scholar] [CrossRef]
- Pelling, M. The Vulnerability of Cities: Natural Disasters and Social Resilience; Routledge: London, UK, 2012. [Google Scholar]
- MacClune, K.; Optiz-Stapleton, S. Building Urban Resilience to Climate Change; Institute for Social and Environmental Transition-International: Boulder, CO, USA, 2012; p. 46. [Google Scholar]
- Tyler, S.; Moench, M. A framework for urban climate resilience. Clim. Dev. 2012, 4, 311–326. [Google Scholar] [CrossRef]
- Satour, N.; Raji, O.; El Moçayd, N.; Kacimi, I.; Kassou, N. Spatialized flood resilience measurement in rapidly urbanized coastal areas with a complex semi-arid environment in northern Morocco. Nat. Hazards Earth Syst. Sci. 2021, 21, 1101–1118. [Google Scholar] [CrossRef]
- Rahimi, M.; Mohammadian, N.; Vanashi, A.R.; Whan, K. Trends in indices of extreme temperature and precipitation in iran over the period 1960–2014. Open J. Ecol. 2018, 8, 396. [Google Scholar] [CrossRef] [Green Version]
- Joint Research Centre-European, C. Handbook on Constructing Composite Indicators: Methodology and User Guide; OECD Publishing: Paris, France, 2008. [Google Scholar]
- Cutter, S.L.; Burton, C.G.; Emrich, C.T. Disaster Resilience Indicators for Benchmarking Baseline Conditions. J. Homel. Secur. Emerg. Manag. 2010, 7, 1–22. [Google Scholar] [CrossRef]
- Joerin, J.; Shaw, R.; Takeuchi, Y.; Krishnamurthy, R. The adoption of a Climate Disaster Resilience Index in Chennai, India. Disasters 2014, 38, 540–561. [Google Scholar] [CrossRef]
- Mayunga, J.S. Understanding and applying the concept of community disaster resilience: A capital-based approach. Summer Acad. Soc. Vulnerability Resil. Build. 2007, 1, 1–16. [Google Scholar]
- Hung, H.-C.; Yang, C.-Y.; Chien, C.-Y.; Liu, Y.-C. Building resilience: Mainstreaming community participation into integrated assessment of resilience to climatic hazards in metropolitan land use management. Land Use Policy 2016, 50, 48–58. [Google Scholar] [CrossRef]
- Qasim, S.; Qasim, M.; Shrestha, R.P.; Khan, A.N.; Tun, K.; Ashraf, M. Community resilience to flood hazards in Khyber Pukhthunkhwa province of Pakistan. Int. J. Disaster Risk Reduct. 2016, 18, 100–106. [Google Scholar] [CrossRef]
- Miguez, M.G.; Veról, A.P. A catchment scale Integrated Flood Resilience Index to support decision making in urban flood control design. Environ. Plan. B Urban Anal. City Sci. 2017, 44, 925–946. [Google Scholar] [CrossRef]
- Chen, K.-F.; Leandro, J. A Conceptual Time-Varying Flood Resilience Index for Urban Areas: Munich City. Water 2019, 11, 830. [Google Scholar] [CrossRef] [Green Version]
- Batica, J. Methodology for flood resilience assessment in urban environments and mitigation strategy development. Ph.D. Thesis, Université Nice Sophia Antipolis, Nice, France, 2015; p. 230. [Google Scholar]
- Kotzee, I.; Reyers, B. Piloting a social-ecological index for measuring flood resilience: A composite index approach. Ecol. Indic. 2016, 60, 45–53. [Google Scholar] [CrossRef]
- Ghaedamini Harouni, G.; Sajjadi, H.; Rafiey, H.; Mirabzadeh, A.; Vaez Mahdavi, M.; Mohaqeqi Kamal, S.H. Current status of health index in Tehran: A multidimensional approach. Med. J. Islam. Repub. Iran (MJIRI) 2017, 31, 29. [Google Scholar] [CrossRef]
- Movahhed, A.; Vali Noori, S.; Hataminejad, H.; Zanganeh, A.; Kamanroodi Kajouri, M. Spatial analysis of urban poverty in Tehran metropolis. J. Urban Econ. Manag. 2016, 4, 19–36. [Google Scholar]
- Zheng, Y.; Xin-Lu, X.; Chen-Zhen, L.; Mou, W.; Xiao-Jia, H.E. Development as adaptation: Framing and measuring urban resilience in Beijing. Adv. Clim. Chang. Res. 2018, 9, 234–242. [Google Scholar] [CrossRef]
- Hanai, S. A GIS-based Multi-Criteria Evaluation of Disaster Vulnerability in an Urban Space. Master’s Thesis, University of Washington Bothell, Bothell, WA, USA, 2018. [Google Scholar]
- Shams, S.; Shabani Asl, M.R. An Analysis of Earthquake Preparedness in Tehran with Emphasis on the Resilience Theory (Case Study of Tehran District 4). J. Hous. Rural. Environ. 2020, 39, 129–144. [Google Scholar]
- Rahimi, F.; Sadeghi-Niaraki, A.; Ghodousi, M. Modeling Physical-Social Resilience in District 1 of Tehran. Jorar 2020, 12, 46–56. [Google Scholar] [CrossRef]
- Zhang, M.; Yang, Y.; Li, H.; van Dijk, M.P. Measuring urban resilience to climate change in three chinese cities. Sustainability 2020, 12, 9735. [Google Scholar] [CrossRef]
- Brunetta, G.; Salata, S. Mapping Urban Resilience for Spatial Planning—A First Attempt to Measure the Vulnerability of the System. Sustainability 2019, 11, 2331. [Google Scholar] [CrossRef] [Green Version]
- Chen, X.; Quan, R. A spatiotemporal analysis of urban resilience to the COVID-19 pandemic in the Yangtze River Delta. Nat. Hazards 2021, 106, 829–854. [Google Scholar] [CrossRef] [PubMed]
- Moghadas, M.; Asadzadeh, A.; Vafeidis, A.; Fekete, A.; Kötter, T. A multi-criteria approach for assessing urban flood resilience in Tehran, Iran. Int. J. Disaster Risk Reduct. 2019, 35, 101069. [Google Scholar] [CrossRef]
- Goodarzi, M.S.; Amiri, B.J.; Azarnivand, H.; Waltner, I. Watershed hydrological modelling in data scarce regions; integrating ecohydrology and regionalization for the southern Caspian Sea basin, Iran. Heliyon 2021, 7, e06833. [Google Scholar] [CrossRef] [PubMed]
- Jamali, A.; Robati, M.; Nikoomaram, H.; Farsad, F.; Aghamohammadi, H. Urban Resilience Assessment Using Hybrid MCDM Model Based on DEMATEL-ANP Method (DANP). 2023. Available online: https://www.researchsquare.com/article/rs-906701/v1 (accessed on 17 September 2021).
- Iran S.C.O. National Population and Housing Census. 2016. Available online: https://www.unescap.org/sites/default/files/Session6_Iran_Population_and_Housing_Census2016_Census_WS_24-26Jan2018.pdf, (accessed on 19 July 2021).
- Mayors, C. The World’s Largest Cities and Urban Areas in 2006. Available online: http://www.citymayors.com/statistics/urban_intro.htm (accessed on 1 March 2018).
- UN-Habitat. Urban Resilience Programme; UN-Habitat: Nairobi, Kenya, 2017; p. 26. [Google Scholar]
- Fasihi, H. Urban Parks and Their Accessibility in Tehran, Iran. Environ. Justice 2019, 12, 242–249. [Google Scholar] [CrossRef] [Green Version]
- Mokhayeri, Y.; Mahmoudi, M.; Haghdoost, A.A.; Amini, H.; Asadi-Lari, M.; Naieni, K.H. How within-city socioeconomic disparities affect life expectancy? Results of Urban HEART in Tehran, Iran. Med. J. Islam. Repub. Iran 2014, 28, 80. [Google Scholar]
- Yousefi, S.; Farahani, I. Spatial inequality in Tehran, a structural explanation. Urban Res. Pract. 2022, 15, 25–46. [Google Scholar] [CrossRef] [Green Version]
- Beccari, B. A Comparative Analysis of Disaster Risk, Vulnerability and Resilience Composite Indicators. PLoS Curr. 2016, 8. [Google Scholar] [CrossRef]
- Rusta, M.; Ebrahimzadeh, I.; Istgaldi, M. The Analysis of Physical Resilience Against Earthquake in Old Texture of City Zahedan Boarder city. Geogr. Dev. 2017, 15, 1–18. [Google Scholar] [CrossRef]
- Mohammadi, K.L.; Khanizadeh, M.A.; Pourahmad, A. Measuring and Assessing the Urban Resilience in the Social, Economic, Physical and Environmental Dimensions (Case study: Shiraz City). J. Environ. Sci. Technol. 2020, 8, 295–307. [Google Scholar]
- Abdollahi, A.A.; Sharafi, H.; Sabahi, Y. Measurement And evaluation Resiliency Institutional and physical-environmental Urban communities to reduce natural disasters, Earthquake(Case study: Kerman city). EBTP 2018, 11, 165–187. [Google Scholar]
- Yang, Y.; Fang, Y.-P.; Xu, Y.; Zhang, Y. Assessment of urban resilience based on the transformation of resource-based cities: A case study of Panzhihua, China. Ecol. Soc. 2021, 26, 20. [Google Scholar] [CrossRef]
- Mohaqeqi Kamal, S.H.; Ghaedamini Harouni, G.; Basakha, M. Spatial pattern of well-being in Tehran: The north-south gap. Med. J. Islam. Repub. Iran (MJIRI) 2019, 33, 670–676. [Google Scholar] [CrossRef]


| Resilience Dimensions | Resilience Indicators (Direct/Unit) | Definition | References |
|---|---|---|---|
| Socio-cultural (SCR) | + Public awareness (I1); % | Public awareness (I1) and education are regarded as signs of openness in the society to adapt to the unexpected climate alterations. | [18,23,36,37,38] |
| - Consumerism (I2); % | Consumerism (I2) is defined as a function of solid wastes and wastewater per capita, which loads reversely on the supply chain during long-run crises. | ||
| - Population density (I3); n per hectare | Population density (I3) is negatively connected with sustainability. | ||
| + Migration (I4); n | Migration (I4) usually occurs among vulnerable and low-resilience populations. However, most migrants in Tehran are considered wealthy families willing to reside in the northern states of the city. | ||
| - Death rate (I5); per 100,000 | Rising death rate (I5) increases the intricacy of the life system in the city. | ||
| + Life expectancy (I6); year | Life expectancy (I6) is explicitly related to the willingness to recover from crises. A hopeful community bears the aftermath of disasters better. | ||
| + Health overall index (I7); multidimensional | A health overall index (I7) reflects the total functionality of a city health system. | ||
| Economic (ER) | - Commercial land use (I8); percent | Commercial land use (I8): The possibility of proximity between dangerous and safe uses is regarded as an appropriate indicator for urban resilience. Thus, commercial zones are considered as vulnerable due to the density and usual unsafe environments. | [6,19,20,24,36,38] |
| - Poverty line (I9); multidimensional | The poverty line (I9) indicates the ability of a given community to incur and bounce back during backlashes. | ||
| - Urban worn-out areas (I10); n | Urban worn-out texture (I10) is regarded as another indicator contributing to resilience in line with other economic ones. Such areas pose the most potential threats from the perspective of energy consumption and residents’ safety. | ||
| + Accident insurance (I11); n | The proportion of people covered by insurance (I11) allows for recovering as fast as possible. | ||
| + Employment (I12); % + Welfare (I13); multidimensional | Employment (I12) and welfare (I13) positively contribute to the readiness of the society for climate resilience. | ||
| Inst-infrastructural (IIR) | + Crisis management centers (I14) | Crisis management centers (I14) are considered as a necessity during disasters when deploying back; force and administering help are regarded as a matter of time. | [20,22,23,27,39] |
| + Access to health and rescue centers (I15) + Access to urban services (I16) | Access to health and rescue centers (I15), as well as urban service sectors (I16), acts as a buffer against the intensity of crises. | ||
| - Infrastructure vulnerability (I17) | The vulnerability of critical infrastructure (I17) plays a significant role in the battle against catastrophes, especially climate-oriented issues, and is inversely related to urban resilience. | ||
| Eco-environmental (EER) | + Water quality index (I18) - Air quality index (I19) | Water (I18) and air quality (I19) acts as a buffer, allowing the local areas to have more resistance against harsh conditions negatively and positively, respectively. Better environmental quality increases the capacity to absorb impositions. | [6,20,27,40] |
| + Green space ratio (I20) | Green space ratio (I20) helps understand the resistance and relief during a crisis. Arboreal and vegetative covers can help, while agrarians weaken extreme climate events. | ||
| + Slope (I21) + Elevation (I22) | Slope (I21) and elevation (I22) were selected as indicators related to stability, which contribute to urban resilience positively from the perspective of eco-environmental resilience. |
| Resilient Indicators | N | Minimum | Maximum | Mean | SD | CV |
|---|---|---|---|---|---|---|
| I1 | 22 | 80.00 | 101.00 | 88.68 | 4.52 | 0.05 |
| I2 | 22 | 0.00 | 1.00 | 0.35 | 0.23 | 0.66 |
| I3 | 22 | 36.00 | 418.00 | 186.45 | 104.02 | 0.56 |
| I4 | 22 | 3428.00 | 27,953.00 | 8788.50 | 6328.90 | 0.72 |
| I5 | 22 | 366.00 | 1089.00 | 609.68 | 191.92 | 0.31 |
| I6 | 22 | 74.50 | 79.10 | 76.32 | 1.46 | 0.02 |
| I7 | 22 | 6.93 | 7.98 | 7.42 | 0.30 | 0.04 |
| I8 | 22 | 0.53 | 6.94 | 2.31 | 1.62 | 0.70 |
| I9 | 22 | 1.00 | 5.00 | 3.27 | 1.35 | 0.41 |
| I10 | 22 | 3.00 | 619.00 | 220.23 | 206.64 | 0.94 |
| I11 | 22 | 2436.00 | 45,067.00 | 16,936.00 | 12,954.43 | 0.76 |
| I12 | 22 | 86.00 | 94.00 | 89.86 | 2.73 | 0.03 |
| I13 | 22 | −12.92 | 14.66 | 0.00 | 8.21 | - |
| I14 | 22 | 2.00 | 11.00 | 5.27 | 2.85 | 0.54 |
| I15 | 22 | 2.00 | 24.00 | 10.68 | 7.05 | 0.66 |
| I16 | 22 | 0.30 | 5.00 | 0.98 | 1.09 | 1.11 |
| I17 | 22 | 0.03 | 12.12 | 1.24 | 2.63 | 2.12 |
| I18 | 22 | 17.30 | 41.90 | 32.40 | 5.85 | 0.18 |
| I19 | 22 | 13.00 | 130.00 | 72.23 | 35.85 | 0.50 |
| I20 | 22 | 0.64 | 16.79 | 4.87 | 4.28 | 0.88 |
| I21 | 22 | 1.36 | 10.81 | 3.87 | 2.84 | 0.73 |
| I22 | 22 | 80.00 | 101.00 | 88.68 | 4.52 | 0.05 |
| Factors | Initial Eigenvalues | Extraction Sums of Squared Loadings | Rotation Sums of Squared Loadings | ||||||
|---|---|---|---|---|---|---|---|---|---|
| Total | % of Variance | Cumulative % | Total | % of Variance | Cumulative % | Total | % of Variance | Cumulative % | |
| 1 | 8.234 | 37.429 | 37.429 | 8.234 | 37.429 | 37.429 | 6.898 | 31.353 | 31.353 |
| 2 | 3.556 | 16.163 | 53.593 | 3.556 | 16.163 | 53.593 | 3.516 | 15.980 | 47.333 |
| 3 | 2.356 | 10.708 | 64.301 | 2.356 | 10.708 | 64.301 | 2.856 | 12.982 | 60.315 |
| 4 | 2.077 | 9.441 | 73.742 | 2.077 | 9.441 | 73.742 | 2.682 | 12.193 | 72.508 |
| 5 | 1.324 | 6.016 | 79.758 | 1.324 | 6.016 | 79.758 | 1.419 | 6.448 | 78.956 |
| 6 | 1.072 | 4.871 | 84.629 | 1.072 | 4.871 | 84.629 | 1.248 | 5.673 | 84.629 |
| Indicators | f1 | f2 | f3 | f4 | f5 | f6 |
|---|---|---|---|---|---|---|
| SCR/ER/EER | IIR | IIR/EER | SCR | IIR | SCR | |
| I22 | 0.927 | −0.067 | 0.019 | −0.176 | −0.027 | 0.211 |
| I21 | 0.896 | −0.115 | 0.130 | −0.206 | −0.054 | 0.057 |
| I13 | 0.873 | 0.196 | −0.289 | 0.130 | 0.068 | −0.018 |
| I4 | 0.864 | −0.113 | 0.210 | 0.181 | 0.102 | −0.220 |
| I6 | 0.818 | −0.136 | 0.443 | −0.167 | 0.026 | 0.069 |
| I9 | −0.780 | 0.115 | 0.005 | 0.452 | 0.280 | 0.066 |
| I18 | 0.741 | −0.120 | 0.086 | −0.087 | −0.213 | 0.339 |
| I11 | 0.719 | −0.206 | 0.376 | −0.167 | 0.075 | 0.185 |
| I17 | −0.233 | 0.854 | −0.059 | −0.057 | −0.146 | −0.099 |
| I15 | 0.411 | 0.840 | 0.089 | −0.024 | 0.125 | −0.019 |
| I14 | 0.133 | −0.092 | 0.817 | −0.013 | 0.231 | −0.261 |
| I20 | 0.153 | 0.171 | 0.787 | −0.145 | −0.068 | 0.273 |
| I3 | −0.126 | 0.063 | −0.185 | 0.940 | −0.049 | 0.037 |
| I2 | −0.047 | 0.554 | −0.093 | −0.749 | −0.099 | −0.010 |
| I16 | −0.096 | −0.106 | 0.015 | −0.037 | 0.889 | 0.000 |
| I7 | 0.155 | −0.077 | −0.018 | 0.065 | 0.012 | 0.905 |
| I19 | −0.209 | 0.614 | −0.610 | 0.237 | 0.083 | 0.049 |
| I8 | −0.328 | 0.645 | −0.243 | 0.467 | −0.287 | 0.045 |
| I5 | −0.359 | 0.537 | −0.467 | −0.225 | −0.310 | −0.063 |
| I12 | −0.539 | 0.508 | 0.226 | 0.259 | 0.392 | −0.088 |
| I1 | 0.499 | 0.227 | −0.566 | −0.012 | 0.181 | 0.063 |
| I10 | −0.496 | 0.408 | −0.069 | 0.651 | −0.027 | −0.002 |
Disclaimer/Publisher’s Note: The statements, opinions and data contained in all publications are solely those of the individual author(s) and contributor(s) and not of MDPI and/or the editor(s). MDPI and/or the editor(s) disclaim responsibility for any injury to people or property resulting from any ideas, methods, instructions or products referred to in the content. |
© 2023 by the authors. Licensee MDPI, Basel, Switzerland. This article is an open access article distributed under the terms and conditions of the Creative Commons Attribution (CC BY) license (https://creativecommons.org/licenses/by/4.0/).
Share and Cite
Jamali, A.; Robati, M.; Nikoomaram, H.; Farsad, F.; Aghamohammadi, H. Urban Resilience and Climate Change: Developing a Multidimensional Index to Adapt against Climate Change in the Iranian Capital City of Tehran. Urban Sci. 2023, 7, 7. https://doi.org/10.3390/urbansci7010007
Jamali A, Robati M, Nikoomaram H, Farsad F, Aghamohammadi H. Urban Resilience and Climate Change: Developing a Multidimensional Index to Adapt against Climate Change in the Iranian Capital City of Tehran. Urban Science. 2023; 7(1):7. https://doi.org/10.3390/urbansci7010007
Chicago/Turabian StyleJamali, Azadeh, Maryam Robati, Hanieh Nikoomaram, Forough Farsad, and Hossein Aghamohammadi. 2023. "Urban Resilience and Climate Change: Developing a Multidimensional Index to Adapt against Climate Change in the Iranian Capital City of Tehran" Urban Science 7, no. 1: 7. https://doi.org/10.3390/urbansci7010007
APA StyleJamali, A., Robati, M., Nikoomaram, H., Farsad, F., & Aghamohammadi, H. (2023). Urban Resilience and Climate Change: Developing a Multidimensional Index to Adapt against Climate Change in the Iranian Capital City of Tehran. Urban Science, 7(1), 7. https://doi.org/10.3390/urbansci7010007