


Density and Urban Resilience, Cross-Section Analysis in an Iranian Metropolis Context


Abstract
1. Introduction
2. Literature Review
3. Research Design
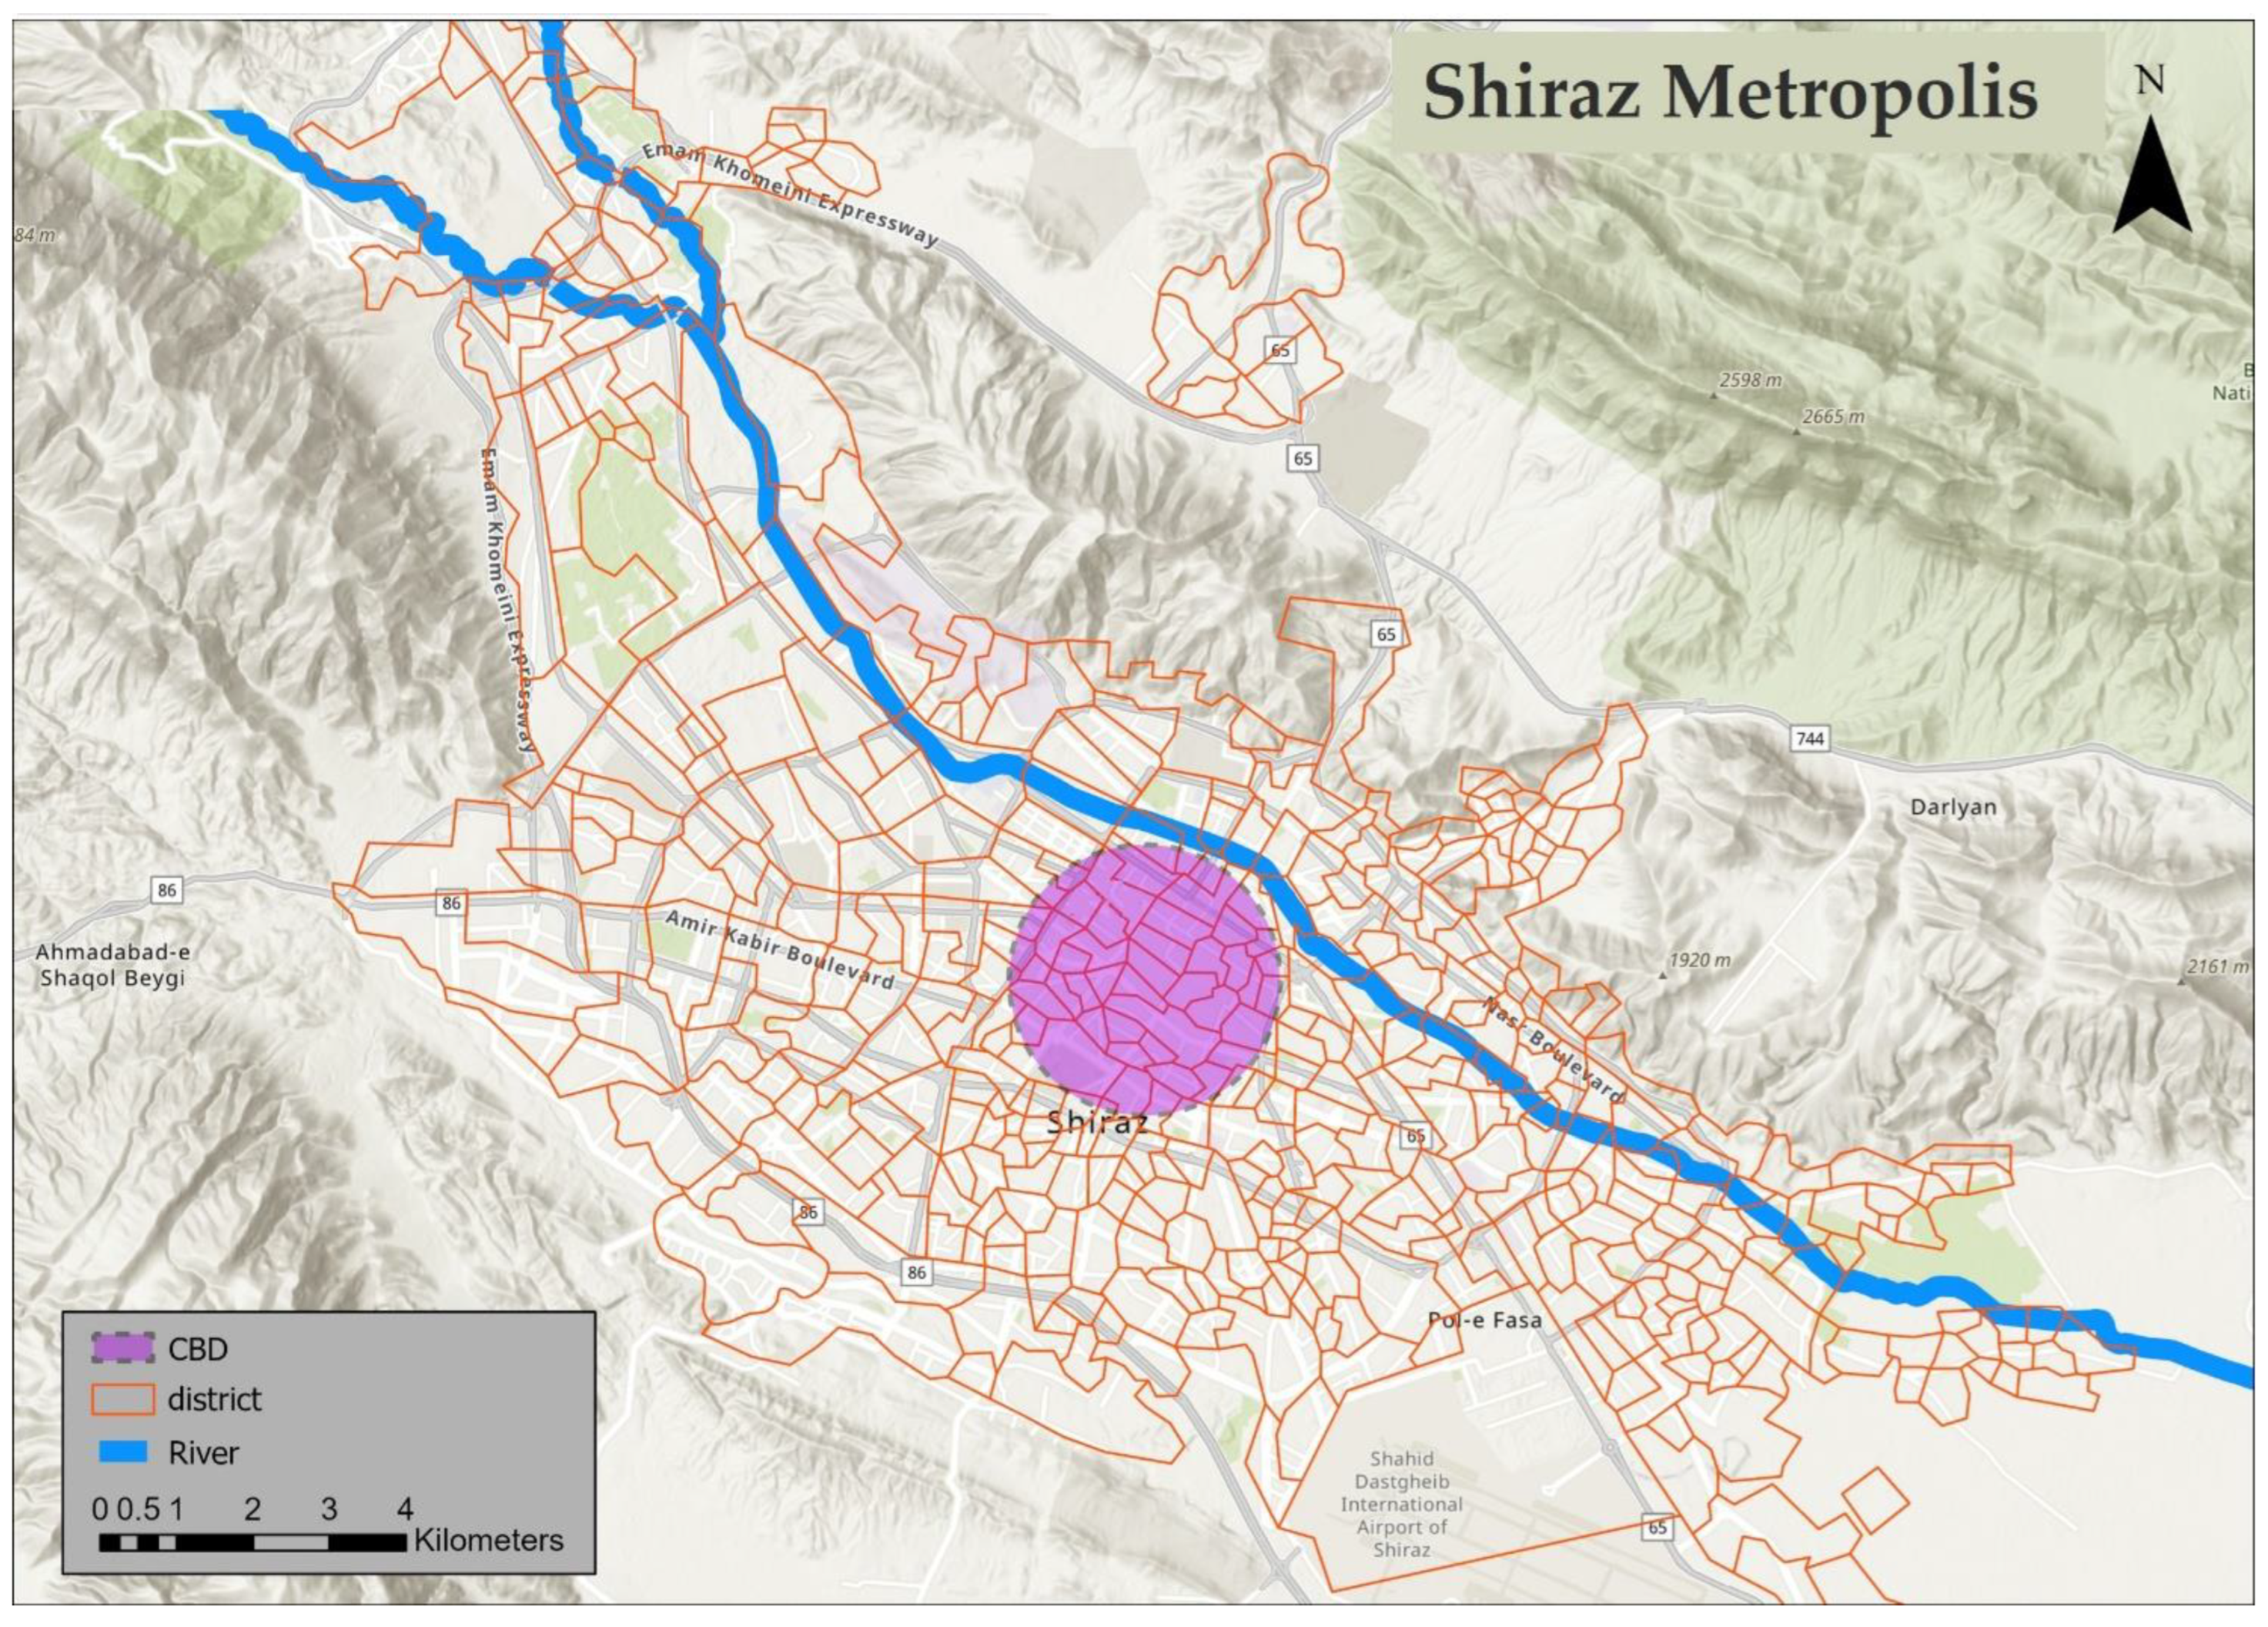
4. Case Study
5. Material and Methods
5.1. Data Acquisition
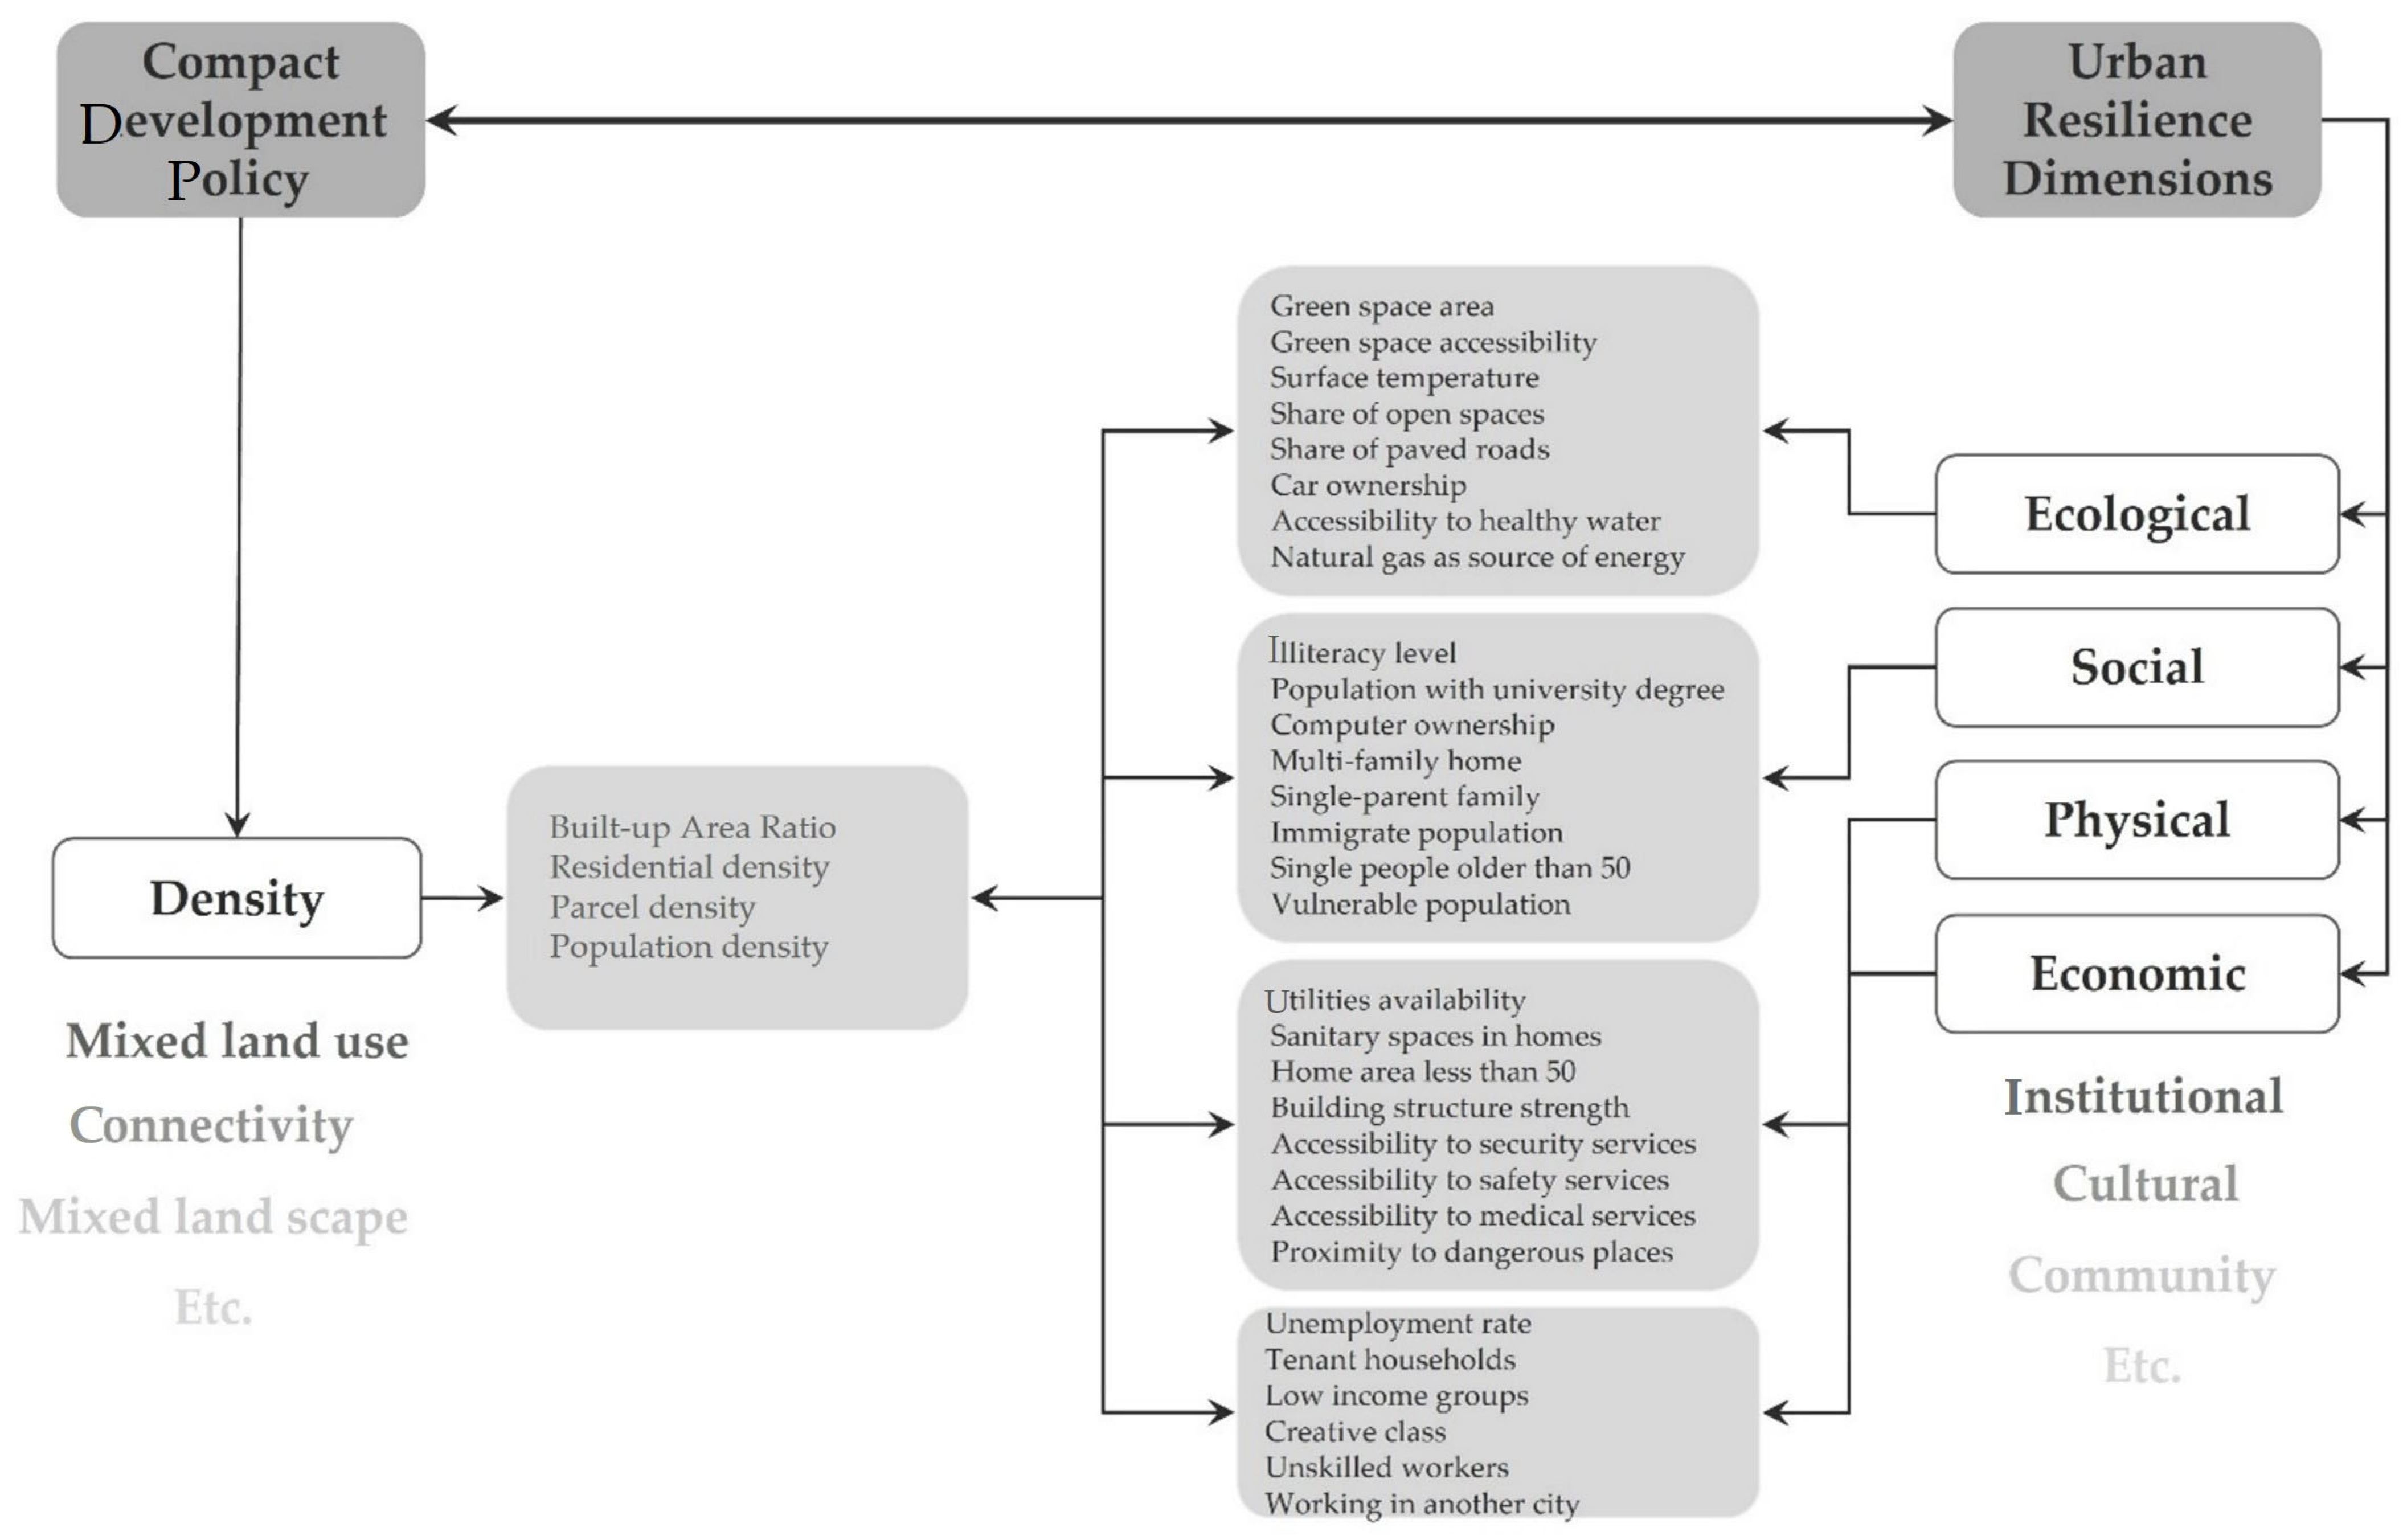
5.2. Resilience Indicators
5.3. Densification Measurement
6. Results
6.1. Cross-Sectional Analysis of Urban Resilience
6.1.1. Ecological Resilience Indicators
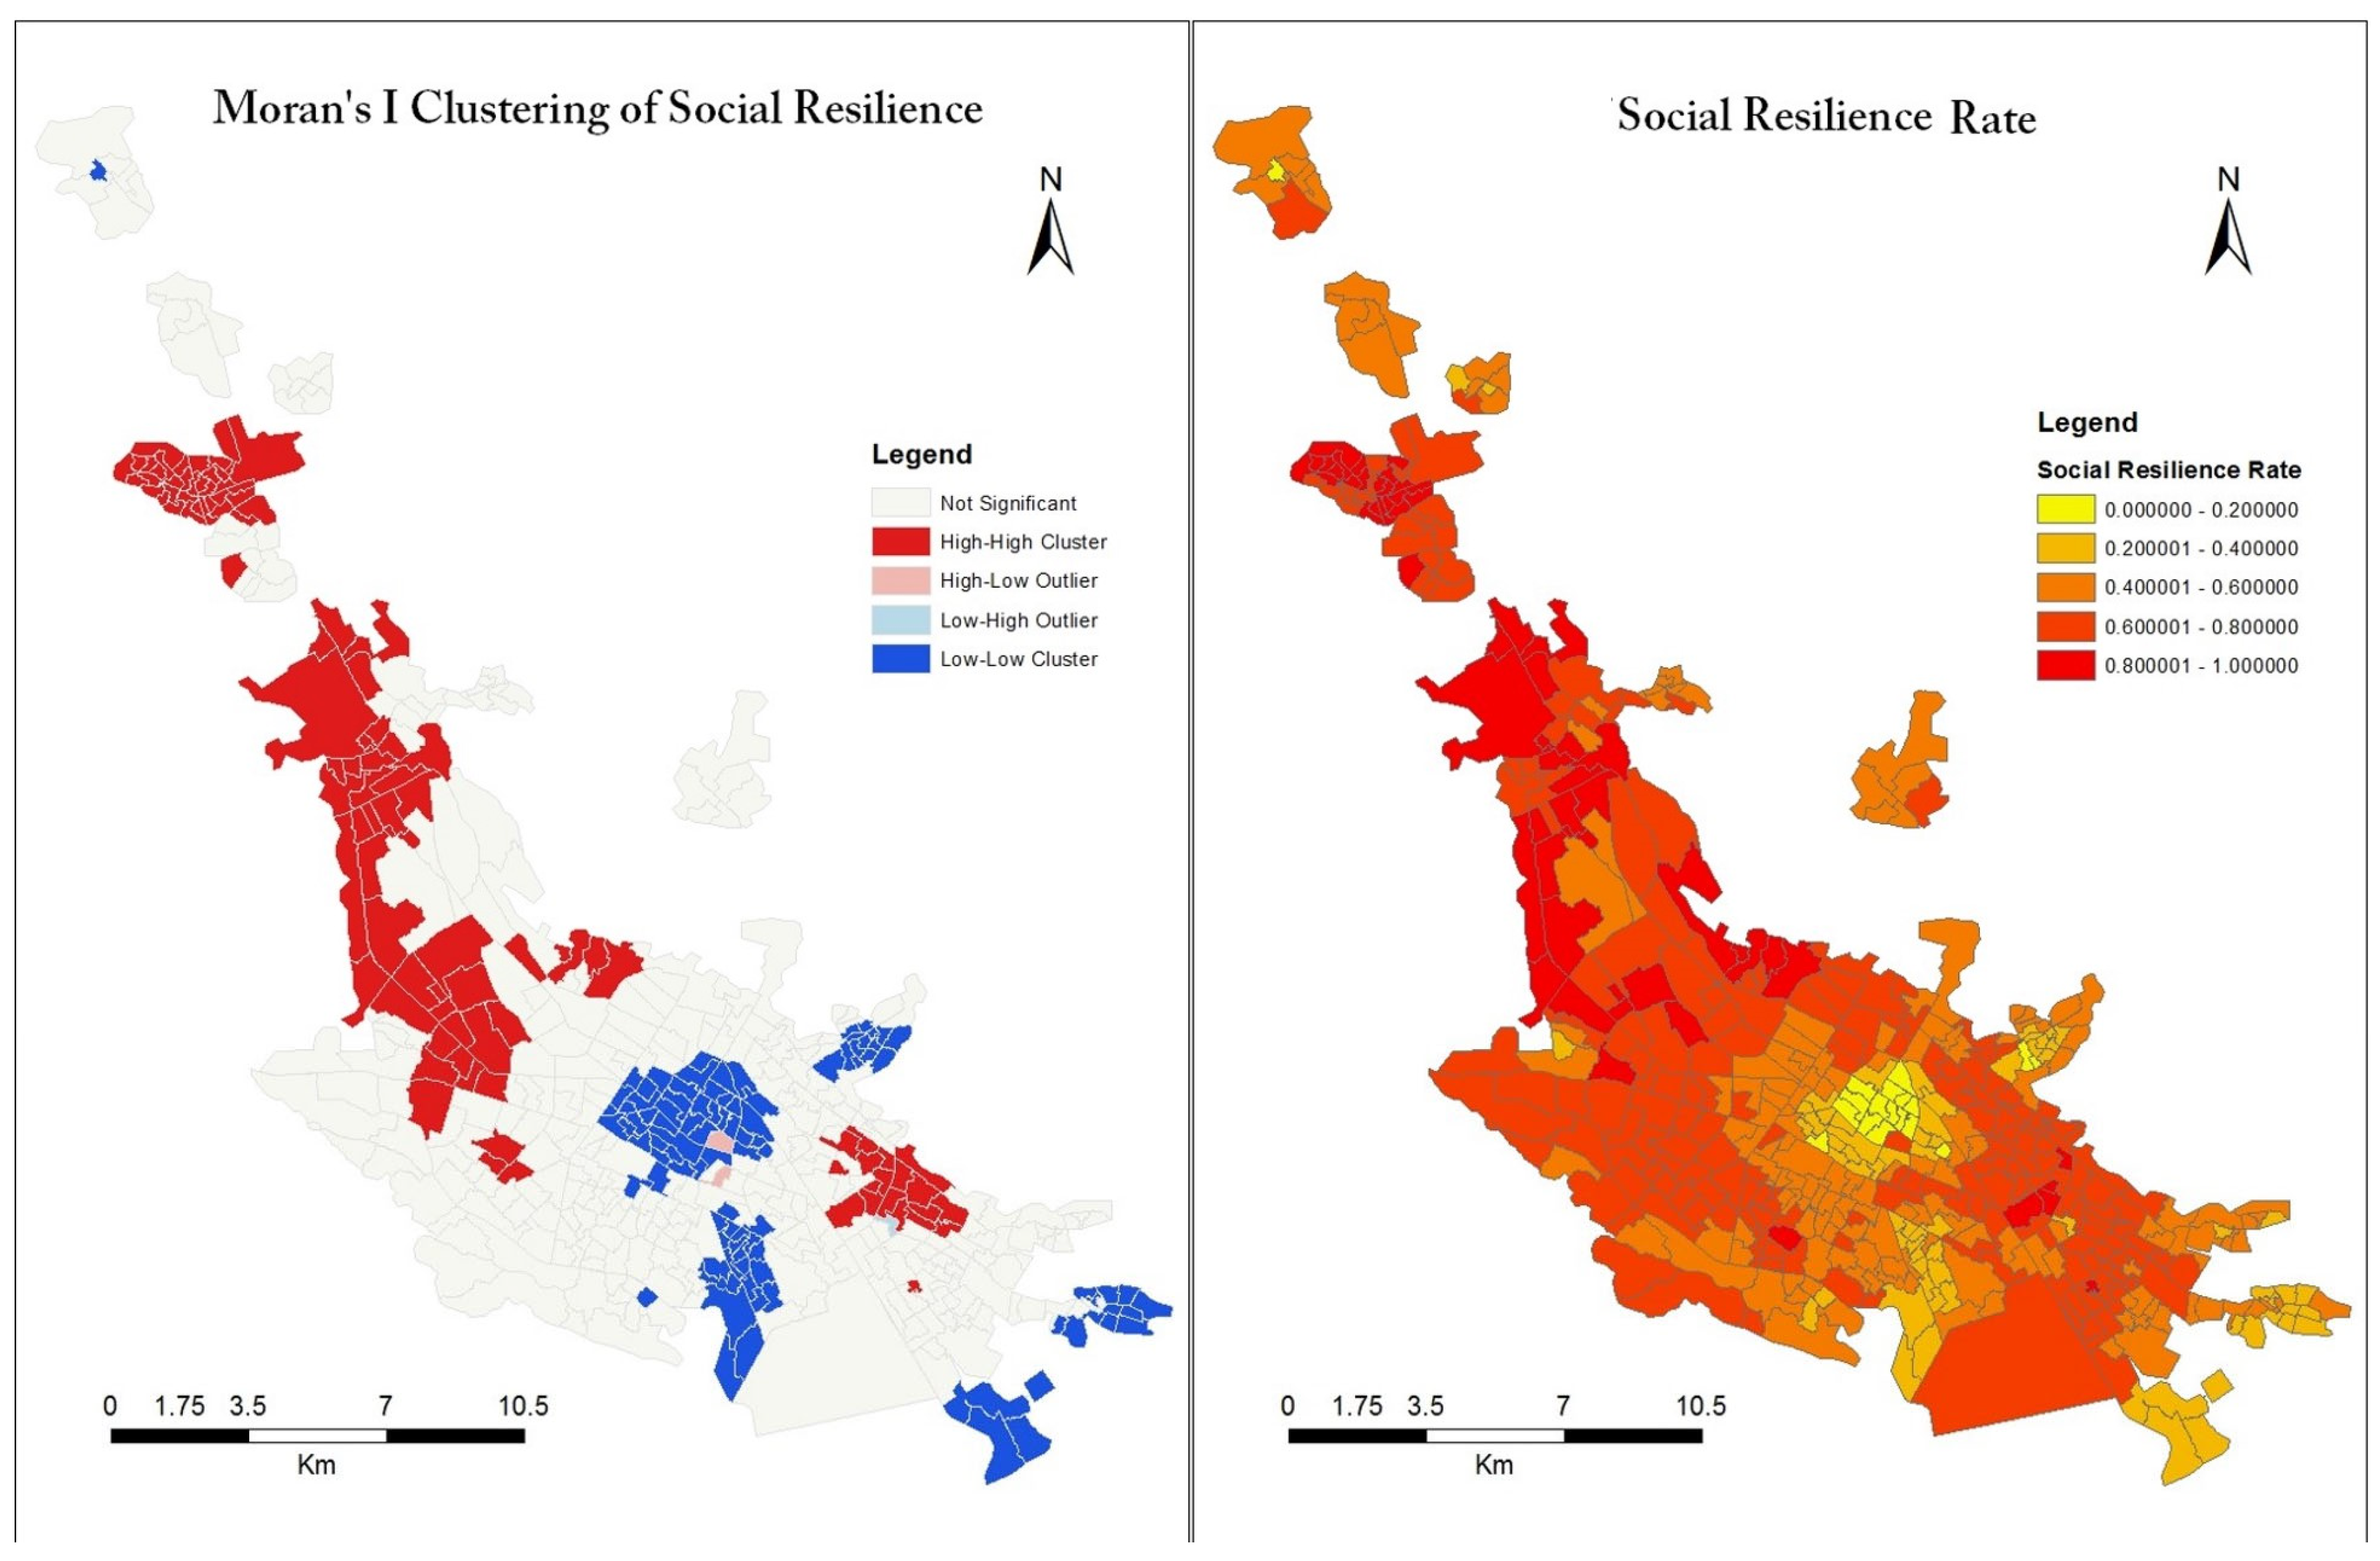
6.1.2. Social Resilience
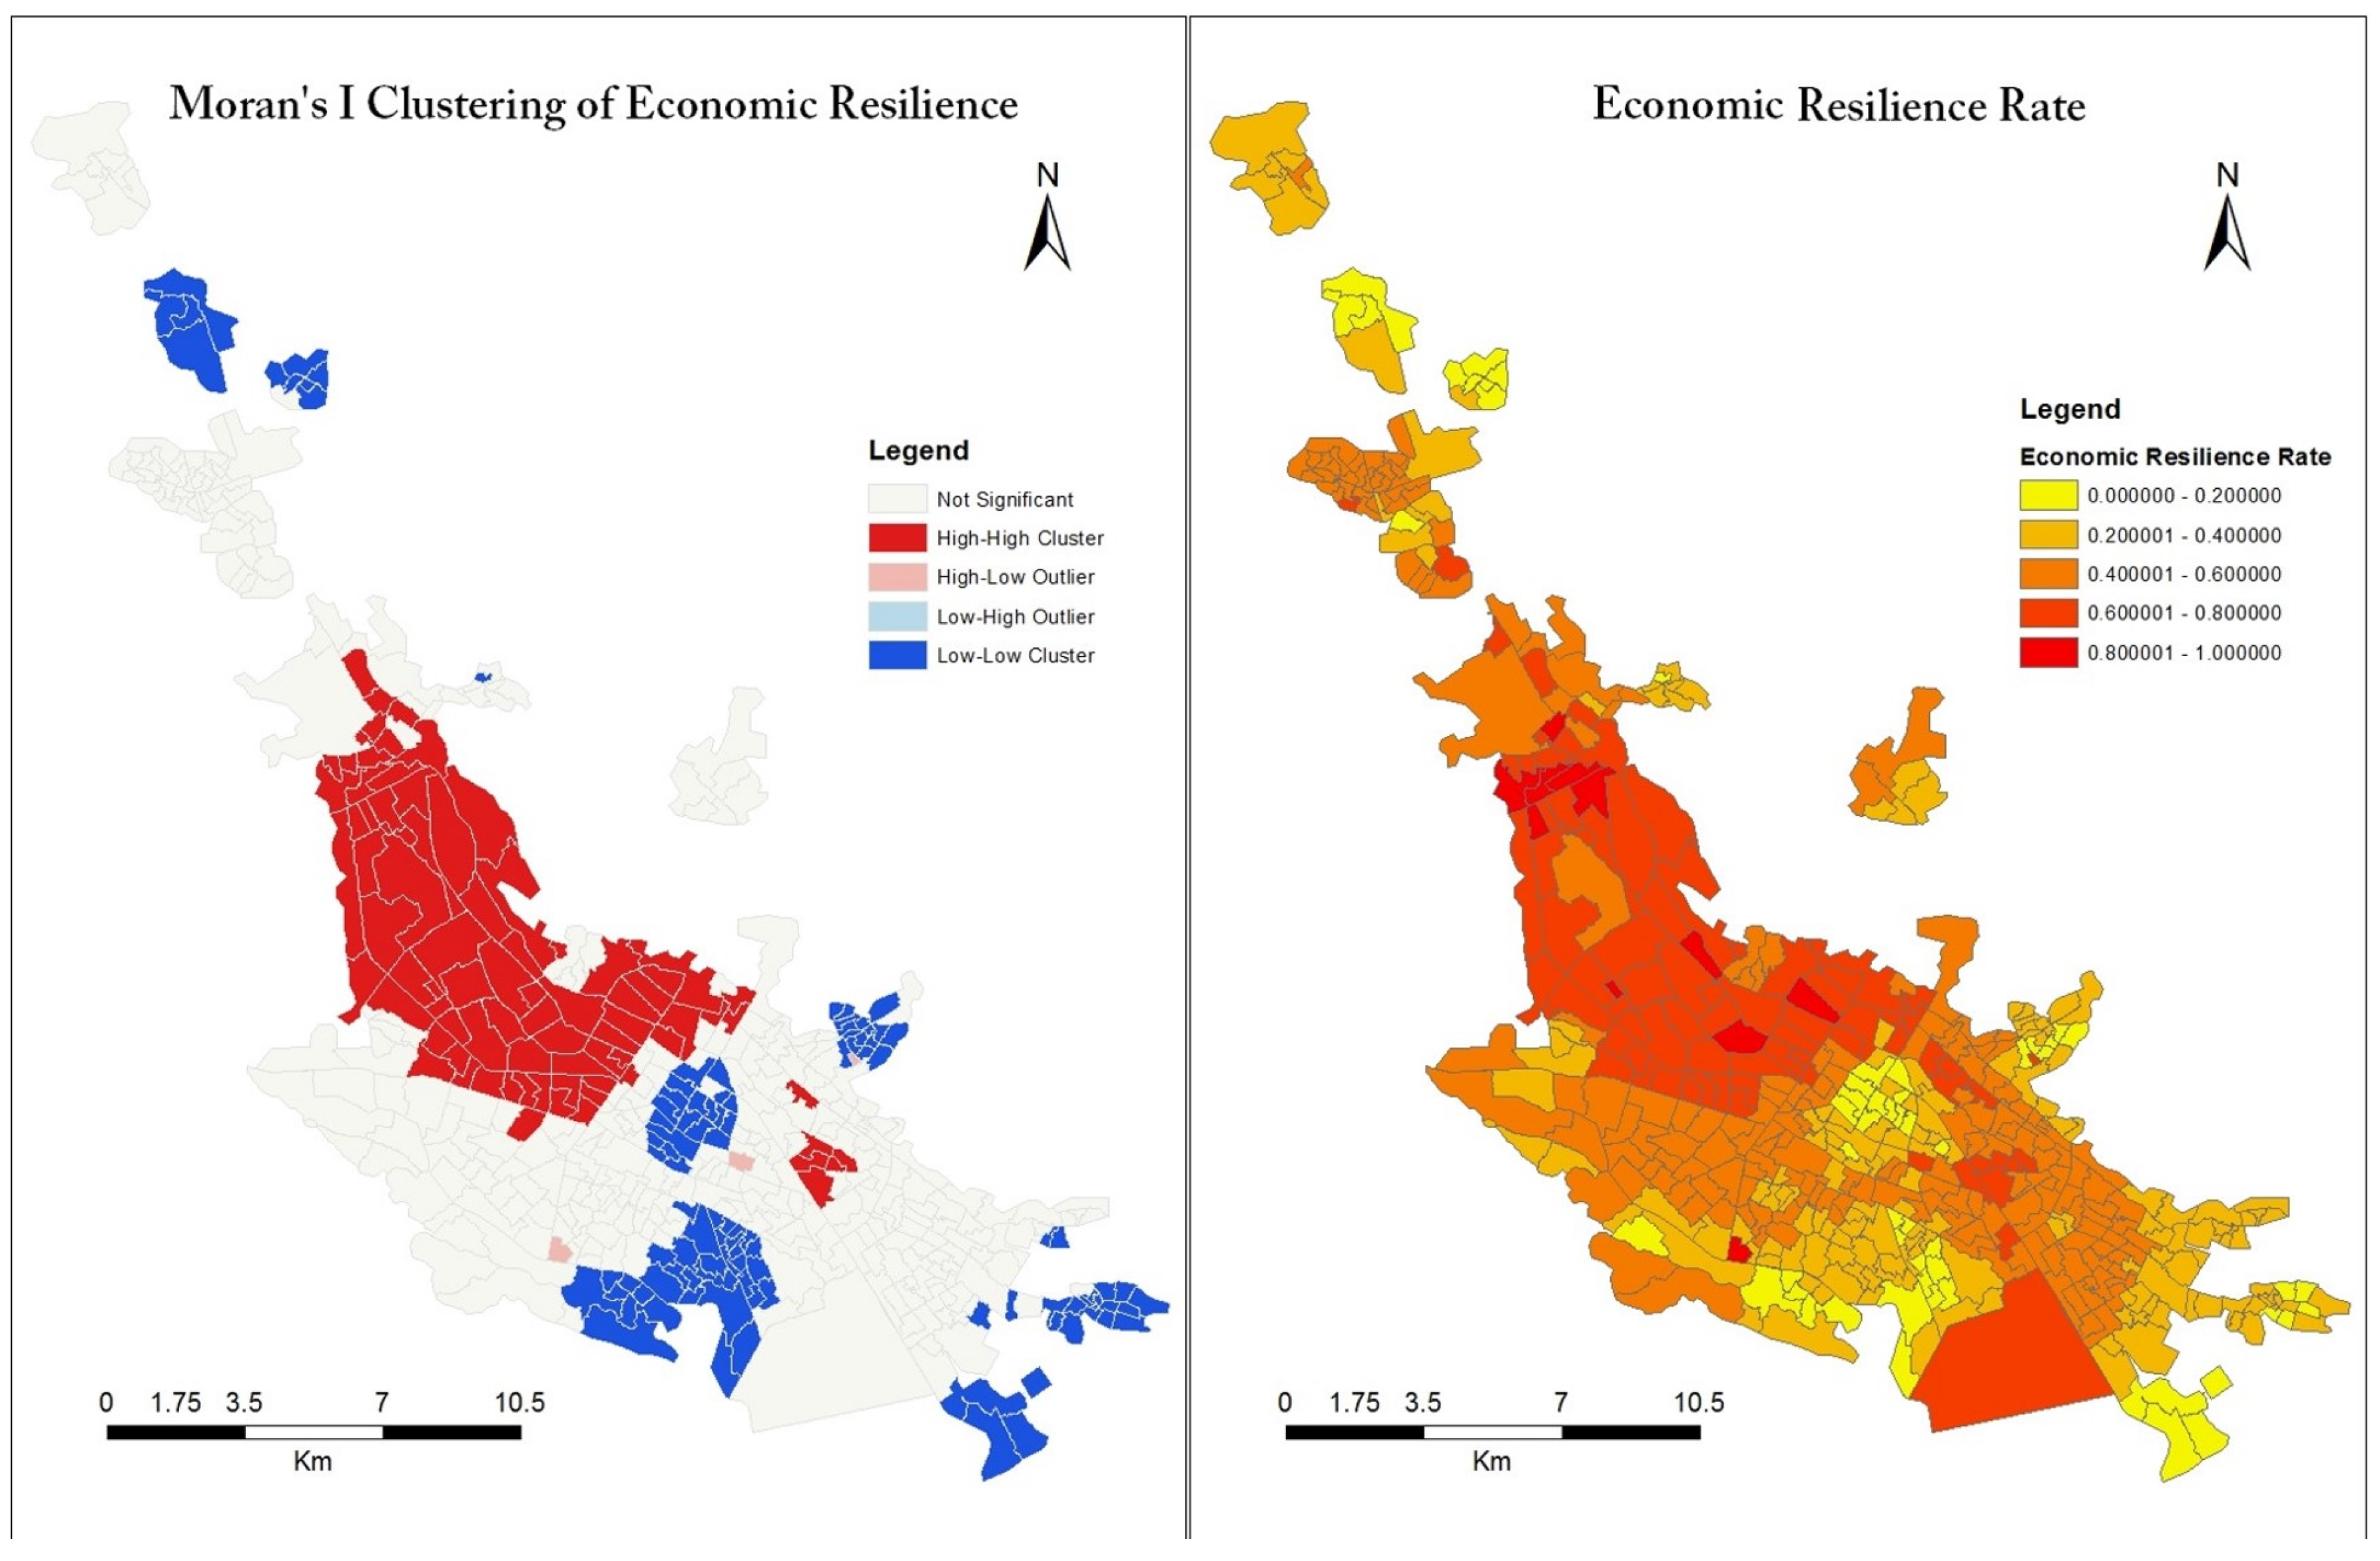
6.1.3. Economic Resilience
6.1.4. Physical Resilience
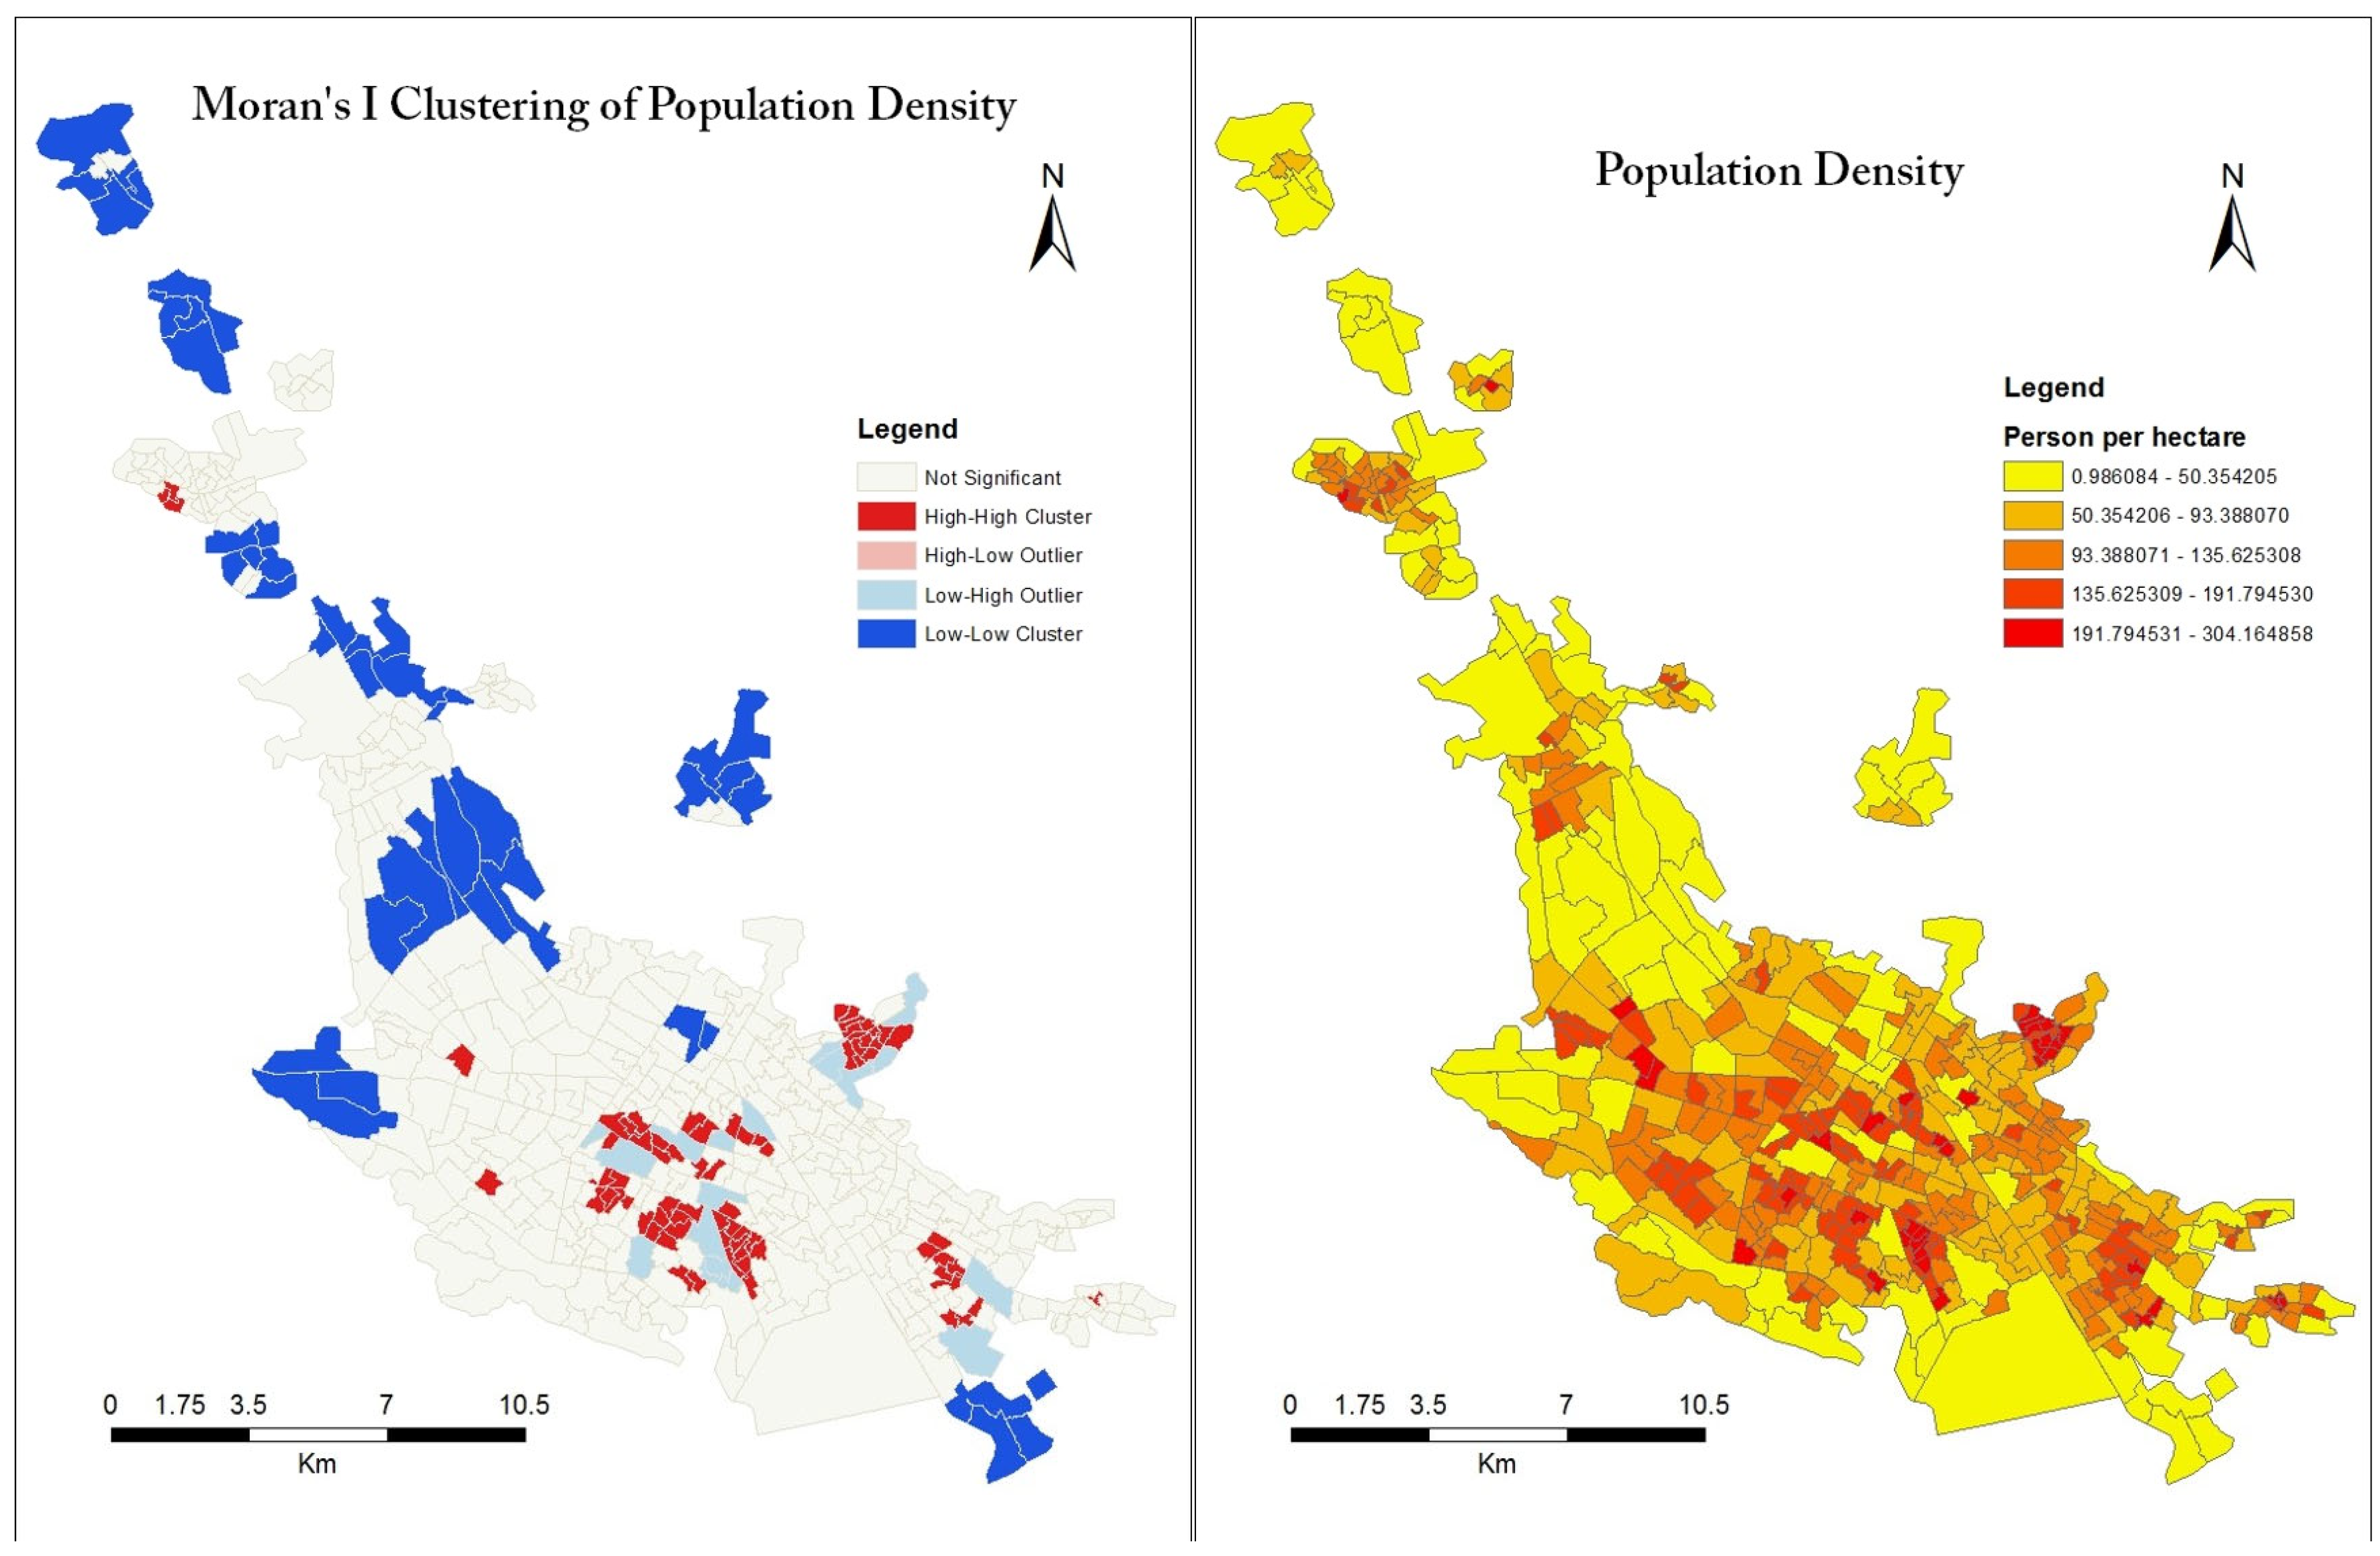
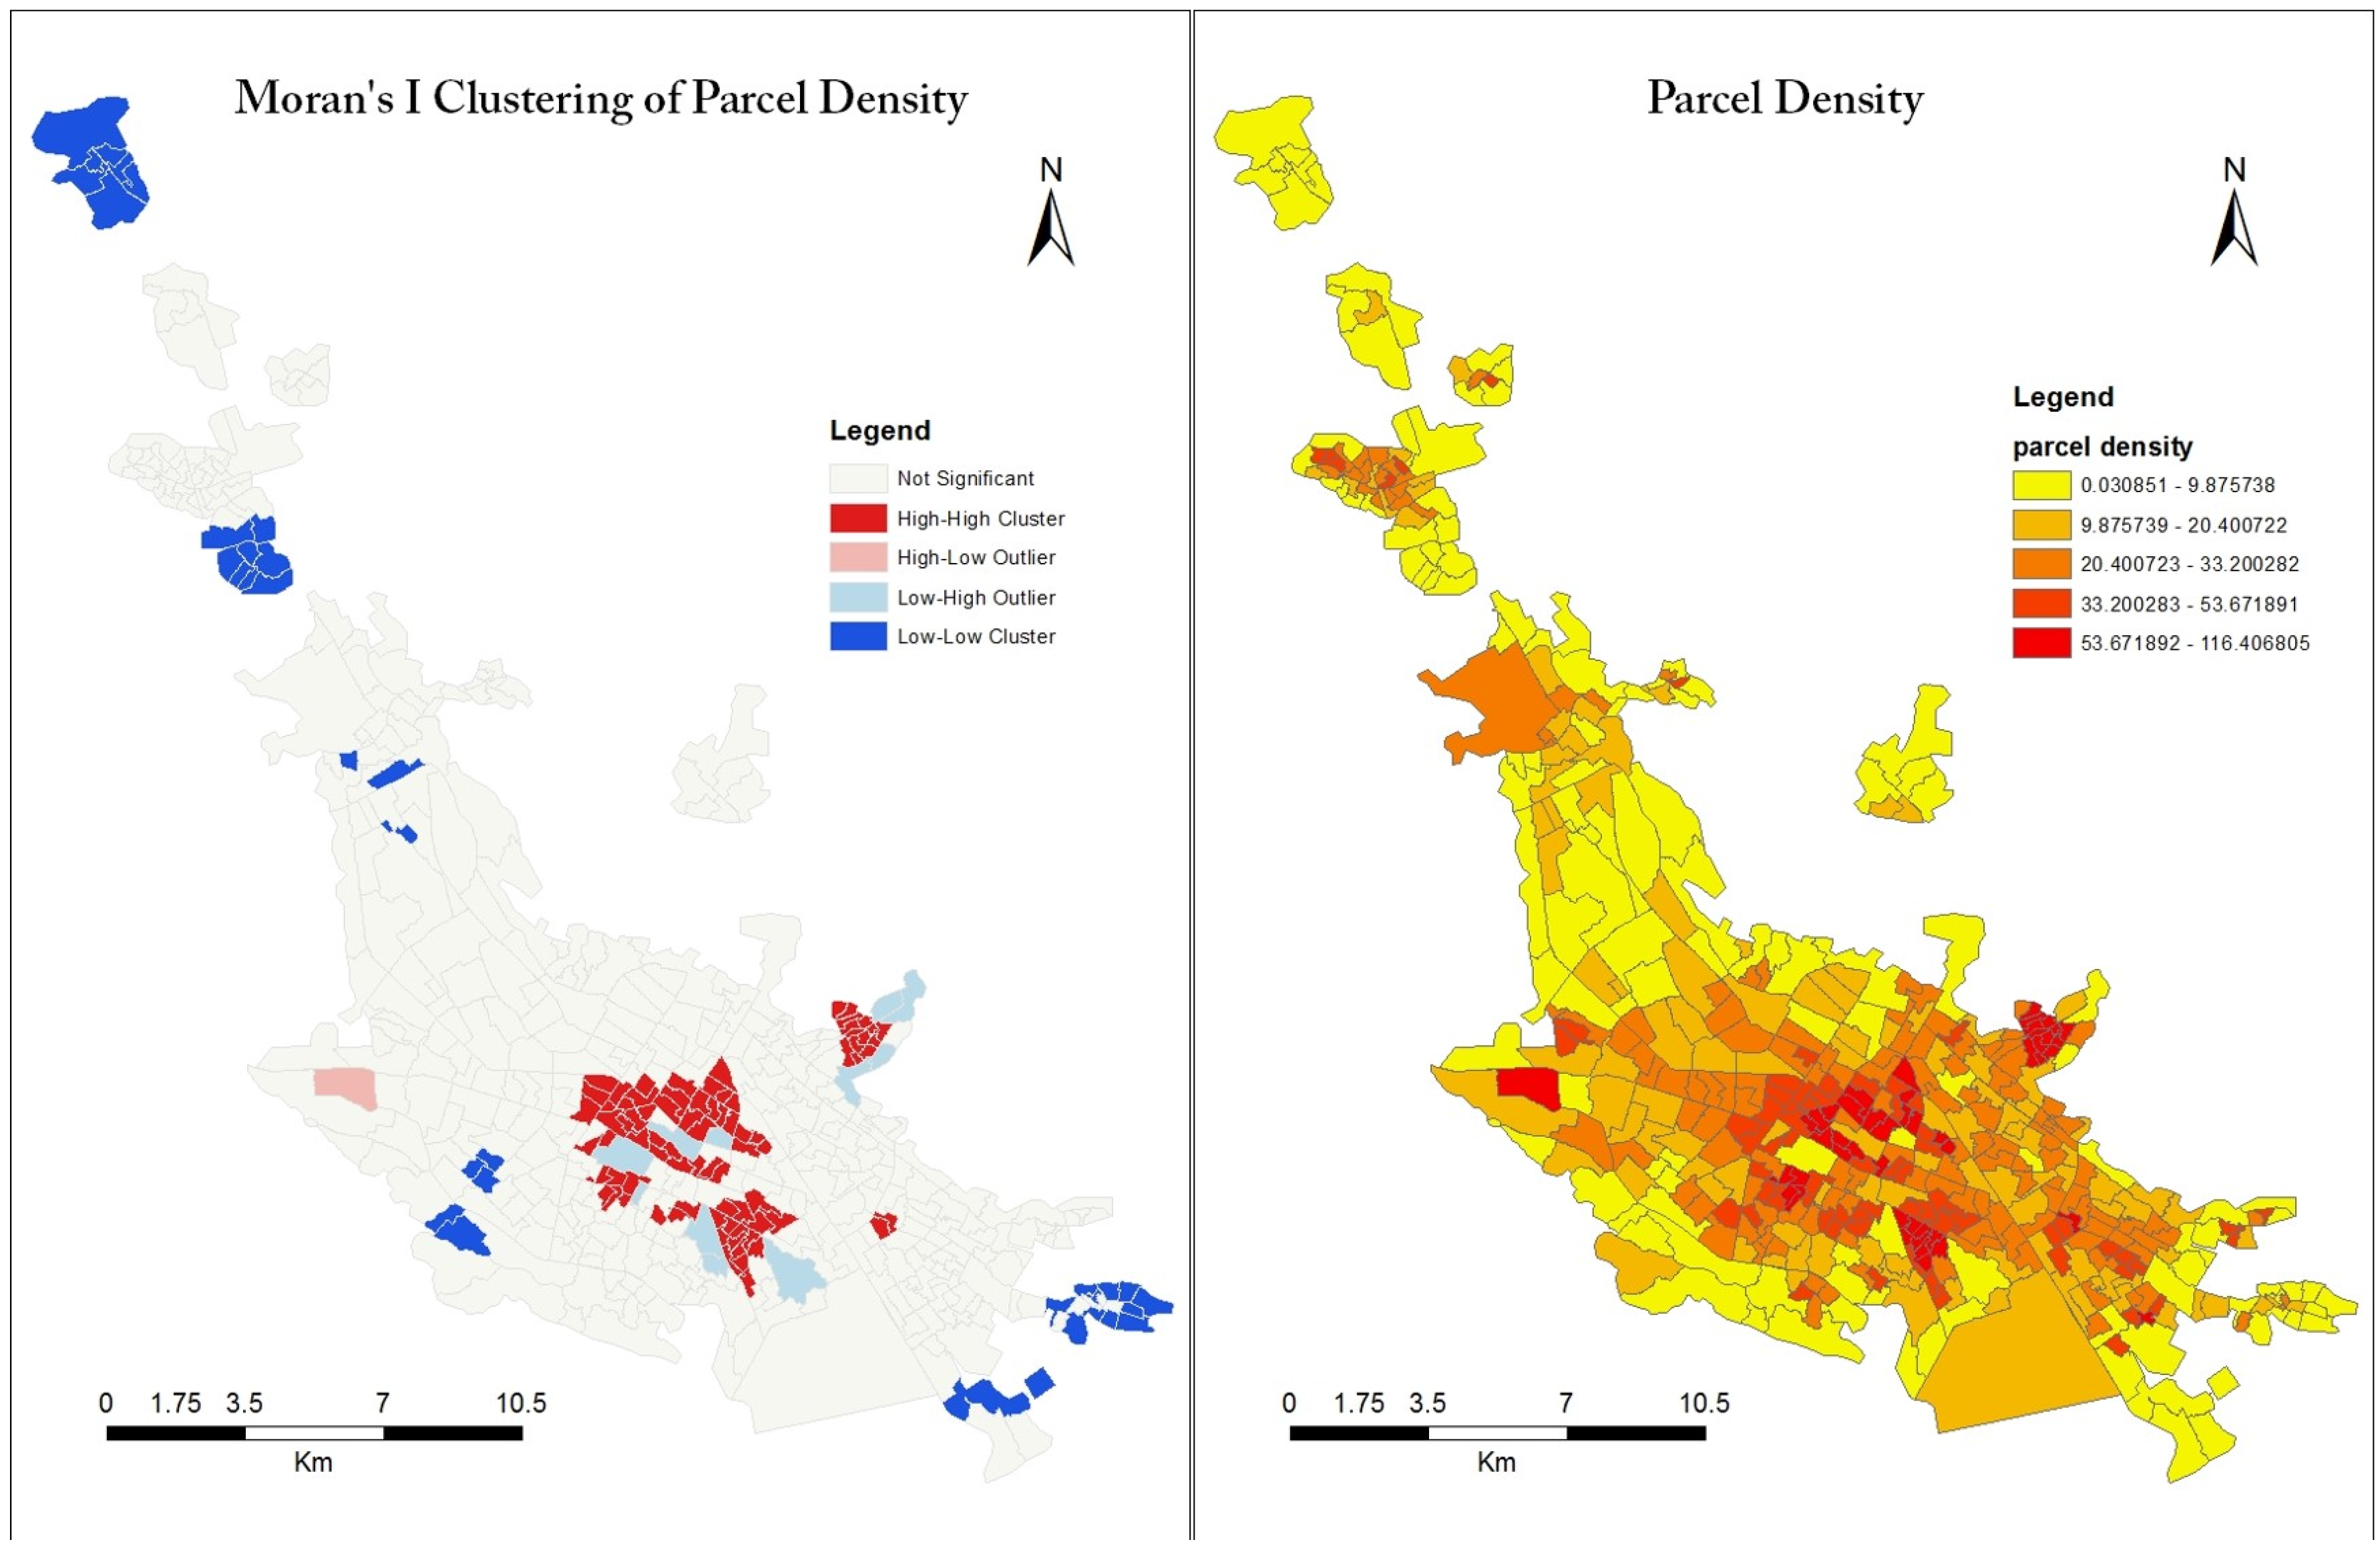
6.2. Cross-Sectional Analysis of Densification
6.3. Densification and Urban Resilience Correlation
7. Discussion
8. Concluding Remarks and Policy Implications
Author Contributions
Funding
Data Availability Statement
Conflicts of Interest
References
- van Vliet, W. Cities in a globalizing world: From engines of growth to agents of change. Environ. Urban. 2002, 14, 31–40. [Google Scholar] [CrossRef]
- Sharifi, A.; Khavarian-Garmsir, A.R. The covid-19 pandemic: Impacts on cities and major lessons for urban planning, design, and management. Sci. Total Environ. 2020, 749, 142391. [Google Scholar] [CrossRef]
- Davoudi, S.; Brooks, E.; Mehmood, A. Evolutionary resilience and strategies for climate adaptation. Plan. Pract. Res. 2013, 28, 307–322. [Google Scholar] [CrossRef]
- Feldmeyer, D.; Wilden, D.; Kind, C.; Kaiser, T.; Goldschmidt, R.; Diller, C.; Birkmann, J. Indicators for monitoring urban climate change resilience and adaptation. Sustainability 2019, 11, 2931. [Google Scholar] [CrossRef]
- Walker, B. Resilience: What it is and is not. Ecol. Soc. 2020, 25, 11. [Google Scholar] [CrossRef]
- Walker, B.; Carpenter, S.; Folke, C.; Gunderson, L.; Peterson, G.; Scheffer, M.; Schoon, M.; Westley, F. Navigating the chaos of an unfolding global cycle. Ecol. Soc. 2020, 25, 23. [Google Scholar] [CrossRef]
- Dehghani, A.; Alidadi, M.; Sharifi, A. Compact Development Policy and Urban Resilience: A Critical Review. Sustainability 2022, 14, 11798. [Google Scholar] [CrossRef]
- Jabareen, Y.R. Sustainable urban forms: Their typologies, models, and concepts. J. Plan. Educ. Res. 2006, 26, 38–52. [Google Scholar] [CrossRef]
- Moran, D.; Kanemoto, K.; Jiborn, M.; Wood, R.; Többen, J.; Seto, K.C. Carbon footprints of 13 000 cities. Environ. Res. Lett. 2018, 13, 064041. [Google Scholar] [CrossRef]
- Boyko, C.T.; Cooper, R. Clarifying and re-conceptualising density. Prog. Plan. 2011, 76, 1–61. [Google Scholar] [CrossRef]
- Bibri, S.E.; Krogstie, J.; Kärrholm, M. Compact city planning and development: Emerging practices and strategies for achieving the goals of sustainability. Dev. Built Environ. 2020, 4, 100021. [Google Scholar] [CrossRef]
- Lennon, M. Green space and the compact city: Planning issues for a ‘new normal’. Cities Health 2020, 5, S212–S215. [Google Scholar] [CrossRef]
- Azhdari, A.; Alidadi, M.; Pojani, D. What Drives Urban Densification? Free Market versus Government Planning in Iran. J. Plan. Educ. Res. 2022. [Google Scholar] [CrossRef]
- Asadzadeh, A.; Kötter, T.; Fekete, A.; Moghadas, M.; Alizadeh, M.; Zebardast, E.; Hutter, G. Urbanization, migration, and the challenges of resilience thinking in urban planning: Insights from two contrasting planning systems in Germany and Iran. Cities. 2022, 125, 103642. [Google Scholar]
- Davoudi, S.; Shaw, K.; Haider, L.J.; Quinlan, A.E.; Peterson, G.D.; Wilkinson, C.; Fünfgeld, H.; McEvoy, D.; Porter, L.; Davoudi, S. Resilience: A bridging concept or a dead end? “Reframing” resilience: Challenges for planning theory and practice interacting traps: Resilience assessment of a pasture management system in northern afghanistan urban resilience: What does it mean in planning practice? Resilience as a useful concept for climate change adaptation? The politics of resilience for planning: A cautionary note: Edited by simin davoudi and libby porter. Plan. Theory Pract. 2012, 13, 299–333. [Google Scholar]
- Adger, W.N. Social and ecological resilience: Are they related? Prog. Hum. Geogr. 2000, 24, 347–364. [Google Scholar] [CrossRef]
- Holling, C.S. Engineering resilience versus ecological resilience. Eng. Ecol. Constraints 1996, 31, 32. [Google Scholar]
- Ribeiro, P.J.G.; Gonçalves, L.A.P.J. Urban resilience: A conceptual framework. Sustain. Cities Soc. 2019, 50, 101625. [Google Scholar] [CrossRef]
- Béné, C.; Mehta, L.; McGranahan, G.; Cannon, T.; Gupte, J.; Tanner, T. Resilience as a policy narrative: Potentials and limits in the context of urban planning. Clim. Dev. 2018, 10, 116–133. [Google Scholar] [CrossRef]
- Sanchez, A.X.; Van der Heijden, J.; Osmond, P. The city politics of an urban age: Urban resilience conceptualisations and policies. Palgrave Commun. 2018, 4, 25. [Google Scholar] [CrossRef]
- Meerow, S.; Newell, J.P. Urban resilience for whom, what, when, where, and why? Urban Geogr. 2019, 40, 309–329. [Google Scholar] [CrossRef]
- Sharifi, A. A critical review of selected tools for assessing community resilience. Ecol. Indic. 2016, 69, 629–647. [Google Scholar] [CrossRef]
- Joerin, J.; Shaw, R.; Takeuchi, Y.; Krishnamurthy, R. The adoption of a climate disaster resilience index in chennai, india. Disasters 2014, 38, 540–561. [Google Scholar] [CrossRef] [PubMed]
- Suárez, M.; Gómez-Baggethun, E.; Benayas, J.; Tilbury, D. Towards an urban resilience index: A case study in 50 spanish cities. Sustainability 2016, 8, 774. [Google Scholar] [CrossRef]
- Zhang, M.; Yang, Y.; Li, H.; van Dijk, M.P. Measuring urban resilience to climate change in three chinese cities. Sustainability 2020, 12, 9735. [Google Scholar] [CrossRef]
- Chenhong, X.; Guofang, Z. The spatiotemporal evolution pattern of urban resilience in the Yangtze River Delta Urban Agglomeration based on TOPSIS-PSO-ELM. Sustain. Cities Soc. 2022, 87, 104223. [Google Scholar] [CrossRef]
- Khoja, L.; Schubert, R.; Joerin, J. Social Resilience Indicators for Disaster Related Contexts: Literature Review; Future Resilient Systems: Singapore, 2020. [Google Scholar]
- Chelleri, L.; Baravikova, A. Understandings of urban resilience meanings and principles across Europe. Cities 2021, 108, 102985. [Google Scholar] [CrossRef]
- Lim, H.K.; Kain, J.-H. Compact cities are complex, intense and diverse but: Can we design such emergent urban properties? Urban Plan. 2016, 1, 95–113. [Google Scholar] [CrossRef]
- Burton, E. Measuring urban compactness in uk towns and cities. Environ. Plan. B Plan. Des. 2002, 29, 219–250. [Google Scholar] [CrossRef]
- Bibby, P.; Henneberry, J.; Halleux, J.M. Incremental residential densification and urban spatial justice: The case of England between 2001 and 2011. Urban Studies. 2021, 58, 2117–2138. [Google Scholar] [CrossRef]
- Ahfeldt, G.M.; Pietrostefani, E. The Compact City in Empirical Research: A Quantitative Literature Review; Spatial Economics Research Centre, London School of Economics and Political Science: London, UK, 2017. [Google Scholar]
- Du, P.; Wood, A.; Ditchman, N.; Stephens, B. Life satisfaction of downtown high-rise vs. suburban low-rise living: A chicago case study. Sustainability 2017, 9, 1052. [Google Scholar] [CrossRef]
- Haigh, F.; Chok, H.N.; Harris, P. Housing Density and Health: A Review of the Literature and Health Impact Assessments; University of New South Wales Centre for Primary Health Care and Equity: Sydney, Australia, 2011. [Google Scholar]
- Bramley, G.; Power, S. Urban form and social sustainability: The role of density and housing type. Environ. Plan. B Plan. Des. 2009, 36, 30–48. [Google Scholar] [CrossRef]
- Shi, L.; Yang, S.; Gao, L. Effects of a compact city on urban resources and environment. J. Urban Plan. Dev. 2016, 142, 05016002. [Google Scholar] [CrossRef]
- Angel, S.; Franco, S.A.; Liu, Y.; Blei, A.M. The shape compactness of urban footprints. Prog. Plan. 2020, 139, 100429. [Google Scholar] [CrossRef]
- Pont, M.B.; Haupt, P.; Berg, P.; Alstäde, V.; Heyman, A. Systematic review and comparison of densification effects and planning motivations. Build. Cities 2021, 2, 378–401. [Google Scholar] [CrossRef]
- Miles, R.; Coutts, C.; Mohamadi, A. Neighborhood urban form, social environment, and depression. J. Urban Health 2012, 89, 1–18. [Google Scholar] [CrossRef]
- Lehmann, S. Sustainable urbanism: Towards a framework for quality and optimal density? Future Cities Environ. 2016, 2, 8. [Google Scholar] [CrossRef]
- Mouratidis, K. Is compact city livable? the impact of compact versus sprawled neighbourhoods on neighbourhood satisfaction. Urban Stud. 2018, 55, 2408–2430. [Google Scholar] [CrossRef]
- Mouratidis, K. Compact city, urban sprawl, and subjective well-being. Cities 2019, 92, 261–272. [Google Scholar] [CrossRef]
- Habibi, S.; Zebardast, E. Does compact development in midsize cities contribute to quality of life? J. Urban. Int. Res. Placemaking Urban Sustain. 2021, 15, 241–257. [Google Scholar] [CrossRef]
- Teller, J. Regulating urban densification: What factors should be used? Build. Cities 2021, 2, 302–317. [Google Scholar] [CrossRef]
- Hamidi, S.; Sabouri, S.; Ewing, R. Does density aggravate the covid-19 pandemic? early findings and lessons for planners. J. Am. Plan. Assoc. 2020, 86, 495–509. [Google Scholar] [CrossRef]
- Wong, D.W.; Li, Y. Spreading of covid-19: Density matters. PLoS ONE 2020, 15, e0242398. [Google Scholar] [CrossRef] [PubMed]
- Alam, M.Z. Is population density a risk factor for communicable diseases like covid19? A case of bangladesh. Asia Pac. J. Public Health 2021, 33, 949–950. [Google Scholar] [CrossRef]
- Martins-Filho, P.R. Relationship between population density and covid-19 incidence and mortality estimates: A county-level analysis. J. Infect. Public Health 2021, 14, 1087. [Google Scholar] [CrossRef]
- Khavarian-Garmsir, A.R.; Sharifi, A.; Moradpour, N. Are high-density districts more vulnerable to the covid-19 pandemic? Sustain. Cities Soc. 2021, 70, 102911. [Google Scholar] [CrossRef]
- Alidadi, M.; Sharifi, A. Effects of the built environment and human factors on the spread of COVID-19: A systematic literature review. Sci. Total Environ. 2022, 850, 158056. [Google Scholar] [CrossRef]
- Fan, C.; Jiang, Y.; Mostafavi, A. Emergent social cohesion for coping with community disruptions in disasters. J. R. Soc. Interface 2020, 17, 20190778. [Google Scholar]
- Azhdari, A.; Soltani, A.; Alidadi, M. Urban morphology and landscape structure effect on land surface temperature: Evidence from Shiraz, a semi-arid city. Sustain. Cities Soc. 2018, 41, 853–864. [Google Scholar] [CrossRef]
- Heidari, M.; Sayfouri, N.; Miresmaeeli, S.S.; Nasiri, A. Analysis of the man-made causes of shiraz flash flood: Iran, 2019. Prehospital Disaster Med. 2020, 35, 588–591. [Google Scholar] [CrossRef]
- Soltani, A.; Javadpoor, M.; Shams, F.; Mehdizadeh, M. Street network morphology and active mobility to school: Applying space syntax methodology in Shiraz, Iran. J. Transp. Health 2022, 27, 101493. [Google Scholar] [CrossRef]
- Cathles, L.M.; Brown, L.; Taam, M.; Hunter, A. A commentary on “The greenhouse-gas footprint of natural gas in shale formations” by RW Howarth, R. Santoro, and Anthony Ingraffea. Clim. Chang. 2012, 113, 525–535. [Google Scholar] [CrossRef]
- Copeland, S.; Comes, T.; Bach, S.; Nagenborg, M.; Schulte, Y.; Doorn, N. Measuring social resilience: Trade-offs, challenges and opportunities for indicator models in transforming societies. Int. J. Disaster Risk Reduct. 2020, 51, 101799. [Google Scholar] [CrossRef]
- Preston, V.; Shields, J.; Akbar, M. Migration and resilience in urban canada: Why social resilience, Why now? J. Int. Migr. Integr. 2022, 23, 1421–1441. [Google Scholar] [CrossRef]
- Hudec, O.; Reggiani, A.; Šiserová, M. Resilience capacity and vulnerability: A joint analysis with reference to Slovak urban districts. Cities 2018, 73, 24–35. [Google Scholar] [CrossRef]
- Elmqvist, T.; Folke, C.; Nyström, M.; Peterson, G.; Bengtsson, J.; Walker, B.; Norberg, J. Response diversity, ecosystem change, and resilience. Front. Ecol. Environ. 2003, 1, 488–494. [Google Scholar] [CrossRef]
- Soltani, A.; Sharifi, E. Daily variation of urban heat island effect and its correlations to urban greenery: A case study of Adelaide. Front. Archit. Res. 2017, 6, 529–538. [Google Scholar] [CrossRef]
- Abdrabo, M.A.; Hassaan, M.A. An integrated framework for urban resilience to climate change–Case study: Sea level rise impacts on the Nile Delta coastal urban areas. Urban Clim. 2015, 14, 554–565. [Google Scholar] [CrossRef]
- Ryazanova, O.; Timin, A. Assessment of the state, threats and risks of the economic security system of motor transport enterprises of the Kirov region. Transp. Res. Procedia 2022, 63, 1121–1130. [Google Scholar] [CrossRef]
- Narieswari, L.; Sitorus, S.R.P.; Hardjomidjojo, H.; Putri, E.I.K. Multi-dimensions urban resilience index for sustainable city. In IOP Conference Series: Earth and Environmental Science; IOP Publishing: Philadelphia, PA, USA, 2019; Volume 399, p. 012020. [Google Scholar]
- Milman, A.; Short, A. Incorporating resilience into sustainability indicators: An example for the urban water sector. Glob. Environ. Chang. 2008, 18, 758–767. [Google Scholar] [CrossRef]
- Hamideh, S.; Peacock, W.G.; Van Zandt, S. Housing type matters for pace of recovery: Evidence from Hurricane Ike. Int. J. Disaster Risk Reduct. 2021, 57, 102149. [Google Scholar] [CrossRef]
- Ramadhana, M.R. A dataset for emotional reactions and family resilience during COVID-19 isolation period among Indonesian families. Data Brief 2020, 31, 105946. [Google Scholar] [CrossRef] [PubMed]
- Berkes, F.; Colding, J.; Folke, C. (Eds.) Navigating Social-Ecological Systems: Building Resilience for Complexity and Change; Cambridge University Press: Cambridge, UK, 2008. [Google Scholar]
- Ernstson, H.; Van der Leeuw, S.E.; Redman, C.L.; Meffert, D.J.; Davis, G.; Alfsen, C.; Elmqvist, T. Urban transitions: On urban resilience and human-dominated ecosystems. Ambio 2010, 39, 531–545. [Google Scholar] [CrossRef]
- Meerow, S.; Stults, M. Comparing conceptualizations of urban climate resilience in theory and practice. Sustainability 2016, 8, 701. [Google Scholar] [CrossRef]
- Cutter, S.L. The landscape of disaster resilience indicators in the USA. Nat. Hazards 2016, 80, 741–758. [Google Scholar] [CrossRef]
- Teller, J. Urban density and covid-19: Towards an adaptive approach. Build. Cities 2021, 2, 150–165. [Google Scholar] [CrossRef]
- Azhdari, A.; Sasani, M.A.; Soltani, A. Exploring the relationship between spatial driving forces of urban expansion and socioeconomic segregation: The case of Shiraz. Habitat Int. 2018, 81, 33–44. [Google Scholar] [CrossRef]
- Ghanbari, R.; Heidarimozaffar, M.; Soltani, A.; Arefi, H. Land surface temperature analysis in densely populated zones from the perspective of spectral indices and urban morphology. Int. J. Environ. Sci. Technol. 2023, 1–20. [Google Scholar] [CrossRef]


| Indicator | Sample Reference | Definition | Unit of Measurement | Relevance to Resilience Principles | Source of Data | Variable Name | Potential Effect |
|---|---|---|---|---|---|---|---|
| Ecological | |||||||
| Green space coverage | Zhang et al., 2020 [25] | The total area of green spaces | Percent | Reduces vulnerability to risks such as flooding and heat | Shiraz Municipality database | V1 | + |
| Green space accessibility | Elmqvist et al., 2003 [59], De La Barrera, 2016 [59] | The distance to the nearest green space | Meter | Better access contributes to inclusivity and flexibility principles | GIS calculation | V2 | - |
| Surface temperature | Soltani and Sharifi, 2017 [60] | the temperature of the air near the surface of the earth | Degree Celsius | Cooling islands improve climatic comfort for hot cities | Landsat 7 ETM+, USGS.gov | V3 | + |
| The share of open spaces | Abdrabo and Hassaan, 2015 [61] | The total area of open spaces | Percent | More open spaces increase modularity and flexibility during a crisis | Shiraz Municipality database | V4 | - |
| The share of paved roads | Ryazanova and Timin, 2022 [62] | The proportion of road network with a paved surface | Percent | A higher rate of asphalt increases the risk of threats such as heat and flooding | Shiraz Municipality database | V5 | - |
| Car ownership | Narieswari et al., 2019 [63] | The share of households with at least one car | Percent | A higher rate of the car contributes to a higher level of carbon in the city | Shiraz Municipality database | V6 | + |
| Access to healthy water | Zhang et al., 2020 [25] | The share of households with healthy water connections at home | Percent | Access to healthy water increases adaptive capacity and inclusivity | Shiraz Municipality database | V7 | + |
| Natural gas as the source of energy | Joerin et al., 2014 [23] | The share of households with a natural gas connection at home | Percent | Natural gas has a lower level of emission than fossil fuel resources | Shiraz Municipality database | V8 | + |
| Social | |||||||
| Illiteracy level | Milman et al., 2020 [64] | The share of people with no literacy | Percent | Access to basic education is an indicator of education equity | SCI, 2017 | V9 | _ |
| Population with a university degree | Copeland et al., 2020 [56] | The share of people with at least one academic degree | Percent | Higher education increases adaptive capacity | SCI, 2017 | V10 | + |
| Computer ownership | Chenhong and Guofang, 2022 [65] | The share of households with access to a computer | Percent | Access to the internet and computers enhances the awareness of residents to threats | SCI, 2017 | V11 | + |
| Multi-family home | Hamideh et al., 2021 [66] | The share of units with more than one household | Percent | Increases the risk, especially during a crisis such as a pandemic | SCI, 2017 | V12 | - |
| Single-parent family | Ramadhana, 2020 [67] | The share of lone parents with at least one child | Percent | Families with one parent have higher pressure and are more vulnerable mentally and financially | SCI, 2017 | V13 | - |
| Immigrant population | Narieswari et al., 2019 [63], Preston et al., 2022 [57] | The share of immigrant households (within the last ten years) | Percent | In the absence of institutional capacities, migrants have the problem of integrating into society and are, thus, vulnerable | SCI, 2017 | V14 | - |
| Single people older than 65 | Zhang et al., 2020 [25] | The share of lone adults aged over 50 | Percent | Single and older people need support from the government if there is no family, which increases the level of vulnerability | SCI, 2017 | V15 | - |
| Vulnerable population (<10 and 65<) | Berkes et al., 2003 [68] | The share of people aged over 65 or less than 10 | Percent | Old and very young people need special support as they are more vulnerable, specifically during a crisis | SCI, 2017 | V16 | - |
| Economic | |||||||
| Unemployment rate | Zhang et al., 2020 [25], Hudec et al., 2018 [58] | The share of people in the labor force who are unemployed | Percent | The unemployment rate is an indicator of the economic vulnerability of a zone | SCI, 2017 | V17 | - |
| Tenant households | Milman et al., 2020 [64] | The share of households where no member of the family owns their dwelling | Percent | The real estate economy in Iran is highly prone to macroeconomic conditions; renters are more vulnerable than tenants | SCI, 2017 | V18 | - |
| Low-income groups | Berkes et al., 2003 [68] | The share of households with low income (less than 50 million rials per month) | Percent | Low-income groups have a lower level of savings and, during a crisis, are more vulnerable than other social groups | SCI, 2017 | V19 | - |
| Creative class | Ernstson et al., 2010 [69] | The share of working people in science, health and engineering, and arts | Percent | This group of workers has more resilience during a crisis (e.g., during COVID-19, they were able to work remotely and were less vulnerable) | SCI, 2017 | V20 | + |
| Unskilled workers | Abdrabo and Hassaan, 2015 [61] | The share of workers with no professional certificate | Percent | Unskilled workers usually have lower economic security and higher vulnerability | SCI, 2017 | V21 | - |
| Working in another city | Abdrabo and Hassaan, 2015 [61] | The share of workers working in cities other than Shiraz | Percent | People working in other cities are usually more vulnerable as they can’t find good conditions in Shiraz | SCI, 2017 | V22 | - |
| Physical | |||||||
| Utility availability | Milman et al., 2020 [64] | The share of households with electricity connection at home | Percent | Increases the preparedness for any kind of threat, including flooding and fire | SCI, 2017 | V23 | + |
| Sanitary spaces in the home | Joerin et al., 2014 [23] | The share of households with sanitary spaces such as kitchen and bathroom in the home | Percent | Enhances the health of residents and accordingly lowers vulnerability | SCI, 2017 | V24 | + |
| Home area less than 50 | Hamideh et al., 2021 [65] | The share of dwellings with an area of less than 50 square meters | Percent | Overcrowding increases the vulnerability to risks such as pandemics | SCI, 2017 | V25 | - |
| Building structure strength | Chenhong and Guofang, 2022 [26] | The share of buildings with concrete or steel structure | Percent | The strength of buildings is associated with higher robustness | SCI, 2017 | V26 | + |
| Accessibility to security services | Abdrabo and Hassaan, 2015 [61] | The distance to the nearest security services | Meter | Increases the preparedness in neighborhoods | GIS calculation | V27 | + |
| Accessibility to safety services | Abdrabo and Hassaan, 2015 [61] | The distance to the nearest safety services | Meter | Reduces the time for response and short-term reactions | GIS calculation | V28 | + |
| Accessibility to medical services | Narieswari et al. 2019 [63] | The distance to the nearest medical services | Meter | Increases preparedness and adaptation to threats during a crisis | GIS calculation | V29 | + |
| Proximity to hazardous locations such as gas stations | Abdrabo and Hassaan, 2015 [61] | The distance to the nearest hazardous site | Meter | Proximity to hazardous sites such as gas stations or other chemical sources increases the vulnerability of neighborhoods | GIS calculation | V30 | - |
| Density Types | Min | Max | Mean | SD |
|---|---|---|---|---|
| Population density | 0.03 | 116 | 0.94 | 18.81 |
| BAR | 0.15 | 5.57 | 0.92 | 0.36 |
| Residential density | 0.02 | 0.82 | 0.43 | 0.18 |
| Parcel density | 0.98 | 304.16 | 101.36 | 58.02 |
| Population | BAR | Residential | Parcel | |
|---|---|---|---|---|
| Population | 1 | - | - | - |
| BAR | −0.08 | 1 | - | - |
| Residential | 0.74 | −0.07 | 1 | - |
| Parcel | 0.74 | 0.32 | 0.7 | 1 |
| Density | Ecological | V1 | V2 | V3 | V4 | V5 | V6 | V7 | V8 | |
|---|---|---|---|---|---|---|---|---|---|---|
| Population | Coeff. | 0.34 *** | −0.32 *** | −0.24 *** | −0.60 *** | −0.35 *** | 0.15 ** | −0.47 *** | 0.16 ** | 0.15 ** |
| p-value | 0.00 | 0.00 | 0.00 | 0.00 | 0.00 | 0.01 | 0.00 | 0.01 | 0.01 | |
| Built-up Density | Coeff. | −0.09 * | 0.11 * | 0.09 * | −0.22 *** | −0.06 | 0.03 | 0.40 *** | 0.02 | 0.26 *** |
| p-value | 0.06 | 0.07 | 0.06 | 0.00 | 0.12 | 0.17 | 0.00 | 0.18 | 0.00 | |
| Residential | Coeff. | 0.04 | −0.48 *** | −0.32 *** | −0.62 *** | −0.36 *** | 0.40 *** | −0.17 ** | 0.04 | 0.23 *** |
| p-value | 0.34 | 0.00 | 0.00 | 0.00 | 0.00 | 0.00 | 0.01 | 0.20 | 0.00 | |
| Parcel | Coeff. | 0.19 ** | −0.41 *** | −0.14 ** | −0.60 *** | −0.24 *** | 0.22 *** | −0.29 *** | 0.15 ** | 0.21 *** |
| p-value | 0.01 | 0.00 | 0.01 | 0.00 | 0.00 | 0.00 | 0.00 | 0.01 | 0.00 | |
| Density | Social | V9 | V10 | V11 | V12 | V13 | V14 | V15 | V16 | |
| Population | Coeff. | −0.48 *** | 0.49 *** | −0.27 *** | −0.32 *** | 0.50 *** | 0.49 *** | 0.36 *** | 0.12 * | 0.24 *** |
| p-value | 0.00 | 0.00 | 0.00 | 0.00 | 0.00 | 0.00 | 0.00 | 0.06 | 0.00 | |
| Built-up Density | Coeff. | 0.44 *** | −0.40 *** | 0.31 *** | 0.39 *** | −0.37 *** | −0.13 ** | 0.04 | −0.04 | −0.31 *** |
| p-value | 0.00 | 0.00 | 0.00 | 0.00 | 0.00 | 0.02 | 0.20 | 0.20 | 0.00 | |
| Residential | Coeff. | −0.23 *** | 0.19 ** | −0.03 | −0.02 | 0.29 *** | 0.49 *** | −0.30 *** | 0.26 *** | 0.05 |
| p-value | 0.00 | 0.01 | 0.27 | 0.32 | 0.00 | 0.00 | 0.00 | 0.00 | 0.38 | |
| Parcel | Coeff. | −0.27 *** | 0.26 *** | −0.23 *** | −0.22 *** | 0.24 *** | 0.24 *** | −0.17 ** | −0.05 | 0.15 ** |
| p-value | 0.00 | 0.00 | 0.00 | 0.00 | 0.00 | 0.00 | 0.01 | 0.38 | 0.03 | |
| Density | Economic | V17 | V18 | V19 | V20 | V21 | V22 | - | - | |
| Population | Coeff. | −0.27 *** | 0.04 | 0.12 * | 0.30 *** | −0.28 *** | 0.28 *** | −0.24 *** | - | - |
| p-value | 0.00 | 0.34 | 0.06 | 0.00 | 0.00 | 0.00 | 0.00 | |||
| Built-up Density | Coeff. | 0.31 *** | 0.12 * | −0.08 | −0.25 *** | 0.32 *** | −0.34 *** | 0.06 | - | - |
| p-value | 0.00 | 0.06 | 0.41 | 0.00 | 0.00 | 0.00 | 0.34 | |||
| Residential | Coeff. | −0.01 | 0.14 ** | 0.02 | 0.13 ** | −0.06 * | −0.02 | −0.27 *** | - | - |
| p-value | 0.58 | 0.03 | 0.40 | 0.04 | 0.08 | 0.47 | 0.00 | |||
| Parcel | Coeff. | −0.17 ** | −0.06 | 0.23 *** | 0.28 *** | −0.16 ** | 0.17 ** | −0.19 ** | ||
| p-value | 0.02 | 0.34 | 0.00 | 0.00 | 0.02 | 0.02 | 0.01 | |||
| Density | Physical | V23 | V24 | V25 | V26 | V27 | V28 | V29 | V30 | |
| Population | Coeff. | −0.48 *** | −0.06 | −0.41 *** | 0.30 *** | −0.26 *** | −0.22 *** | −0.26 *** | −0.28 *** | −0.25 *** |
| p-value | 0.00 | 0.38 | 0.00 | 0.00 | 0.00 | 0.00 | 0.00 | 0.00 | 0.00 | |
| Built-up Density | Coeff. | 0.37 *** | 0.38 *** | 0.38 *** | −0.18 ** | 0.35 *** | −0.05 | −0.01 | 0.03 | 0.06 |
| p-value | 0.00 | 0.00 | 0.00 | 0.01 | 0.00 | 0.38 | 0.51 | 0.27 | 0.38 | |
| Residential | Coeff. | −0.31 *** | 0.14 ** | −0.25 *** | 0.03 | −0.05 | −0.34 *** | −0.39 *** | −0.32 *** | −0.29 *** |
| p-value | 0.00 | 0.03 | 0.00 | 0.27 | 0.38 | 0.00 | 0.00 | 0.00 | 0.00 | |
| Parcel | Coeff. | −0.28 *** | 0.01 | −0.16 ** | 0.32 *** | −0.08 | −0.12 ** | −0.20 ** | −0.16 ** | −0.15 * |
| p-value | 0.00 | 0.19 | 0.03 | 0.00 | 0.41 | 0.03 | 0.01 | 0.03 | 0.03 | |
Disclaimer/Publisher’s Note: The statements, opinions and data contained in all publications are solely those of the individual author(s) and contributor(s) and not of MDPI and/or the editor(s). MDPI and/or the editor(s) disclaim responsibility for any injury to people or property resulting from any ideas, methods, instructions or products referred to in the content. |
© 2023 by the authors. Licensee MDPI, Basel, Switzerland. This article is an open access article distributed under the terms and conditions of the Creative Commons Attribution (CC BY) license (https://creativecommons.org/licenses/by/4.0/).
Share and Cite
Dehghani, A.; Alidadi, M.; Soltani, A. Density and Urban Resilience, Cross-Section Analysis in an Iranian Metropolis Context. Urban Sci. 2023, 7, 23. https://doi.org/10.3390/urbansci7010023
Dehghani A, Alidadi M, Soltani A. Density and Urban Resilience, Cross-Section Analysis in an Iranian Metropolis Context. Urban Science. 2023; 7(1):23. https://doi.org/10.3390/urbansci7010023
Chicago/Turabian StyleDehghani, Alireza, Mehdi Alidadi, and Ali Soltani. 2023. "Density and Urban Resilience, Cross-Section Analysis in an Iranian Metropolis Context" Urban Science 7, no. 1: 23. https://doi.org/10.3390/urbansci7010023
APA StyleDehghani, A., Alidadi, M., & Soltani, A. (2023). Density and Urban Resilience, Cross-Section Analysis in an Iranian Metropolis Context. Urban Science, 7(1), 23. https://doi.org/10.3390/urbansci7010023