Abstract
While there is a large body of research on sustainable development and urban resilience, the interaction between urban densification and urban resilience remains understudied. This study aims to investigate several facets of urban resilience and densification before analyzing their mutual relationship. Focusing on ecological, social, economic, and physical elements of urban resilience on the one hand and population density, residential density, built-up area ratio (BAR), and parcel density on the other, a combination of spatial and quantitative methodologies is applied. Our empirical investigation revealed that the spatial distribution of all resilience indicators is varied. In other words, the cumulative form of urban resilience indicators has a different significance than the individual version. Similarly, different types of density have varying orientations and degrees of connection with measures of resilience that should be evaluated in empirical investigations. In addition, our research revealed that density has a stronger relationship with social and physical resilience than with ecological and economic resilience. The findings drawn from this research have the potential to inform the design of secure, resilient cities across a range of spatial dimensions.
1. Introduction
Cities are growth engines and leading game changers to pursuit social and environmental sustainability [1]. However, the high pace of urbanization and unpredictable threats such as COVID-19 have made cities more vulnerable [2]. Urban planning and research are concerned with twofold paradigms of sustainability and resilience, to sustain robust solutions to mitigate or prevent adverse effects of disasters [3]. The interactions between these two paradigms, sustainability and resilience, have been the subject of several research papers [4]. After COVID-19, both sustainability and resiliency of urbanization have been criticized, as cities were the hotspots of the pandemic [5,6]. While these two areas have been theoretically and conceptually investigated in the literature, the alignment between them has not deliberately been investigated [7].
This paper considers the compact city model the optimal physical form for sustainable development due to its contribution to reducing energy consumption and environmental pollution [8]. This limited perspective, however, disregards the significance of the social, political, economic, and environmental context in attaining urban sustainability [9]. The main argument in the literature is whether a sustainable city is necessarily resilient. Following this question, we must explain what sustainability and urban resilience mean. Despite some criticisms, densifying neighborhoods is a land-use planning tool to enhance sustainability [10]. While super-densification may cause unsustainable development [11,12], density in Shiraz is still not a critical problematic issue as far as it is complemented by infrastructures and facilities [13]. Therefore, densification has been considered a solution to enhance sustainability in Shiraz over the last decades. On the other hand, urban resilience, as a feature of the system, is differentiated by the targeted threat. In other words, a city might be resilient to flooding but not earthquakes. Moreover, urban resilience is a broad concept increasingly used in planning research and practice to persist, adapt, or transform urban functions [14]. To make a comparable indicator while considering local factors, a general urban resilience indicator is helpful to replicate in other contexts. This research is trying to construct an urban resilience indicator and explore its interlinkages with density. This research aims to analyze the potential correlation between the densification of urbanized Shiraz and general urban resilience indicators in this city. The main question of this research is: To what extent are densified areas socially, economically, physically, and environmentally resilient? Our hypothetical answer to this question is that while densification might align with some aspects of urban resilience (physical and social), it is in conflict with some other aspects (economic and environmental). A mix of spatial and quantitative methods is employed to test the research hypothesis.
2. Literature Review
Resilience is a response to disturbances to climate change uncertainties and socio-economic insecurities [15]. In other words, resilience is the ability of a system to respond to internal and external disturbances [16]. Three perceptions or perspectives of resilience evolved in practice and research: engineering, ecological [17], and evolutionary [15]. Accordingly, resilience means getting back to the previous state (engineering), adapting to the disturbance (ecological), or reaching a new equilibrium (evolutionary) [18]. Therefore, the nature of the response to these disturbances would be persistence, adaptation, and transformation, respectively [19]. The last response is more favorable in urban planning as it bounces forward to a new situation [20]. Accordingly, urban resilience has been used as a concept, policy, planning framework, and system characteristic [2,19]. There has been an argument that urban resilience research should clarify the resilience of who to what change [21]. Sharifi (2016) [22] also discussed that the question of resilience to what should be answered a priori when the resilience of a city or neighborhood is analyzed. However, Joerin et al. (2014) [23], Sua´rez et al. (2016) [24], and Zhang et al. (2020) [25] have argued that while the resilience of who and to what is essential, generally, we can analyze the level of resiliency in different scales.
There is a rich literature regarding urban resilience measurements and indicators. While urban resilience assessment and analysis might not provide normative information about the community, it is critical in enabling policy-making systems to lead their policies in the direction of disaster risk reduction [22]. Su´arez et al. (2016) [24] constructed an urban resilience assessment tool from a socio-ecological perspective. They developed an urban resilience index and applied it to 50 Spanish cities. Zhang et al. (2020) [25] adapted this urban resilience index, extracted 24 indicators from six main themes, and weighted them based on their importance. They also applied their model to three cities in China, longitudinally and cross-sectionally. Joerin et al. (2014) [23] also constructed a climate disaster resilience index with 25 parameters and 125 variables in five dimensions (economic, institutional, natural, physical, and social). They applied their assessment tool to 10 administrative zones in Chennai, India.
In this research, a general resilience assessment tool will be constructed and applied in the case of Shiraz. To build a general resilience indicator, we have reviewed the literature and tried to consider the variables based on different criteria. Firstly, several indicators used in the literature have the same basis, and we tried to combine them. Secondly, some studies such as Zhang et al. (2020) [25], Joerin et al. (2014) [23], and Su´arez et al. (2016) [24] have already developed general resilience indicators based on the previous literature, data availability, measurability, and other factors. Third, data availability was a major limitation in our case to focus on a general index instead of a specific threat. Finally, we have checked the reliability and relevance of variables to urban resilience perspectives (adaptation, persistence, and transformation), principles (redundancy, stability, diversity, flexibility, efficiency, modularity, adaptive capacity, inclusivity, efficiency, robustness, integration, and iteration), and risk reduction or preparedness [25,26,27] (. While urban resilience focuses on the specific categorization of urban resilience performances (persistence, adaptation, and transformation), both bouncing “back” and “forward” is considered in urban resilience research and practice [28]. It means scholars and practitioners do not thoroughly distinguish their research and practice from urban resilience perspectives. Accordingly, the constructed model aligns with both the adaptation and transformation performances of urban resilience. While theoretically our model included tens of indicators from different themes, our final index was limited to a fewer number of social, economic, physical, and environmental indicators.
Compact urban development is a policy agenda including a broad range of objectives to reach sustainability [29]. This policy was initially characterized by product-related features (densification and mixed land use) and process-related features (intensification). Densifying housing, population, and jobs, horizontally and vertically mixing services and facilities, and intensifying the use of the land and activities were the tools for pursuing more sustainable development [30,31]. There has been an intensive argument to find how and to what extent a compact city contributes to more sustainability. The literature has shown that compactness, specifically densification, has some outcomes that align with sustainability goals. This will happen by intensifying development and activities, controlling urban growth, enhancing social diversity, mixing land uses, and increasing public transport efficiency [11,32]. However, compact development’s negative and positive outcomes are highly context-dependent. For example, while living satisfaction in high-density neighborhoods in one specific city seems optimistic, in another city, this perception might be negative [33,34,35]. Furthermore, problems listed as adverse effects of compact urban development may arise from other factors rather than the compactness itself [29], such as congestion of industries around the cities [36] and the topography of the cities [37]. Overall, the compactness of urban development may not only bring benefits. Instead, the outcomes of this policy can be assessed as the trade-off between social, economic, and environmental sustainability that is highly context-dependent [35]. It also depends on the density measure type and the analysis’s spatial unit [38].
Beyond these arguments, this research will focus on one aspect of compact development: densification. There are contradicting arguments regarding densification’s positive and negative effects in urban areas. While super-density and congestion of jobs in specific areas of the city may increase the vulnerability, there is no robust evidence to justify the interlinks between density and the listed problems [29]. The outcome of densification may change based on the context and scale [35]. A densified neighborhood might have a lower quality of life for residents, but carbon emission mitigation favors regional and national stakeholders. A rich literature has developed to analyze the effect of density on different aspects of urban life and function. These studies have investigated the effect of density on areas such as social sustainability and social segregation [30,35], resources consumption [36], community well-being [39], and health-related issues [34,40,41,42]. Du et al. (2017) [33] Showed more satisfaction in high-density than low-density neighborhoods in Chicago, but different results are reported by Habibi and Zebardast (2021) [43] in the Iranian context. Additionally, density has been studied in relation to COVID-19 spread, hospitality, and mortality in urban areas [44,45,46,47,48,49]. But the effect of density on COVID-19 spread is not necessarily positive, and contrasting results are provided in the literature [50]. Based on the empirical and review papers discussed earlier, we have found four main density types applicable to our case study. The details of these factors are provided in the methodology section.
To build an assessment index system for safe, resilient cities, 30 quantitative indicators were chosen from the following four categories: ecology, society, economy, and the physical environment. The selection of indices is based on the current research, including Fan’s (2020) [51] safety–resilience triangle, but confined to data availability (Figure 1).
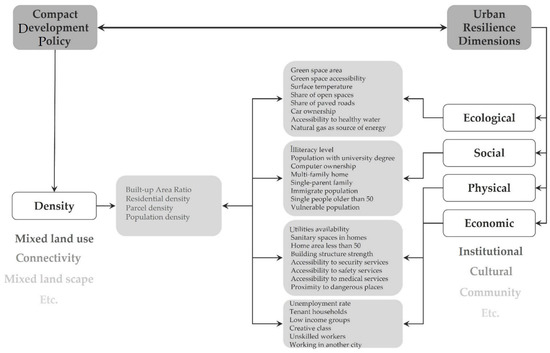
Figure 1.
Conceptual model for evaluating a resilient city.
3. Research Design
Urban resilience is a multi-criteria and multidisciplinary phenomenon whose indicators change based on the targeted threat. However, as this concept is inclusive and divergent in principles, in this research, urban resilience will be investigated in four main areas (ecological, social, economic, and physical) and the indicators will be discussed based on the qualities of a resilient city (robust, redundant, flexible, resourceful, reflective, inclusive, and integrated). On the other hand, density as a component of compact city development includes four main indicators. Data availability is a critical issue in choosing both urban resilience and density. For example, institutional or governance is one of the important areas of urban resilience, but due to a lack of data is not included. This study is constructed in three main parts. Initially, urban resilience is analyzed by 30 selected indicators (mainly based on data availability). Then, the city’s compactness of development is explained by four density indicators. In the final stage, the associations between density and urban resilience indicators are deliberately analyzed and discussed in the case of Shiraz.
4. Case Study
Shiraz is the most populated city in southern region Iran (Figure 2). This city is bounded by mountains to the east and west and Maharloo Lake to the south. The city varies by topography from 1488 to 1700 m above sea level. The city has a semi-arid climate with cold winters and hot summers [52]. Flooding, droughts, and earthquakes, stimulated by human interventions, have threatened the city in the last decades [53]. On the other hand, rapid urbanization has changed the natural landscape and mitigated citizens’ quality of life. The city’s population sextupled in the last five decades and reached more than 1.56 million in 2016. This population is settled in 240 square kilometers. Socially, the city is multicultural and has been one of the main destinations of migrants from surrounding areas and other southern provinces [54]. The economic sector base of this city’s services includes tourism, goods distribution, and administrative and recreational activities. Physically, as mentioned, the city is surrounded by natural elements, and few corridors have the potential for development. Due to scarcity of land, densification of development and leapfrog development have been the scenarios for urbanization. Both of these policies have been followed by the city’s management system. However, increasingly densified areas have gained more currency in long- and short-term plans. Additionally, land supply by the government to increase housing affordability in the outer zones occupied by high-rise buildings contributed to higher urban consolidation. In some areas, the built-up area ratio (BAR) grew by more than 130% in the last decade, showing how newly developed areas have consolidated.
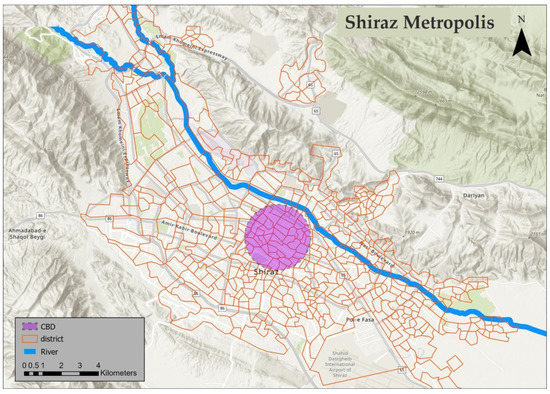
Figure 2.
Case study area, Shiraz metropolis.
5. Material and Methods
5.1. Data Acquisition
Different data types have been used to analyze the correlation between urban resilience indicators and densification. Social and economic data were acquired from the Statistical Center of Iran (SCI) from the 2016 census. The data acquired from SCI were on administrative districts. These types of data were joined with the GIS layer of administrative districts to make location-based variables. We have utilized ENVI 4.8 to conduct geometric and radiometric correction of images extracted from Landsat 7 images we obtained from the United State Geological Survey (USGS) website (October 2017). To classify them, we used the maximum likelihood method. Then the classified land cover was combined with the area of residential houses from SCI to calculate BAR (more detail in Section 5.3). All calculations were done on the lowest scale (for which the data is available), covering 495 administrative districts.
5.2. Resilience Indicators
As discussed in the literature review, different assessment tools have been developed to evaluate urban resilience. For example, Zhang et al. (2020) [25] used 24 indicators and categorized and weighted them into six areas: society, economy, community, infrastructure, ecological environment, and institutions. Sua´rez et al. (2016) [24] and Joerin et al. (2014) [23] also provided the same indicators in different contexts. On the other hand, as urban resilience indicators are context-dependent, data availability is a significant barrier to assessing urban resilience [26]. Based on the measurability of factors, availability of data, and relevance to different aspects of urban resilience such as preparedness, risk reduction, adaptation, and resilience principles, we have collected these 30 indicators (as shown in Table 1). Various sources from the context and the literature construct these indicators. The relevance of these indicators to urban resilience principles, preparedness, and risk and vulnerability reduction is assessed in the last stage of the selection process [55,56,57,58].

Table 1.
Urban resilience indicators and their measures.
This research is based on a cross-sectional analysis to understand how indicators are differentiated based on the characteristics of zones. Because the measurement units of indicators are not the same, we need to normalize or standardize them and combine them into four main categories of ecological, social, economic, and physical resilience. The standardization method is based on the following formula:
where xi is the real value of indicator j; and , xmax, and xmin are the average value, maximum and minimum observation of indicator j, respectively. This conversion system makes the value of all indicators comparable to a system with the same unit. The sum of values in each row for each factor (for example, ecological) would be the value of that zone in ecological, social, economic, and physical resilience. Also, as this research compares urban resilience indicators and their distribution throughout the space, we have applied a clustering analysis to detect the hot spots of the high and low values of urban resilience indicators in each dimension. The concentration and distribution of urban resilience in each dimension are analyzed by the spatial autocorrelation method of Moran’s I (Local Indicators of Spatial Autocorrelation [LISA]). The function of this model is shown below:
where xi is the value of zone I and n is the total number of zones, is the average value of x in all zones and wij is the spatial weight of the relationship between I and j zones. The local Moran’s I output has five categories: (1). Not significant (these areas have no statistically significant pattern), (2). High-high (zones with a high value are surrounded by zones with a high value), (3). High-low (zones with a high value are surrounded by zones with a low value), (4). Low-high (zones with a low value are surrounded by zones with a high value), and (5). Low-low (zones with a low value are surrounded by zones with a low value).
5.3. Densification Measurement
Densification can be measured by different methods based on the availability of data and the research goals [52]. We have used four main types of density for which the available data sources could be measured: population density, built-up area ratio (BAR), residential density, and parcel density. Population density is calculated by Equation (3):
where Di, pi, and si are density, population, and area of zone i, respectively. On the other hand, we have used the built-up density called BAR (built-up area ratio). This indicator shows the intensity of land used for buildings in a specific zone. It is calculated based on Equation (4):
where BARi is the built-up area ratio in district i, Hi is the built-up area of district i, Mj is the usable area of all floors in district i, which is calculated through land-cover data multiplied by the size of houses in that zone, and m is the number of parcels in zone i. Therefore, where the value of BAR is higher, land-use intensity would be more.
Residential density is based on the areas allocated to residential land use: the total residential uses area in each zone to the total area of the zone.
Parcel density is another form of densification measurement that can be extracted from satellite images. This indicator is the share of each zone allocated to any built-up area regardless of the number of floors and land use.
6. Results
6.1. Cross-Sectional Analysis of Urban Resilience
Based on the relevant literature [23,24,25,26] and, more importantly, the availability of data in the case of Shiraz, 30 urban resilience indicators were calculated in 496 zones in Shiraz. There was a wide variation among urban districts in terms of resilience indicators. More information is reported in the following sections.
6.1.1. Ecological Resilience Indicators
As shown in Table 1, ecological resilience includes eight variables with different units. Variables have various measures and units, as can be seen in Table 1. The share of green space and asphalted open space have the same unit; their standard deviation is between 10.56 and 13.49. Green and open spaces in each zone are positive indicators of ecological resilience, while a higher share of asphalt reduces soil absorption. Specifically, as flooding is the most common natural hazard in Shiraz, this indicator is critical (the mean of this indicator in Shiraz is 24%). Surface temperature is another critical indicator of ecological resilience, as Shiraz is a semi-arid city. This indicator varies between 17.42 to 32.59, with an average of 25 Celsius. Finally, car ownership, the availability of healthy water, and the availability of natural gas are social indicators that have ecological effects. On average, more than half of Shiraz population have cars, 96% of households consume natural gas, and 98.36% have access to healthy water.
From a cross-sectional perspective, as revealed in Figure 3, the ecological resilience value has a heterogeneous pattern. The value of ecological resilience has normalized between 0 and 1 to rank all zones. A cluster analysis, presented in Figure 3, shows that ecological resilience in some parts of the city is concentrated. However, this pattern is not necessarily based on the social north and south of the city. The southern and some north-center zones of the city have the highest ecological resilience. The main reason might be the higher share of green and open spaces in these zones. On the other hand, some cold spots of ecological resilience were detected in the central and northern zones. While the former is a historical zone of the city and has a deficient level of open and green spaces, the latter has mainly a rural–urban landscape.
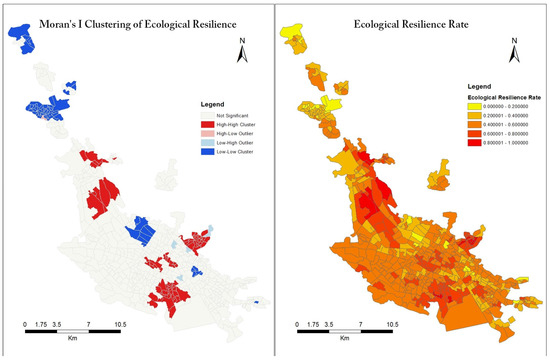
Figure 3.
Ecological urban resilience value distribution in the case of Shiraz.
6.1.2. Social Resilience
Social resilience in this research includes eight indicators based on data availability. Except for the population with university degrees and computers owned by households, other indicators have negative social resilience across zones. The computer ownership indicator reported the highest variation in the indicators, with a standard deviation of 19.44 as the data varied between 15–84%. The distribution of immigrants in the city seems heterogeneous, and zones have between less than 1 to more than 45% of this population. The percentage of illiterate individuals and single-headed families has the same variation among all zones at about 5.4%. Although single families in Iran are not that common it has increased in the last decades. The share of single people older than 50 is an important social resilience issue in the case of Iran. The vulnerable population, considered to be people who need special care, is less than 19% of the population on average. The social resilience indicator varied between −2.78 and 2.01, with a standard deviation of 0.9. This issue emphasizes that social resilience in Shiraz is highly clustered.
Figure 4 shows the city’s spatial distribution and concentration of social resilience indicators. Most of the zones have a value of social resilience between 0.4 and 1. The cluster analysis of the distribute of the social resilience value in Shiraz reveals that the highest level of this indicator is in the northern parts of the city. This pattern is understandable as, from an economic and social perspective, the most affluent people live in these areas [52]. On the other hand, the cold spot of the social resilience value could be seen in the city’s central, south, and southeast zones. As mentioned earlier, the detected cold spot in the center of the city comprises the historical zones with low quality-of-life conditions. These zones experience various vandalism, homelessness, and other social problems. The concentration of challenges in these zones has made urban rehabilitation and revitalization difficult, even though all development plans place a particular focus on these zones.
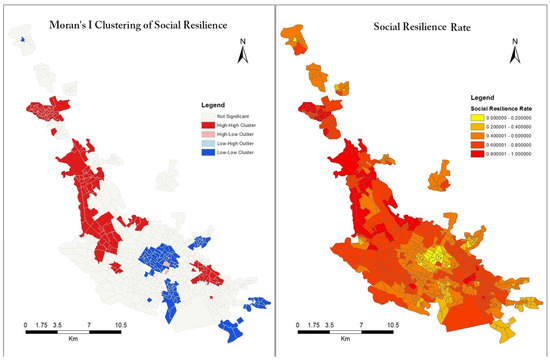
Figure 4.
Social resilience value distribution in the case of Shiraz.
6.1.3. Economic Resilience
The description of indicators for economic resilience is presented in Table 1. As mentioned, due to the lack of relevant data on the micro-scale, just six economic resilience were extracted and measured in the case of Shiraz. While these variables might logically have the same meanings, their spatial distribution is different based on their internal correlation. While renting is not a negative issue, in the Iranian context, tenants have a low level of economic security as the prices change unexpectedly and housing costs will burden families. On average, about 43% of households in Shiraz are tenants. But the distribution of tenant households in all zones is not the same and varies between 10% to 70%. The unemployment rate is another resilience indicator in urban areas. In the case of Shiraz, this indicator is differentiated with a standard deviation of 3.22. The distribution of low-income groups in the city shows a high level of variation with about 23 standard variations. Similarly, the share of unskilled workers in the zones differs from 0.25% to 41%. On average, more than 1% of employees work in another city, with a standard variation of 1.92. In general, economic resilience in all zones varied between −2.09 and 2.47, with less than the standard deviation of 0.89.
As shown in Figure 5, Shiraz economic resilience value distribution is highly clustered. While hot spots of economic resilience are highly concentrated from central to northern areas, cold spots are clustered in the city’s historical zones and southern parts. This result indicates that peripheral areas in the city’s south are economically disadvantaged.
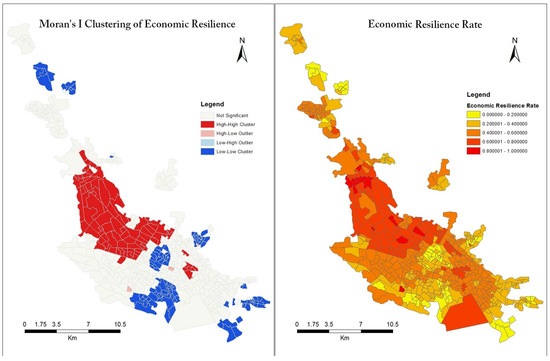
Figure 5.
Economic urban resilience value distribution in the case of Shiraz.
6.1.4. Physical Resilience
Physical resilience in this research includes eight indicators. A home area of less than 50 m2 is considered a negative factor affecting the physical resilience of the city because, in the Iranian context, this threshold is determined by the Ministry of Road and Urban Planning as an unsustainable form of housing. About 13% of entire houses in the city are less than 50 m2 with a high standard deviation. While accessibility to security and safety services is low, at less than 1400 m, the average distance to medical services is as high as 2800 m. The difference between the highest and lowest levels of physical resilience is higher than in other dimensions. However, the standard variation in this dimension is the same as others at 0.86. Worth mentioning is that all indicators are standardized and the total urban resilience in each dimension is also normalized.
The spatial variation of physical resilience in all zones is presented in Figure 6. Based on the selected indicators, there is a clear segregation pattern in the distribution of physical resilience. Northern parts of the city have the highest level of physical resilience. Conversely, the central parts of the city, mainly including historical areas and peripheral areas of southern zones, have the lowest level of physical resilience. The clustering analysis also shows the concentration of more resilient zones in the city’s north. In contrast, the center and south of the city have low physical resilience levels.
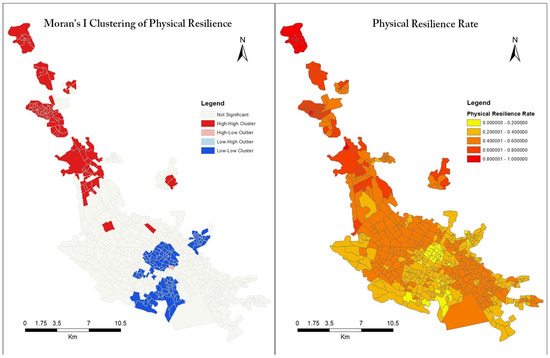
Figure 6.
Physical urban resilience value distribution in the case of Shiraz.
6.2. Cross-Sectional Analysis of Densification
Densification in this research is addressed in four main types discussed in Section 5.3. These types, as shown in Table 2, have highly different forms of calculation and natures. As an evidence, the standard deviation varies between 0.18 at a residential density to more than 58 at a parcel density. While this research aimed to analyze the correlation between densification and urban resilience, density variation shows that a more detailed analysis is needed to understand what we mean by density. For example, population density, one of the most common types of density, has a very high standard deviation, as the difference between maximum and minimum is as high as 116 units. However, this variation is higher in the case of parcel density, as the mean is 101.36 with a standard deviation of more than 58. On the other hand, BAR and residential density have low levels of spatial variation.

Table 2.
Descriptive statistics of densification in all zones of Shiraz (2016).
While it was expected that different forms of densification will have more or less the same representation, the correlation analysis of these variables indicates that they have different meanings. Table 3 shows BAR has a very low and negative correlation with population and residential density. Its correlation with parcel density is not significant at 0.05 significance level but in 0.1 level is significant and considerable (0.3). However, population density is very highly correlated with residential and parcel density. Finally, residential and population density have high correlation with parcel density. This analysis shows that BAR seems to be an independent variable compared to other densification indicators. Population, residential, and parcel density present more or less the same value, although they measure different phenomena.

Table 3.
Correlation between different types of density variables.
Figure 7 shows that the population density in the central areas is higher than in the northern and peripheral zones. The concentration of hot spots is not considerable, but cold spots of population density value could be detected in the north of the city, specifically in the outer rings. Housing density has a similar pattern, as shown in Figure 8. But it is worth mentioning that high housing-density zones are significantly concentrated in the central zones. As one of the most common forms of densification used in previous studies, the built-up area ratio has a very different distribution pattern than other types of densification representation (see Figure 9). While the central and southern parts of the city have a low level of BAR, the hot spots of this variable have been detected in different parts of the city, albeit with a higher concentration in northern areas. Additionally, parcel density, as a novel indicator of density, unlike other variables, has a significant concentration in central zones, specifically the historical districts (Figure 10).
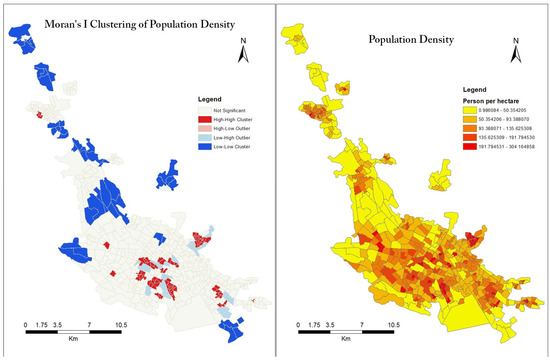
Figure 7.
Population density distribution in the case of Shiraz.
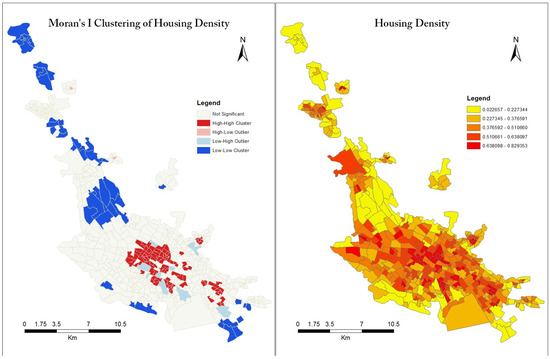
Figure 8.
Housing density distribution in the case of Shiraz.
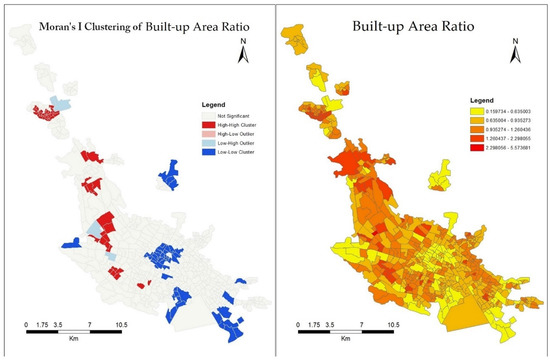
Figure 9.
Built-up area ratio (BAR) distribution in the case of Shiraz.
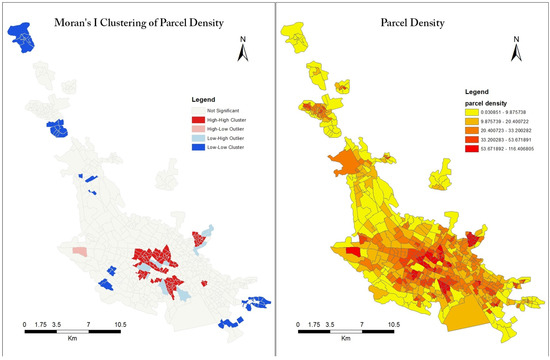
Figure 10.
Parcel density distribution in the case of Shiraz.
6.3. Densification and Urban Resilience Correlation
The correlation between available urban resilience and densification variables is indicated in Table 4. Generally, ecological resilience is considerably correlated with population density, while a lower level correlates with parcel density. BAR and residential density both have less than a 0.1 positive correlation. Regarding individual indicators of ecological resilience, the share of asphalt areas, accessibility to healthy water and natural gas as the main energy source of households positively correlate with all types of density variables. The rest of the indicators have a negative correlation with density variables. Regarding the level of correlation, the most evident interrelated variable is the share of open spaces. As the density increases, the share of open spaces significantly reduces.

Table 4.
Correlation between urban resilience and density variables.
The correlation between social resilience and densification (Table 4) is the opposite of ecological resilience. While the sign of the relationship for BAR is positive, the rest of the density variables negatively affect social resilience. Generally, a low level of social resilience is in the places with the higher population density, while higher BAR is positively associated with higher social resilience. The opposite of this trend can be seen in individual indicators (illiteracy level, more than one family living in a home, single-headed families, and single people older than 50) by relatively significant positive and negative correlations with population density and BAR, respectively. Unlike the single-headed family indicator, residential density has the lowest correlation with social resilience indicators. Generally, our analysis results reveal that the sign social resilience indicators’ correlation with the density variable is not in the same direction.
Economic resilience has a low level of correlation with densification variables. As shown in Table 4, the highest economic resilience correlation coefficient is with BAR and population density by 0.31 and −0.27, respectively. On the other hand, economic resilience has the lowest association with density variables by a correlation coefficient value of −0.01. Moreover, individual indicators of economic resilience have the lowest association with residential density. The highest correlation coefficient is between the distribution of unskilled workers in the city and BAR. From a logical perspective, this issue is hard to understand, but this variable has a lower association with population density. Another interesting issue is the higher correlation between tenant households and parcel density. Specifically, this result is because people who live in low-density areas and small houses are more likely to be tenants in the case of Shiraz. This result comes from the clustering analysis of economic resilience that showed a concentration in central areas with the highest parcel density.
Physical resilience has the highest association with different types of density. This value is differentiated between −0.28 at parcel density to −0.48 at population density. The most evident result of this analysis is the negative correlation between physical resilience and population density. In other words, places with higher population densities have lower physical resilience. Except for number of units smaller than 50 m2, which are more common in apartments in low-density developments, other physical resilience indicators are negatively associated with population density. The same results could be found in residential density that the correlation is negative, even with a low significance level. Worthy of mentioning that availability of utilities and sanitary spaces is highly associated with BAR.
7. Discussion
Urban resilience and sustainable development, as two main urban development paradigms, have gained much currency in planning research and practice [69]. However, due to the complexity of urban dynamics and stakeholders affecting urbanization, all goals are not achievable. Moreover, sustainability and resilience goals might not be thoroughly aligned [11]. Striking a balance between resilience and sustainability is a goal that planners and practitioners are seeking [12]. Densification as a component of compact urban development has been controversial regarding its urban resilience principles. This research scrutinizes different urban resilience and densification aspects to understand the association between these two planning approaches.
Urban resilience analysis, as discussed in Section 2, should be based on the target and the hazard that threatens the community. However, urban development planning needs a comprehensive perspective to reach sustainability. Therefore, focusing on one aspect of urban resilience and emphasizing a specific disturbance might result in the underestimation of other aspects. This is why urban resilience indexes have been developed in the last decade to cover different threats and disruptions. Following Joerin et al. (2014) [23], Sharifi (2016) [22], Sua´rez et al. (2016) [24], and Zhang et al. (2020) [25], we developed an urban resilience framework. Considering data availability, four dimensions of urban resilience, including ecological, social, economic, and physical variables, are covered. Our analysis showed that urban resilience analysis is highly sensitive to the indicators and the available data. In other words, urban resilience should be judged deliberately, not only by a cumulative index. Specifically, Table 4 shows that the spatial distribution of individual indicators might be different from the combination of all variables. Moreover, the result of the clustering analysis of urban resilience in four main dimensions indicated that they are by nature different and cumulatively combining them might be misleading. Moreover, our cross-sectional study revealed that urban resilience variables are spatially heterogeneous and should be considered. The result showed that the concentration of high and low urban resilience in different dimensions differs in our case study. So, the same policy should not be proposed for all aspects of urban resilience and all city areas.
Indicators applied in this research are parallel to the main attributes detected by Cutter (2016) [70] as the most common areas for analyzing urban resilience. The contradiction between different indicators of resilience in various dimensions is an avoidable problem that is also emphasized by Feldmeyer et al., 2019 [4]. For example, paved surfaces are considered open spaces necessary during disasters. Still, these spaces might contribute to a higher surface temperature level, a negative aspect of ecological resilience [21,69]. Another example is that overcrowding (higher number of family members or multifamily households), which has a negative effect during pandemics, increases social solidarity and cohesion [50]. From another perspective, some of the resilience indicators might be problematic if another indicator applies. For example, the immigrant population’s share is not a vulnerability index. Still, immigrants may be socially vulnerable during a crisis if they are not integrated into the community or do not have social interactions.
On the other hand, this research’s densification analysis has scrutinized different variables (see 6). The effect of density on various aspects of urban life and urban resilience has been conducted in the literature. However, as discussed in Section 6.2, densification as an element of compact development policy has different meanings and variables that make a difference in urban dynamics analysis. Our analysis empirically showed that the distribution of densification variables throughout the city is homogeneous and might have a low level of correlation. BAR is entirely different from other forms of density representation. This variable has a different sign of correlation with four dimensions of urban resilience compared to population, residential, and parcel density correlation.
However, previous studies mainly emphasized population density, as this variable is more applicable at higher scales, such as county and state levels. Hamidi et al. (2020) [45] and Wong and Li (2020) [46] employed population density as an influential factor of urban resilience to COVID-19 spread and mortality. Specifically, Wong and Li (2020) [46] found that the congestion of vulnerable populations in urban areas increases mortality and hospitalization. Meanwhile, Teller (2021b) [71] found no consensus on this effect, but cities should implement a densification policy in light of the vulnerability approach to reach more adaptive states.
Compact development policy has been one of the most common forms of development that have gained attention from various perspectives by researchers and practitioners. However, making cities denser is not a win-win policy for all residents and communities’ benefit [72,73]. While the effect of densification on different aspects of urban life and functions has been proved, there is no consensus on the effect of densification on urban resilience principles and factors. However, as Teller (2021a) [4] discussed, the cumulative effects of densification will negatively affect urban resilience. Our analysis showed negative correlations in various aspects of urban resilience, specifically social and physical. This study has not investigated the causality effects of density on urban resilience variables, but a critical issue should be emphasized. Making cities denser is not a sustainable policy; it should complement other aspects of a compact city. For example, densification should not cause low open and green spaces. Moreover, densification through renovation and regeneration processes will cause gentrification and social change of neighborhoods, which is a negative aspect of social resilience.
8. Concluding Remarks and Policy Implications
The aim of this research was twofold: to analyze these densification and urban resilience indicators cross-sectionally and understand how different variables of density and resilience are interrelated. We have made an urban resilience framework in four dimensions (ecological, social, economic, and physical) based on the literature and data availability and employed them in the case of Shiraz. On the other hand, densification as a component of compact city development policy is scrutinized methodologically and practically in the case of Shiraz. In the final stage, the associations between these two areas, urban resilience and densification, are analyzed to understand how different aspects of urban resilience are interconnected with different measures of density in the case of Shiraz. A lack of access to relevant data highly limited this research. However, our applied indicators in the case of Shiraz showed that ecological, social, economic, and physical resilience have different patterns in the case of Shiraz. In other words, while some zones have a high level of ecological resilience, they may have low social resilience. In terms of densification, our findings also showed that this phenomenon should be defined based on the research target. Population, residential, and parcel density and BAR have different distribution and concentration patterns in the case of Shiraz. This research showed that urban resilience variables are associated with different aspects of density to varying degrees. So, to understand how densification might affect urban resilience, deliberate analysis of urban resilience indicators is necessary. Moreover, while compact development and density are interchangeably used in the literature, our analysis showed that even densification has different meanings and the generalization of this concept should be avoided.
While density seems to be a critical issue in reaching urban resilience, the empirical analysis in this research does not support this general idea [7]. However, social and physical resilience are the areas of urban resilience dimensions that have a stronger relationship with density variables. Nevertheless, we had some major limitations that could be addressed in future studies. First, this analysis did not consider the importance (or weight) of different types of density and urban resilience indicators. We recommend future studies construct a weight matrix to address the relative importance of variables. Second, the indicators used here, as discussed in the methods section, might overlap or conflict with each other. Therefore, we recommend a cross-section of analysis to understand the impact of indicators on each other. Third, due to the lack of available data, this research has analyzed this relationship cross-sectionally. Future studies could use the current framework to make a more robust spatiotemporal analysis of densification and urban resilience using spatial and time-series data. Fourth, this research was based on correlation analysis, not causality. Some of the significant and strong correlation coefficients might be by chance or coincidence. Therefore, future research can be based on the cause–effect analysis of changes in density and their effect on different aspects of urban resilience. Finally, the comparative study of density and urban resilience in different contexts could be very informative and greatly contribute to the literature. From a policy perspective, compactness and densification are sensitive policies that should complement other policies such as mixed land use, social diversity, accessibility to services, and green spaces. Moreover, urban resilience goals and principles as an emerging approach should be aligned with sustainability goals, as each policy has winners and losers.
Author Contributions
Conceptualization, M.A. and A.S.; methodology, M.A.; software, A.D. and M.A.; validation, M.A.; formal analysis, A.D.; investigation, A.D.; resources, A.D.; data curation, A.D.; writing—original draft preparation, A.D. and M.A.; writing—review and editing, A.S.; visualization, A.D.; supervision, A.S.; project administration, A.S.; funding acquisition, not applicable. All authors have read and agreed to the published version of the manuscript.
Funding
This research received no external funding.
Data Availability Statement
Not applicable.
Conflicts of Interest
The authors declare no conflict of interest.
References
- van Vliet, W. Cities in a globalizing world: From engines of growth to agents of change. Environ. Urban. 2002, 14, 31–40. [Google Scholar] [CrossRef]
- Sharifi, A.; Khavarian-Garmsir, A.R. The covid-19 pandemic: Impacts on cities and major lessons for urban planning, design, and management. Sci. Total Environ. 2020, 749, 142391. [Google Scholar] [CrossRef]
- Davoudi, S.; Brooks, E.; Mehmood, A. Evolutionary resilience and strategies for climate adaptation. Plan. Pract. Res. 2013, 28, 307–322. [Google Scholar] [CrossRef]
- Feldmeyer, D.; Wilden, D.; Kind, C.; Kaiser, T.; Goldschmidt, R.; Diller, C.; Birkmann, J. Indicators for monitoring urban climate change resilience and adaptation. Sustainability 2019, 11, 2931. [Google Scholar] [CrossRef]
- Walker, B. Resilience: What it is and is not. Ecol. Soc. 2020, 25, 11. [Google Scholar] [CrossRef]
- Walker, B.; Carpenter, S.; Folke, C.; Gunderson, L.; Peterson, G.; Scheffer, M.; Schoon, M.; Westley, F. Navigating the chaos of an unfolding global cycle. Ecol. Soc. 2020, 25, 23. [Google Scholar] [CrossRef]
- Dehghani, A.; Alidadi, M.; Sharifi, A. Compact Development Policy and Urban Resilience: A Critical Review. Sustainability 2022, 14, 11798. [Google Scholar] [CrossRef]
- Jabareen, Y.R. Sustainable urban forms: Their typologies, models, and concepts. J. Plan. Educ. Res. 2006, 26, 38–52. [Google Scholar] [CrossRef]
- Moran, D.; Kanemoto, K.; Jiborn, M.; Wood, R.; Többen, J.; Seto, K.C. Carbon footprints of 13 000 cities. Environ. Res. Lett. 2018, 13, 064041. [Google Scholar] [CrossRef]
- Boyko, C.T.; Cooper, R. Clarifying and re-conceptualising density. Prog. Plan. 2011, 76, 1–61. [Google Scholar] [CrossRef]
- Bibri, S.E.; Krogstie, J.; Kärrholm, M. Compact city planning and development: Emerging practices and strategies for achieving the goals of sustainability. Dev. Built Environ. 2020, 4, 100021. [Google Scholar] [CrossRef]
- Lennon, M. Green space and the compact city: Planning issues for a ‘new normal’. Cities Health 2020, 5, S212–S215. [Google Scholar] [CrossRef]
- Azhdari, A.; Alidadi, M.; Pojani, D. What Drives Urban Densification? Free Market versus Government Planning in Iran. J. Plan. Educ. Res. 2022. [Google Scholar] [CrossRef]
- Asadzadeh, A.; Kötter, T.; Fekete, A.; Moghadas, M.; Alizadeh, M.; Zebardast, E.; Hutter, G. Urbanization, migration, and the challenges of resilience thinking in urban planning: Insights from two contrasting planning systems in Germany and Iran. Cities. 2022, 125, 103642. [Google Scholar]
- Davoudi, S.; Shaw, K.; Haider, L.J.; Quinlan, A.E.; Peterson, G.D.; Wilkinson, C.; Fünfgeld, H.; McEvoy, D.; Porter, L.; Davoudi, S. Resilience: A bridging concept or a dead end? “Reframing” resilience: Challenges for planning theory and practice interacting traps: Resilience assessment of a pasture management system in northern afghanistan urban resilience: What does it mean in planning practice? Resilience as a useful concept for climate change adaptation? The politics of resilience for planning: A cautionary note: Edited by simin davoudi and libby porter. Plan. Theory Pract. 2012, 13, 299–333. [Google Scholar]
- Adger, W.N. Social and ecological resilience: Are they related? Prog. Hum. Geogr. 2000, 24, 347–364. [Google Scholar] [CrossRef]
- Holling, C.S. Engineering resilience versus ecological resilience. Eng. Ecol. Constraints 1996, 31, 32. [Google Scholar]
- Ribeiro, P.J.G.; Gonçalves, L.A.P.J. Urban resilience: A conceptual framework. Sustain. Cities Soc. 2019, 50, 101625. [Google Scholar] [CrossRef]
- Béné, C.; Mehta, L.; McGranahan, G.; Cannon, T.; Gupte, J.; Tanner, T. Resilience as a policy narrative: Potentials and limits in the context of urban planning. Clim. Dev. 2018, 10, 116–133. [Google Scholar] [CrossRef]
- Sanchez, A.X.; Van der Heijden, J.; Osmond, P. The city politics of an urban age: Urban resilience conceptualisations and policies. Palgrave Commun. 2018, 4, 25. [Google Scholar] [CrossRef]
- Meerow, S.; Newell, J.P. Urban resilience for whom, what, when, where, and why? Urban Geogr. 2019, 40, 309–329. [Google Scholar] [CrossRef]
- Sharifi, A. A critical review of selected tools for assessing community resilience. Ecol. Indic. 2016, 69, 629–647. [Google Scholar] [CrossRef]
- Joerin, J.; Shaw, R.; Takeuchi, Y.; Krishnamurthy, R. The adoption of a climate disaster resilience index in chennai, india. Disasters 2014, 38, 540–561. [Google Scholar] [CrossRef] [PubMed]
- Suárez, M.; Gómez-Baggethun, E.; Benayas, J.; Tilbury, D. Towards an urban resilience index: A case study in 50 spanish cities. Sustainability 2016, 8, 774. [Google Scholar] [CrossRef]
- Zhang, M.; Yang, Y.; Li, H.; van Dijk, M.P. Measuring urban resilience to climate change in three chinese cities. Sustainability 2020, 12, 9735. [Google Scholar] [CrossRef]
- Chenhong, X.; Guofang, Z. The spatiotemporal evolution pattern of urban resilience in the Yangtze River Delta Urban Agglomeration based on TOPSIS-PSO-ELM. Sustain. Cities Soc. 2022, 87, 104223. [Google Scholar] [CrossRef]
- Khoja, L.; Schubert, R.; Joerin, J. Social Resilience Indicators for Disaster Related Contexts: Literature Review; Future Resilient Systems: Singapore, 2020. [Google Scholar]
- Chelleri, L.; Baravikova, A. Understandings of urban resilience meanings and principles across Europe. Cities 2021, 108, 102985. [Google Scholar] [CrossRef]
- Lim, H.K.; Kain, J.-H. Compact cities are complex, intense and diverse but: Can we design such emergent urban properties? Urban Plan. 2016, 1, 95–113. [Google Scholar] [CrossRef]
- Burton, E. Measuring urban compactness in uk towns and cities. Environ. Plan. B Plan. Des. 2002, 29, 219–250. [Google Scholar] [CrossRef]
- Bibby, P.; Henneberry, J.; Halleux, J.M. Incremental residential densification and urban spatial justice: The case of England between 2001 and 2011. Urban Studies. 2021, 58, 2117–2138. [Google Scholar] [CrossRef]
- Ahfeldt, G.M.; Pietrostefani, E. The Compact City in Empirical Research: A Quantitative Literature Review; Spatial Economics Research Centre, London School of Economics and Political Science: London, UK, 2017. [Google Scholar]
- Du, P.; Wood, A.; Ditchman, N.; Stephens, B. Life satisfaction of downtown high-rise vs. suburban low-rise living: A chicago case study. Sustainability 2017, 9, 1052. [Google Scholar] [CrossRef]
- Haigh, F.; Chok, H.N.; Harris, P. Housing Density and Health: A Review of the Literature and Health Impact Assessments; University of New South Wales Centre for Primary Health Care and Equity: Sydney, Australia, 2011. [Google Scholar]
- Bramley, G.; Power, S. Urban form and social sustainability: The role of density and housing type. Environ. Plan. B Plan. Des. 2009, 36, 30–48. [Google Scholar] [CrossRef]
- Shi, L.; Yang, S.; Gao, L. Effects of a compact city on urban resources and environment. J. Urban Plan. Dev. 2016, 142, 05016002. [Google Scholar] [CrossRef]
- Angel, S.; Franco, S.A.; Liu, Y.; Blei, A.M. The shape compactness of urban footprints. Prog. Plan. 2020, 139, 100429. [Google Scholar] [CrossRef]
- Pont, M.B.; Haupt, P.; Berg, P.; Alstäde, V.; Heyman, A. Systematic review and comparison of densification effects and planning motivations. Build. Cities 2021, 2, 378–401. [Google Scholar] [CrossRef]
- Miles, R.; Coutts, C.; Mohamadi, A. Neighborhood urban form, social environment, and depression. J. Urban Health 2012, 89, 1–18. [Google Scholar] [CrossRef]
- Lehmann, S. Sustainable urbanism: Towards a framework for quality and optimal density? Future Cities Environ. 2016, 2, 8. [Google Scholar] [CrossRef]
- Mouratidis, K. Is compact city livable? the impact of compact versus sprawled neighbourhoods on neighbourhood satisfaction. Urban Stud. 2018, 55, 2408–2430. [Google Scholar] [CrossRef]
- Mouratidis, K. Compact city, urban sprawl, and subjective well-being. Cities 2019, 92, 261–272. [Google Scholar] [CrossRef]
- Habibi, S.; Zebardast, E. Does compact development in midsize cities contribute to quality of life? J. Urban. Int. Res. Placemaking Urban Sustain. 2021, 15, 241–257. [Google Scholar] [CrossRef]
- Teller, J. Regulating urban densification: What factors should be used? Build. Cities 2021, 2, 302–317. [Google Scholar] [CrossRef]
- Hamidi, S.; Sabouri, S.; Ewing, R. Does density aggravate the covid-19 pandemic? early findings and lessons for planners. J. Am. Plan. Assoc. 2020, 86, 495–509. [Google Scholar] [CrossRef]
- Wong, D.W.; Li, Y. Spreading of covid-19: Density matters. PLoS ONE 2020, 15, e0242398. [Google Scholar] [CrossRef] [PubMed]
- Alam, M.Z. Is population density a risk factor for communicable diseases like covid19? A case of bangladesh. Asia Pac. J. Public Health 2021, 33, 949–950. [Google Scholar] [CrossRef]
- Martins-Filho, P.R. Relationship between population density and covid-19 incidence and mortality estimates: A county-level analysis. J. Infect. Public Health 2021, 14, 1087. [Google Scholar] [CrossRef]
- Khavarian-Garmsir, A.R.; Sharifi, A.; Moradpour, N. Are high-density districts more vulnerable to the covid-19 pandemic? Sustain. Cities Soc. 2021, 70, 102911. [Google Scholar] [CrossRef]
- Alidadi, M.; Sharifi, A. Effects of the built environment and human factors on the spread of COVID-19: A systematic literature review. Sci. Total Environ. 2022, 850, 158056. [Google Scholar] [CrossRef]
- Fan, C.; Jiang, Y.; Mostafavi, A. Emergent social cohesion for coping with community disruptions in disasters. J. R. Soc. Interface 2020, 17, 20190778. [Google Scholar]
- Azhdari, A.; Soltani, A.; Alidadi, M. Urban morphology and landscape structure effect on land surface temperature: Evidence from Shiraz, a semi-arid city. Sustain. Cities Soc. 2018, 41, 853–864. [Google Scholar] [CrossRef]
- Heidari, M.; Sayfouri, N.; Miresmaeeli, S.S.; Nasiri, A. Analysis of the man-made causes of shiraz flash flood: Iran, 2019. Prehospital Disaster Med. 2020, 35, 588–591. [Google Scholar] [CrossRef]
- Soltani, A.; Javadpoor, M.; Shams, F.; Mehdizadeh, M. Street network morphology and active mobility to school: Applying space syntax methodology in Shiraz, Iran. J. Transp. Health 2022, 27, 101493. [Google Scholar] [CrossRef]
- Cathles, L.M.; Brown, L.; Taam, M.; Hunter, A. A commentary on “The greenhouse-gas footprint of natural gas in shale formations” by RW Howarth, R. Santoro, and Anthony Ingraffea. Clim. Chang. 2012, 113, 525–535. [Google Scholar] [CrossRef]
- Copeland, S.; Comes, T.; Bach, S.; Nagenborg, M.; Schulte, Y.; Doorn, N. Measuring social resilience: Trade-offs, challenges and opportunities for indicator models in transforming societies. Int. J. Disaster Risk Reduct. 2020, 51, 101799. [Google Scholar] [CrossRef]
- Preston, V.; Shields, J.; Akbar, M. Migration and resilience in urban canada: Why social resilience, Why now? J. Int. Migr. Integr. 2022, 23, 1421–1441. [Google Scholar] [CrossRef]
- Hudec, O.; Reggiani, A.; Šiserová, M. Resilience capacity and vulnerability: A joint analysis with reference to Slovak urban districts. Cities 2018, 73, 24–35. [Google Scholar] [CrossRef]
- Elmqvist, T.; Folke, C.; Nyström, M.; Peterson, G.; Bengtsson, J.; Walker, B.; Norberg, J. Response diversity, ecosystem change, and resilience. Front. Ecol. Environ. 2003, 1, 488–494. [Google Scholar] [CrossRef]
- Soltani, A.; Sharifi, E. Daily variation of urban heat island effect and its correlations to urban greenery: A case study of Adelaide. Front. Archit. Res. 2017, 6, 529–538. [Google Scholar] [CrossRef]
- Abdrabo, M.A.; Hassaan, M.A. An integrated framework for urban resilience to climate change–Case study: Sea level rise impacts on the Nile Delta coastal urban areas. Urban Clim. 2015, 14, 554–565. [Google Scholar] [CrossRef]
- Ryazanova, O.; Timin, A. Assessment of the state, threats and risks of the economic security system of motor transport enterprises of the Kirov region. Transp. Res. Procedia 2022, 63, 1121–1130. [Google Scholar] [CrossRef]
- Narieswari, L.; Sitorus, S.R.P.; Hardjomidjojo, H.; Putri, E.I.K. Multi-dimensions urban resilience index for sustainable city. In IOP Conference Series: Earth and Environmental Science; IOP Publishing: Philadelphia, PA, USA, 2019; Volume 399, p. 012020. [Google Scholar]
- Milman, A.; Short, A. Incorporating resilience into sustainability indicators: An example for the urban water sector. Glob. Environ. Chang. 2008, 18, 758–767. [Google Scholar] [CrossRef]
- Hamideh, S.; Peacock, W.G.; Van Zandt, S. Housing type matters for pace of recovery: Evidence from Hurricane Ike. Int. J. Disaster Risk Reduct. 2021, 57, 102149. [Google Scholar] [CrossRef]
- Ramadhana, M.R. A dataset for emotional reactions and family resilience during COVID-19 isolation period among Indonesian families. Data Brief 2020, 31, 105946. [Google Scholar] [CrossRef] [PubMed]
- Berkes, F.; Colding, J.; Folke, C. (Eds.) Navigating Social-Ecological Systems: Building Resilience for Complexity and Change; Cambridge University Press: Cambridge, UK, 2008. [Google Scholar]
- Ernstson, H.; Van der Leeuw, S.E.; Redman, C.L.; Meffert, D.J.; Davis, G.; Alfsen, C.; Elmqvist, T. Urban transitions: On urban resilience and human-dominated ecosystems. Ambio 2010, 39, 531–545. [Google Scholar] [CrossRef]
- Meerow, S.; Stults, M. Comparing conceptualizations of urban climate resilience in theory and practice. Sustainability 2016, 8, 701. [Google Scholar] [CrossRef]
- Cutter, S.L. The landscape of disaster resilience indicators in the USA. Nat. Hazards 2016, 80, 741–758. [Google Scholar] [CrossRef]
- Teller, J. Urban density and covid-19: Towards an adaptive approach. Build. Cities 2021, 2, 150–165. [Google Scholar] [CrossRef]
- Azhdari, A.; Sasani, M.A.; Soltani, A. Exploring the relationship between spatial driving forces of urban expansion and socioeconomic segregation: The case of Shiraz. Habitat Int. 2018, 81, 33–44. [Google Scholar] [CrossRef]
- Ghanbari, R.; Heidarimozaffar, M.; Soltani, A.; Arefi, H. Land surface temperature analysis in densely populated zones from the perspective of spectral indices and urban morphology. Int. J. Environ. Sci. Technol. 2023, 1–20. [Google Scholar] [CrossRef]
Disclaimer/Publisher’s Note: The statements, opinions and data contained in all publications are solely those of the individual author(s) and contributor(s) and not of MDPI and/or the editor(s). MDPI and/or the editor(s) disclaim responsibility for any injury to people or property resulting from any ideas, methods, instructions or products referred to in the content. |
© 2023 by the authors. Licensee MDPI, Basel, Switzerland. This article is an open access article distributed under the terms and conditions of the Creative Commons Attribution (CC BY) license (https://creativecommons.org/licenses/by/4.0/).