Article

Detect Megaregional Communities Using Network Science Analytics

1
School of Architecture, University of Texas at Austin, Austin, TX 78712, USA
2
Shanghai Maice Data Technology Limited, 118 Guotong Rd., Shanghai 200433, China
*
Author to whom correspondence should be addressed.
Urban Sci. 2022, 6(1), 12; https://doi.org/10.3390/urbansci6010012
Submission received: 26 December 2021 / Revised: 8 February 2022 / Accepted: 14 February 2022 / Published: 16 February 2022

Abstract

:
Urban science research and the research on megaregions share a common interest in the system of cities and its implications for world urbanization and sustainability. The two lines of inquiry currently remain largely separate efforts. This study aims to bridge urban science and megaregion research by applying network science’s community detection algorithm to explore the spatial pattern of megaregions in the contiguous United States. A network file was constructed consisting of county centroids as nodes, the direct links between each pair of counties as edges, and inter-county commuting flows as the weight to capture spatial interactions. Analyses were carried out at two levels, one at the national level using Gephi and the other for the State of Texas involving NetworkX, an open-source Python programming package to implement a weighted community detection algorithm. Results show the detected communities largely conforming to the qualitative knowledge on megaregions. Despite a number of limitations, the study indicates the great potential of applying network science analytics to improve understanding of the spatial process of megaregions.

1. Introduction

The last two decades have seen strong momentum in scientific research on how cities and regions are spatially structured and ordered, while also functionally evolving and transforming. These research efforts under the domain of urban science renewed the interest in the science of cities that initially flourished in the mid-20th century and have been rapidly advancing lately as high computing capacities and fine spatial data become available [1,2,3,4,5,6,7]. More importantly, the progress of urban science research has been driven by the recognition of the critical role that urbanization plays in shaping global sustainability [8].
One particular urbanization form, megaregion, has gained worldwide attention, mostly from urban planners and policy analysts. Different terms have been used to describe this urbanization form, including ‘megaregion’ or ‘megalopolis’ in the United States, ‘mega-city region’ in Europe, and ‘city-cluster region’ in China [9,10,11,12,13]. This paper uses “megaregion” for reference convenience. A megaregion refers to the geography consisting of multiple metropolitan areas, cities of different sizes as well as the rural areas between them. Megaregions currently concentrate more than two thirds of the total global population and wealth and are projected to be the foci of future population and economic growth [14]. Understanding the spatiality of megaregional processes and dynamics is essential to develop an urban agenda for achieving sustainability [15].
The two lines of inquiry on urban science and megaregions continue to move forward, but currently remain largely as separate efforts. Both of them view cities or urban areas from a single system’s perspective. Urban scaling analysis treats the city as the unit of analysis and examines the scale-free, systemic properties of cities relating city size to their urban attributes. Megaregion study analysis considers cities as connected entities that form an integrated system of systems. An ongoing debate concerning megaregions is how the connectedness is defined and measured, which is essential in delineating megaregions for planning or policy implementation purposes [16]. Existing studies on identifying megaregions primarily follow the conventional approaches that examine the morphological and/or functional connectivity of cities and urbanized areas [10,17].
This paper presents an exploratory analysis that aims to bridge urban science and megaregion research. Specifically, the study applies network science analytics to detect megaregions as communities (in network analysis terms) considering both the graph properties of the network and the spatial interaction between network nodes (i.e., the third law of urban scaling). In this U.S. case study, a network is constructed for the contiguous 48 states with county centroids being the nodes and the direct links between each pair of counties as edges. Interactions are measured with county-to-county commuting flows. Two levels of network analysis are carried out. One is for the conterminous United States using Gephi, a freeware network analysis package. The other zooms into Texas, involving NetworkX, an open-source Python programming package, to implement a community detection algorithm.
A brief review of the literature on urban science (urban scaling, specially) and megaregions follows. The paper then introduces study methods, presents analysis results, and ends with discussion and conclusions.

2. Literature Review

Cities or urbanized areas exist in varying sizes measured by the number of inhabitants, the land areas they occupy, or their economic masses. A long interest of urban science is to explore the structural regularities embedded in the system of cities. Urban scaling is one regularity that has been examined extensively lately. Urban scaling refers to the scale-invariance characteristics shared by systems of cities over space and time. Batty highlights three scaling laws of cities [2]. The first pertains to the frequency distribution of different sized cities. A known regularity of city system distribution is Zipf’s Law, or the rank-size rule, which characterizes a power-law relationship between the size of a city (typically measured by population) and its rank in the system of cities in a given geography (country or region). The second scaling law also displays a power function of city size, but relating to the attributes of the city, for example, GDP, total wages, total road length, housing stock, and household water consumption. A scaling factor given by the empirically estimated exponent of the power function indicates a relationship being allometry or isometry when the factor is unequal or equal to 1, respectively. Finally, the third law of scaling describes the gravitational interaction between any pair of cities or entities; the intensity of interactions is determined by city sizes and the scaled friction between them, where friction takes a distance- or cost-decay function with a scaling parameter.
Existing empirical studies have largely confirmed the urban scaling regularities, but with deviations from the expected distributions when data on different city attributes or study areas are used [18,19]. Berry and Okulicz-Kozaryn show that the U.S. urban regional growth conforms to Gibrat’s Law and the rank-size distribution in general; but the distribution curves underpredict the size of the nation’s five largest urban regions [20]. When these largest urban regions are aggregated to the megaregional scale, a well fitted rank-size distribution is obtained for the U.S. urban system. This finding suggests the relevance of recognizing megaregion as a spatial entity to urban science research.
While there is a consensus on the existence or emergence of super large agglomerations around the world, there has been considerable debate over how and where a megaregion should be defined and spatially delineated. In the United States, megaregion research in the new century was initiated by a group of planners and researchers from the University of Pennsylvania, the Lincoln Institute of Land Policy and New York City-based Regional Plan Association (RPA) [21]. Their work identified 11 megaregions in the contiguous U.S. states as a rediscovery of and extension to Jean Gottmann’s megalopolis reported more than half a century ago [22]. Other U.S. scholars have also explored the phenomena of megaregions. Applying a variety of methods and criteria, they have delineated the number of U.S. megaregions as ranging from 10 to 23 (Figure 1) [11,17,23,24]. The definition of the Texas Triangle has invited arguably the most debate in the U.S. megaregion discourse. There are different versions of defining one or more megaregions in or around Texas [25]. Aside from the triangle version proposed by RPA, Lang and Dhavale proposed two corridor megaregions, one following Interstate highway 35 going from San Antonio, Texas to Kansas City, Missouri and the other along the Gulf of Mexico stemming from Brownsville, Texas to Mobile, Alabama [23]. Bright questions the very existence of the Texas Triangle megaregion [26].
Megaregion studies for the rest of the world show a research landscape as diverse as that in the United States. Florida et al. utilized nighttime light data and identified 40 megaregions around the world, 11 out of which come from the contiguous United States [27]. These megaregions not only produced ‘mega’ economic output, but also are agglomerating places of innovations measured by the number of patents and scientific publications. Taubenböck et al. also utilized multi-source and multi-year satellite images to analyze changes in urban footprints and then to identify the formation of mega-regions in Europe, Asia and America [28,29,30]. A subsequent study by Taubenböck and Wiesner explored an alternative way to define and delimit megaregions [29]. Using Earth O data, they assessed the magnitude of connectivity between urban centers in a qualitatively identified polycentric urban territories. The authors measured the magnitude of connectivity with two parameters, the average settlement density and the urban continuity, which is quantified as the percentage of pixels with a settlement density higher than 10% between two particular urban hubs. The proposed method was then applied to analyze four potential megaregions from four continents. Findings from this study reveal diverse spatial settlement patterns and varying spatial processes in megaregions across different continental geographies. Hall and Pain defined European megaregions based on the functional connectivity between clustered cities and towns that are either contiguous or physically separated [10]. Functional connectivity in their study was measured by daily commuting, similar to the method used by the U.S. Census Bureau for defining metropolitan areas. In addition, Hall and Pain emphasize these mega-city regions’ international connectivity to regional economic processes, especially in the sectors of advanced producer services (APS). Similarly, Glocker characterized megaregions based on the external and internal functional linkages between their constituent communities [31].
Whether using population density statistics, satellite images, or APS linkages, these efforts reviewed above share a common feature by focusing mostly on the morphological or functional processes of urbanization. A third approach is to apply network theory and analytics to understand the new urban form of megaregions. Few prior studies have taken this approach. Marull et al. [32] applied network theory and metrics to analyze Europe’s 12 megaregions and address the question concerning the (un)sustainability of the increased mass and complexity of mega-agglomerations. The authors characterized the urban networks in megaregions as graphs where graph elements include cities as nodes and transportation infrastructures (roadways and railways) as edges. Four graph indicators were created, including complexity, polycentricity, efficiency and stability, to measure megaregional performance and dynamics. The study confirmed empirically the small-world network properties in megaregions’ urban systems. Furthermore, the authors observed that the increase in the system complexity of megaregions induced superlinear increase of information, which leads to increased efficiency and stability of megaregion’s urban network. While the study is informative to understanding megaregional evolution and performance in Europe, the authors assume the pre-defined geography of European mega-city regions. The main interest of this paper centers on how a megaregion is detected and defined in the first place. He et al. applied community detection methods to demarcate metropolitan and megaregions in the contiguous U.S. states [33]. The authors utilized the U.S. Census Bureau’s Local Origin Destination Employment Statistics and performed weighted network analysis with a particular emphasis on intra-county commuting as self-looping weights. Their analysis resulted in the detection of 182 region communities. The results, however, offer limited insights into megaregional patterns because the authors excluded those commutes longer than 100 km (~62 miles). Conceptually, a megaregion consists of multiple metropolitan areas and the rural areas between them. Megaregional travel, therefore, includes trips between metropolitan areas that are usually longer than 100 km. Nelson and Rae also applied a community detection algorithm to identify regions based on census track level commuting data [34]. The study produced a vivid image of commuting regions resembling U.S. metropolitan areas.
This study explores the third approach, applying network science analytics, specifically, the community detection analysis, to examine explicitly the networkedness of megaregional components.

3. Methods

This study’s method included three parts. Part 1 involved visualization of commuting flows through desired-line mapping. The mapping exercise illustrated the intensity of county-to-county interactions and enabled qualitative assessment of county clusters that potentially form regions or megaregions. In Part 2, the study utilized Gephi, a freeware network analysis package to carry out community detection analysis using commuting flow data for the contiguous U.S. states. Finally, in Part 3, the study zoomed into Texas and identified communities or strongly connected counties by implementing a modularity optimization program written with Python scripts by NetworkX.

3.1. Data Sources

The primary data source for this study was the commuting flows data from the American Community Survey (ACS) published by the U.S. Census Bureau [35]. Commuting is a key indicator used by most existing studies reviewed above to measure economic ties between locational entities. The U.S. Office of Management and Budget (OMB) also uses commuting data as the primary criteria to define metropolitan and micropolitan areas [36]. Using ACS commuting data for this study allowed for assessment of the study results compared to those of the existing research. ACS asks survey respondents about their residence and workplace locations and generates flow records for the coupled residence-workplace locations of the commuters. While most standard ACS products are released annually, commuting flow data tables are produced irregularly, mostly in a five-year period, to serve for Census Bureau’s research and product development purposes. This study uses the latest ACS commuting flow data available from the Census Bureau’s website for the period of 2011–2015 at the spatial scale of counties or minor civil divisions (MCDs) [35]. For each pair of counties or MCDs, the ACS flow data report the total number of commuters. Commuting flow data provide essential information for OMB to delineate and update the boundaries of metropolitan and micropolitan areas.

3.2. Analytical Methods

This study applies the concept of community (also termed module or cluster) in network science to analyze the inter-connectedness between counties towards the formation of regions. By definition, a network community is formed in which its member nodes are strongly or densely connected with each other but weakly or sparsely connected with the nodes in the rest of the network [37]. Community detection techniques help identify partitions of the node sets in a network and discern important structural patterns of the network. Hence, community detection analysis serves well the purpose of this study. Modularity provides a metric to evaluate the goodness of results from community detection analysis [38]. From a statistical standpoint, achieving the maximum modularity index indicates the best quality of a community detection. Many algorithms are available for community detection in network analysis. This study uses the built-in clustering algorithm and modularity statistic in Gephi 0.9.2 for nationwide analysis [39]. For the Texas-focused analysis, the study applies the algorithm and modularity method developed by Newman and Girvan [38].
Modularity computes the difference between the number of edges within communities and the expected number in a random graph or a network, as shown in Equation (1):
Q = i = 1 k ( e i i a i 2 )
where e i i is the fraction of edges in the given network connecting nodes in the same community i and a i is the fraction of edges with one end node in communities i and the other nodes on other communities. When expressed in the adjacency matrix form, Equation (1) can be rewritten as follows:
Q = 1 2 m × v w [ A V W k v k w 2 m ] × δ ( C v , C w )
where m is the number of edges; A v w is the element of the A adjacency matrix in row v and column w; k v is the degree of node v, the number of connections attached to the v-th node; k w is the degree of node w, the number of connections attached to the w-th node; C v and C w are the communities containing v and w, respectively; Kronecker delta δ(x, y) is 1, if x = y, or 0 otherwise.
Equations (1) and (2) calculate modularity based on the graph’s topology only and produce unweighted community detection results. In practical applications, community detection and modularity analysis should take considerations of nodal and edge attributes. This study incorporates inter-county commuting flows as weights into the analysis. The edge weight, denoted as W i j , is calculated as shown below:
W i j = T i j / ( T i + T j T i j )
where W i j is the linkage coefficient between counties i and j; T i j denotes the number of commuters between two counties i and j; and T i and T j denotes the total number of commuters flowing into and out of county i and j, respectively. Accordingly, Equation (2) is rewritten as shown in Equation (4) below:
Q = 1 2 m × i j [ W i j k i k j 2 m ] × δ ( C i , C j )
To carry out the community detection analysis, the study applies two analytical tools, Gephi and NetworkX. The choice of applying two different tools to national and Texas-focused analysis was driven largely by computing efficiency. Gephi is an open-source and powerful tool designed for network exploration, analysis and visualization. Community detection analysis with Gephi requires user input for parameter setting, for instance, the scale of weight to be used and the number of clusters or communities to be identified. Python programming offers the flexibility to perform iterative analysis to search for optimal solutions without requiring input parameters to be provided by the user manually. This study adopts an open-source Python package, NetworkX, written for network analysis [40]. Results obtained from applying NetworkX include the number of communities detected and the identifier for each community that a node (county) belongs to. The authors attempted to apply the adopted NetworkX module to analyze the national dataset but it took too long to converge. Hence, for this exploratory study, Gephi and NetworkX offer complementary capacities to serve the study’s purposes. Finally, the results were imported into and visualized in ArcGIS. The detected communities or clusters of counties offer hints to identify megaregions.

4. Results

4.1. Visualizing Commuting Flows

The census data table for the 2011–2015 5-Year ACS Commuting Flows contains 139,433 records of commuting between residence counties and workplace counties in the United States and Puerto Rico. The data was imported into a matrix file for counties in the contiguous 48 States, which contains 3108 × 3108 cells; many of which show zero flows. In GIS the matrix flows were visualized (Figure 2) as desire lines with the line width indicating the flow volumes. Each line combines flows in both directions between the origin and destination counties. For effective viewing, the lines with flow volumes less than 1000 are suppressed.
Figure 2 exhibits a spatial pattern of commuting flows conforming to the spatial distribution of megaregions identified by RPA [9]. County clusters with high flow volumes appear in the Northeast, within and between Northern and Southern California, in the Texas Triangle, along the Seattle-Portland and Miami-Orlando corridor and the Gulf Coast, and around Atlanta. Multiple clusters centered at Chicago, Minneapolis, Cleveland and St. Louis create a morphology of what Banerjee calls a “network-galaxy” (p. 93) in the Great Lakes [41]. Three major metros in Texas, specifically Dallas, Houston and San Antonio, with Austin in between, form a triangular geometry delineated by relatively high commuting volumes on each edge. The Dallas-Houston edge had the highest volume despite that the two cities are distant relative to other pairs of the Triangle metros. The mapping exercise provides the empirical evidence of qualitative nature concerning the third urban scaling law: larger masses of two objects, or populations of two metros in this case, produce a greater intensity of interactions between them, while their spatial separation plays a discounting role.

4.2. Gephi Analysis Results

The network file containing county centroids as nodes and the direct lines for each pair of centroids as edges was imported into Gephi for graph analysis and display. Gephi provides a variety of layout algorithms to visualize networks. This study selected GeoLayout, a plug-in available for free installation. GeoLayout reads in the longitudes and latitudes of nodes (county centroids) and displays the spatial network graph in standard map projections.
Gephi’s built-in procedure for community detection applies a hierarchical clustering algorithm known as the Louvain method [42]. When performing analysis, Gephi provides a parameter, Resolution, for the user to specify and adjust. A higher value of Resolution (default being 1) detects a lower number of communities, and vice versa. A modularity score is generated for each run of community detection analysis at a given level of Resolution. The modularity analysis in Gephi also offers the user an option to apply weight. When no weight is specified, the analysis is performed based purely on the topological relationship of nodes. This study chose weighted analysis, using commuting flows as done by other studies for edge weights [33,34]. The analysis outputs of this study can thus be assessed in comparison to those from similar studies. For Texas-focused analysis, a refined weighting method, as described above in Equations (3) and (4), was used to better capture intercounty interactions.
There have been no consensuses on what makes the optimal solution to a community detection for network analysis because optimality can vary depending on the nature of issues being studied. From an algorithmic perspective, the setting that generates the highest modularity value is considered as the optimal solution [38,43]. Alternatively, if the analyst has a priori knowledge on the number of communities for the network, the optimal solution would be the one that generates the number of communities closely or exactly matching the expected. For megaregion studies, as described previously, there is a general understanding of the distribution of the new urbanization form but no agreement on how many there are across the Lower States. This study applies Gephi’s built-in procedures to explore solutions. The analyses were carried out by examining community detection outputs visualized in the Gephi interface.
Figure 3 shows two outputs selected from numerous modularity runs for this study. The top graph exhibits the communities detected by Gephi with the highest modularity value (0.556) at the default resolution of 1.00. Three spatial features are evident, presenting several analytical and policy interests. First, the nine color-coded communities match fairly closely to the geography of four census regions, including West (one community in lime color), Midwest (three communities in north central), Northeast (one community), and South (four communities). Except for the West region, communities detected also follow fairly closely to the geography of census divisions. Is it just a coincidence that the detected communities at the highest modularity resemble the census geographies of regions and divisions or there are some underlying mechanisms? The question was not explored in this study but warrants future research.
Second, the algorithmically optimal result coincides with some but not all megaregional geography identified by the existing literature. For instance, the Northeast and Florida (shown in light purple) communities resemble the two megaregions in RPA, Ross and FHWA [9,17,24]. Two communities to the north of Florida (in olive and jade tone) correspond approximately to the Piedmont megaregion. The Great Lakes megaregion includes three communities shown in blue, bright blue and brown. The community in orange covers an area extended from RPA’s Texas Triangle. For the megaregions located on the west coast and in the Mountain division, this Gephi modularity run detected a single community, not distinguishable for megaregions within it.
Third, the Northeast and Florida were detected by the Gephi analysis as a single networked community despite the more than 1000 miles separating the two locations. The use of commuting flows as weight for the analysis may explain the seemingly counterintuitive result. Reports have shown continuing trends of migration from the Northeast to Florida [44]. Some of them may maintain their jobs in the Northeast cities while commuting monthly or seasonally in combination with telecommuting. While this speculative explanation needs further empirical verifications, the analysis result of identifying the Northeast and Florida in one community indicates an important topic for megaregion research: understanding the connections and linkages between cities and metropolitan areas should go beyond spatial proximity and consider the extent to which these cities and metropolitan areas are networked in economic, social and/or environmental dimensions.
The bottom graph of Figure 3 shows the result of Gephi analysis with a large number of communities detected when the Resolution parameter was set at a low value of 0.05. One obvious improvement from previous analysis shown in the top graph of Figure 3 is the identification of megaregions in the U.S. West region. The detected communities of clustered counties resemble the megaregions defined by other studies, including Cascadia (anchored by cities of Seattle and Portland), Northern and Southern California, Arizona Sun Corridor and Front Range. For other census regions and divisions, however, the analysis reports a large number of small communities; most of them center at individual metropolitan areas. This pattern of communities looks similar to that identified by Nelson and Rae [34].
The Gephi analysis results presented above confirm a general observation: community detection output is sensitive to the definition of study area. Given the spatial heterogeneity of the U.S. counties and settlements across the United States, it is thus understandable to see the significant differences in results shown in Figure 3. The following section presents the analysis zoomed into Texas.

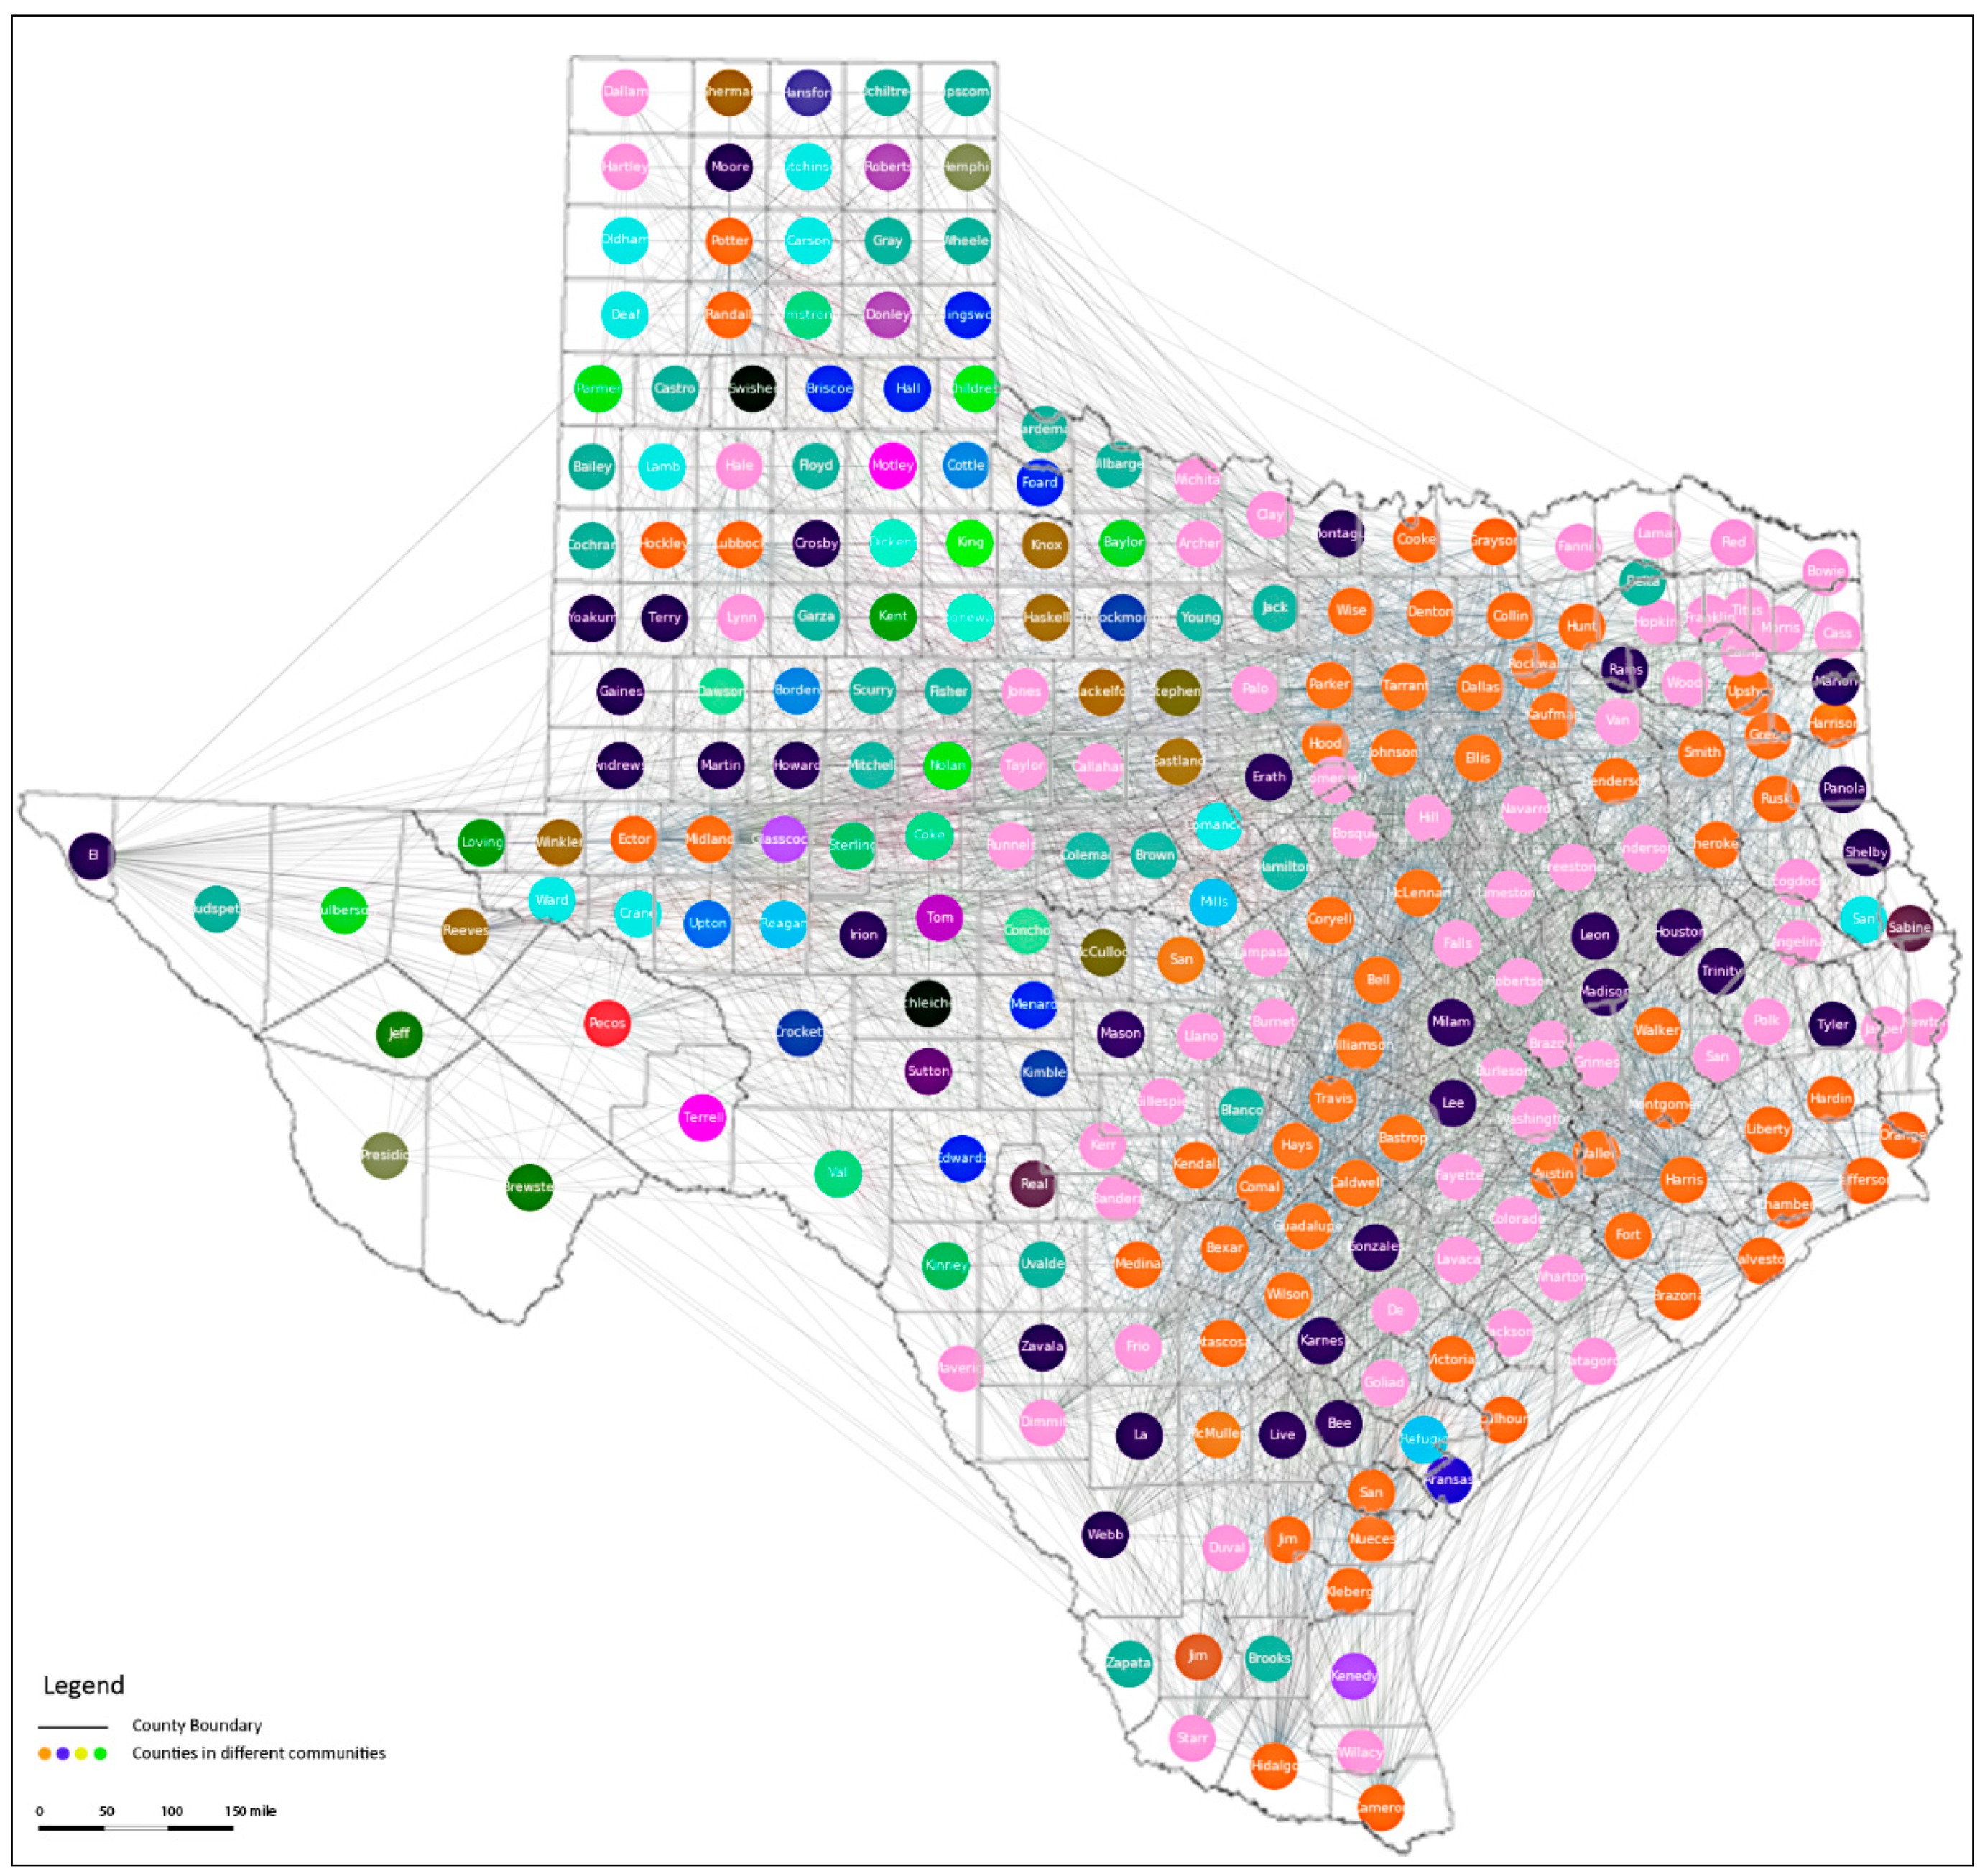
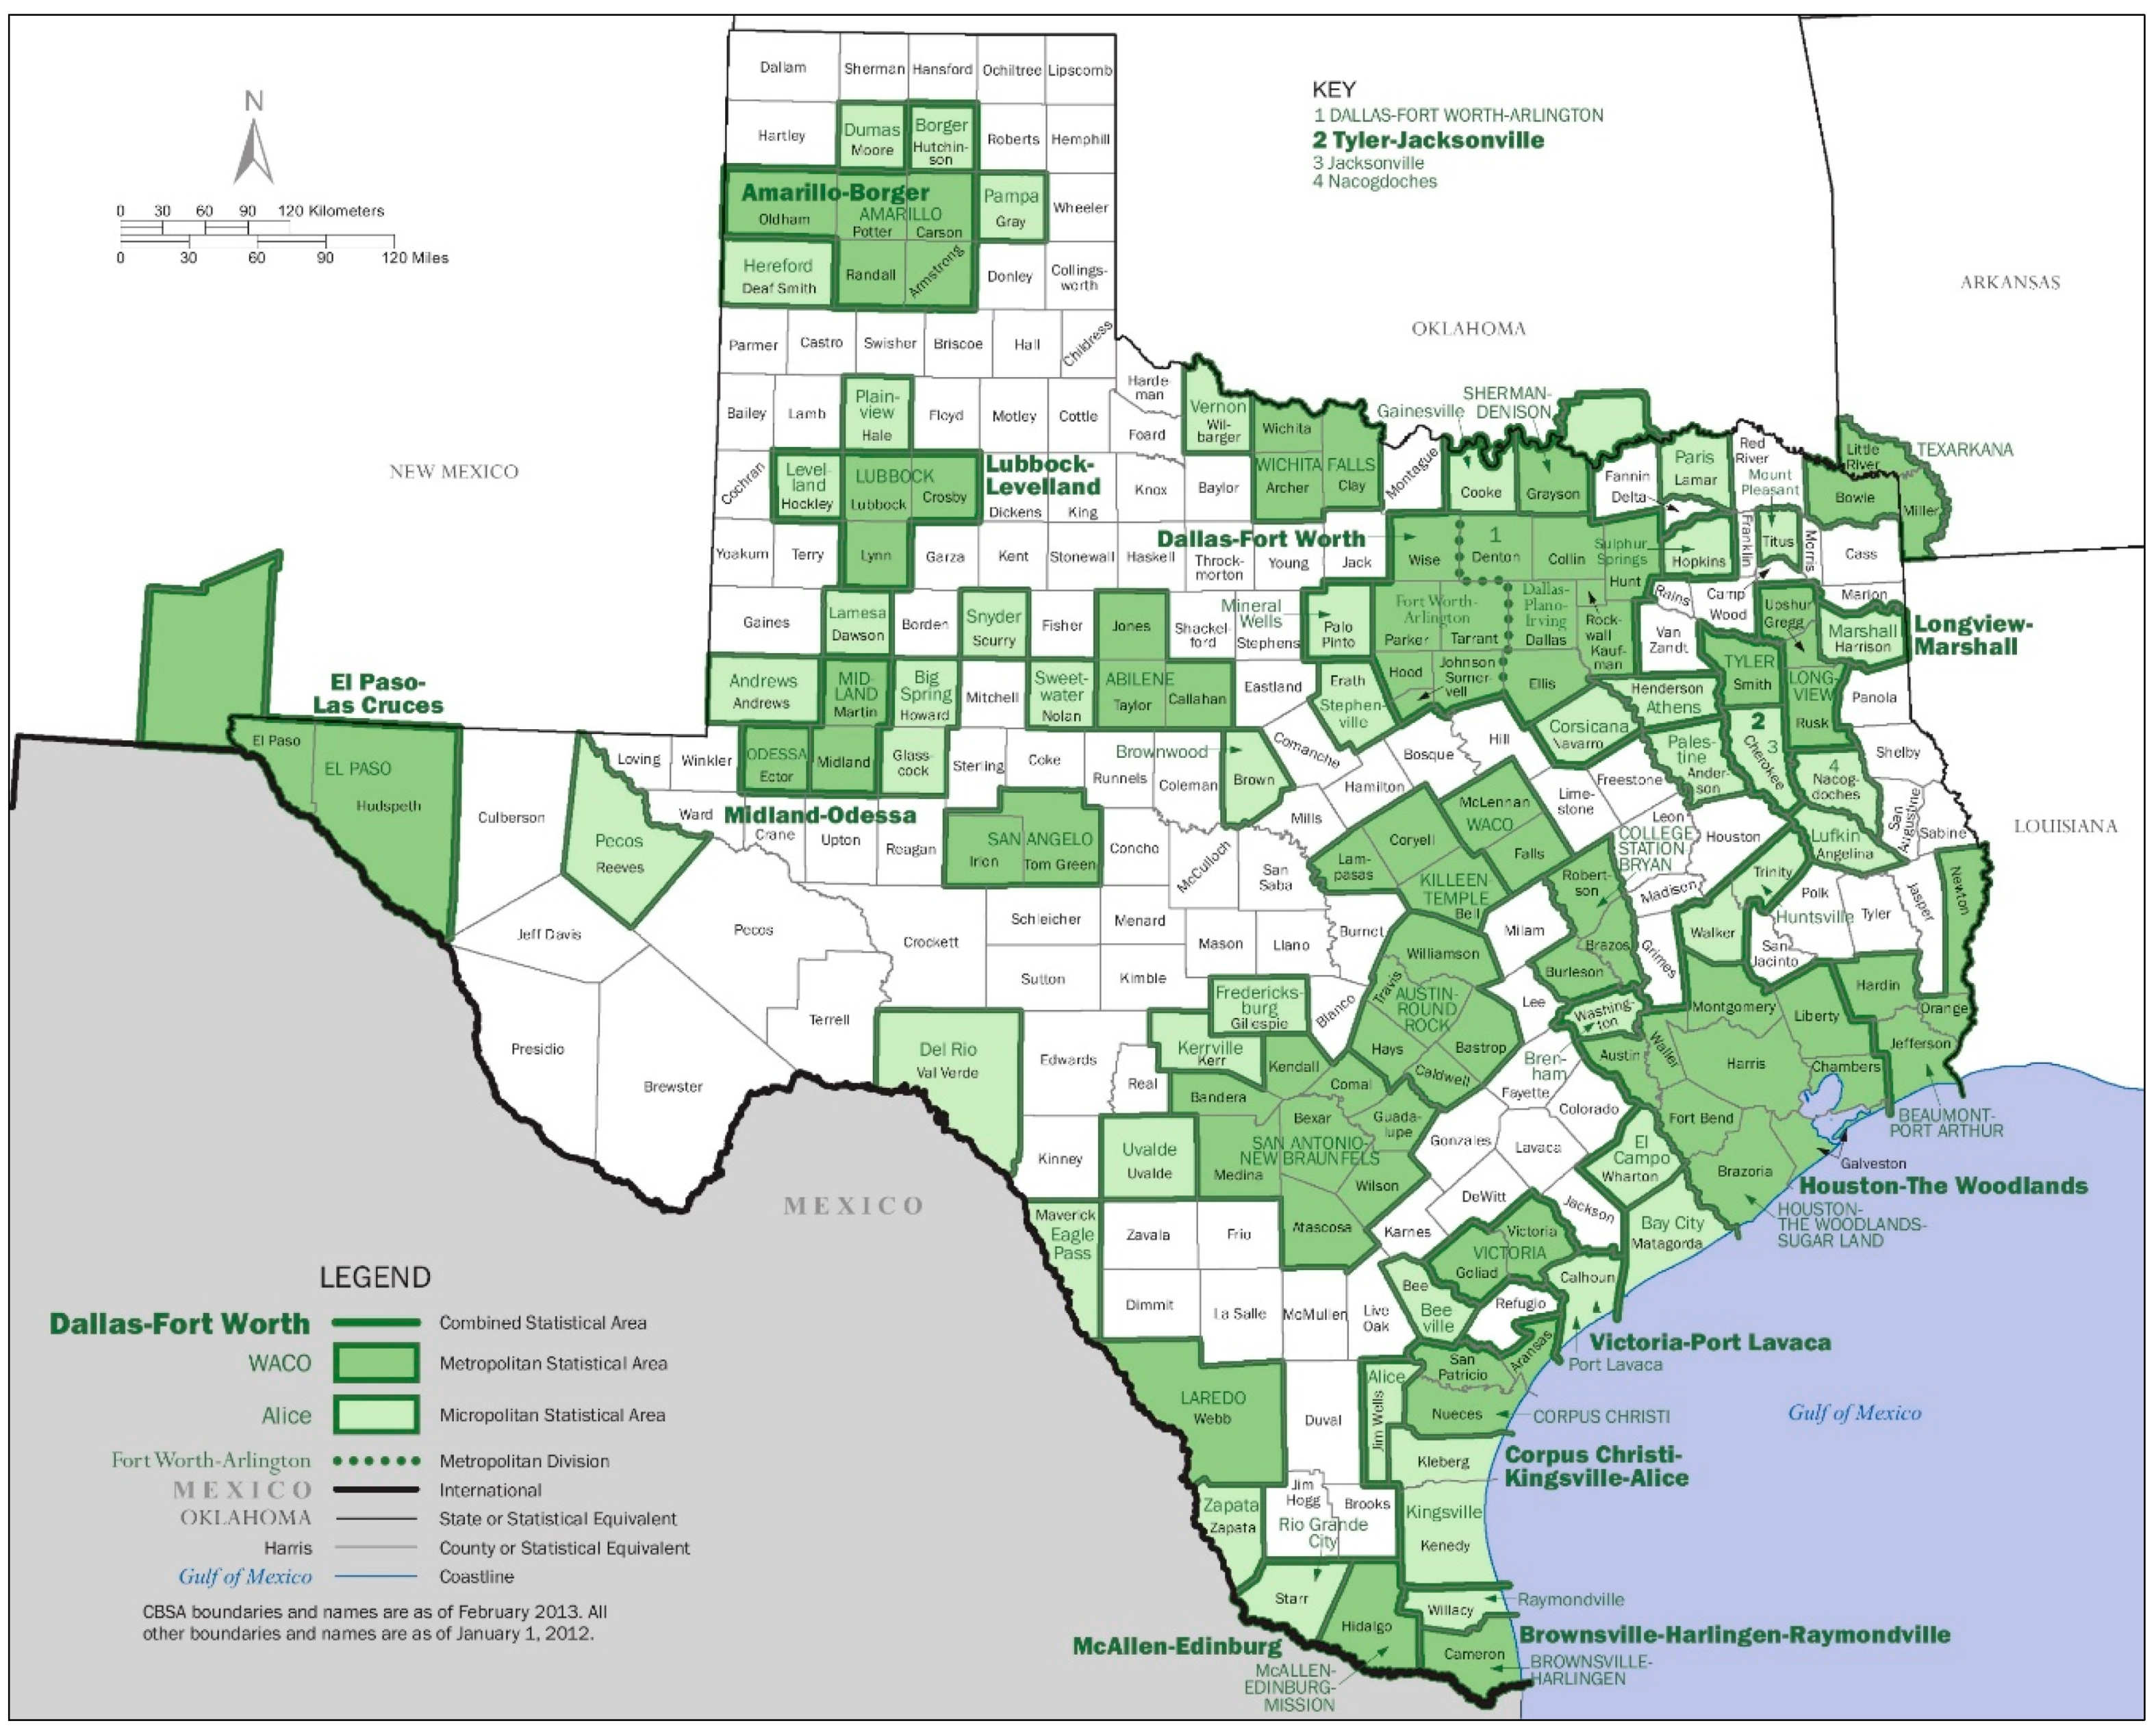
4.3. The Texas Analysis

The nation-wide analysis presented above used the original volume of commuters as weight. For the Texas-based analysis, a modified edge weight, the linkage coefficient as shown in Equation (3), was applied. This weight coefficient captures the relative intensity of interactions between each pair of counties. Figure 4 displays the modularity runs programmed with Python scripts. The horizontal axis shows the number of clusters or communities detected for each run and its corresponding modularity score shown on the vertical axis. The highest modularity score (0.29) was obtained for the output with 35 communities detected.
Figure 5 displays the optimal result of community detection. A total of 254 counties in Texas are grouped into 35 communities coded with different color tones. The two largest communities, coded in orange and light purple, stand out vividly on the east half of Texas. The super-sized community in orange contains mostly metropolitan counties, including those from Texas’ four largest metropolitan areas of Houston, Dallas-Fort Worth, San Antonio and Austin-Round Rock, and their adjacent, secondary (in size) metropolitan areas of Killeen-Temple and Waco to the north of Austin, Tyler-Longview to the east of Dallas and Beaumont-Port Arthur to the east of Houston (refer to Figure 6 for the locations of these geographic entities). The metropolitan counties form a nearly continuous corridor along Interstate Highway-35, with a gap of one county between Waco and Fort-Worth. The west-most county of the Houston area almost touches the east-most county of from the Austin area. The counties in light purple largely fill the space between the intensely clustered orange counties. For the rest of the state, counties scatter across the space, most of them are one- or two-county communities as detected by the algorithm. Four county pairs located by the state borders to the west and south were detected to be in the same community as the super-sized orange clusters. They include county pairs in the Amarillo, Lubbock and Midland-Odessa areas to the west and the McAllen and Brownsville areas by the U.S.-Mexican border to the south.
The analysis output shown in Figure 5 displays a pattern of county clustering conforming to that visualized in Figure 2. While the analysis was preliminary and only one type of network analysis (modularity) was involved, the Texas case study indicates the great potential of applying network science analytics to improve understanding the spatial process of megaregions.

5. Discussion and Conclusions

The megaregional phenomenon continues to evolve to produce a prominent urban form in the increasingly urbanized world. Understanding the spatial process and formational structures of megaregions is essential to develop plans and policies for garnering momentum and at the same time taming the diseconomies of the vast agglomerations for sustainability. Existing studies have focused primarily on the morphological or functional connectivity between the cities and urbanized areas in predefined territories. This study explores a third approach, applying network science analytics to detect megaregions as network communities consisting of clustered counties. A weighted community detection algorithm was used, for which inter-county commuting flows entered as weights. The study results are informative, but varying between different geographical levels of analysis; some of which conform to the expected, whereas others call for further research.
At the level of the 48 contiguous states, the Gephi-based analysis produced an algorithmic optimum (i.e., the highest modularity score) in which, except for the U.S. West region, county clusters corresponded closely to the megaregions identified by other scholars in the past studies. Interestingly, the optimal result delineated the geography of large communities highly consistent with the census regions and divisions. Explanations to this coincidence require further research. When the Resolution parameter was set at a low value in Gephi, megaregions in the U.S. West region were well identified. However, the megaregions identified previously in other U.S. regions became illegible. In the zoomed-in analysis of the Texas county network, a Python-programmed procedure involving NetworkX identified county clusters highly consistent with the Texas Triangle megaregion referred to by prior research.
The analysis also detected county clusters with strong connectivity, for example, between the Northeast and Florida and between the metropolitan areas of Dallas and Houston, despite them being hundreds of miles apart. Whether considering the Northeast and Florida, and the Dallas and Houston areas, as integrated regions depends on study purposes and thus requires the researcher’s qualitative assessment. Region or megaregion definition and delineation should also consider other socioeconomic and environmental factors beyond commuting statistics [46]. An insight gained from the results is that urban places (cities, counties or metropolitan areas) can become networked beyond proximity constraints.
One criticism to the present megaregion research concerns the exclusion of rural counties from analysis [47]. This issue is embedded in the built-morphology or urban function-based megaregion demarcation for which minimal thresholds of development density and continuity have to be pre-defined. The network approach does not require pre-specification of thresholds for chosen factors. As a result, rural counties are also included in the analysis over the rural–urban continuum. The network approach offers an analytical strength to carry out the much-needed research on the rural–urban interdependence in the United States.
Several cautionary notes are worth mentioning. As described before, results of community detection analysis are sensitive to the selection of study areas. Accordingly, whether a result is optimal should be decided not solely based on the computed statistics. It is important that the analyst exercises qualitative knowledge and prior empirical findings when assessing the analysis output. Network science analytics when applied to social networks typically deal with nonspatial data. When the phenomenon under study presents a spatial dimension, such as megaregions, it is essential to take into consideration the spatial effects. This study did not consider spatial factors such as the distance between counties. Adding spatial factors into the analysis can help better understand megaregional phenomenon. The complexity of incorporating the effects of spatial separation and spatial dependence into the application of network science to megaregion analysis makes it a challenging task, which warrants future research efforts. Lastly, a megaregion consists of multiple, complex systems. It is essential, while challenging, to integrate multi-dimensional analysis over infrastructural, ecological, social, cultural and economic networks.
Megaregions present important properties pertaining to urban network externalities [48,49]. Such properties have been explored, but rather inadequately. Network science offers a great potential to uncover megaregional network externalities and their implications for sustainable urbanization and development.

Author Contributions

Conceptualization, M.Z. and B.L.; methodology, M.Z. and B.L.; formal analysis, M.Z. and B.L.; data curation, M.Z. and B.L.; writing—original draft preparation, M.Z. and B.L.; writing—review and editing, M.Z.; visualization, M.Z. and B.L.; funding acquisition, M.Z. All authors have read and agreed to the published version of the manuscript.

Funding

This research was supported by USDOT UTC Cooperative Mobility for Competitive Megaregions (CM2) (Grant #: 69A3551747135).

Institutional Review Board Statement

Not applicable.

Informed Consent Statement

Not applicable.

Data Availability Statement

The data used for this study can be found at https://www.census.gov/data/tables/2015/demo/metro-micro/commuting-flows-2015.html (accessed on 15 March 2021).

Acknowledgments

The authors wish to thank Urban Science staff and the anonymous reviewers for their constructive comments and suggestions.

Conflicts of Interest

The authors declare no conflict of interest. The funders had no role in the design of the study; in the collection, analyses, or interpretation of data; in the writing of the manuscript; or in the decision to publish the results.

References

  1. Batty, M. Modelling Cities as Dynamic Systems. Nature 1971, 231, 425–428. [Google Scholar] [CrossRef]
  2. Batty, M. Building a science of cities. Cities 2012, 29, S9–S16. [Google Scholar] [CrossRef] [Green Version]
  3. Bettencourt, L.M.A. The Origins of Scaling in Cities. Science 2013, 340, 1438–1441. [Google Scholar] [CrossRef] [PubMed] [Green Version]
  4. Rybski, D.; Arcaute, E.; Batty, M. Urban scaling laws. In Environment and Planning B: Urban Analytics and City Science; SAGE Publications Sage UK: London, UK, 2018; Volume 46. [Google Scholar] [CrossRef]
  5. Finance, O.; Swerts, E. Scaling laws in urban geography. Linkages with urban theories, challenges and limitations. In Theories and Models of Urbanization; Springer: Cham, Switzerland, 2020; pp. 67–96. [Google Scholar]
  6. Bettencourt, L.M.A.; Yang, V.C.; Lobo, J.; Kempes, C.P.; Rybski, D.; Hamilton, M.J. The interpretation of urban scaling analysis in time. J. R. Soc. Interface 2020, 17, 20190846. [Google Scholar] [CrossRef] [Green Version]
  7. Molinero, C.; Thurner, S. How the geometry of cities determines urban scaling laws. J. R. Soc. Interface 2021, 18, 20200705. [Google Scholar] [CrossRef]
  8. Acuto, M.; Parnell, S.; Seto, K.C. Building a global urban science. Nat. Sustain. 2018, 1, 2–4. [Google Scholar] [CrossRef]
  9. Regional Plan Association. America 2050: A Prospectus [Internet]. Regional Plan Association. 2006. Available online: https://s3.us-east-1.amazonaws.com/rpa-org/pdfs/2050-Prospectus.pdf (accessed on 1 October 2021).
  10. Peter, H.; Kathy, P. The Polycentric Metropolis: Learning from Mega-City Regions in Europe; Routledge & CRC Press: London, UK, 2006; Available online: https://www.routledge.com/The-Polycentric-Metropolis-Learning-from-Mega-City-Regions-in-Europe/Hall-Pain/p/book/9781844077472 (accessed on 22 December 2021).
  11. Nelson, A.C.; Lang, R. Megapolitan America: A New Vision for Understanding America’s Metropolitan Geography; APA Planners: Chicago, IL, USA; Taylor & Francis [distributor]: London, UK, 2011; p. 278. [Google Scholar]
  12. Megaregions: Globalization’s New Urban form? Harrison, J.; Hoyler, M. (Eds.) Edward Elgar: Cheltenham, UK, 2015; p. 270. [Google Scholar]
  13. Groff, S.P.; Stefan, R. China’s City Clusters: Pioneering Future Mega-Urban Governance. Am. Aff. URL 2019, 3, 134–150. Available online: https://americanaffairsjournal.org/issue/summer-2019/ (accessed on 1 October 2021).
  14. Liu, Z.; Zhang, M.; Liu, L. Benchmark of the Trends of Spatial Inequality in World Megaregions. Sustainability 2021, 13, 6456. [Google Scholar] [CrossRef]
  15. Seto, K.C.; Golden, J.S.; Alberti, M.; Turner, B.L., II. Sustainability in an urbanizing planet. Proc. Natl. Acad. Sci. USA 2017, 114, 8935–8938. [Google Scholar] [CrossRef] [Green Version]
  16. Dewar, M.; Epstein, D. Planning for “megaregions” in the United States. J. Plan. Literature 2007, 22, 108–124. [Google Scholar]
  17. Megaregions: Planning for Global Competitiveness; Ross, C.L. (Ed.) Island Press: Washington, DC, USA, 2009; p. 307. [Google Scholar]
  18. Bettencourt, L.M.A.; Lobo, J.; Strumsky, D.; West, G.B. Urban Scaling and Its Deviations: Revealing the Structure of Wealth, Innovation and Crime across Cities. PLoS ONE 2010, 5, e13541. [Google Scholar] [CrossRef] [PubMed] [Green Version]
  19. Lobo, J.; Bettencourt, L.M.A.; Strumsky, D.; West, G.B. Urban Scaling and the Production Function for Cities. PLoS ONE 2013, 8, e58407. [Google Scholar] [CrossRef] [PubMed] [Green Version]
  20. Berry, B.J.; Okulicz-Kozaryn, A. The city size distribution debate: Resolution for US urban regions and megalopolitan areas. Cities 2012, 29, S17–S23. [Google Scholar] [CrossRef]
  21. Carbonell, A.; Yaro, R.D. American spatial development and the new megalopolis. Land Lines 2005, 17, 1–4. [Google Scholar]
  22. Gottmann, J. Megalopolis or the Urbanization of the Northeastern Seaboard. Econ. Geogr. 1957, 33, 189. [Google Scholar] [CrossRef]
  23. Lang, R.E.; Dhavale, D. Beyond megalopolis: Exploring america’s new “megapolitan” geography. Metrop. Inst. Census Rep. Ser. 2005, 5, 1–35. [Google Scholar]
  24. FHWA. Megaregions and National Economic Partnerships [Internet]. 2018. Available online: https://www.fhwa.dot.gov/planning/megaregions/ (accessed on 25 December 2021).
  25. Zhang, M.; Steiner, F.; Butler, K. Connecting the Texas Triangle: Economic integration and transportation coordination. In The Healdsburg Research Seminar on Megaregions; Regional Plan Association: New York, NY, USA, 2007; pp. 21–36. [Google Scholar]
  26. Bright, E. Viewpoint: Megas? Maybe not. Plan. Mag. 2007, 73, 46. [Google Scholar]
  27. Florida, R.; Gulden, T.; Mellander, C. The rise of the mega-region. Camb. J. Reg. Econ. Soc. 2008, 1, 459–476. [Google Scholar] [CrossRef]
  28. Taubenböck, H.; Wiesner, M.; Felbier, A.; Marconcini, M.; Esch, T.; Dech, S. New dimensions of urban landscapes: The spa-tio-temporal evolution from a polynuclei area to a mega-region based on remote sensing data. Appl. Geogr. 2014, 47, 137–153. [Google Scholar] [CrossRef]
  29. Taubenböck, H.; Wiesner, M. The spatial network of megaregions-Types of connectivity between cities based on settle-ment patterns derived from EO-data. Comput. Environ. Urban Syst. 2015, 54, 165–180. [Google Scholar] [CrossRef]
  30. Taubenbock, H.; Bauer, P.; Geiss, C.; Wurm, M. Mega-regions in China. In Proceedings of the 2017 Joint Urban Remote Sensing Event (JURSE), Institute of Electrical and Electronics Engineers (IEEE), Dubai, United Arab Emirates, 6–8 March 2017; pp. 1–4. [Google Scholar]
  31. Glocker, D. The Rise of Megaregions: Delineating a New Scale of Economic Geography. OECD Regional Development Working Papers 2018/04. 2018. Available online: https://www.oecd-ilibrary.org/docserver/f4734bdd-en.pdf?expires=1644977918&id=id&accname=guest&checksum=61093A0D60BDB50C7D0C6C3673DFC977 (accessed on 24 December 2021).
  32. Marull, J.; Font, C.; Boix, R. Modelling urban networks at mega-regional scale: Are increasingly complex urban systems sustainable? Land Use Policy 2015, 43, 15–27. [Google Scholar] [CrossRef]
  33. He, M.; Glasser, J.; Pritchard, N.; Bhamidi, S.; Kaza, N. Demarcating geographic regions using community detection in commuting networks with significant self-loops. PLoS ONE 2020, 15, e0230941. [Google Scholar] [CrossRef] [PubMed]
  34. Nelson, G.D.; Rae, A. An Economic Geography of the United States: From Commutes to Megaregions. PLoS ONE 2016, 11, e0166083. [Google Scholar] [CrossRef] [PubMed] [Green Version]
  35. US Census Bureau UC. 2011–2015 5-Year ACS Commuting Flows [Internet]. Census.gov. 2021. Available online: https://www.census.gov/data/tables/2015/demo/metro-micro/commuting-flows-2015.html (accessed on 24 December 2021).
  36. Office of Management and Budget. 2010 Standards for Delineating Metropolitan and Micropolitan Statistical Areas; Notice. Fed. Regist. 2010, 75, 37246–37252. [Google Scholar]
  37. Radicchi, F.; Castellano, C.; Cecconi, F.; Loreto, V.; Parisi, D. Defining and identifying communities in networks. Proc. Natl. Acad. Sci. USA 2004, 101, 2658–2663. [Google Scholar] [CrossRef] [Green Version]
  38. Newman, M.E.J.; Girvan, M. Finding and evaluating community structure in networks. Phys. Rev. E 2004, 69, 026113. [Google Scholar] [CrossRef] [Green Version]
  39. Cherven, K. Network Graph Analysis and Visualization with Gephi; Packt Publishing Ltd: Birmingham, UK, 2013. [Google Scholar]
  40. NetworkX Developers. NetworkX—Network Analysis in Python [Internet]. 2021. Available online: https://networkx.org/ (accessed on 24 December 2021).
  41. Banerjee, T. Megaregions or Megasprawls? Issues of Density, Urban Design and Quality Growth. In Megaregions: Planning for Global Competitiveness; Island Press: Washington, DC, USA, 2009; pp. 83–106. [Google Scholar]
  42. Blondel, V.D.; Guillaume, J.-L.; Lambiotte, R.; Lefebvre, E. Fast unfolding of communities in large networks. J. Stat. Mech. 2008, 2008, P10008. [Google Scholar] [CrossRef] [Green Version]
  43. Newman, M.E.J. Modularity and community structure in networks. Proc. Natl. Acad. Sci. USA 2006, 103, 8577–8582. [Google Scholar] [CrossRef] [Green Version]
  44. Haughey, J. Census Bureau: New Yorkers come to Florida to work, New Englanders to retire [Internet]. The Center Square. 2019. Available online: https://www.thecentersquare.com/florida/census-bureau-new-yorkers-come-to-florida-to-work-new-englanders-to-retire/article_bf861aa0-fcdf-11e9-997a-0b2cc9818e66.html (accessed on 24 December 2021).
  45. US Census Bureau. TEXAS—Core Based Statistical Areas (CBSAs) and Counties [Internet]. 2013. Available online: https://www2.census.gov/geo/maps/metroarea/stcbsa_pg/Feb2013/cbsa2013_TX.pdf (accessed on 24 December 2021).
  46. Seltzer, E.; Carbonell, A. Regional planning in America: Planning regions. In Regional Planning in America: Practice and Prospect; Lincoln Institute of Land Policy: Cambridge, MA, USA, 2011; pp. 1–16. [Google Scholar]
  47. Wheeler, S.M. Five reasons why megaregional planning works against sustainability. In Megaregions; Edward Elgar Publishing: Glasgow, UK, 2015; pp. 97–118. [Google Scholar]
  48. Burger, M.J.; Meijers, E.J. Agglomerations and the rise of urban network externalities. Pap. Reg. Sci. 2016, 95, 5–15. [Google Scholar] [CrossRef]
  49. Pflieger, G.; Rozenblat, C. Introduction. Urban Networks and Network Theory: The City as the Connector of Multiple Networks. Urban Stud. 2010, 47, 2723–2735. [Google Scholar] [CrossRef] [Green Version]
Figure 1. Various Definitions of Megaregions in the Contiguous United States (upper left: RPA [9]; upper right: Lang [23]; lower left: FHWA [24]; lower right: Ross [17]).
Urbansci 06 00012 g001
Figure 2. County-to-County Commute Flows in the Contiguous United States.
Urbansci 06 00012 g002
Figure 3. Community Detection Analysis for County Network Weighted by Inter-County Commuting Flows (Top: Resolution: 1.00; Modularity: 0.556; # of Communities: 8; Bottom: Resolution: 0.05; Modularity: 0.197; # of Communities: 157).
Urbansci 06 00012 g003
Figure 4. Community Detection Runs and Modularity Performance.
Urbansci 06 00012 g004
Figure 5. Communities Detected for Texas Counties.
Urbansci 06 00012 g005
Figure 6. Metropolitan-/Micropolitan Areas and Counties in Texas (Credit: U.S. Census Bureau [45]).
Urbansci 06 00012 g006
Publisher’s Note: MDPI stays neutral with regard to jurisdictional claims in published maps and institutional affiliations.

