Article

3D LiDAR Scanning of Urban Forest Structure Using a Consumer Tablet

by
Gursel Y. Çakir
1,
Christopher J. Post
1,*,
Elena A. Mikhailova
1 and
Mark A. Schlautman
2
1
Department of Forestry and Environmental Conservation, Clemson University, Clemson, SC 29634, USA
2
Department of Environmental Engineering and Earth Sciences, Clemson University, Anderson, SC 29625, USA
*
Author to whom correspondence should be addressed.
Urban Sci. 2021, 5(4), 88; https://doi.org/10.3390/urbansci5040088
Submission received: 14 September 2021 / Revised: 29 October 2021 / Accepted: 14 November 2021 / Published: 17 November 2021

Abstract

:
Forest measurements using conventional methods may not capture all the important information required to properly characterize forest structure. The objective of this study was to develop a low-cost alternative method for forest inventory measurements and characterization of forest structure using handheld LiDAR technology. Three-dimensional (3D) maps of trees were obtained using an iPad Pro with a LiDAR sensor. Freely-available software programs, including 3D Forest Software and CloudCompare software, were used to determine tree diameter at breast height (DBH) and distance between trees. The 3D point cloud data obtained from the iPad Pro LiDAR sensor was able to estimate tree DBH accurately, with a residual error of 2.4 cm in an urban forest stand and 1.9 cm in an actively managed experimental forest stand. Distances between trees also were accurately estimated, with mean residual errors of 0.21 m for urban forest, and 0.38 m for managed forest stand. This study demonstrates that it is possible to use a low-cost consumer tablet with a LiDAR sensor to accurately measure certain forest attributes, which could enable the crowdsourcing of urban and other forest tree DBH and density data because of its integration into existing Apple devices and ease of use.

Graphical Abstract

1. Introduction

Conventional forest measurement methods to determine tree size and density are time-consuming and often require specialized training to estimate forest structure [1]. It is important to develop new forest inventory measurement techniques so that forest stand metrics can be analyzed quickly and accurately to support forest monitoring and wildlife habitat assessment. Foresters measure tree diameter at breast height (DBH) to calculate the amount of wood produced from trees, determine ecosystem structure, and estimate the amount of forest inventory, which is difficult to measure directly. Frequent and widespread use of different measurement tools ensures that tree properties are measured with accurate reference [2]. Measurements made with calipers and clinometry are the most common measurement methods for DBH and tree height but are time consuming and labor intensive. For example, calipers and clinometry were used in a study of 319 trees in the Evo region in southern Finland [3]. The standard deviation of tree DBH and height measurements were calculated as 0.3 cm (1.5%) and 0.5 m (2.9%), respectively [3]. These results show that successful measurements can be obtained with very few errors using traditional methods [3]. However, some factors cause human mistakes in these measurements. The determination of DBH should be assessed at 130 cm from the ground; this distance is typically expected to come at approximately tree breast height [2]. However, tree assessment techniques must deal with trees with a fork between 30 and 137 cm high to accurately measure tree biomass [2].
There are new techniques that take advantage of laser scanning technology to characterize forest habitat with light detection and ranging (LiDAR) technology, including handheld mobile laser scanning (HMLS), terrestrial laser scanning (TLS), and airborne laser scanning (ALS) [4]. With the widespread use of modern laser scanners, traditional forest inventory techniques are being replaced [5]. The various laser scanning techniques produce a virtual 3D map of forest structures using point clouds. Tree position, trunk diameters, and tree heights can be estimated from these 3D point clouds. Many studies have started to compare different algorithms and techniques with LiDAR systems which allow the calculation of the forest inventory and forest habitat characterization [6,7]. In a recent study conducted in 20 forest stands in Austria, the performance of two different laser scanning systems, a mobile personal laser scanner (PLS) and a static terrestrial laser scanner, was compared [1]. Because one of the most important features of PLS is that it is handheld, studies in the sample areas were completed three times faster than TLS, but TLS was found to provide more useful information in determining tree sizes, especially tree diameter [7,8].
Although calculating forest inventory using LiDAR technology has many advantages, some studies have encountered significant problems. For example, in studies performed on a mixed stand of Sitka spruce and lodgepole pine in Kielder Forest in Northern England, tree DBH and tree height values were acquired using three different types of terrestrial lasers [9]. The results demonstrated that laser scanning achieved successful results when the view of the tree from the sensors used was not blocked. It has been observed that laser scanning data does not always give actionable and accurate results in forests with high tree density [9]. Due to the high number of tree trunks and the thick canopy in denser stands, the margin of error increases in the information obtained. Studies carried out in dense forests are expected to provide better-quality information when focused on smaller forest areas and even individual trees [9,10]. Forest characteristics are typically determined by a combination of field measurements and remote sensing data obtained by LiDAR technology in forest inventories [11]. In a study conducted on a sweet chestnut (Castanea sativa) stand, a mobile laser scanner (ZEB1 device) was used to calculate tree properties (DBH, tree height, and crown base height) [12]. In that study area, trees were scanned by walking around each tree, and were captured as 3D point cloud data; DBH, tree height and crown base height values were estimated from these data [12]. The researchers found that scanning around each tree improved the detection of small-diameter trees but was challenging to apply in dense and complex forests. Therefore, testing various types of HMLS techniques in different densities and complexities of forests will be beneficial [12]. Prior studies have demonstrated that HMLS tools provide many advantages in forest inventory [12]. These advantages include the low cost of the equipment required to collect data, the minimization of the need for equipment and expert knowledge, and the ability to collect data quickly and with high accuracy [12]. In another study, a 3D point cloud map of a forest area was obtained using a VLP-16 LiDAR system which was subsequently used to extract the DBH diameter [13]. The obtained 3D point cloud was processed, and the ground point cloud was removed with a random sample consensus (RANSAC) algorithm to facilitate the calculation of DBH [13]. The results showed that the relative error compared to ground truth data was 2.27%, the corresponding variance was 15.09 cm, and the root mean square error was 0.70 cm [13]. The requirement to determine tree location with GPS was emphasized, and the idea of using unmanned aerial vehicles (UAVs) for larger areas was suggested [13].
Characterizing forest habitats and determining the vegetation structure play important roles in wildlife ecology [14]. With the widespread use of LiDAR technologies, relationships between wild animal activity and forest structure have begun to be analyzed. For example, the relationship between forest structure as determined by LiDAR scanning and bat activity has been studied in Austrian state forests, where a 3D map of the area was created using TLS to characterize forest habitat structure [15]. That study found a negative relationship between forest density and the behavior of bats while they are catching their prey in the forest [15]. The use of LiDAR technology can reduce the time necessary to measure vegetation cover and forest density, which are important not only for bats but also for many other wild animal populations. Calculating the amount of vegetation, which is an important food source for deer and other ungulates, also affects animal productivity and density [16]. In a study conducted in the Colville National Forest, WA (USA), airborne LiDAR obtained information about forest structure and understory biomass in 65 areas for four years; this information was compared with field samples in the same area [17]. Even if there are data limitations where the forest canopy is dense, LiDAR technology can estimate some important resources for animals [17].
A newly released iPad consumer tablet includes a LiDAR sensor that works outdoors and is much lower cost than other available LiDAR scanning devices described previously. Data from the iPad LiDAR sensor can be used to construct 3D scenes using an application running on the tablet. The hypothesis of the present study was that iPad LiDAR data can be used for small forest areas to accurately evaluate the DBH and tree density (represented by distance between trees). The objectives of this study were: (1) to test the suitability of low-cost Apple iPad handheld LiDAR scanning to characterize forest habitat characteristics, (2) to determine DBH and distance between trees and then compare them with the results obtained by traditional methods, and (3) evaluate the iPad LiDAR sensor data as a method to acquire crowd sourced forest information.

2. Materials and Methods
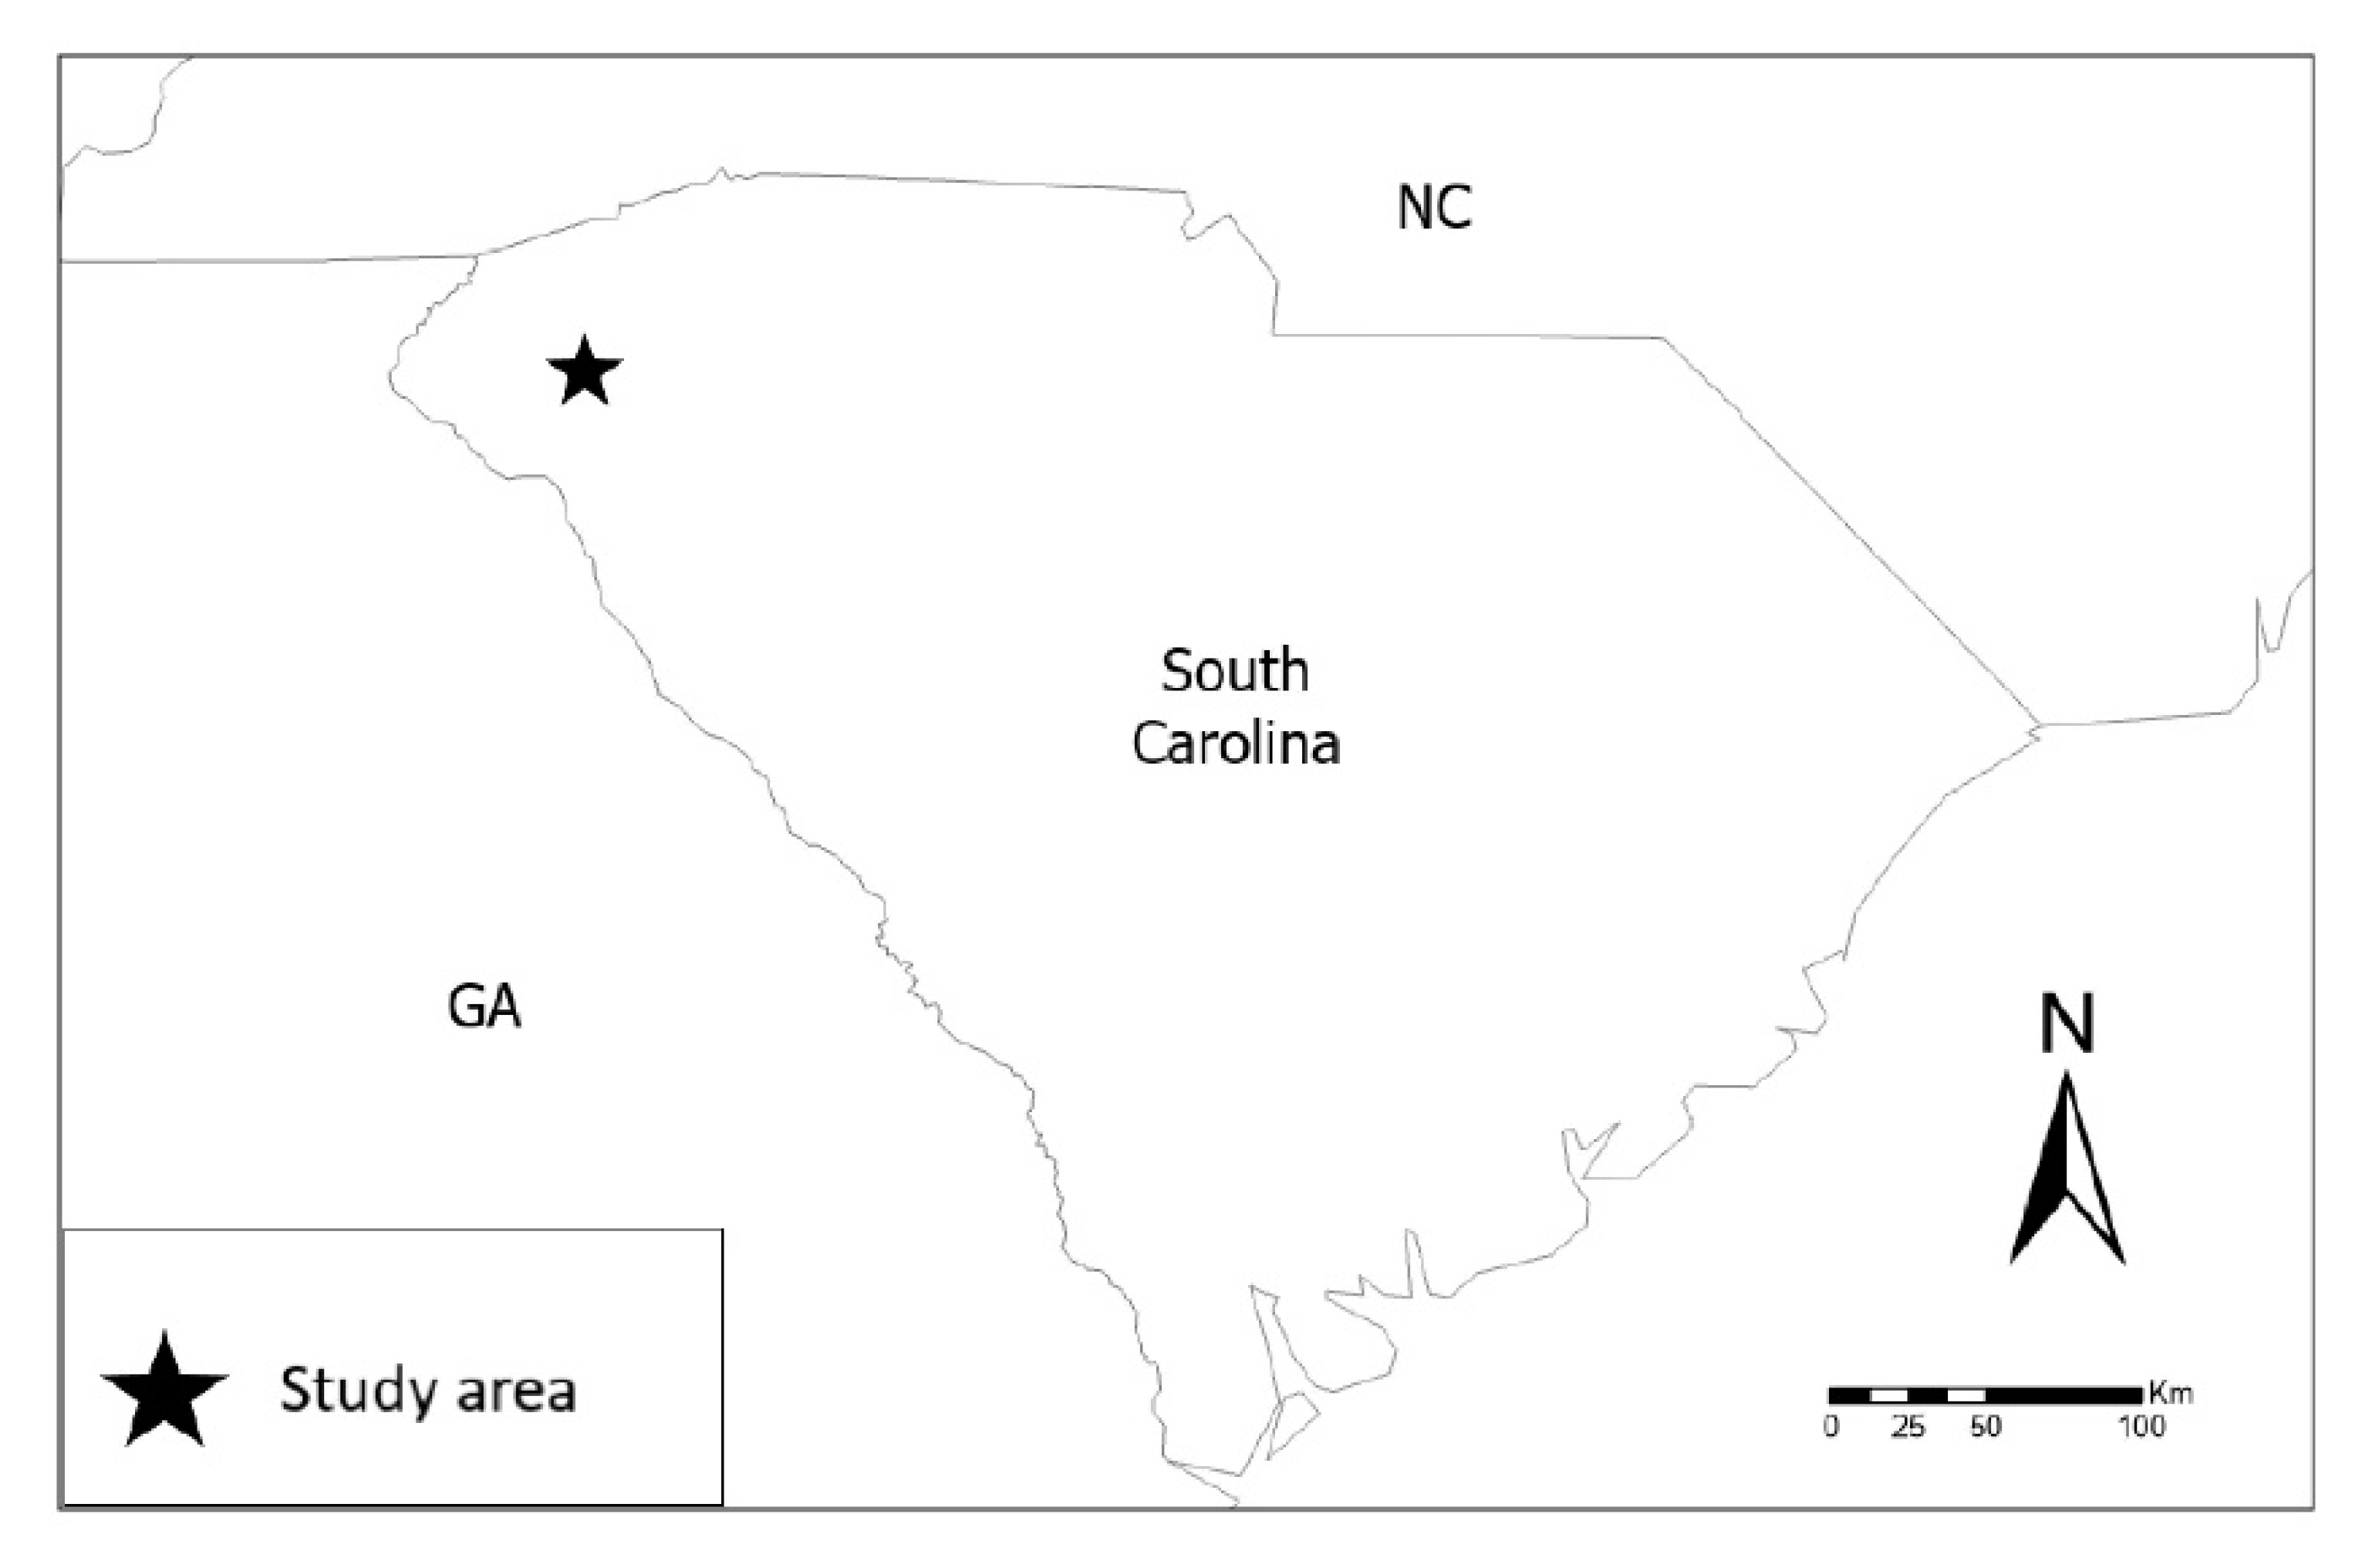
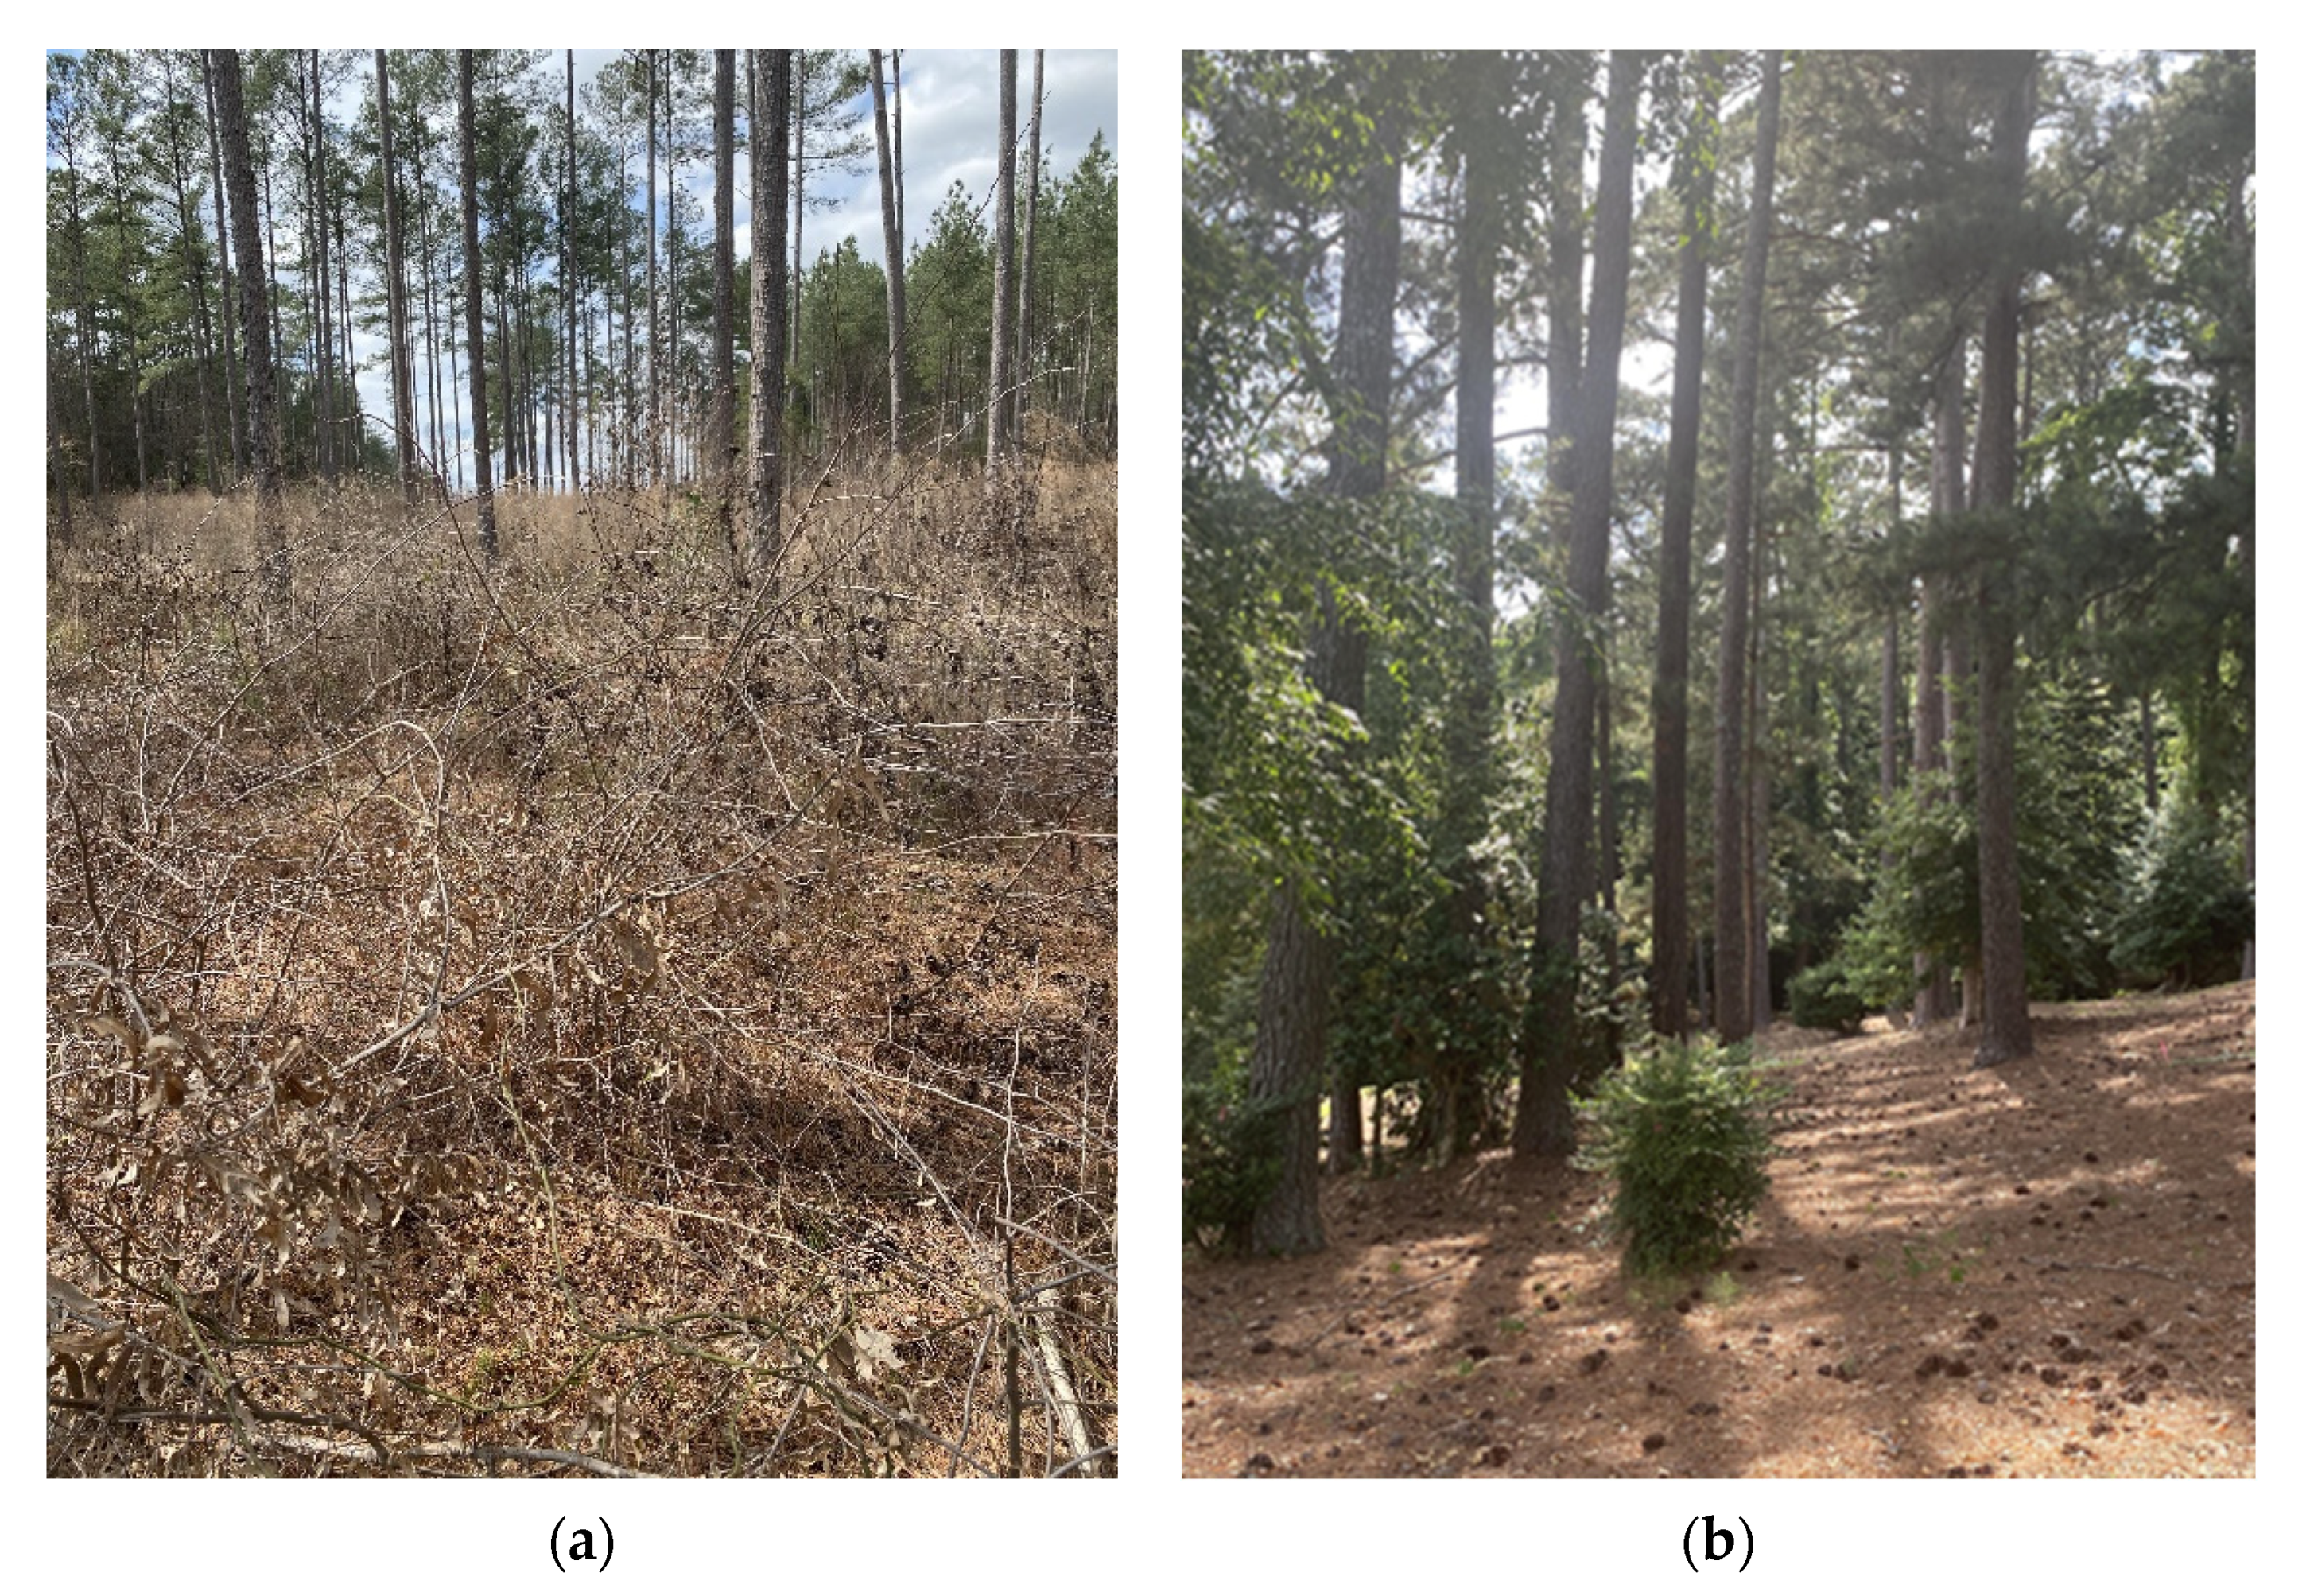
2.1. Study Area

The study areas comprised two different locations approximately 3.2 km apart. One site was a small, forested stand (N 34°40′27.0″, W 82°50′31.0″) located on the Clemson University campus; the second site was a managed forest stand located within the Clemson Experimental Forest (N 34°38′40.0″, W 82°48 36.0″). The Clemson Experimental Forest serves as a habitat for many bird species, more than 90 species of trees and numerous types of wildlife on 17,500 managed acres of land [18]. The resources of the forest are used to provide education, research, and recreation opportunities [18]. Both study areas are located in Pickens County, in the northwest portion of South Carolina, USA (Figure 1).
The study area in the Clemson Experimental Forest is part of a conventionally managed loblolly pine forest stand (Figure 2a, Table 1). The second study area on the Clemson University campus is a small forest stand and does not have regular silvicultural practices (Figure 2b, Table 1).

2.2. Field Measurements

Conventional field measurement results were used as a reference in this study because of their high accuracy; physical measurements are commonly accepted as ground truth. A tape measure was used to calculate the DBH of trees, and a laser distance meter (Auroland DTAPE DT50) was used to measure the distance between trees [19]. To calculate the DBH using a tape measure, the 1.30 m height above the tree base was determined first. Then, to measure DBH, the tape measure was wrapped around the tree at the 1.30 m height. The DBH of the tree was then determined by the formula:
d = C/π
where d is the diameter of the tree (DBH), C is the circumference of the tree, and π is 3.14.
When using a tape measure, it can be difficult for a single person to wrap the tape completely around a tree in one step due to the large diameter of some trees. Therefore, in these cases, measurements were made in two steps: (1) marks were placed on the average half of the tree circumference and the starting point, and (2) a measurement was made by wrapping the tape up to half of the tree circumference and then the second part was measured from the starting point.
The laser distance meter was used to determine the distance between trees with an accuracy of ±0.16 cm. This device, which can measure up to 50 m, can make reliable measurements when there is no obstacle in front of it. In cases where the distance between trees is high, it may not be possible to measure accurately with a tape measure. To measure the distance between two trees, the laser distance meter is placed adjacent to one of the trees, and the other tree was targeted. Laser light can be seen on the targeted tree.

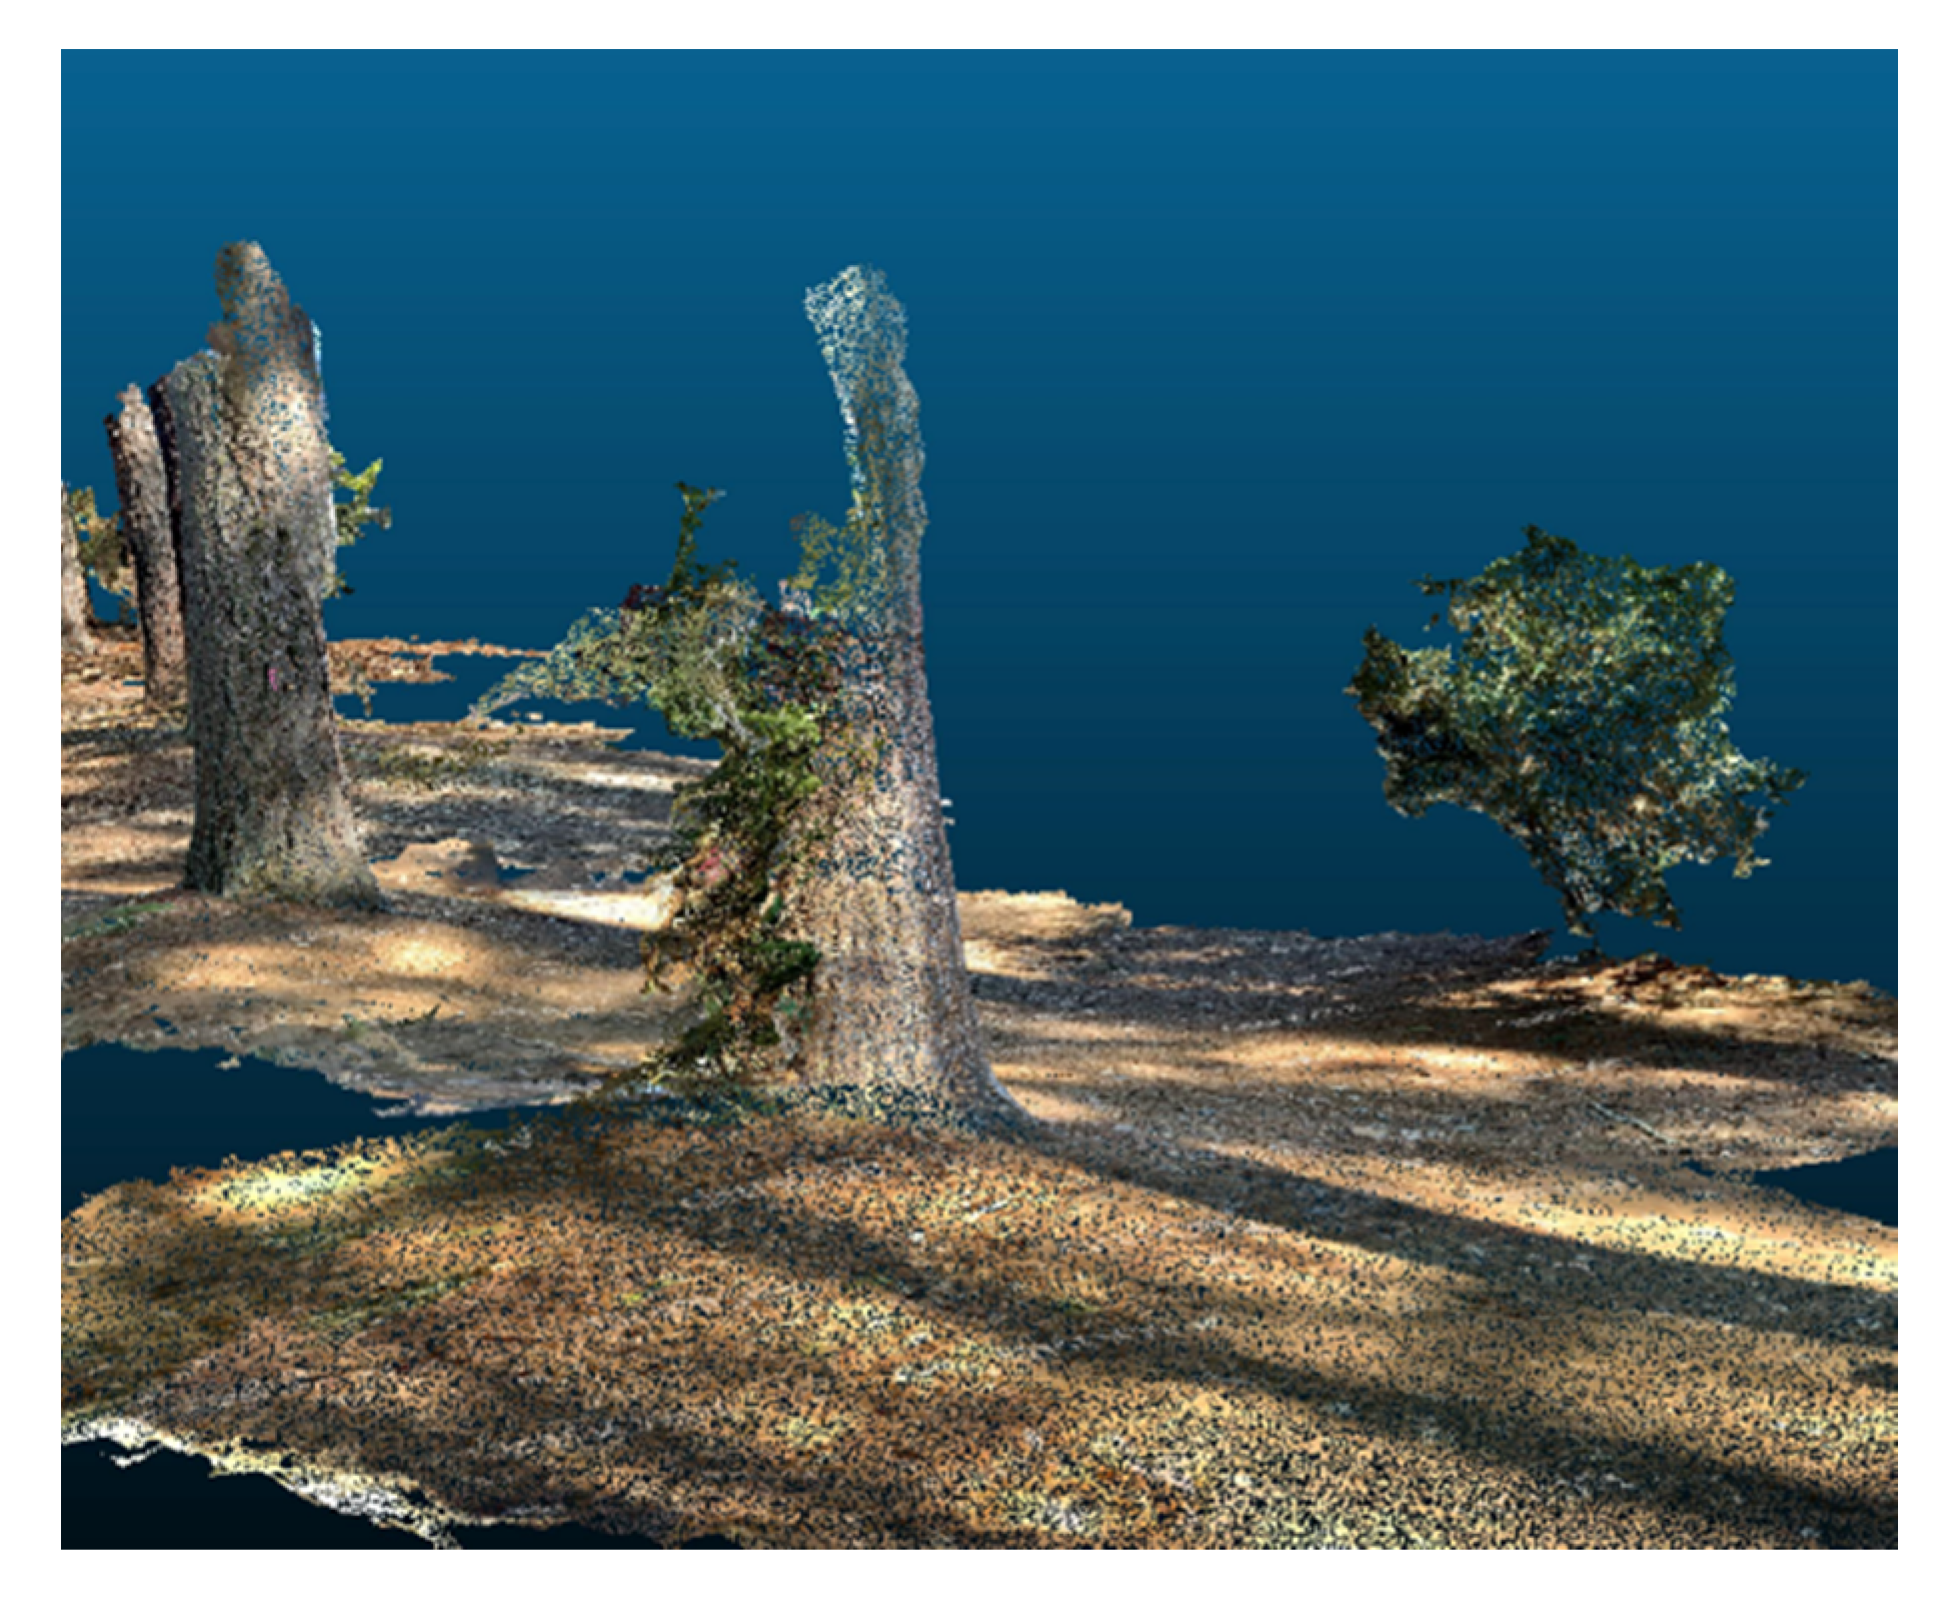
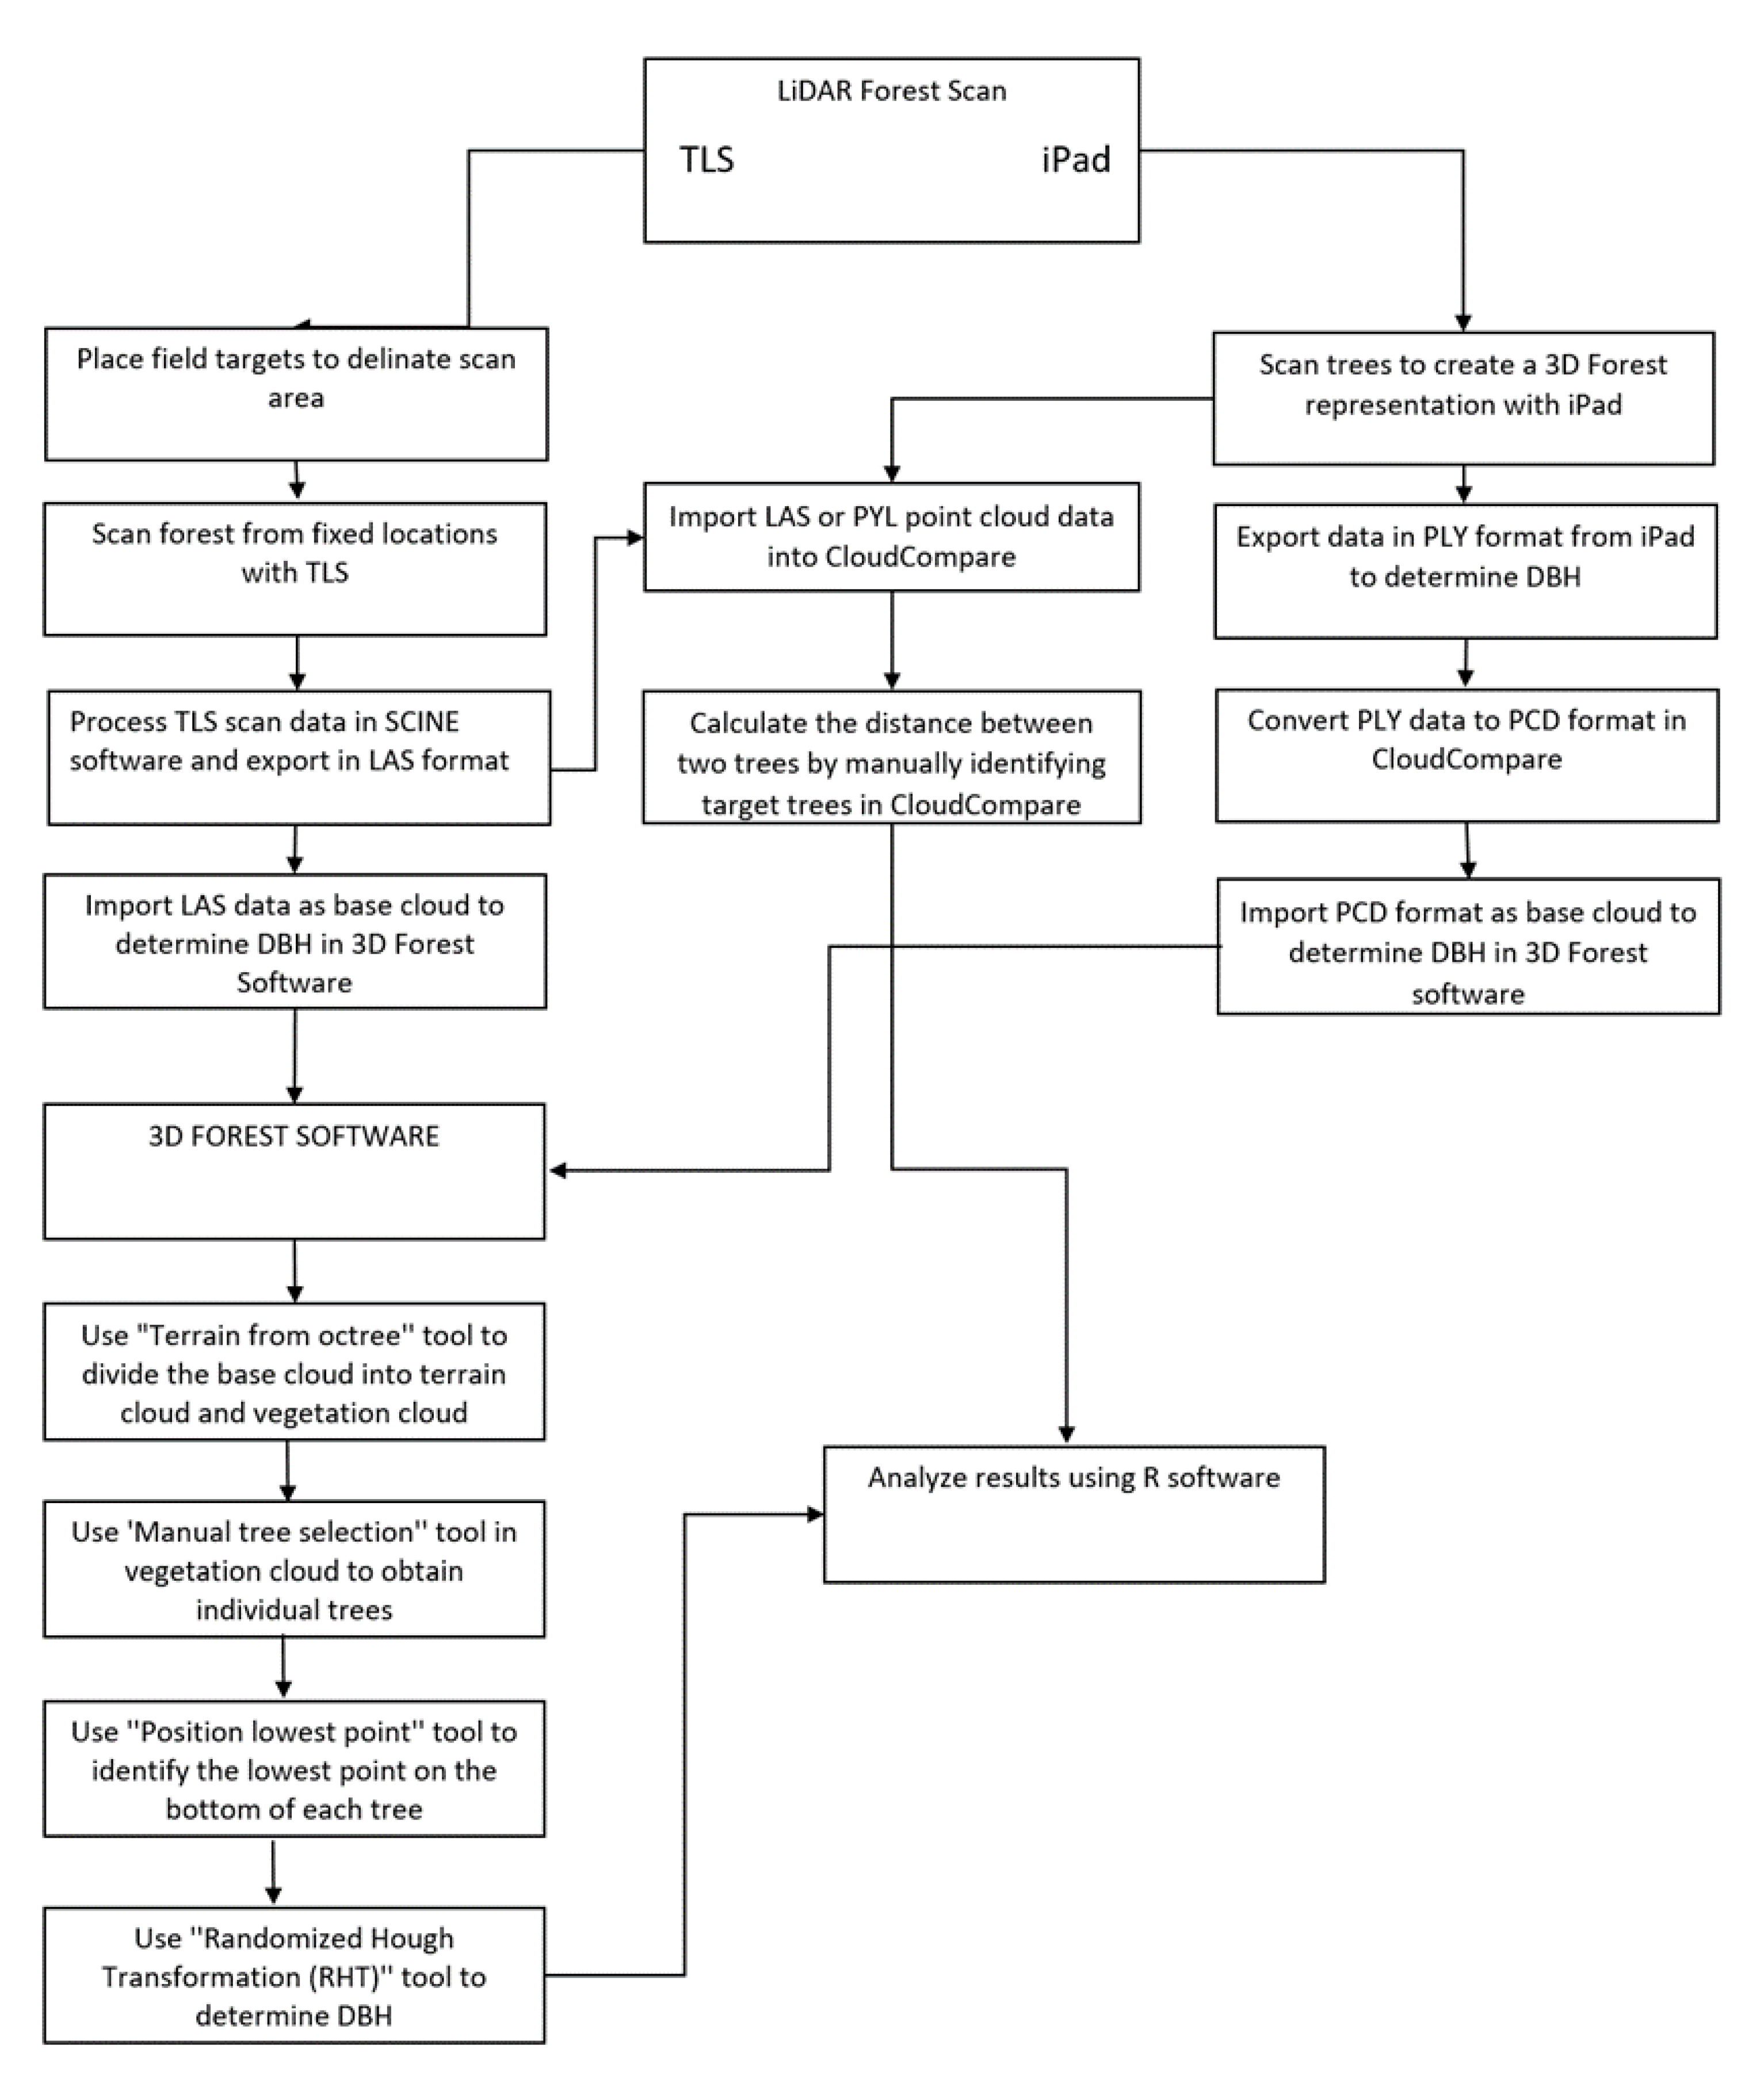
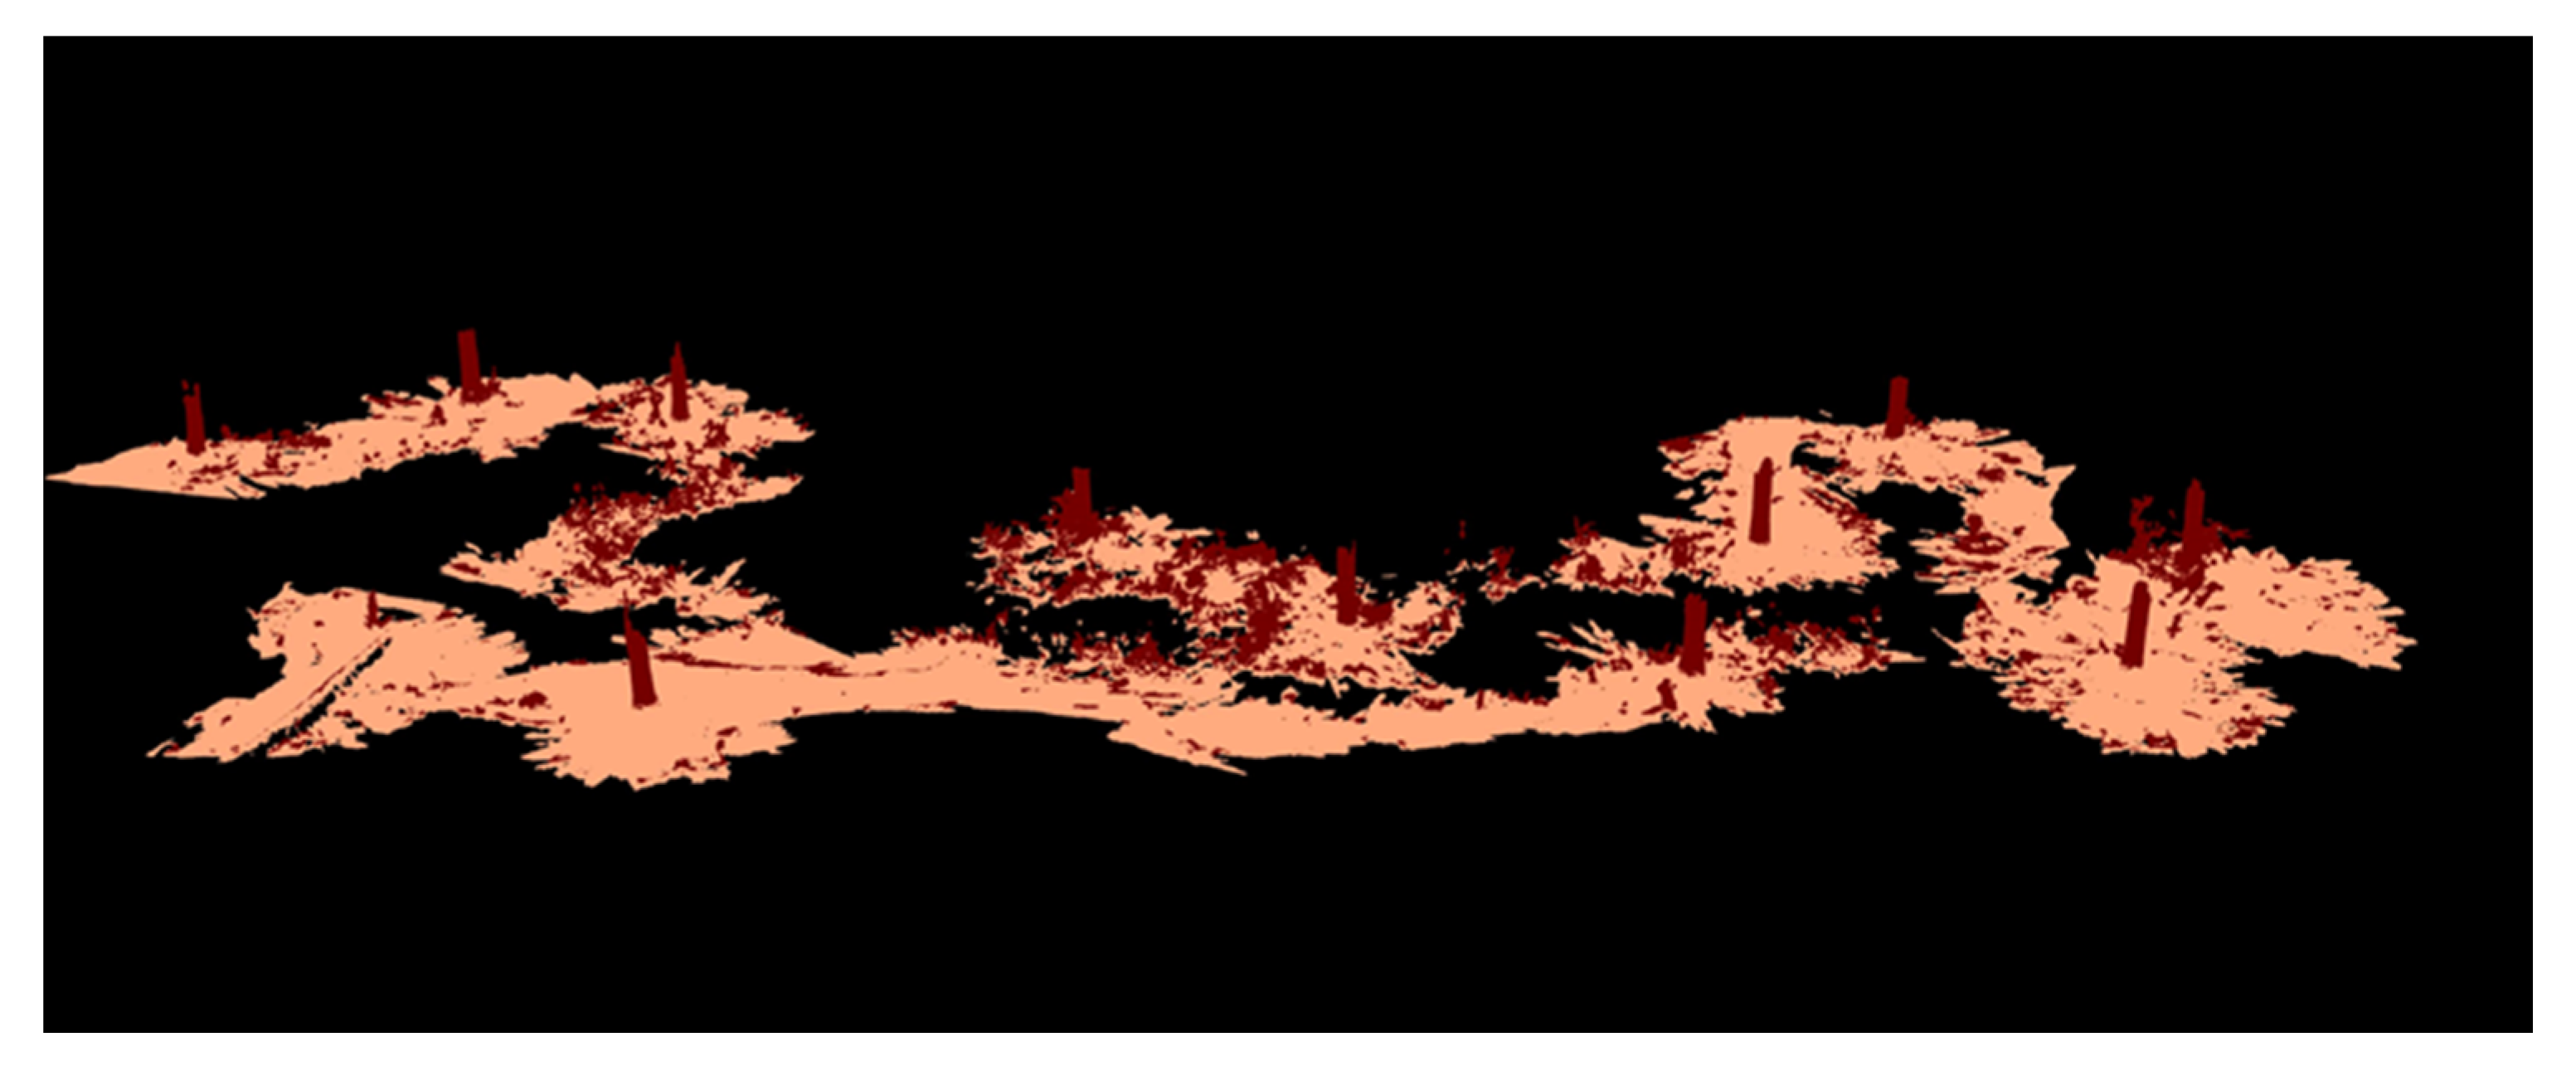
2.3. Forest Scanning

Two different LiDAR scanning technologies, and one standard measurement method were tested in this study, and each has different resource needs and scanning efficiencies based on the workflow (Table 2). Forest stands were scanned with a terrestrial laser scanner (TLS) FARO Focus m70 and an iPad Pro 2020 with an embedded LiDAR sensor to create a 3D model of their structure (Figure 3). LiDAR scanning of small forest stands using a standard iPad tablet and TLS was designed to determine if it is possible to scan such forest areas accurately and to measure tree DBH and the distance between trees. LiDAR technology is utilized in both the TLS and the iPad, but there are important differences in how the scanning devices were used. For example, before scanning with the iPad Pro, an optimized tree scanning plan was created. Each tree was scanned by walking around it; therefore, planning of the scanning order was important to ensure that each tree was scanned only once. In addition, when scanning with an iPad, it was important to follow the scanning progress by watching the iPad screen because the scanned parts of the tree had to be checked to ensure the tree was completely scanned. Depending on plot size and density of ground cover, dividing a plot with tape or reflective markers may be necessary to facilitate the scanning of an area to avoid confusion during the scanning process. Scanning with TLS works differently than with the iPad Pro, because TLS scans automatically (there is no need to walk around the trees). In addition, before beginning to scan with TLS, defining the study area boundaries made it easier to detect targeted trees in the study area because TLS has a 70-m range which meant it automatically scanned some trees that were outside the study area (Figure 4). Natural objects (fallen trees, half-trees with broken tops, etc., in the study area) and other objects (larger than 25–30 cm) were used as signs to determine the boundaries of the study area and to detect targeted trees. Alternatively, reflective targets could have been used to help delineate the TLS scan area.

2.3.1. iPad Pro 2020 with LiDAR Sensor

The iPad Pro 2020 incorporates a LiDAR sensor for the first time [20], and it has the important feature of being able to scan in outdoor environments. LiDAR technology is typically only available in scanners costing tens of thousands of dollars or more; the incorporation of a LiDAR scanner into a handheld consumer tablet makes it cost-effective to evaluate LiDAR technology for wider adoption in forest characterization efforts.
The iPad Pro LiDAR sensor is a 3D time of flight (ToF) sensor that is designed to work at short distances and scan small objects [20,21]. The LiDAR sensor in the iPad appears to have a range of up to 5 m. In addition, many of the expected application areas of the LiDAR sensor are still under development. For example, with the addition of LiDAR to the iPad, software developers predict that some applications being developed by Apple Inc. will be related to LiDAR, such as “Measure app,” and some applications to be created in the future will also be related to LiDAR technology [22]. One of the most important focus areas is likely around iPad LiDAR technology-supported augmented reality (AR) applications on iPhones and iPads that allow for the measurement of environments in 3D so they can be included in AR applications [22,23]. AR applications can incorporate a global positioning system (GPS) to detect device orientation and localize the user’s location as well as machine vision, object recognition, and motion recognition technologies [23].
The new iPad LiDAR sensor has limitations because of its size and functional capabilities. The LiDAR sensor can scan objects up to 5 m away but may not successfully scan the objects if they are smaller than 10 cm.

2.3.2. Applications Used for Forest Scanning

The Forge application (Abound Labs, Inc., New York, NY, USA) was installed on the iPad Pro 2020 tablet to collect the LiDAR ranging data and create the 3D forest model by scanning trees in the study area. The Forge application is currently under development, so the Forge–LiDAR 3D Scanner is only available for iPhone and iPad but is being upgraded to use new LiDAR sensors available on these platforms. In this study, version 1.1.0, updated on May 6, 2021, was used. Using the Forge application on an iPad, it took an average of 8–9 s to scan one tree during the test, depending on the accessibility of the area around the trunk base. The data obtained were exported from the Forge application in PLY format. The PLY format is a 3D point cloud that includes color and transparency, surface normals, texture coordinates, and data confidence values. Although Forge was usually successful at scanning the trees, it did have some issues. For example, the iPad can scan a tree trunk ranging from the ground to approximately 3 m above the ground; however, it is not possible to scan above this height because the image of the tree in the Forge application gets broken. Although this problem does not impact the accuracy of the DBH value (taken at 130 cm above ground height), it does make the 3D forest image appear to be disjointed because the areas above and below 3 m of the tree trunk appear separated from one another, and the lower portion may not appear to have contact with the forest floor.

2.3.3. Forest Field Scanning with iPad Pro 2020 Forge Application

Creating a 3D map of a forest is necessary to calculate the DBH of trees and the distance between trees. Care was required during the scanning process because by re-scanning a previously scanned tree from 5–6 m away, the Forge application could identify it as a new tree and scan it as if it were two different trees (Figure 5). With the limited range of the LiDAR sensor in the iPad Pro 2020, as noted previously, it was not possible to scan the entire trunk of a tree with the tablet sensor (Figure 6). However, scanning up to 130 cm in the height of the trees was sufficient to obtain the DBH. A critical part of the scanning process was to view scanned trees in the Forge application to determine unscanned trees in the forest. Some factors, such as ground vegetation and slope, made it difficult to walk in the forest and more difficult to walk around the tree to scan it. In most instances, it took an average of 9 s to scan each tree. In some cases, thorny shrubs around trees interfered with the correct scanning of the tree and could have resulted in a high error rate, making a repeat scan necessary. Additionally, the distance between the trees was one of the most important factors related to overall forest area scanning time because having large gaps between trees increased the required time.
As previously stated, the range of the LiDAR sensor did not exceed 5 m. Additionally, scanning from very close distances, such as 20–30 cm, required excessive time to scan a tree. Therefore, the optimal scanning distance was 1–2 m from each tree, if possible, given the forest conditions. In addition, it was important that there were no obstacles, such as branches or bushes, between the sensor and the targeted tree because these objects could prevent an accurate scan. This problem was encountered frequently, especially in the urban forest area. The sensor is not well suited to detecting objects smaller than 10 cm. Therefore, if the target tree’s DBH was less than 10 cm, the tree might not be accurately scanned by the LiDAR sensor. Using a smooth scanning motion was important because sudden movements of the iPad direction could cause a break in the 3D image.
With the iPad Pro, the number of trees that were scanned could be determined by watching the iPad screen during the scanning process (Figure 7). Scanning the targeted trees with the iPad was generally straightforward and did not require any special training. The biggest factor that made scanning difficult was the walking conditions in the study area. Using the iPad to scan forest trees requires the ability to walk around most of the tree trunks. If the forest understory has thorns, bushes, tall grasses, etc., it becomes physically difficult to walk around and between individual trees, making the scanning challenging in some forest conditions. The Forge application typically processed the scanned data within 1–2 min, which was subsequently saved to the iPad, and it then became available for export.

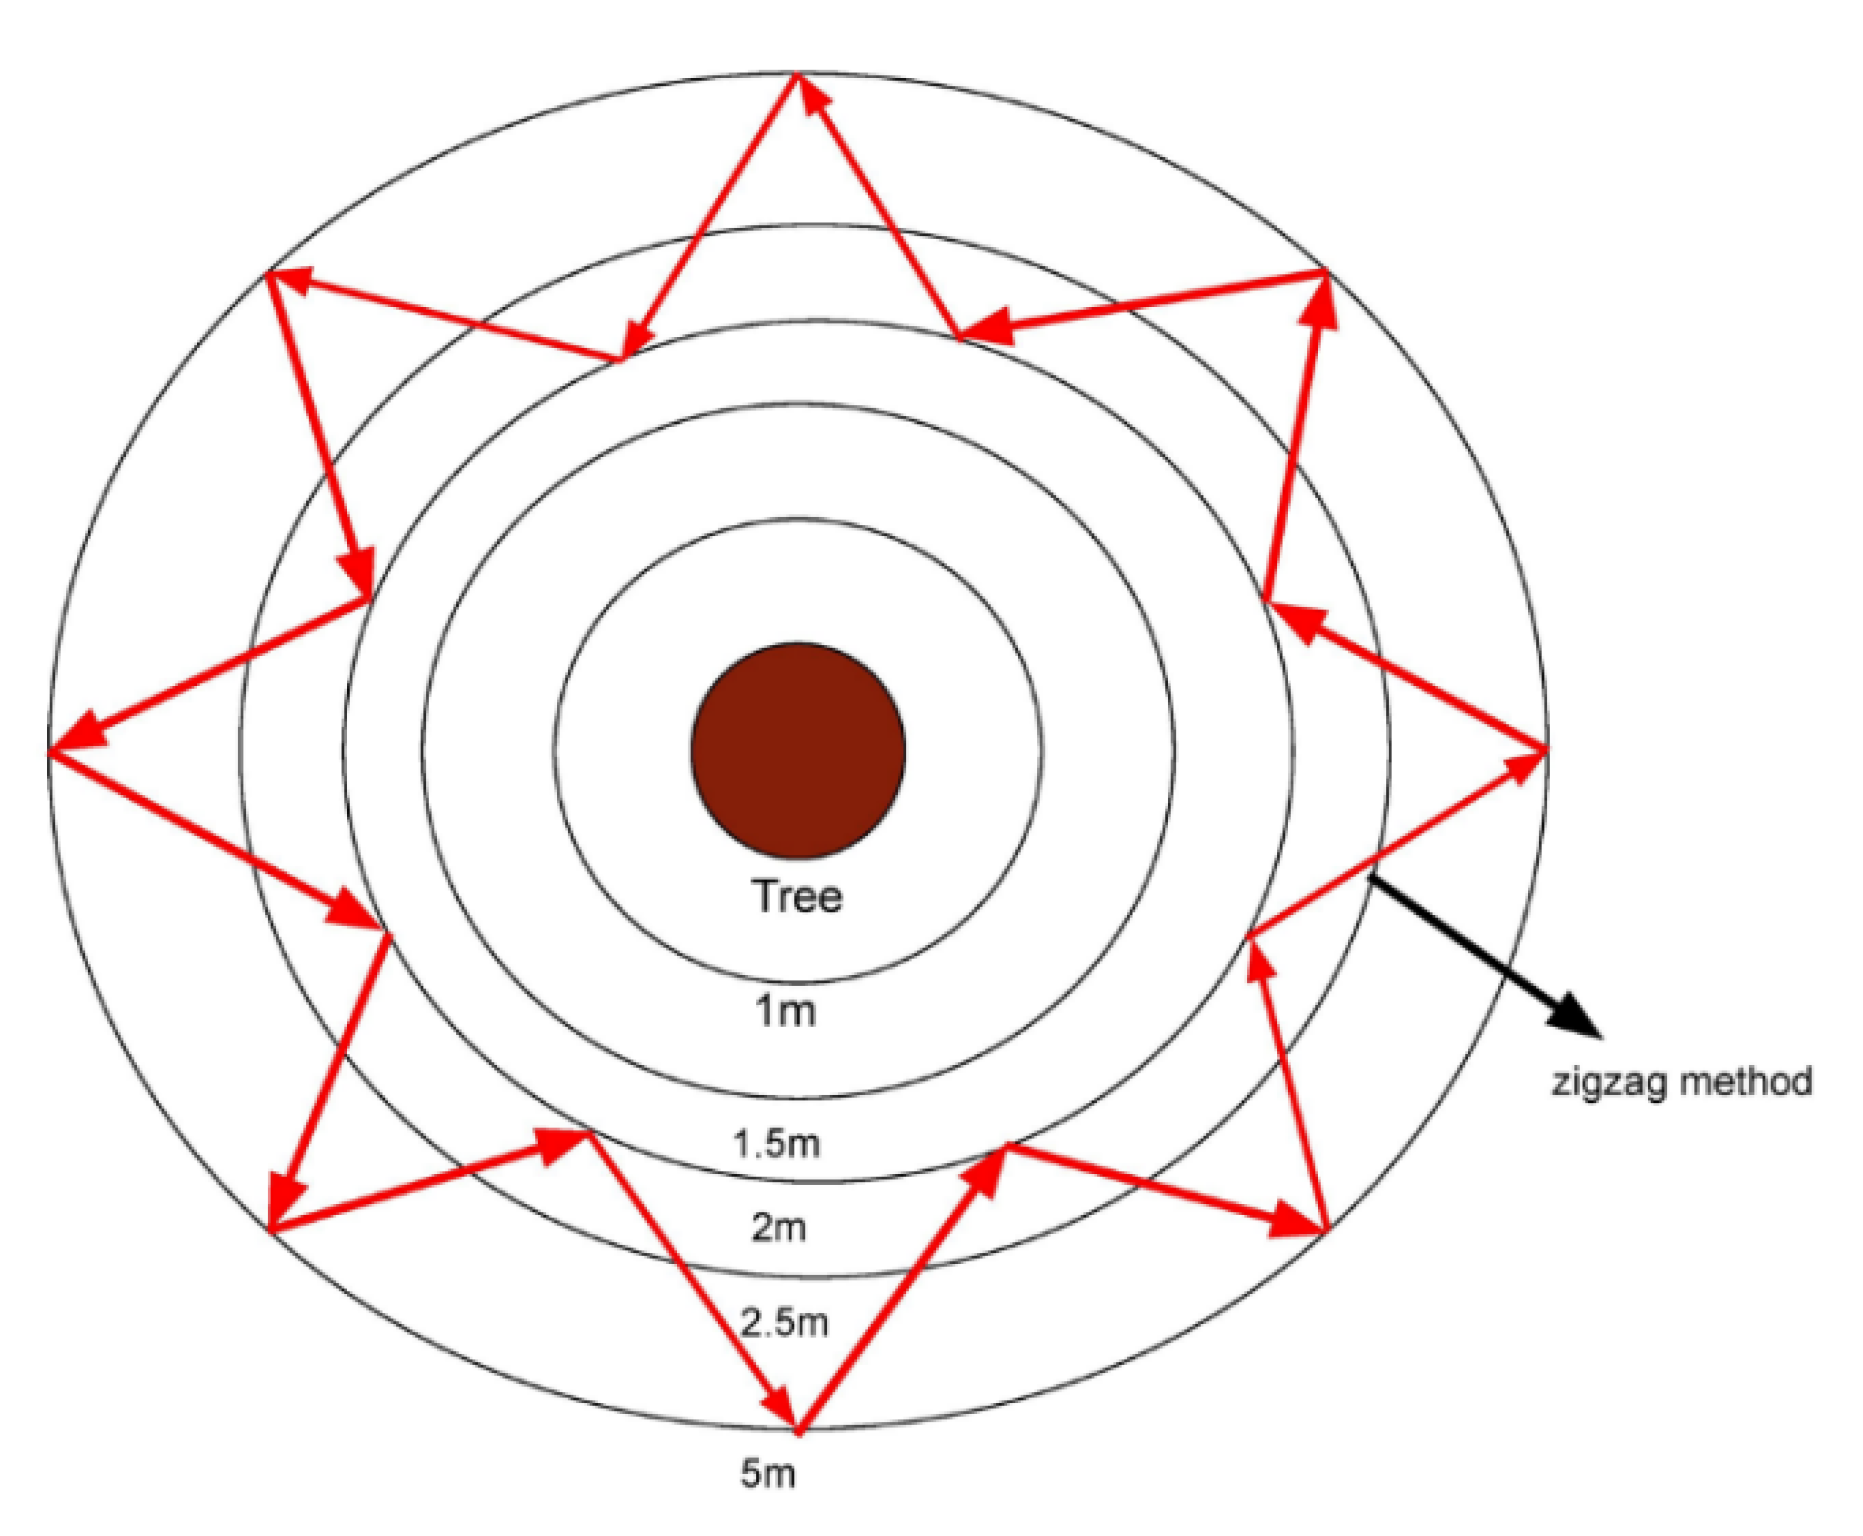
2.3.4. Scanning a Tree with Forge from Different Distances

When scanning with the iPad, the scanning distance of the tree generally varied between 1–3 m, but it was not clear if the accuracy varied with scanning distances. To help understand if there was a relationship between DBH calculated from the scans and scanning distance from the tree, a single pine tree in an open environment was scanned with the iPad from different distances (Figure 8).
Five different scanning distances and an additional scanning method (by zigzagging between 2 m and 5 m) were tested. Scanning distances of 1, 1.5, 2, 2.5, and 5 m were tested using a laser distance meter to accurately determine consistent distances from the tree. Three scans were made at each distance, and the average of 3 scans was used to estimate accuracy. To test the varying distance, a zigzag path was used for scanning by varying the distance between 5 m to 2 m from the tree.

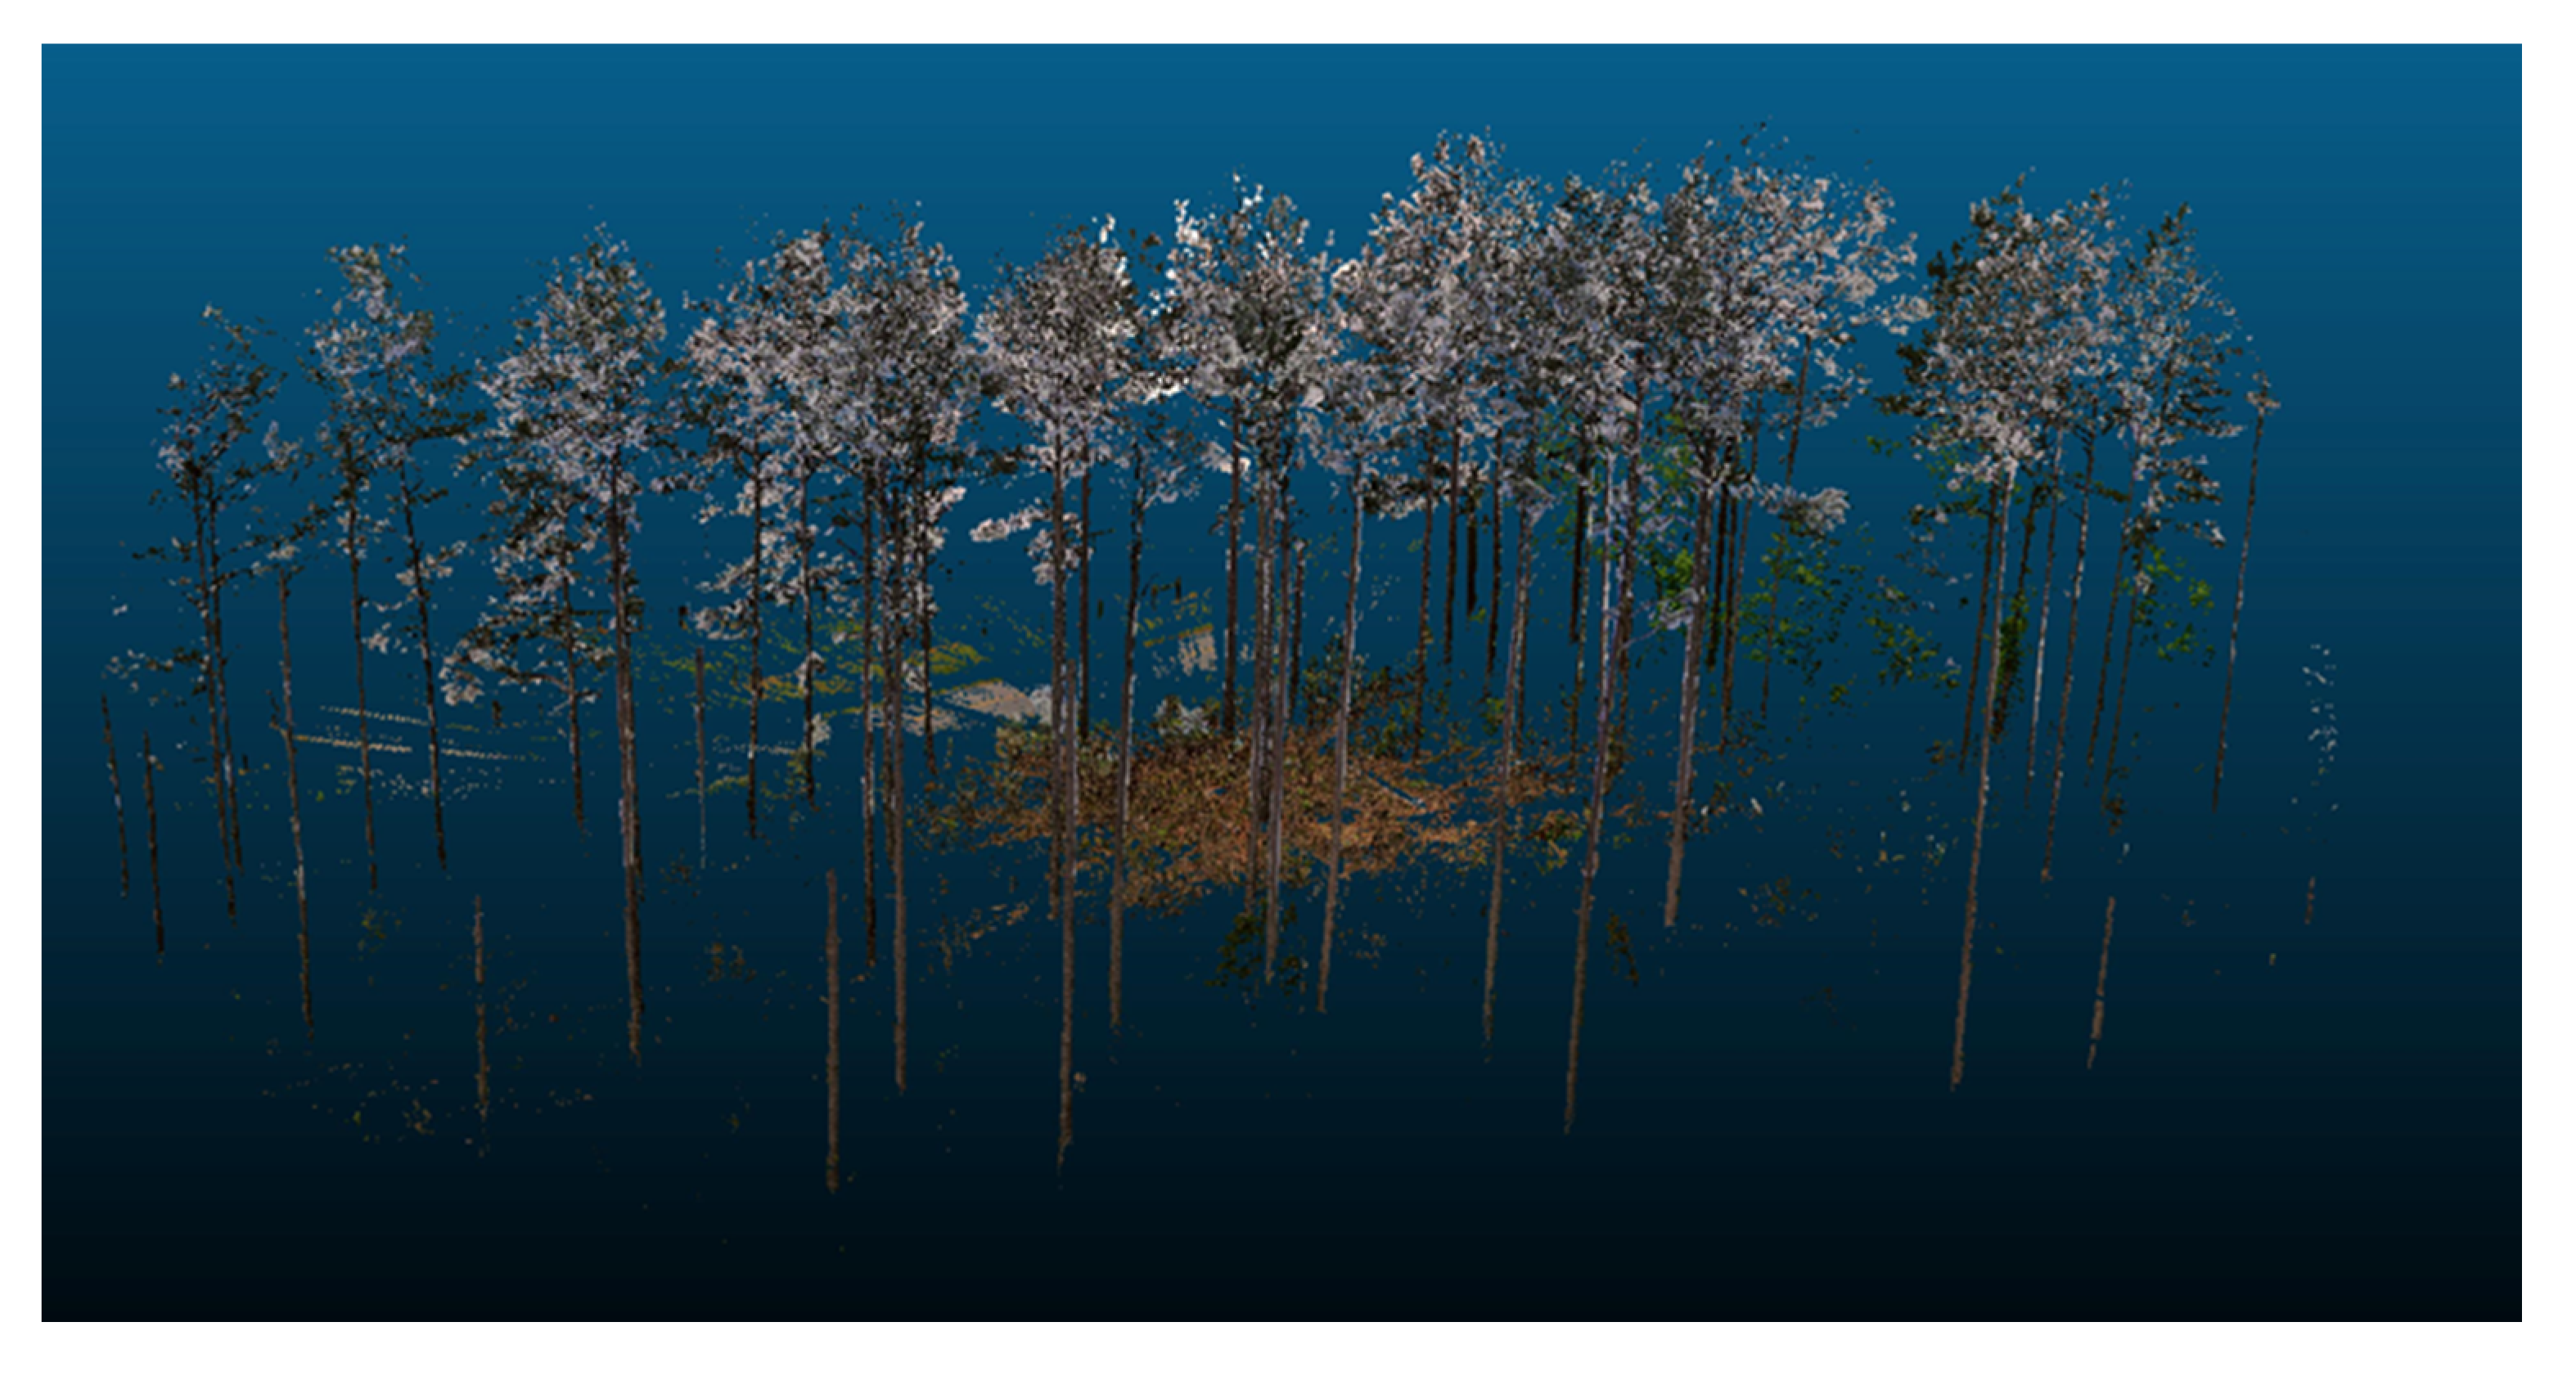
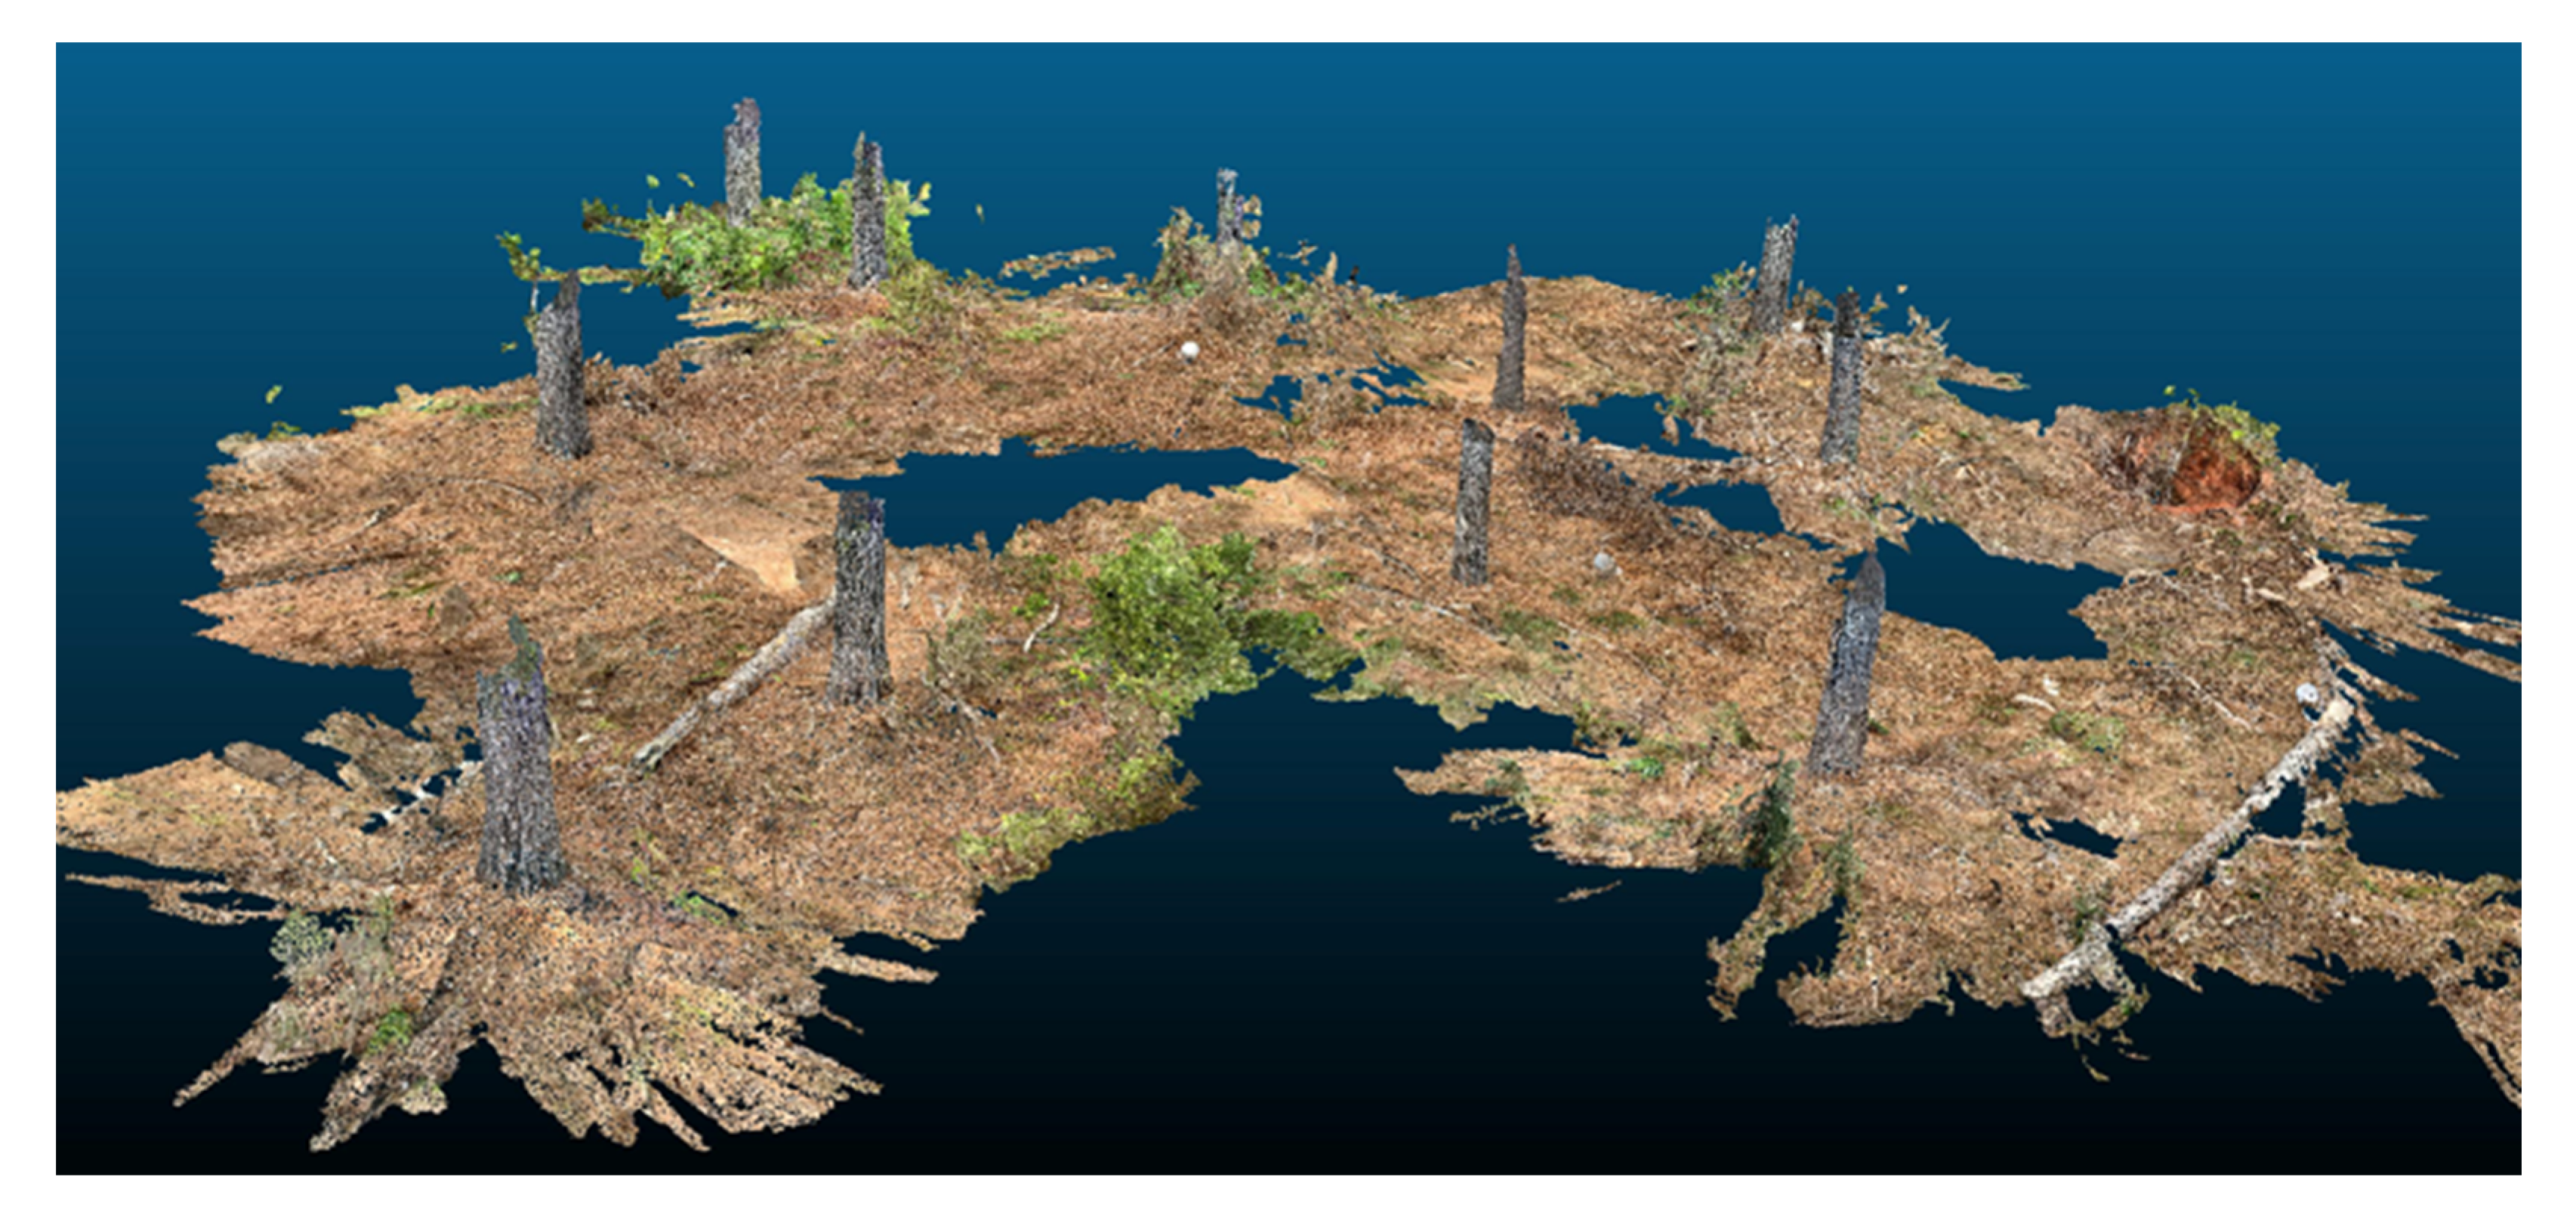
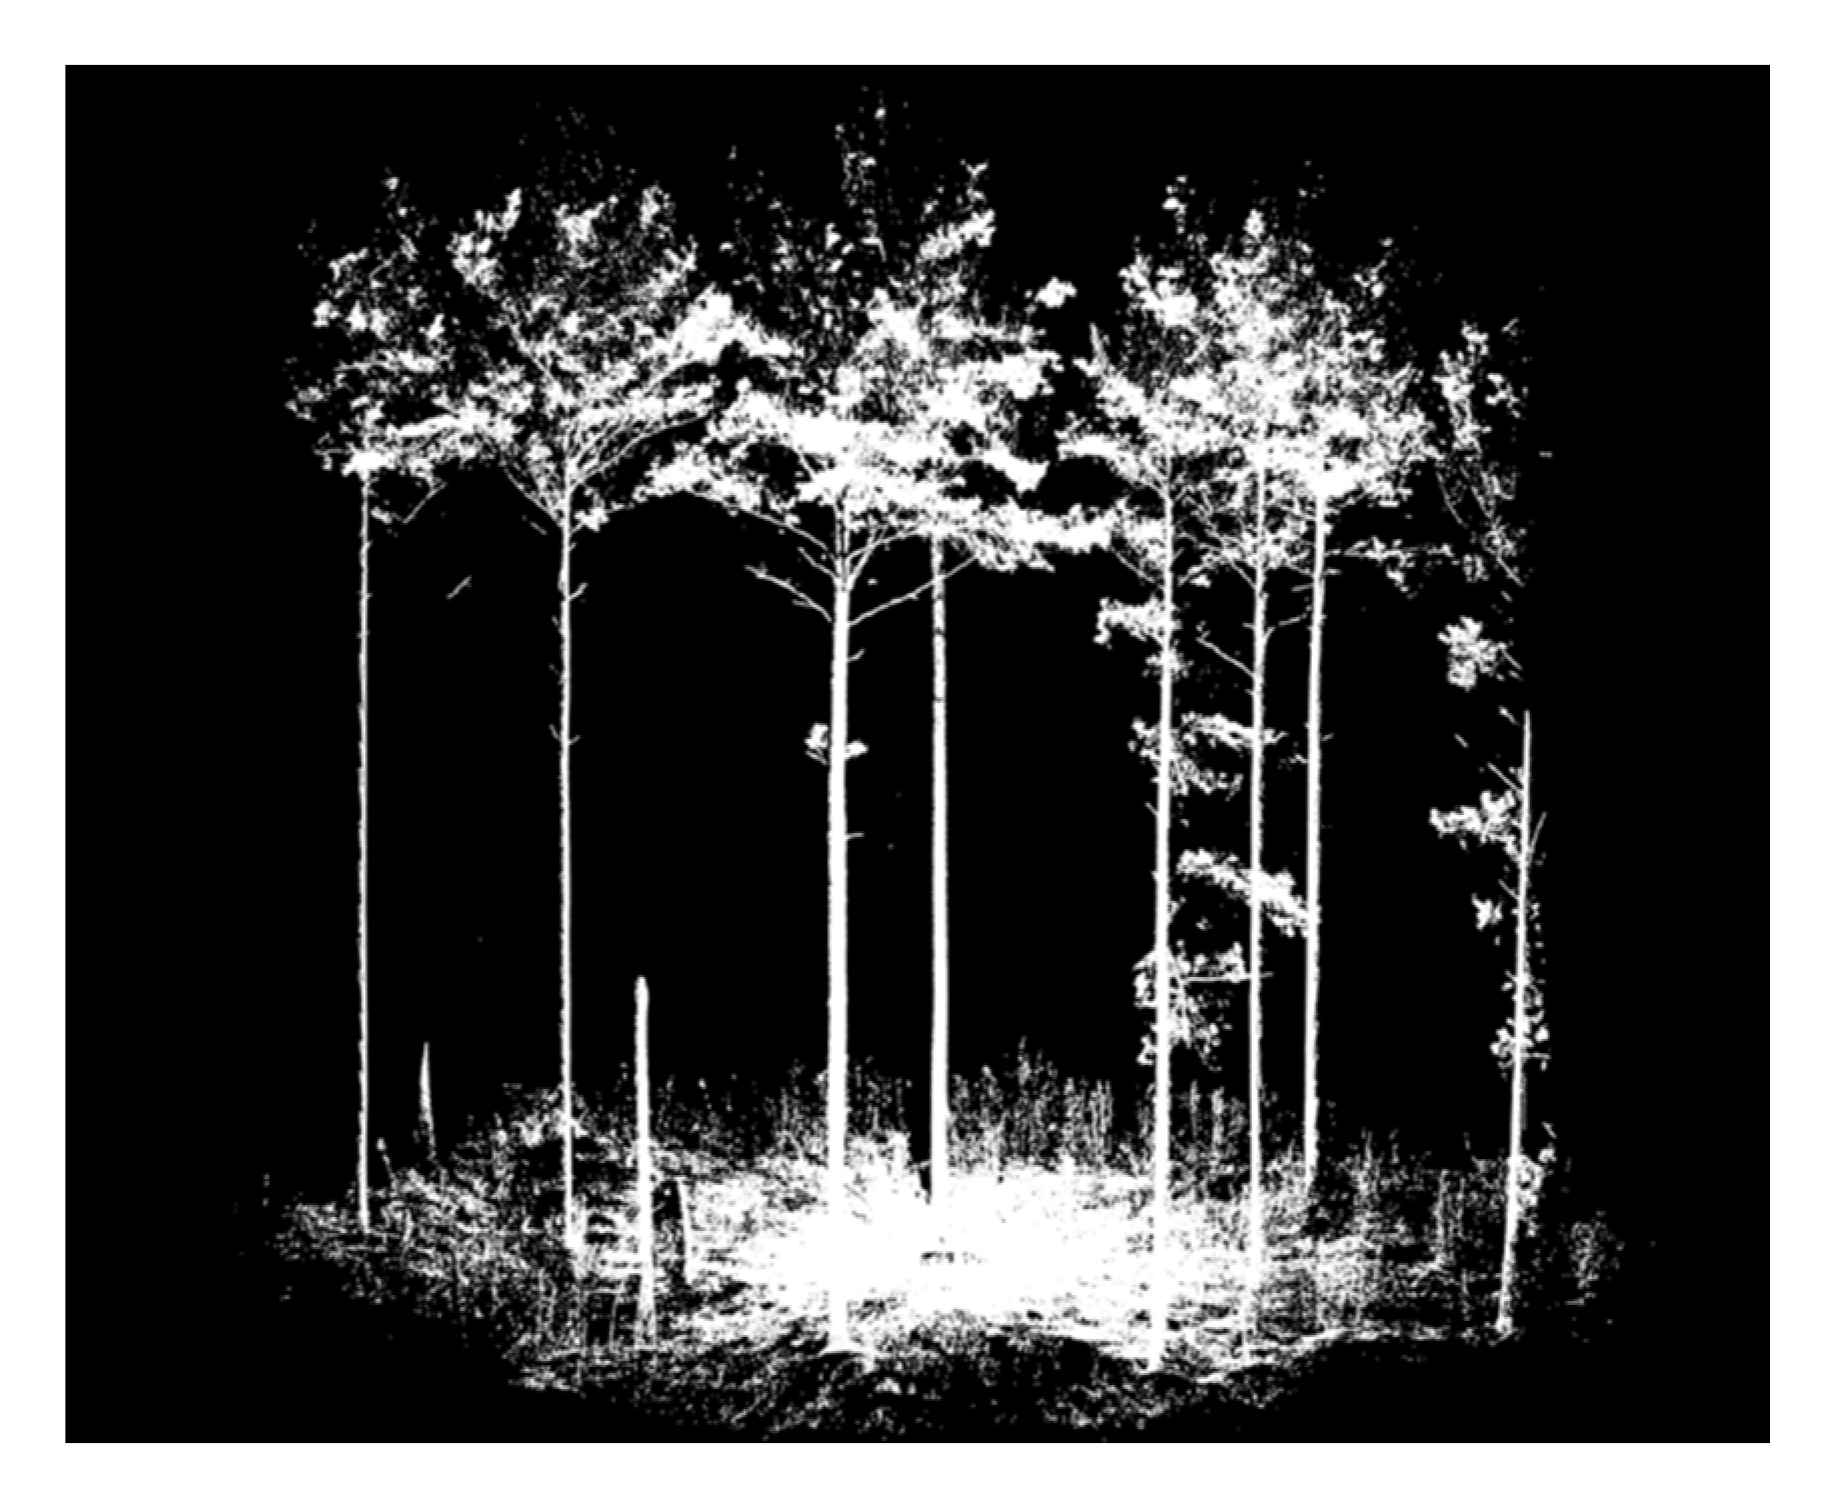
2.3.5. Terrestrial LiDAR Scanning (TLS)

A TLS FARO Focus M70 high-speed 3D laser scanner was used to compare against the iPad LiDAR technique. The TLS scanner is portable, scans from a fixed location, and its scanned data can be easily exported [24]. Terrestrial LiDAR scanning technology has been used often in large forest areas. Similar to the iPad LiDAR scan, the focus of the TLS data was to assess the accuracy of scan-derived DBH and the distance between trees. This type of TLS technology is used by many researchers and is generally accepted as an accurate method for measuring forest parameters [8]. Therefore, comparing TLS with iPad and taking field measurements helped determine the relative accuracy of the iPad LiDAR sensor compared to the standard TLS technique.
Before starting to scan with TLS, setup was required. First, the site was evaluated, and three scanning positions were determined to capture the area of interest. Four white spherical targets were then placed in different locations to define the boundaries of the study area and to locate the scanned trees more easily (at least three were sufficient to be captured by TLS in each scan). The FARO scanner tripod was installed at each scanning location, and the scanner was attached to the tripod. After the scanner was started, the tripod needed to be stabilized. The built-in level inclinometer was used to stabilize the tripod. This TLS device has an approximate range of 70 m. The long-range was not always an advantage because it scanned untargeted trees and other non-target objects in the study area, therefore the date required editing to filter out these objects. A scan was made from each location, for a total of three scans from three locations which were located approximately 35–40 m from each other. Forest trees were typically as close as 3 m to the scanner in each scan position. Each scan took about 11 min (33 min in total for three scans). After the first scan was completed, the TLS was moved to the previously determined second and third positions. All operations were repeated in the second and third locations, just as in the first scan. Scanning was carried out from three different locations to find the optional angle with most tree trunks visible in the point cloud. One of the three scans was found to have the best overall forest representation, but the other two scans were also used to determine the DBH of a few trees because the primary scan did not have a sufficient point cloud to determine DBH for these trees. The scans were not combined for analysis, which may have limited the accuracy of the related point cloud measurements.
After the areas of interest were scanned, SCENE software (FARO Technologies, Inc.) was used to process the data. After processing, the results were exported in LAS format from SCENE to the 3D Forest software and CloudCompare. In the 3D Forest software, the DBH of the tree clouds was determined using the LAS data. CloudCompare was used to measure the distance between trees. The processes performed are explained under separate headings below.

2.4. Calculating Tree DBH and Distance between Trees

Two different software applications, 3D Forest and CloudCompare, were used to process the point cloud data, calculate tree DBH and estimate the distance between trees. The 3D Forest software (version 0.51) was developed in 2010 at the Department of Forest Ecology at the Silva Tarouca Research Institute in collaboration with the Department of Geoinformation Technologies at Mendel University in Brno in the Czech Republic to acquire and process 3D point cloud data (“3D Forest software”) [25,26]. CloudCompare is an open-source point cloud processing software (version used 2.12 alpha) that was developed in Ireland in 2012 (“CloudCompare software”) [27]. The DBH of the trees (both iPad and TLS data) was determined using the 3D Forest software package, and the distance between the 3D trees was calculated using CloudCompare. In 3D Forest and CloudCompare, the same operations were performed separately on the data, including both the iPad 3D forest structure and the TLS 3D forest structure (Figure 3).

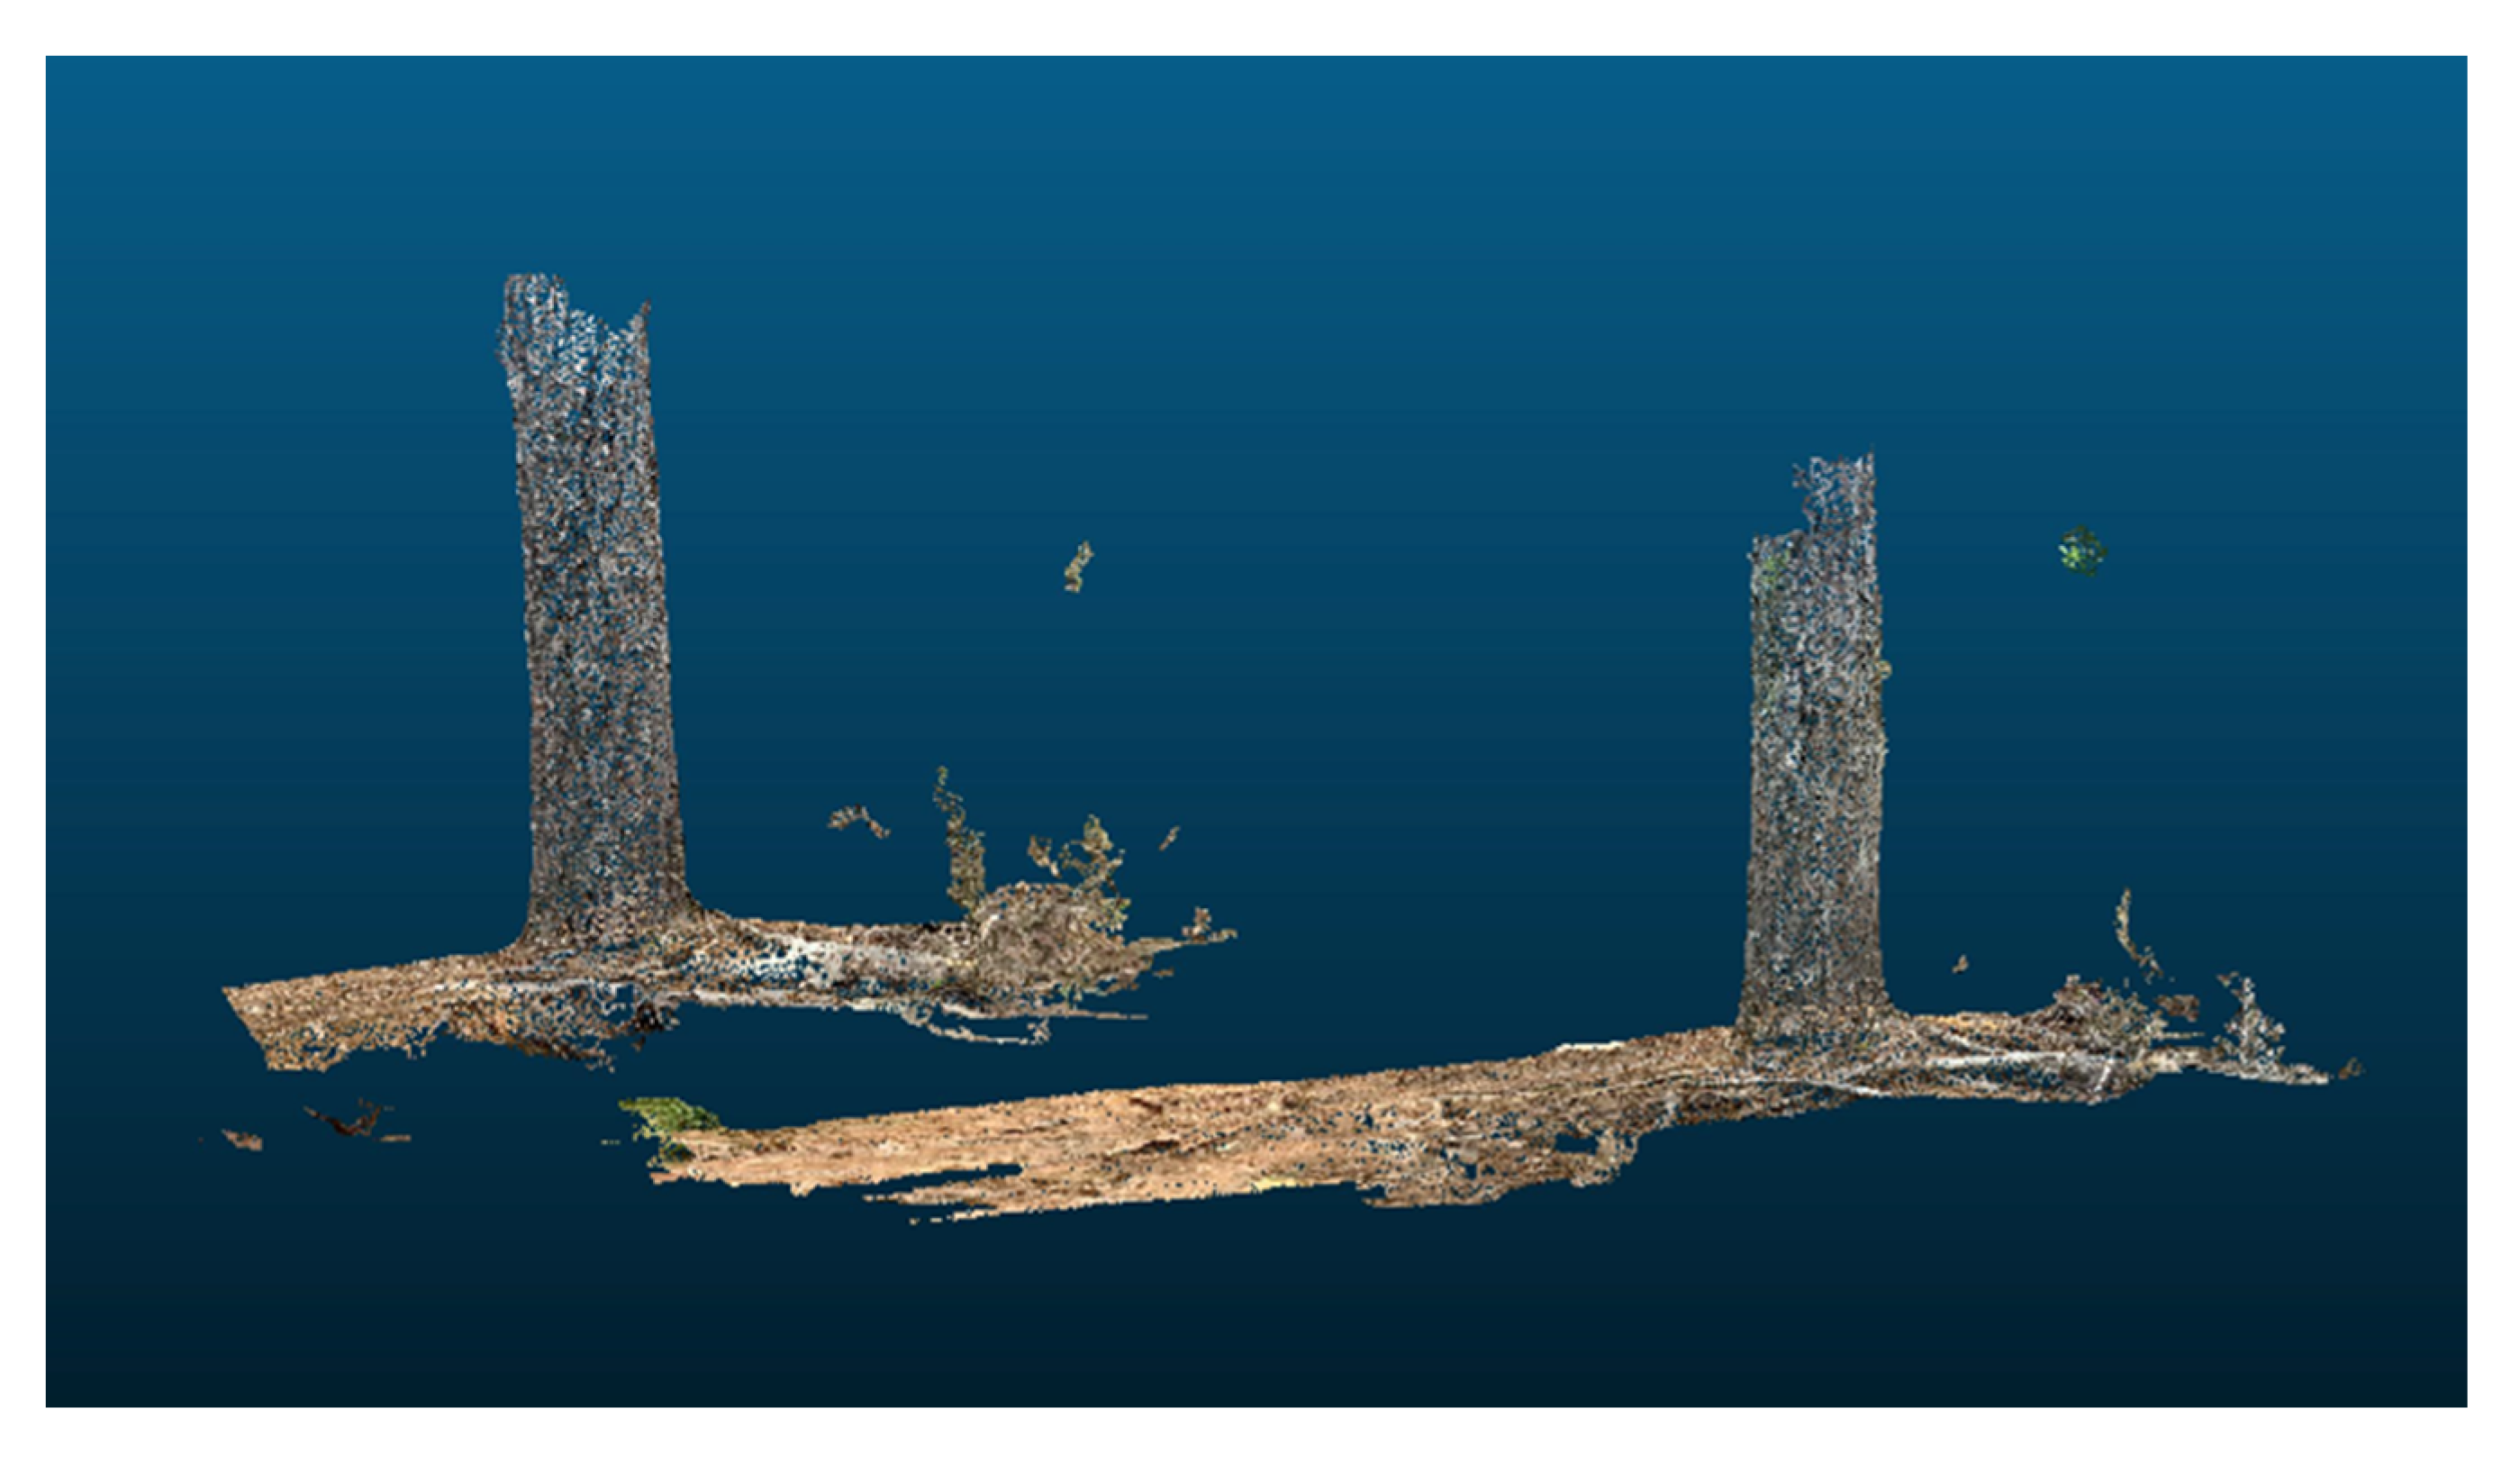
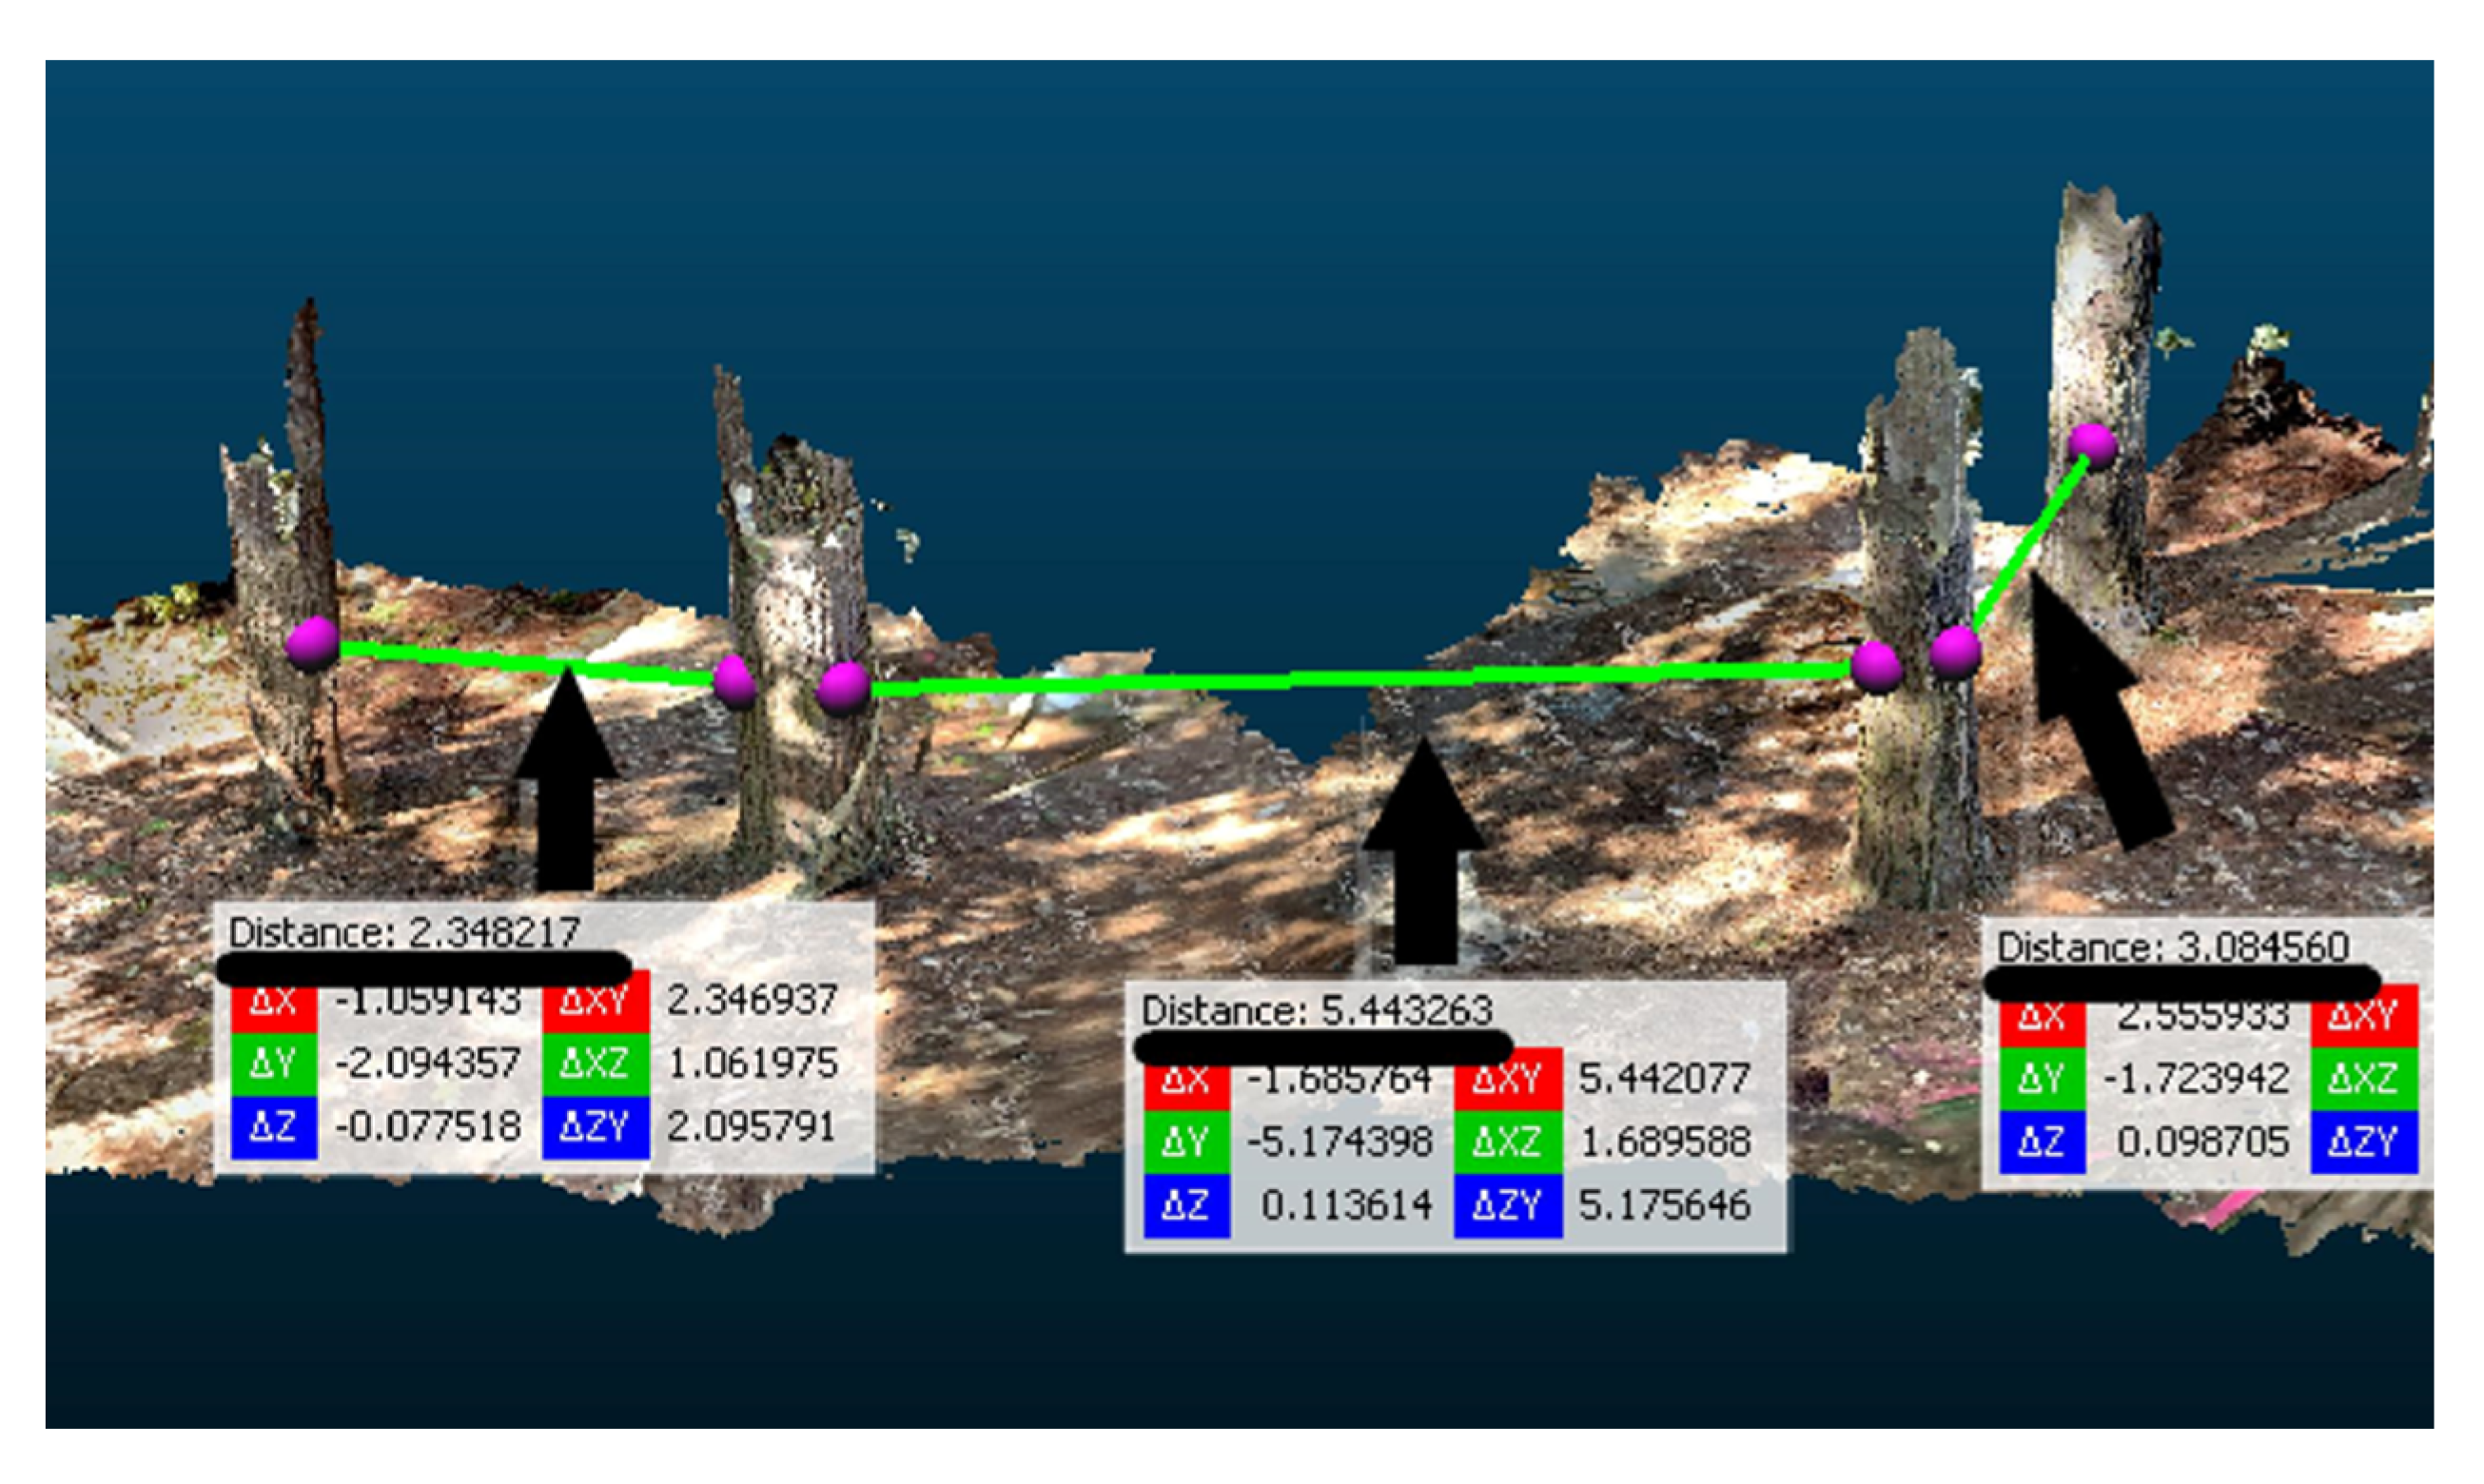
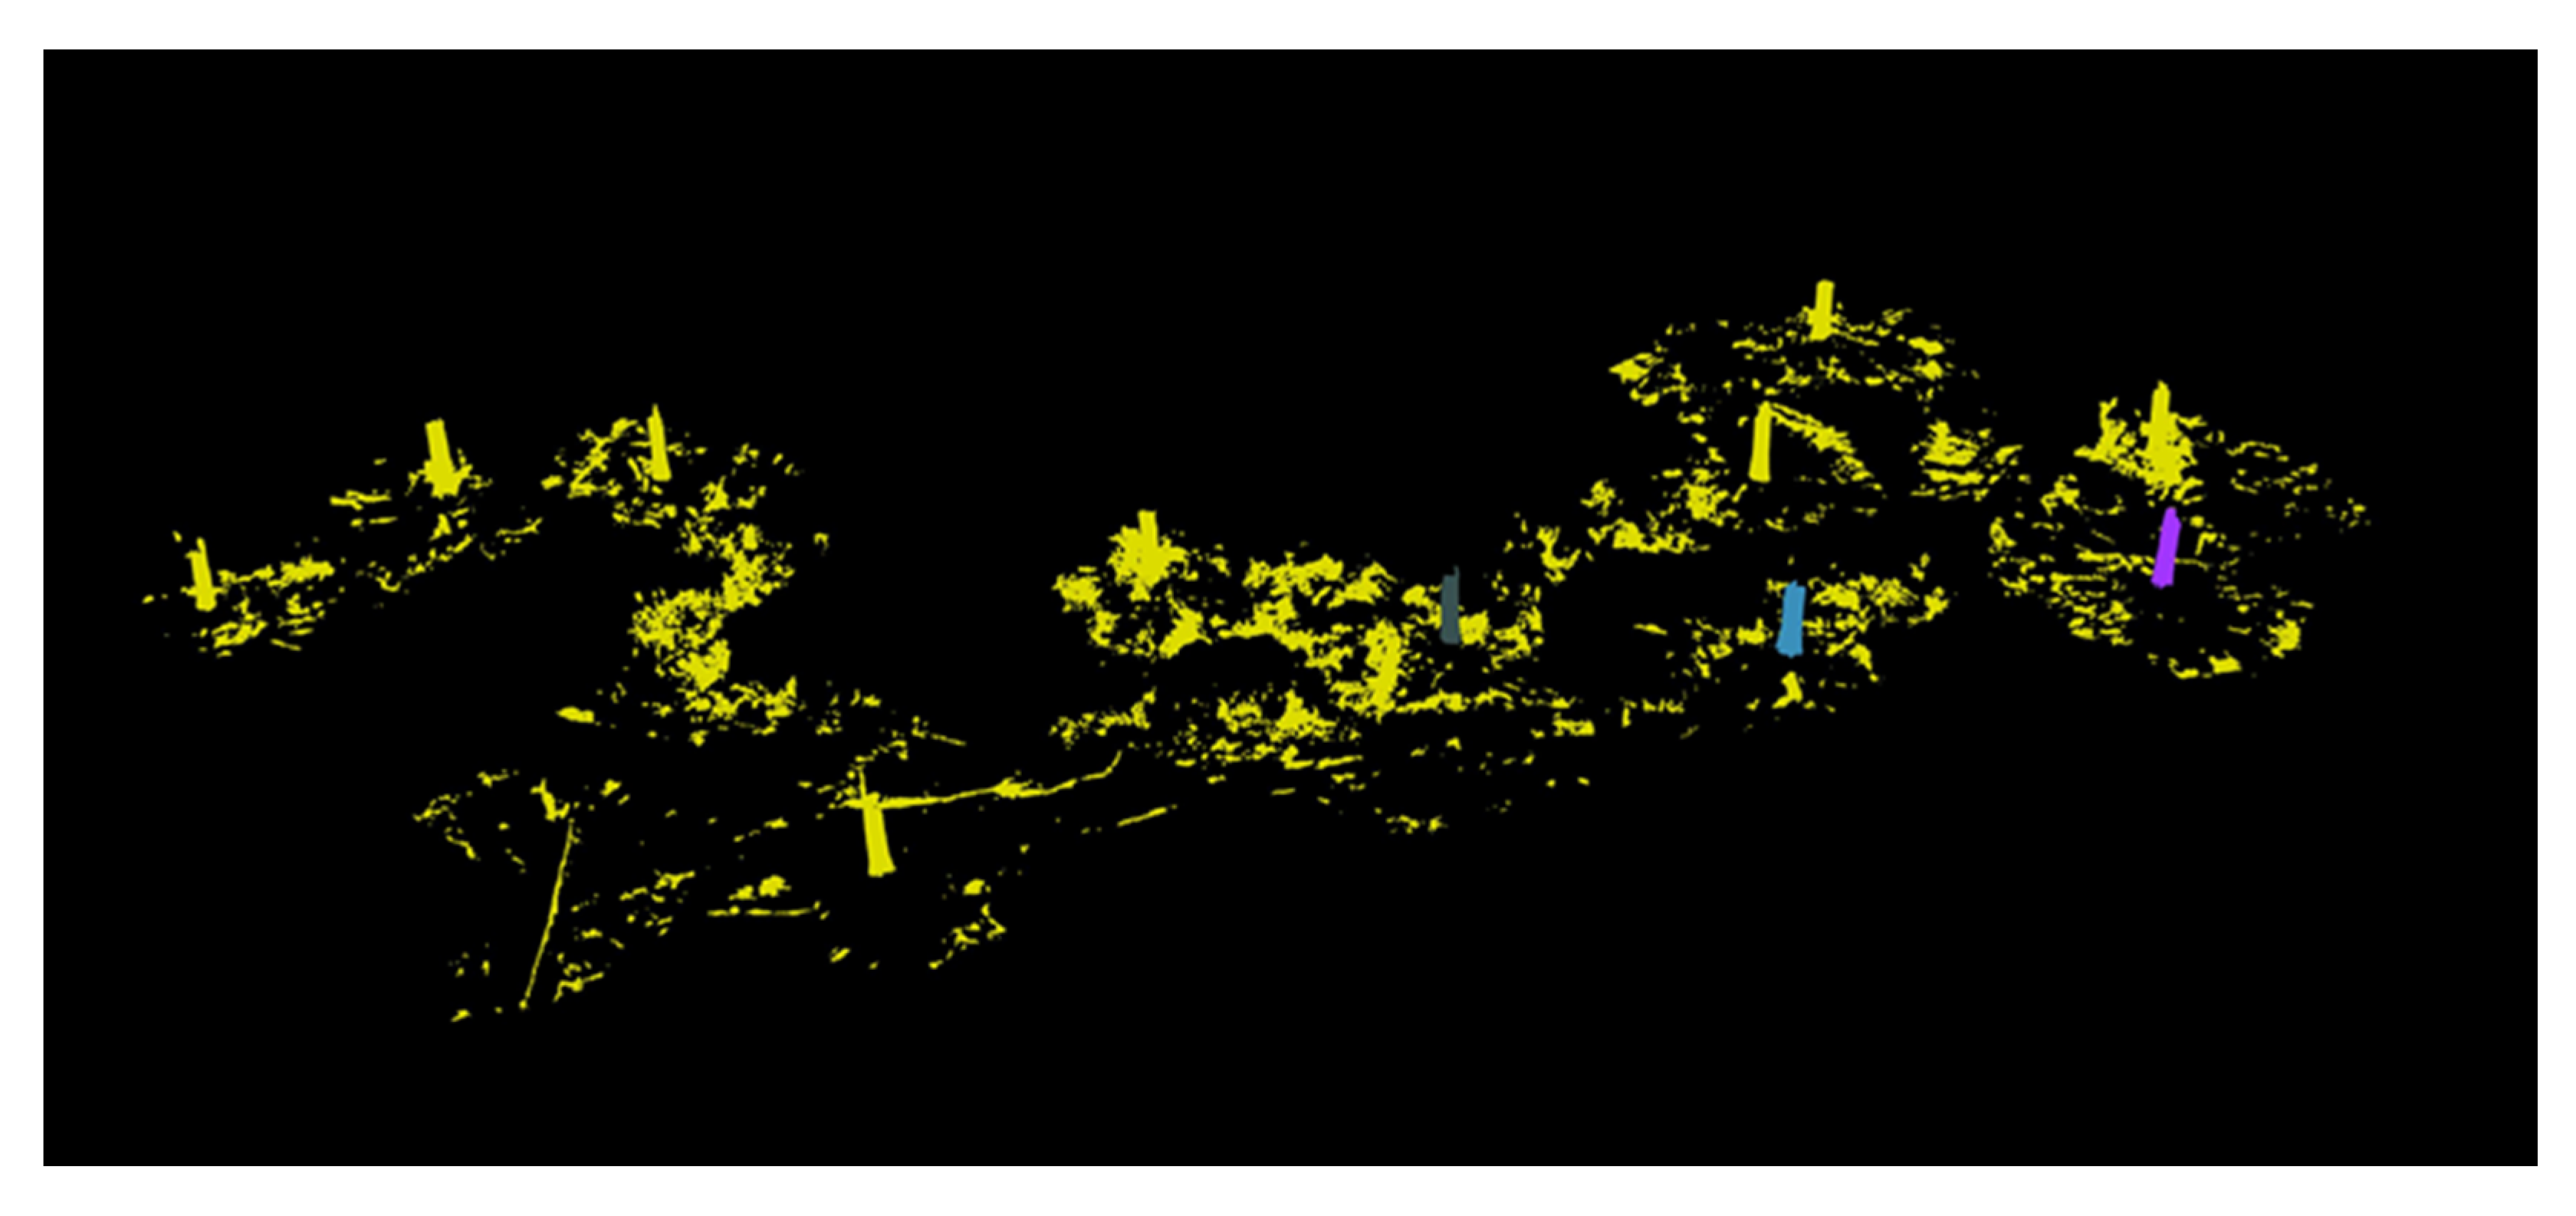
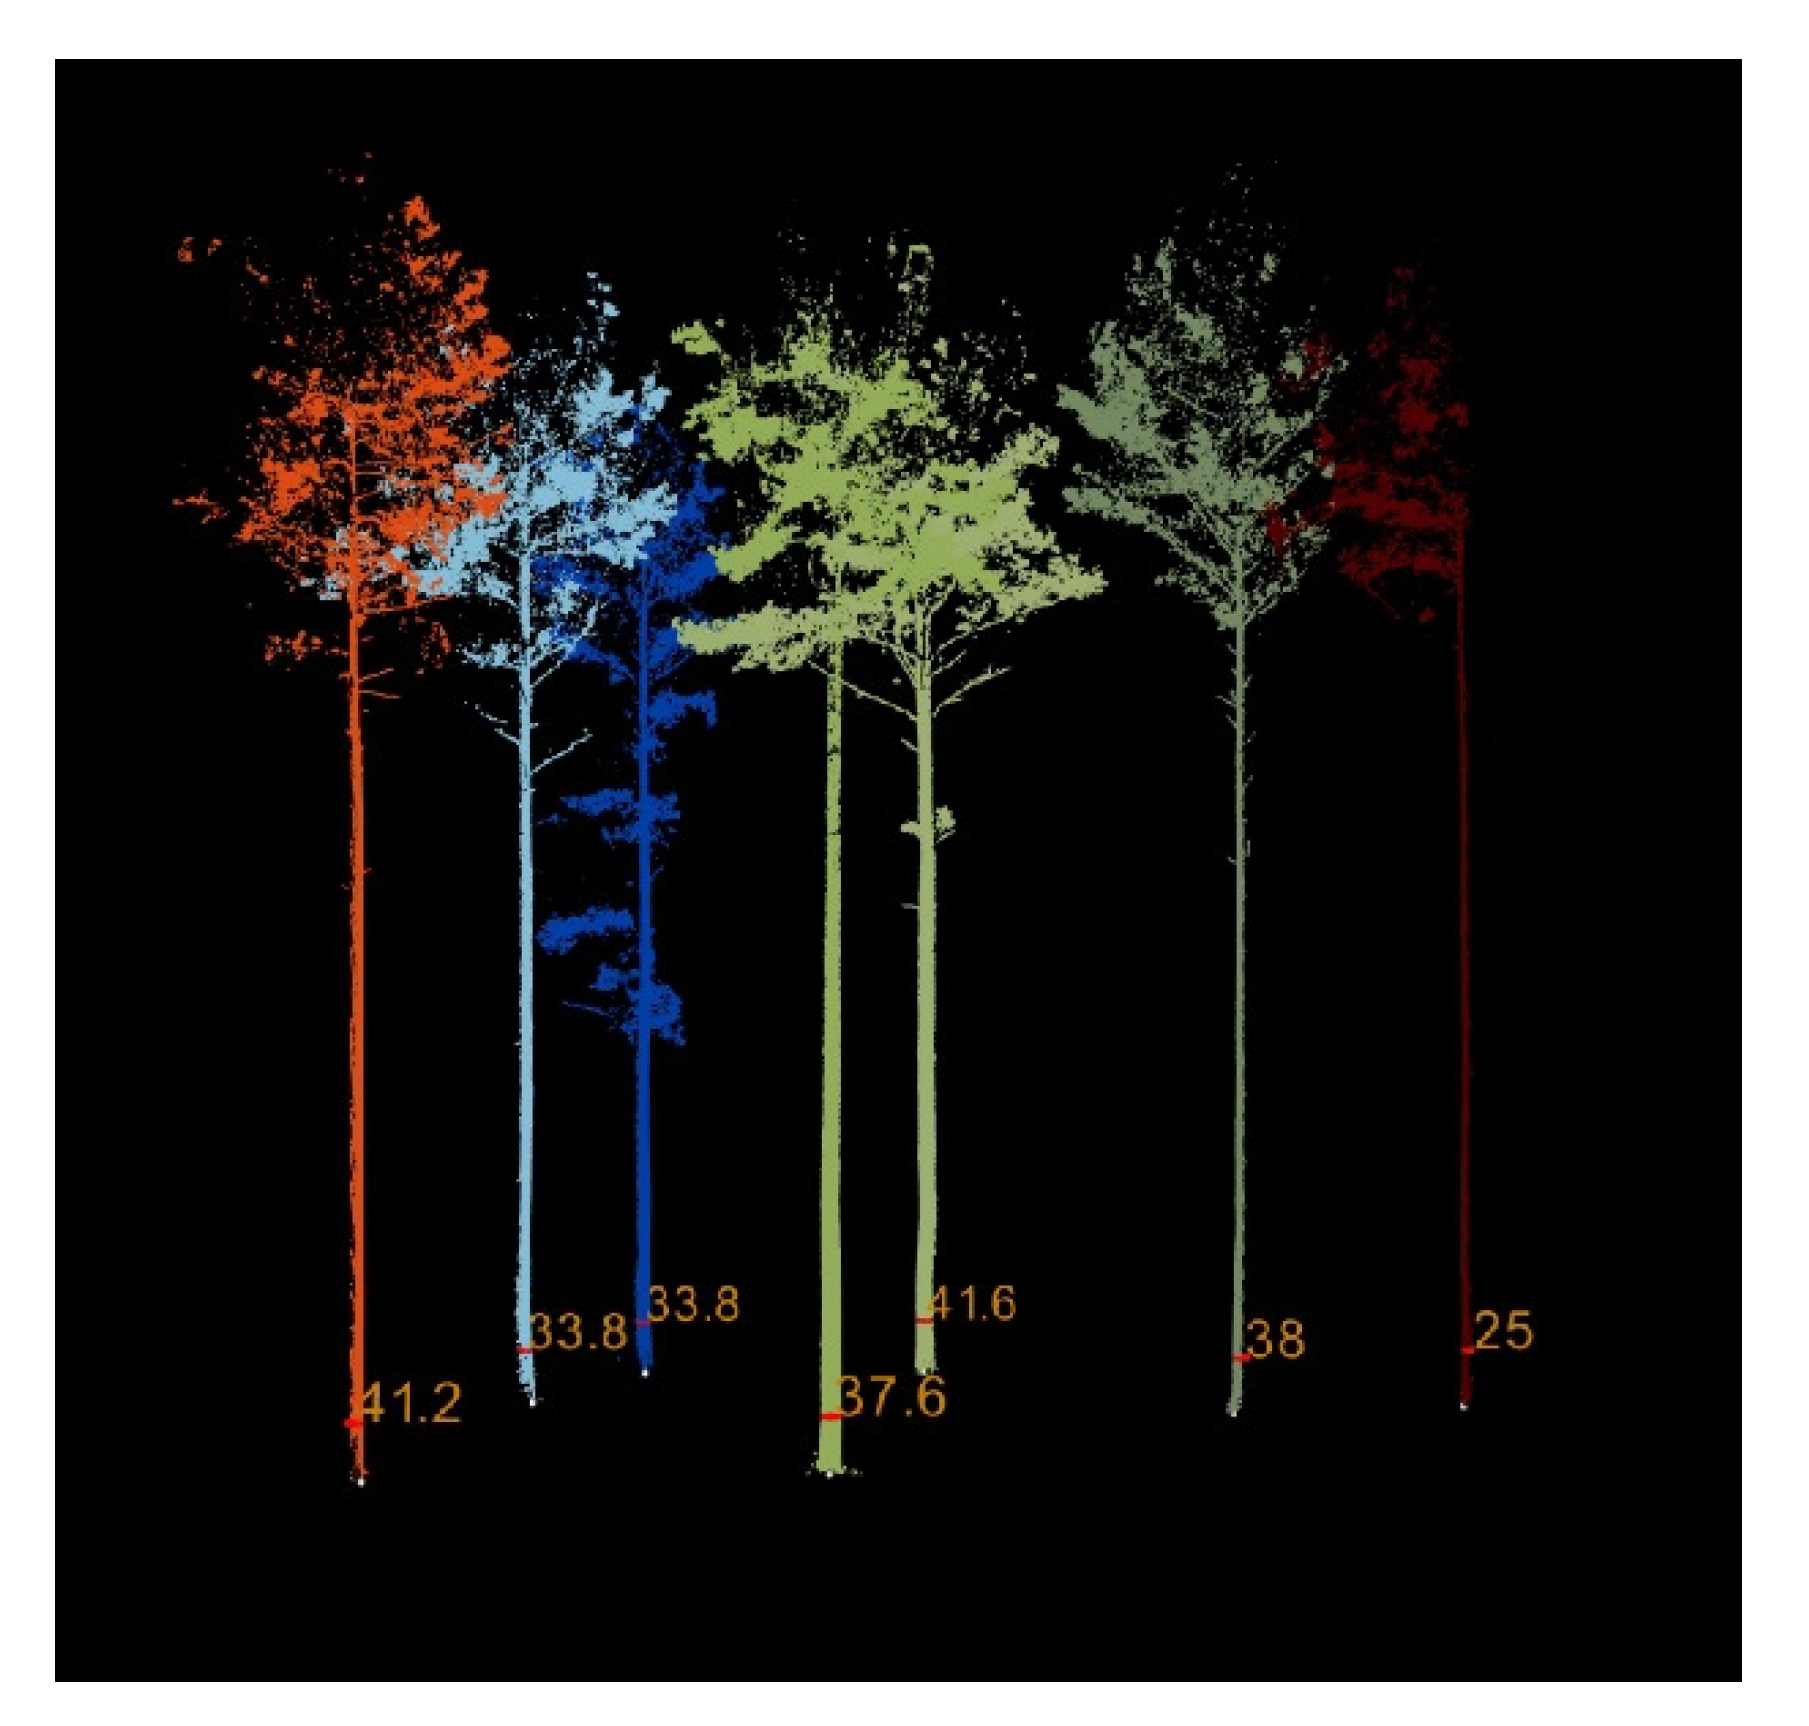
2.4.1. Measurement Distance between Trees in CloudCompare

CloudCompare is a software package that has a range of tools to manipulate and analyze 3D data and is freely available for both educational and commercial purposes. In addition, CloudCompare can be used to convert 3D data types. In this study, we converted the Forge data that was exported in PLY format to PCD format for use in the 3D Forest software program. CloudCompare provides tools that can be used to measure the distance between trees. PLY-formatted iPad LiDAR data were exported from the Forge application and then imported into CloudCompare. The point picking tool was used to measure the distance between the targeted trees in CloudCompare. This tool was used to identify distances between multiple trees (Figure 9).
In some situations, such as areas with high forest density and excessive ground cover, it was difficult to measure the distance between two trees. With the data obtained by TLS, the crowns of the trees sometimes prevented a clear view of a path between a tree pair. Therefore, functions in the CloudCompare software were used to remove point clouds representing tree crowns as well as other unnecessary 3D images, such as unselected trees, electricity poles, etc., to provide a better view to measure the distance between trees.

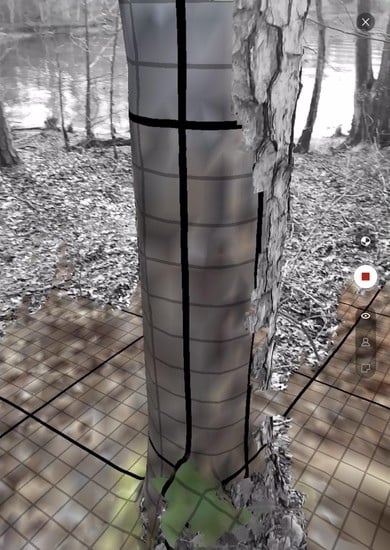
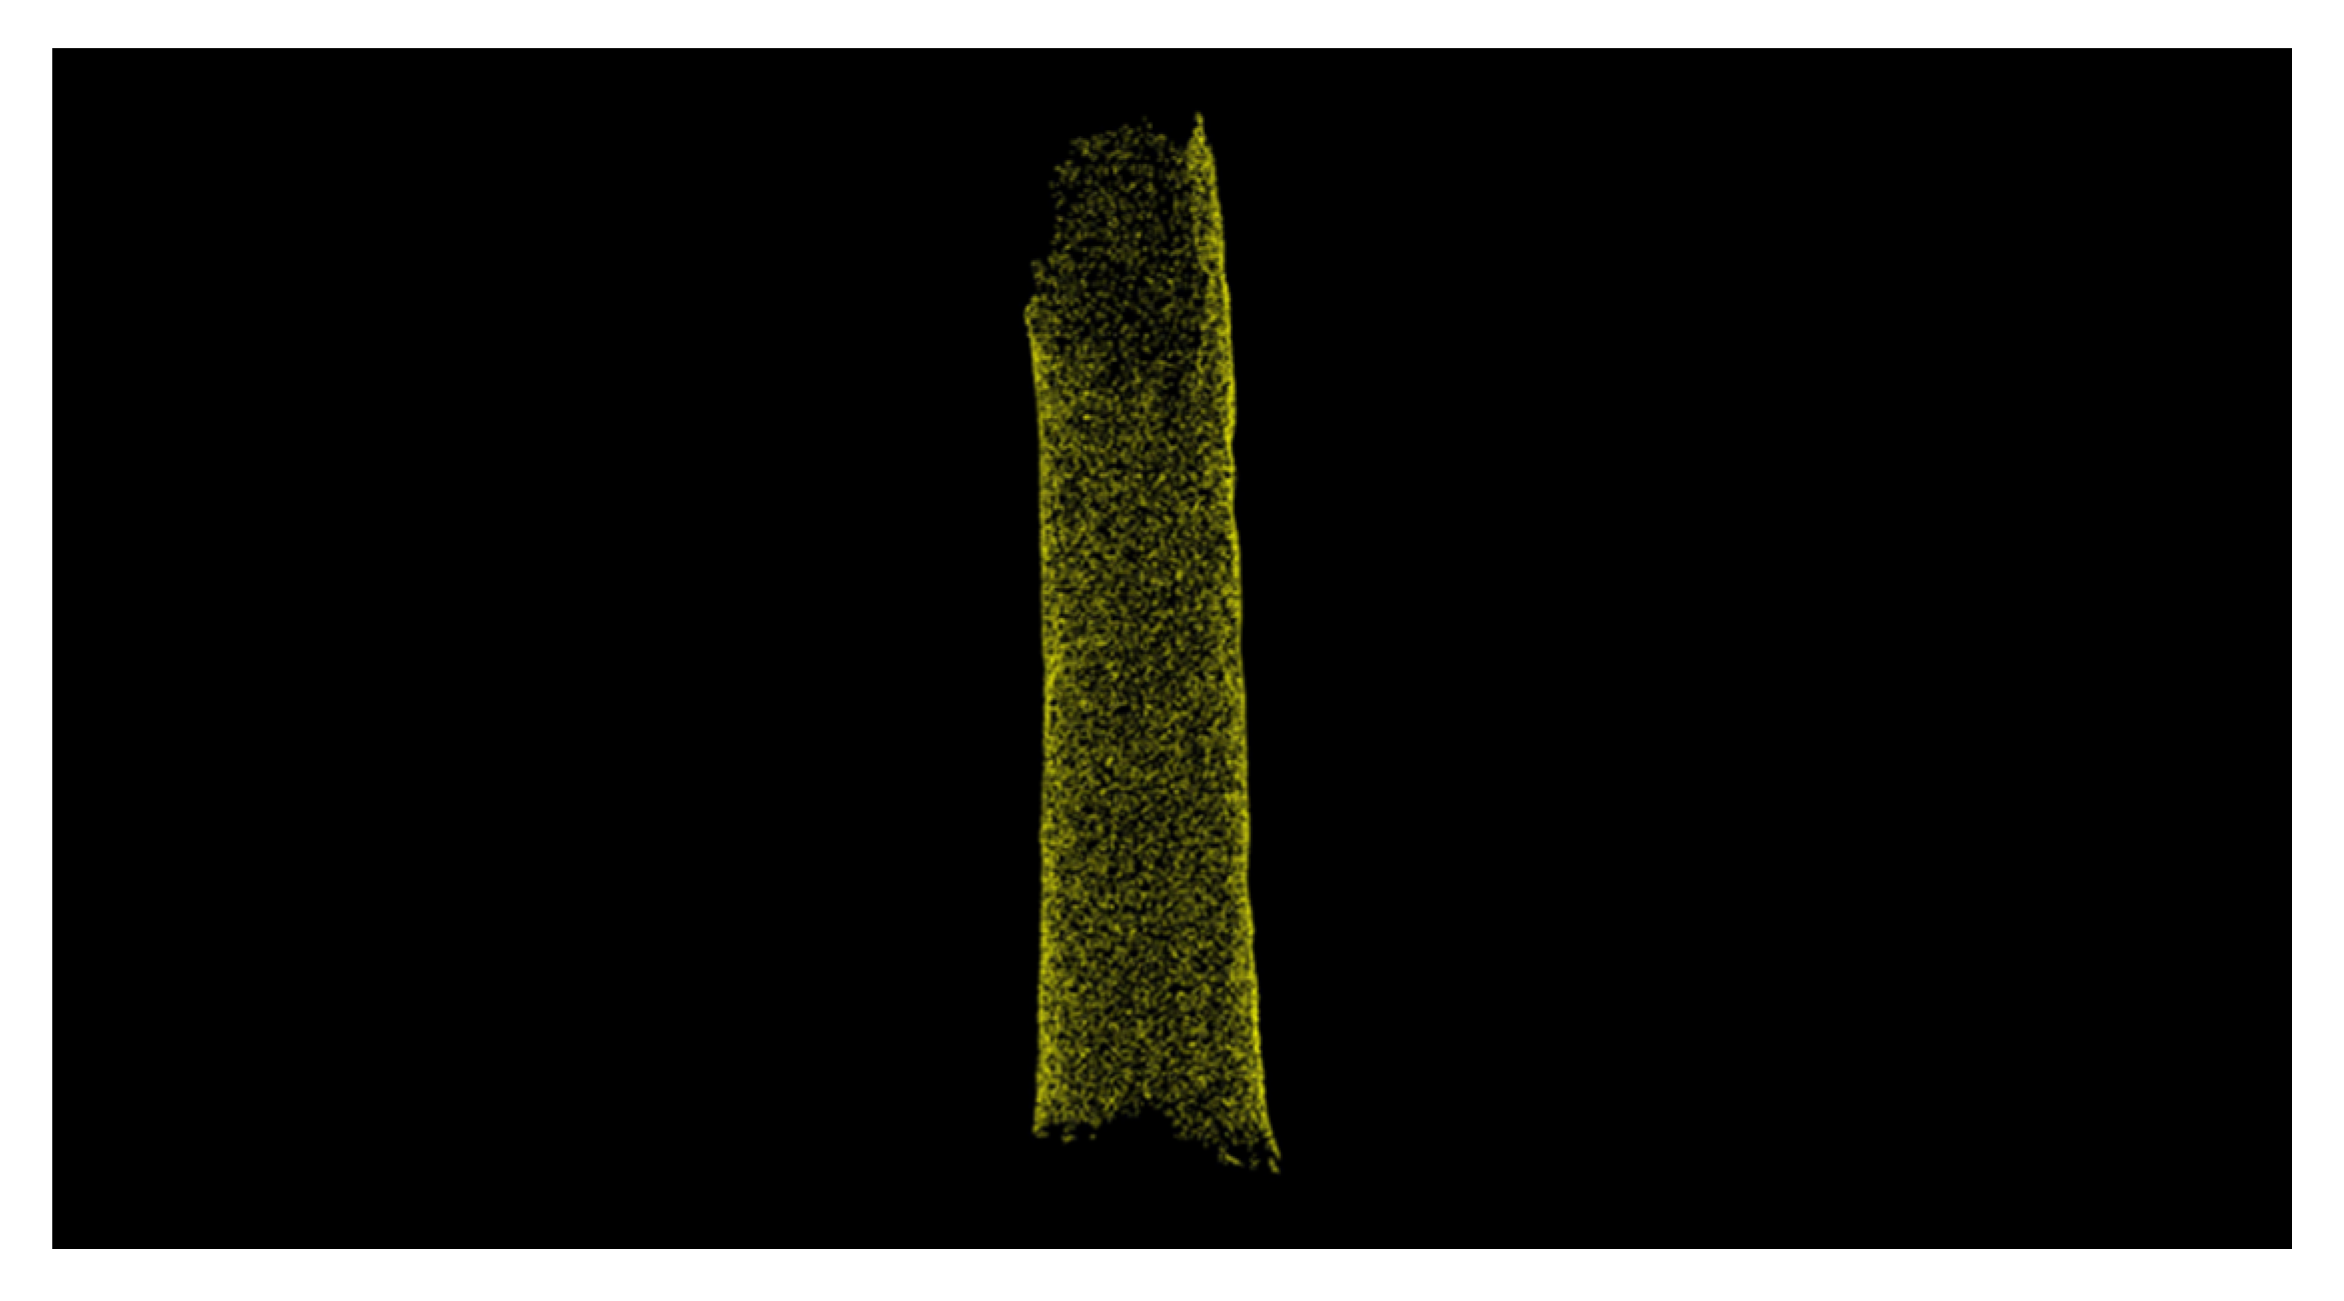
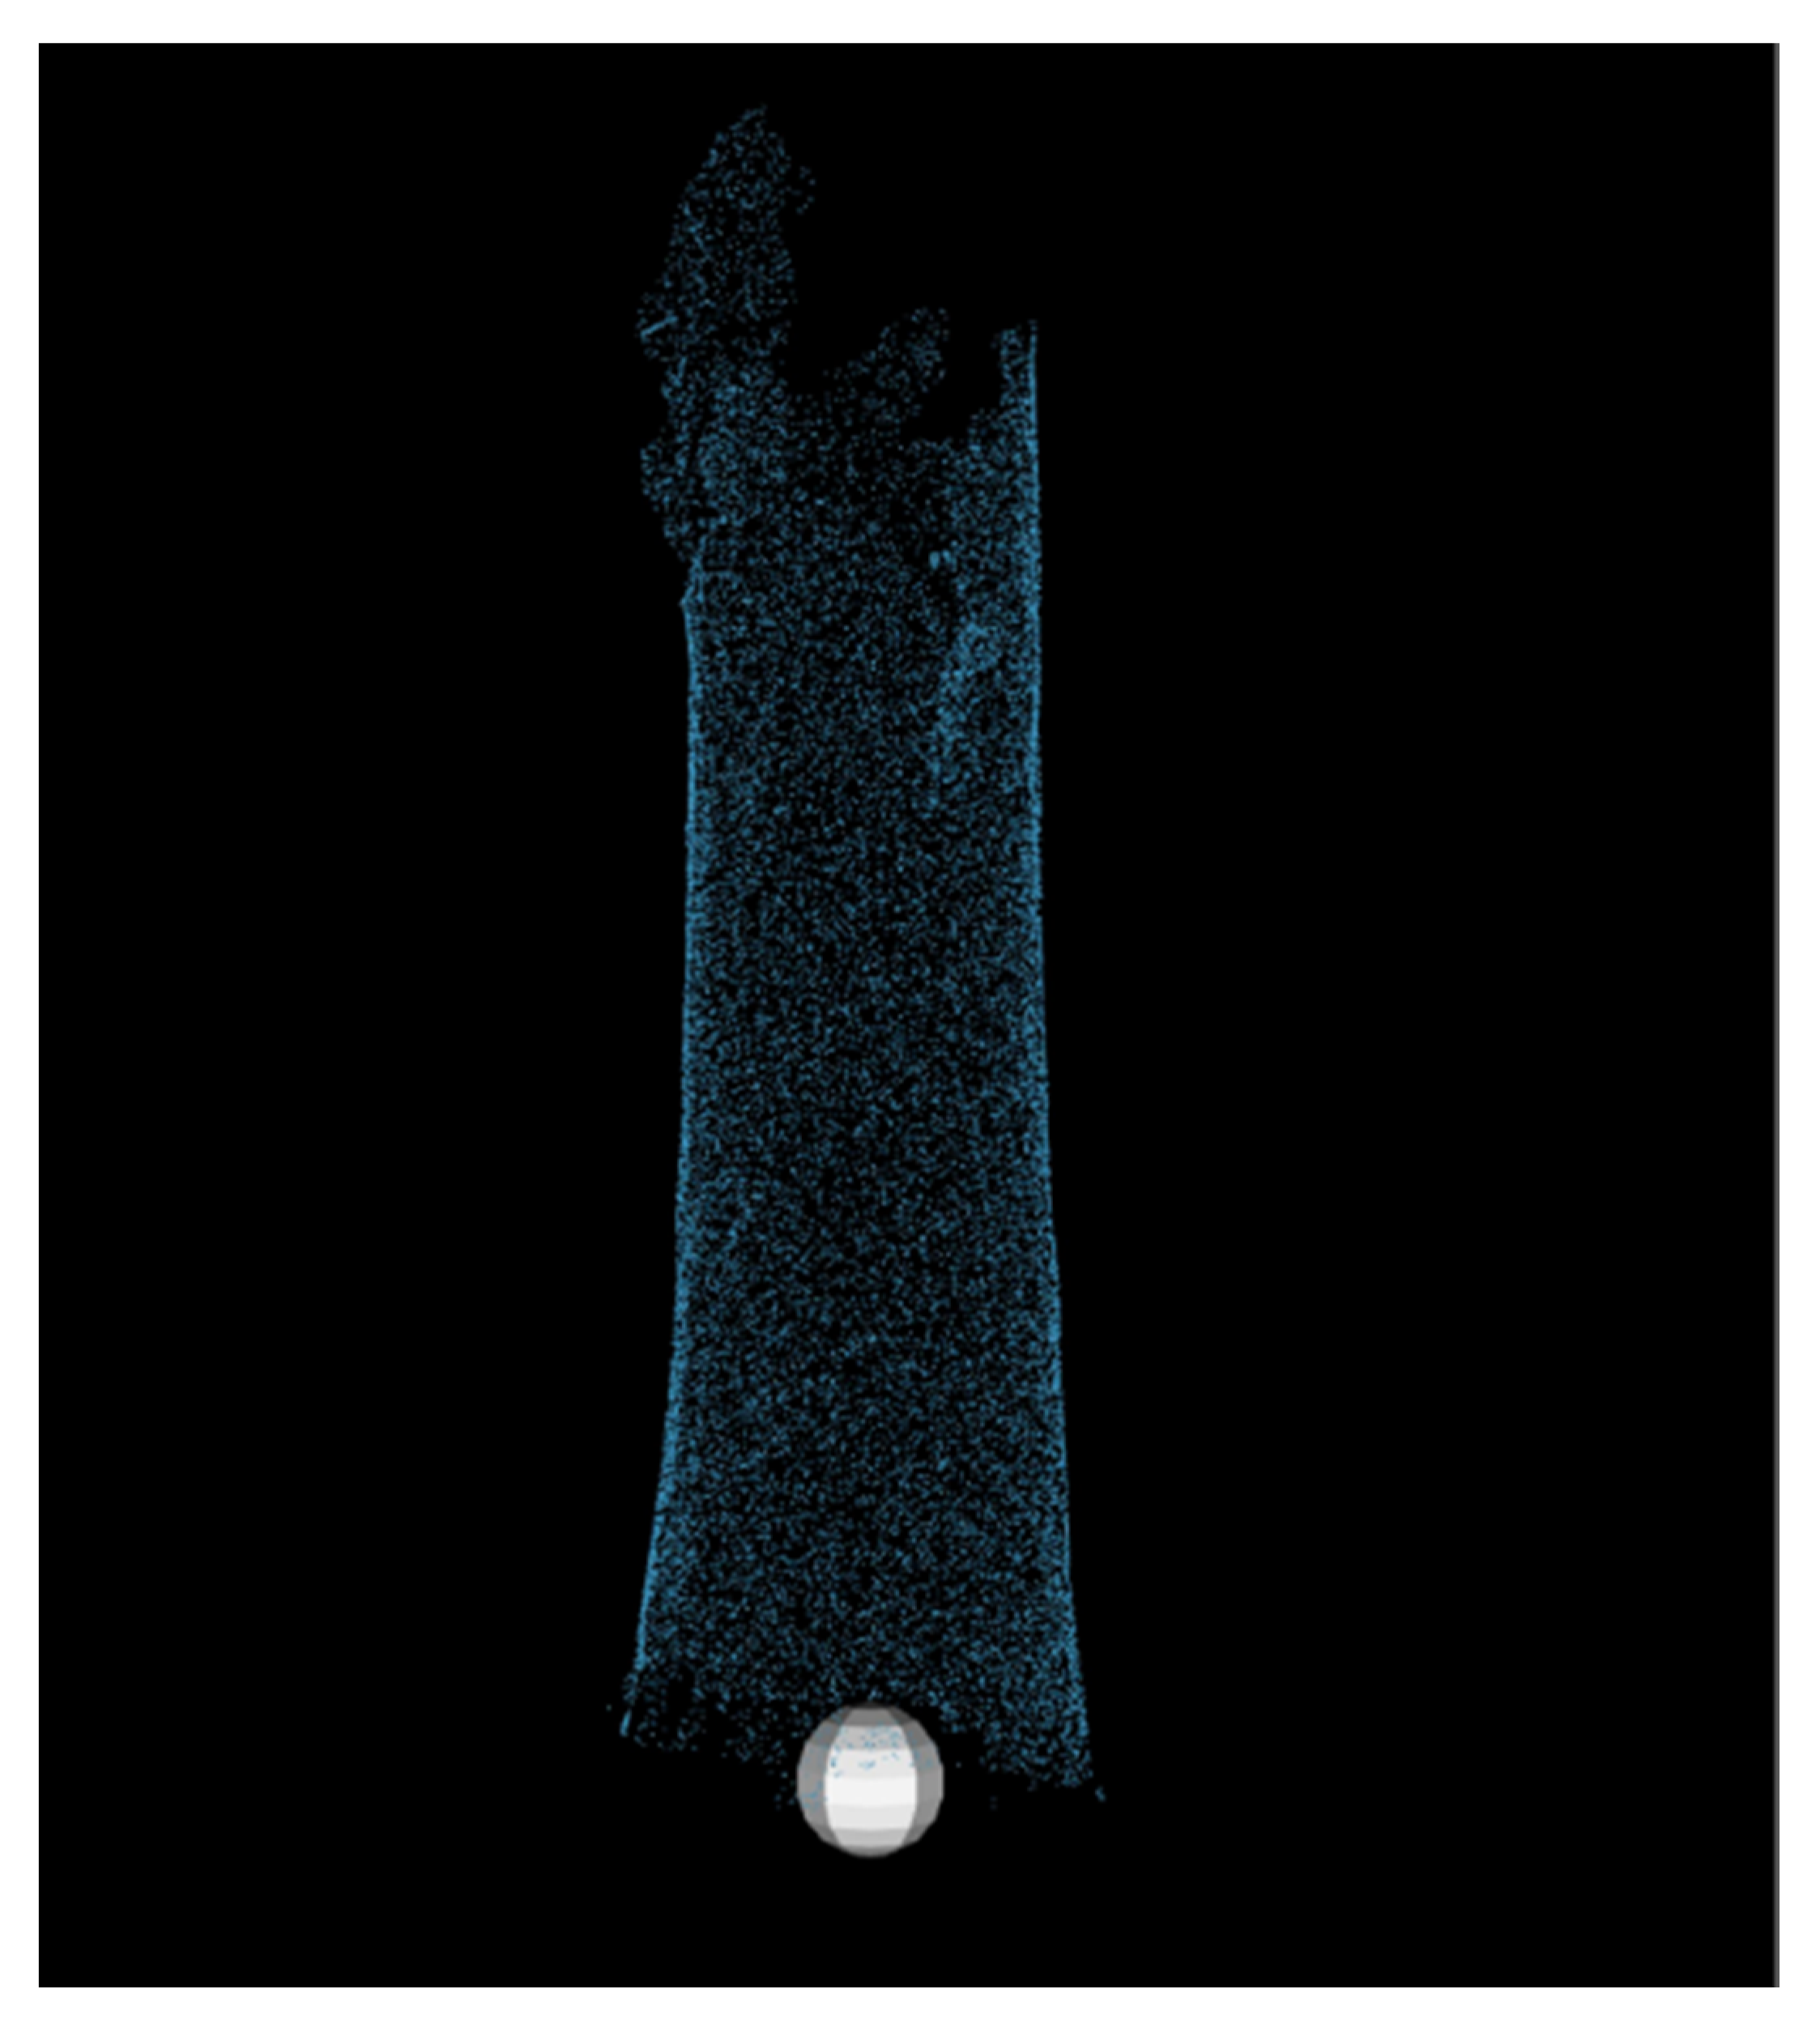
2.4.2. Determining DBH from LiDAR Point Cloud Tree Scans

The 3D Forest software package provides many different measurement tools to develop metrics for forest inventory from 3D data. Forest DBH measurements were estimated using the point cloud data from both the iPad Pro and TLS in 3D Forest. Data collected by the iPad Pro did not include a coordinate system as it was not necessary to measure DBH and distances between trees. Therefore, the NoMATRIX option was used so that the data could be measured. The 3D Forest software package provides a workflow that makes it possible to measure tree DBH from an imported point cloud dataset (Figure 10).
The same set of procedures were used for both TLS data (LAS format) and iPad data (PCD format) from the Terrain menu in 3D Forest. The first step was to divide the cloud data into two separate parts: a vegetation cloud and a terrain cloud. The most important reason for this was to obtain the vegetation cloud, which could be used to select individual trees for DBH measurements. The terrain from octree method, which divides the input point cloud into 10 cm cubes and classifies the points with the lowest height (z-value) as ground points, was used to successfully separate ground points from vegetation points. (Figure 11).
To measure the DBH values of the trees in the vegetation point cloud, each tree was divided into a file with a single tree for measurement. All points that did not belong to the target tree in the point cloud could be manually deleted (Figure 12).
After the target tree cloud was saved, the vegetation cloud appeared again to enable the continuation of manual tree selection; however, the previously selected tree appeared with a random color (Figure 13) which allowed a sequential process to select the point cloud associated with each tree. The “position lowest point” process in 3D Forest software allowed the manual placement of points on each target tree that represented the tree base with a white sphere (Figure 14). The DBH of each target tree was determined using the randomized Hough transformation in the 3D Forest software that used 200 interactions to estimate the DBH by searching for the center of the circle that represents tree diameter [28] at 1.3 m from the tree base. After the DBH was calculated, there was a red ring and a number showing the DBH value of the tree at the height of 1.30 m (Figure 15). In addition, DBH values could be viewed in the attribute table in 3D Forest.

3. Results

3.1. Comparison of Methods Used to Determine DBH and Distance between Trees

In the present study, DBH results of selected trees and the distance between trees were obtained by three different techniques: iPad, TLS, and conventional field measurement equipment. Among these three, TLS was the quickest method to measure tree parameters compared with iPad Pro LiDAR scanning and hand-measuring with a tape measure or laser distance sensor. However, field measurement of DBH with a tape measure or distance measurement with a laser distance meter was the most reliable way to get accurate results. Therefore, in comparison with the LiDAR estimates, the field measurement was used as a reference. A summary of the field measurements is found in Table 3.

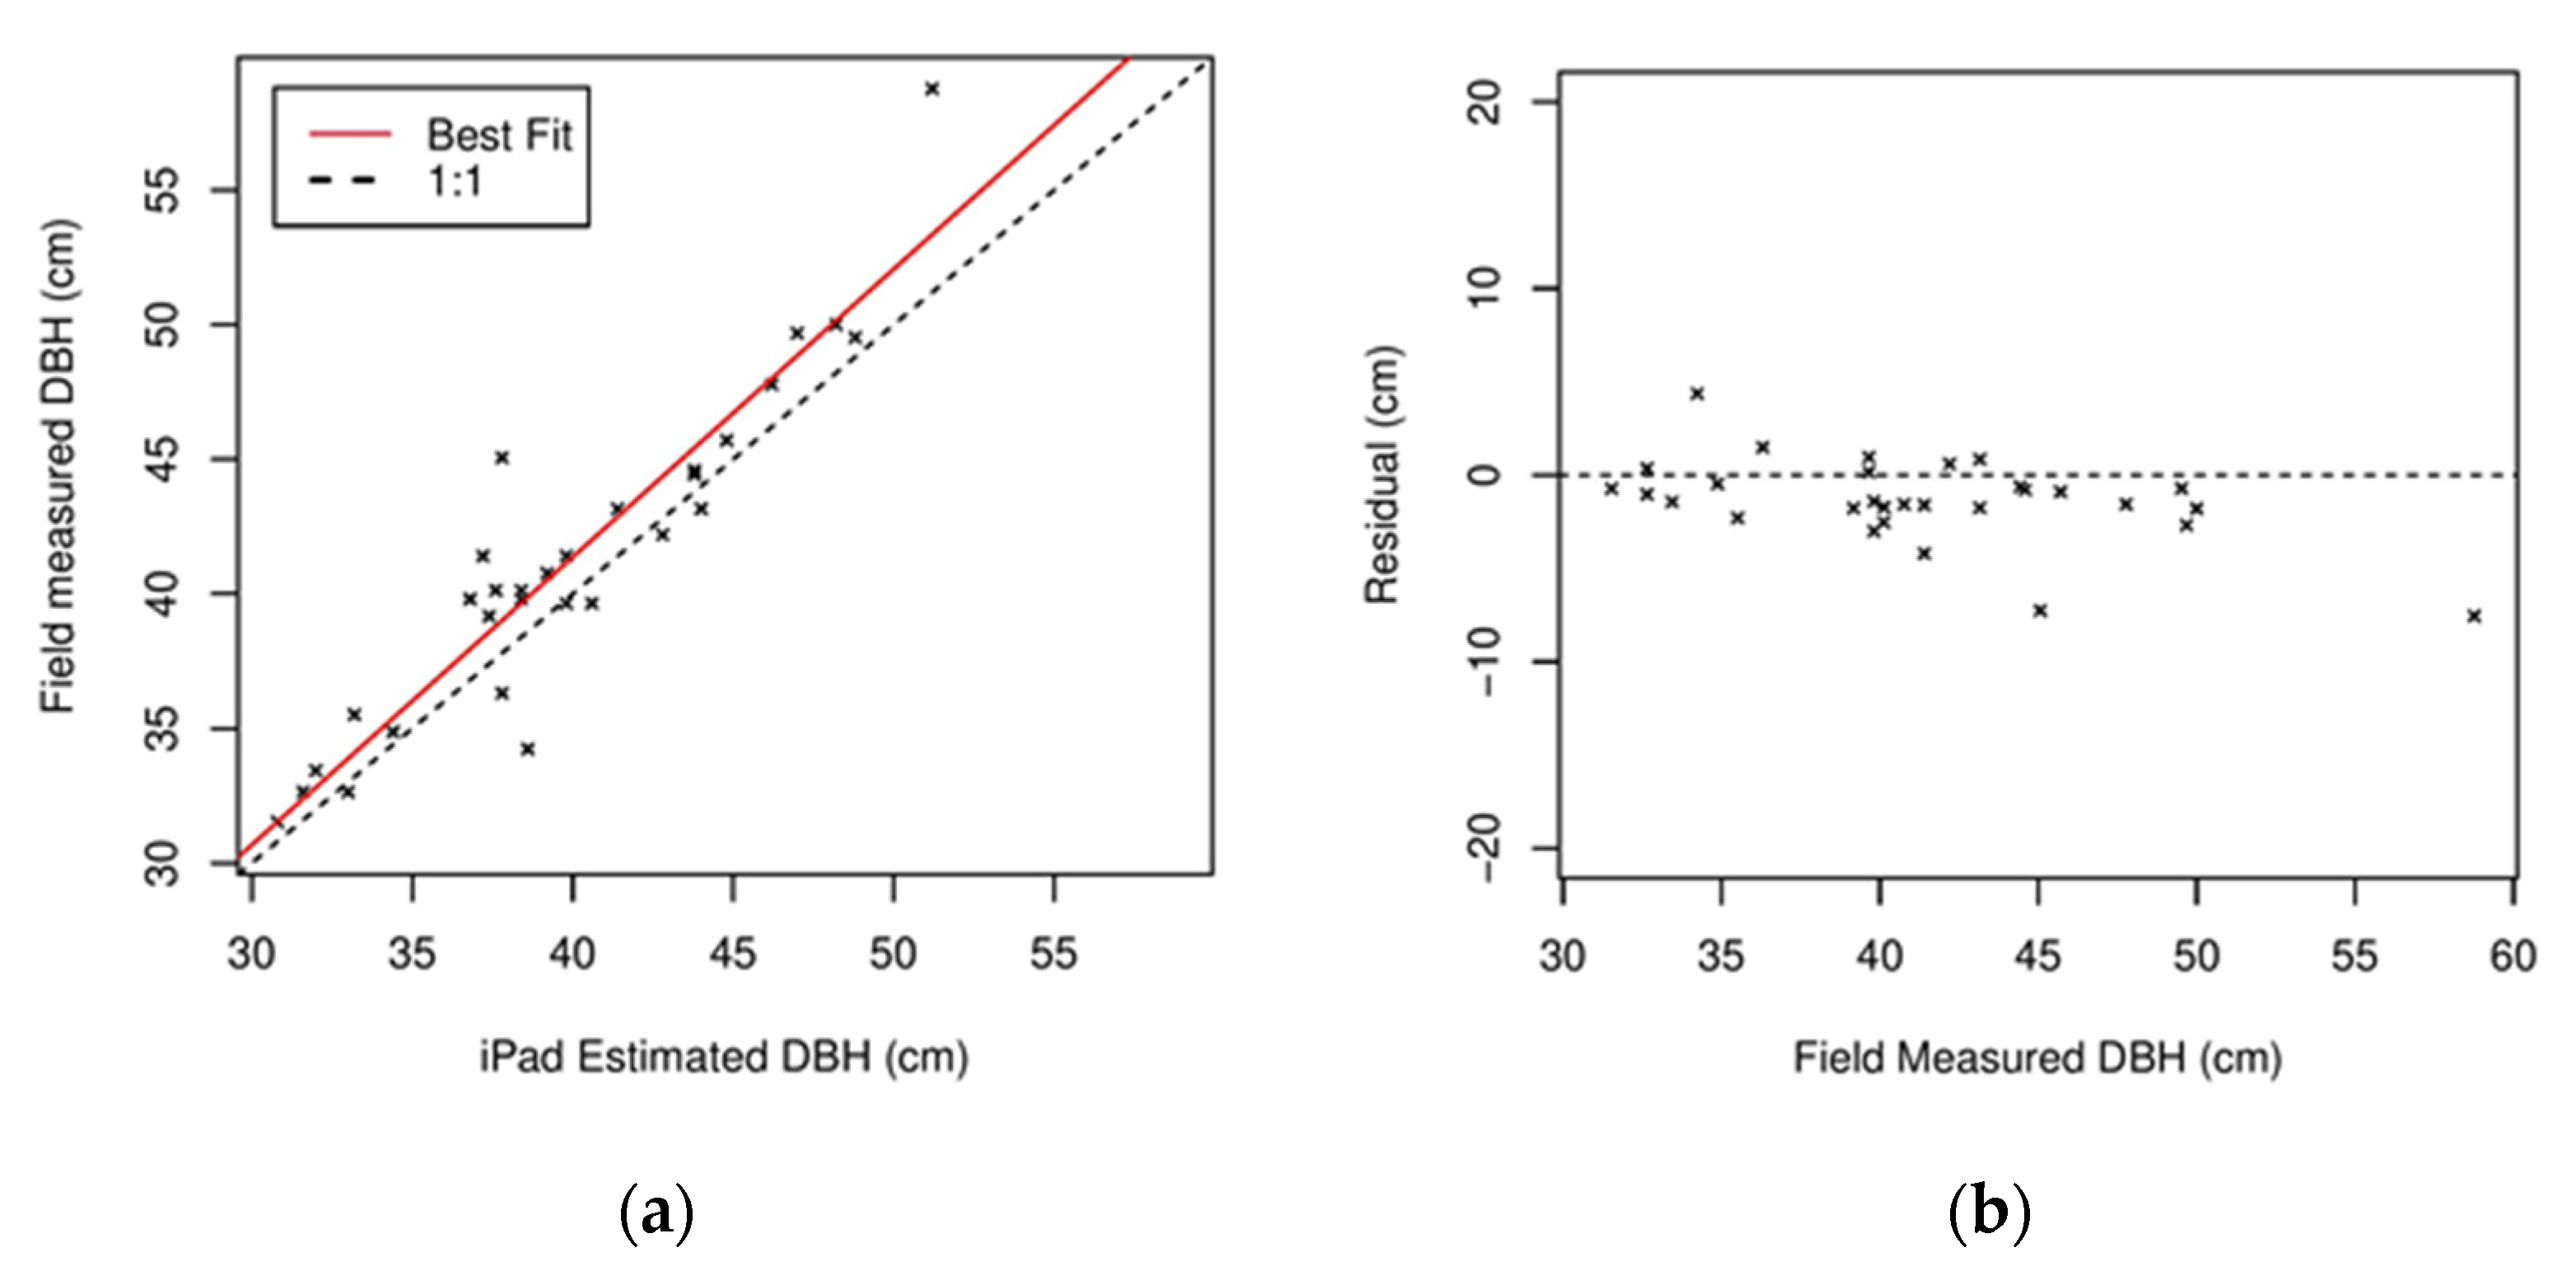
3.1.1. Comparison of DBH in an Urban Forest Area (Clemson Campus)

The DBH was measured using two different methods (iPad and tape measure) in the urban forest area. Graphs show a comparison of iPad DBH estimates with field measurement of DBH in the urban forest (Figure 16). For 32 trees total, the overall iPad DBH residual error is 2.4 cm (Figure 16b) and the root mean square error (RMSE) is 2.9 cm. According to the field measurement, the lowest DBH value was 14.2 cm, while the highest DBH value was 75.3 cm, and the overall average DBH value of 32 trees was measured as 49.9 cm. Similar residual errors appear in each DBH size, so there does not seem to be a relationship between DBH size and residual error.

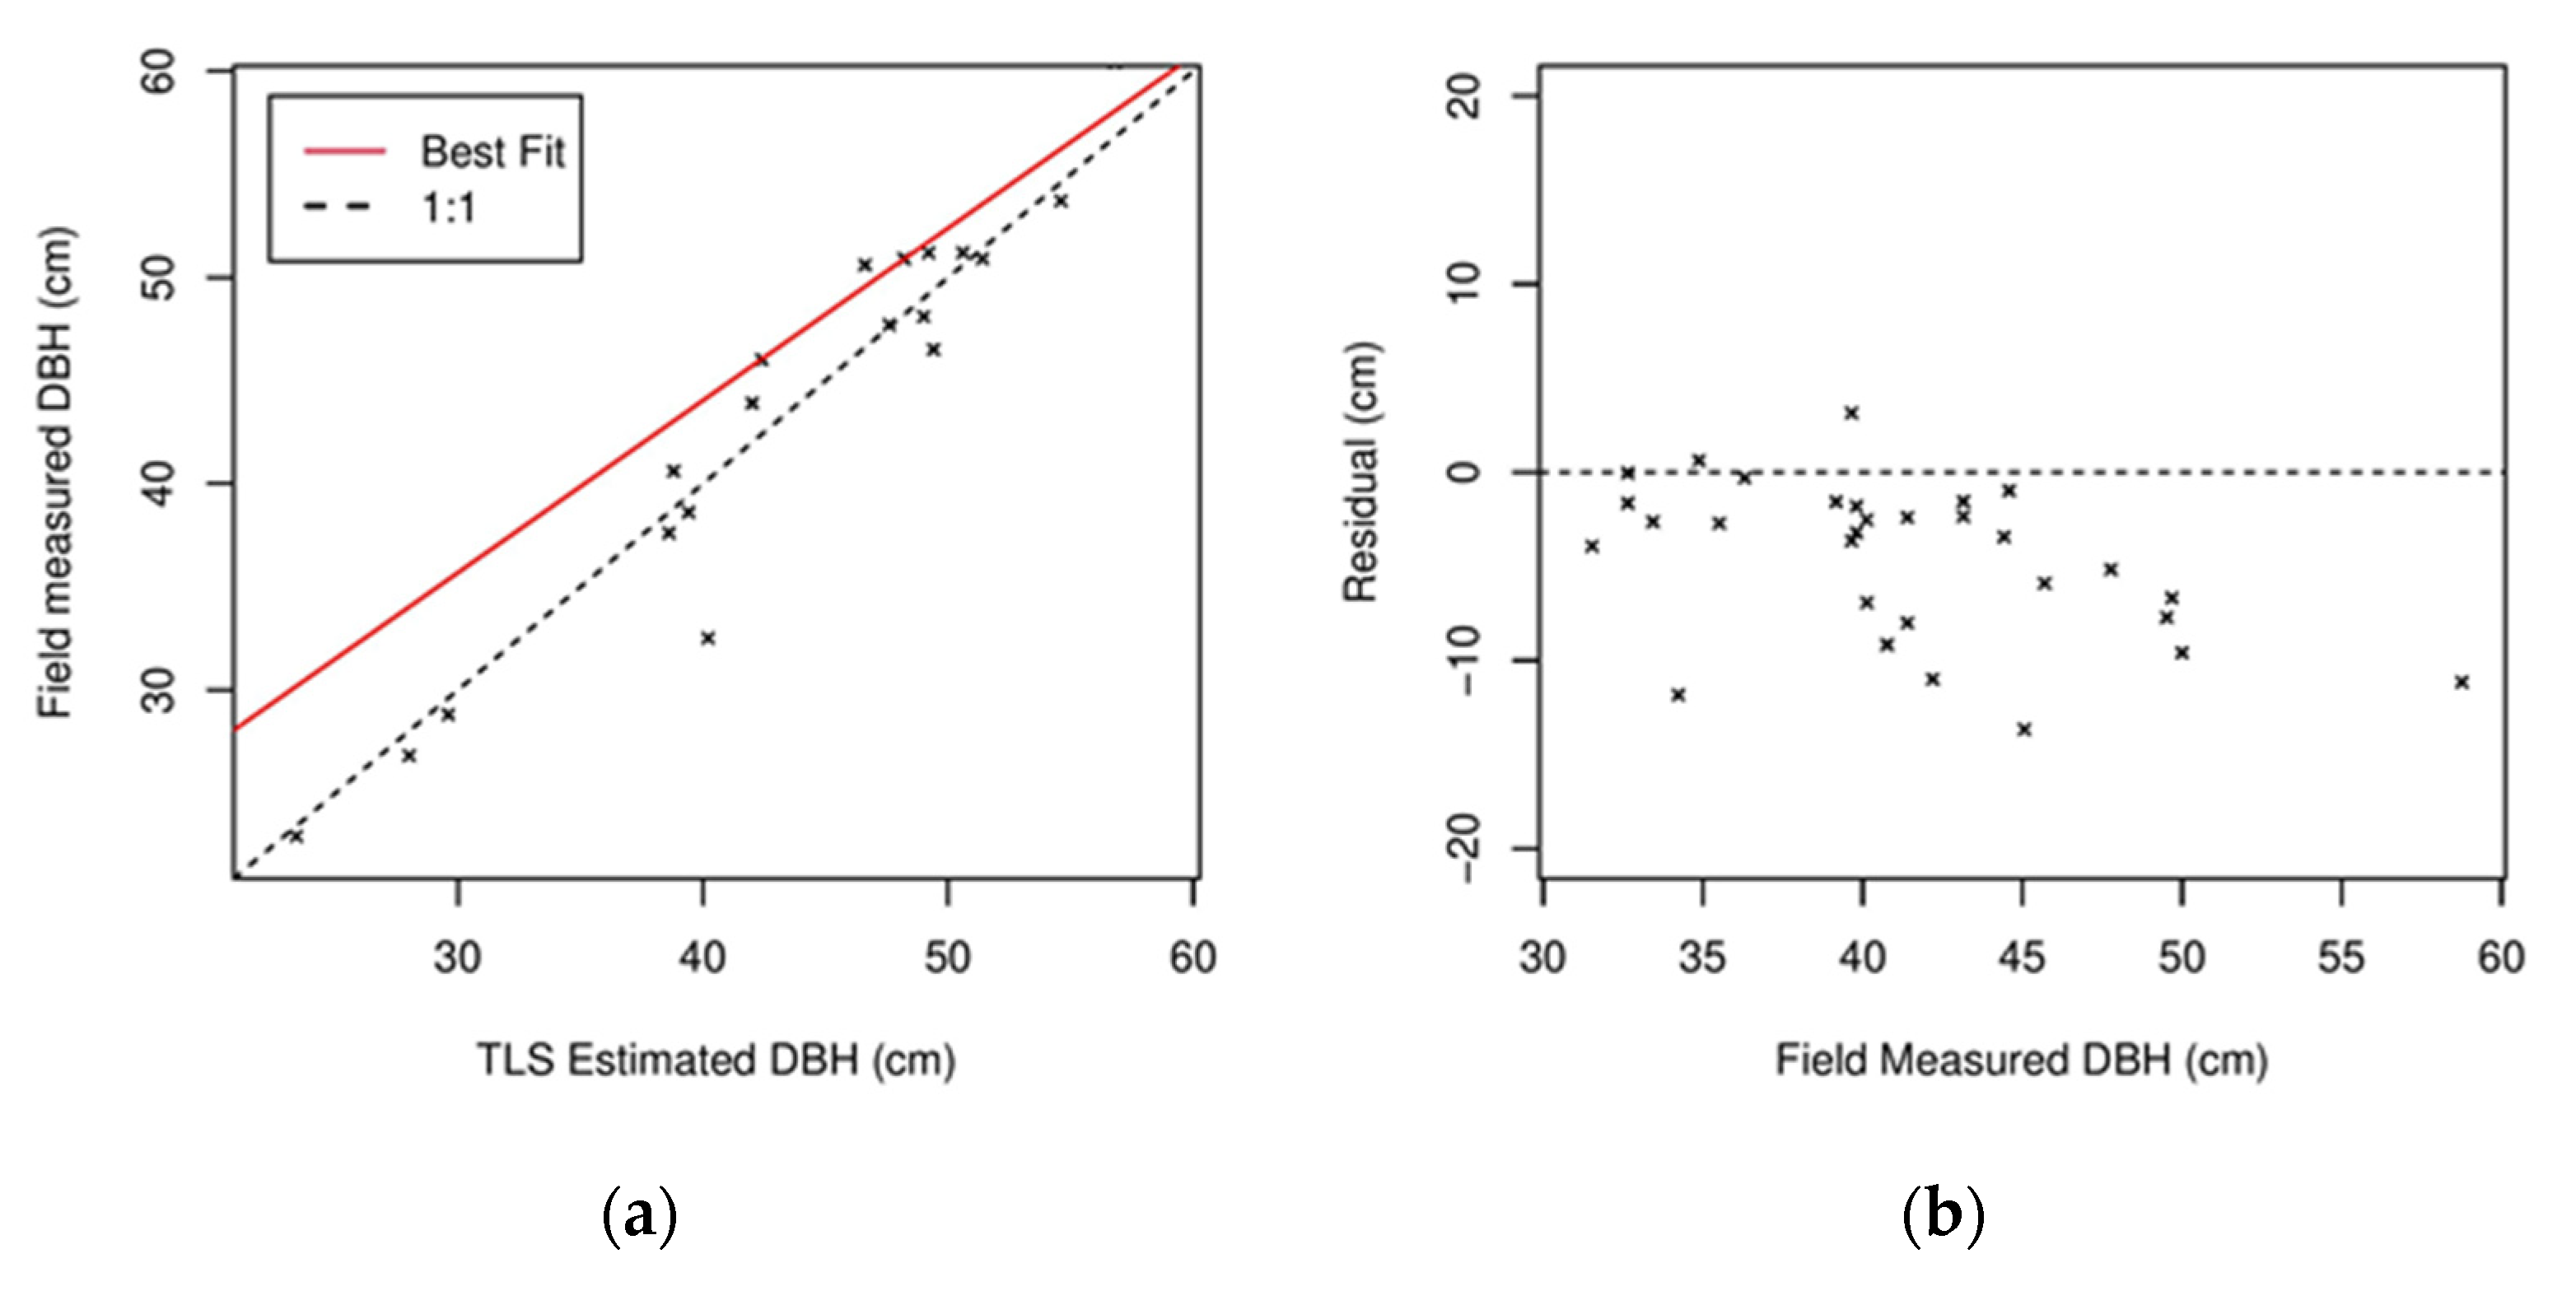
3.1.2. Comparison of DBH from iPad and TLS vs. Tape Measure DBH in a Managed Forest Stand

DBH values in the managed forest stand in the Clemson Experimental Forest were measured using three different methods (iPad, TLS, and the traditional tape measurement method). Figure 17 shows a comparison of iPad DBH estimates with field tape measurements. The TLS DBH estimates compared with field tape measurements is shown in Figure 18. This study was carried out on 30 trees in total, with the lowest tree DBH being 32 cm, while the highest DBH was 50 cm. Based on field measurements, DBH estimates from the LiDAR values were typically similar, with an average DBH of 41.2 cm. Comparing the two LiDAR scanning methods, iPad DBH residual appears to be lower compared to TLS residuals, which had a higher variation. With iPad having a DBH mean residual of 1.9 cm, the TLS DBH mean residual was 4.8 cm. It is possible to see similar differences in RMSE. TLS and iPad RMSE were 6.1 cm and 2.5 cm, respectively (Figure 17b and Figure 18b). The TLS DBH residuals could have been artificially high because this study did not combine multiple TLS scans.

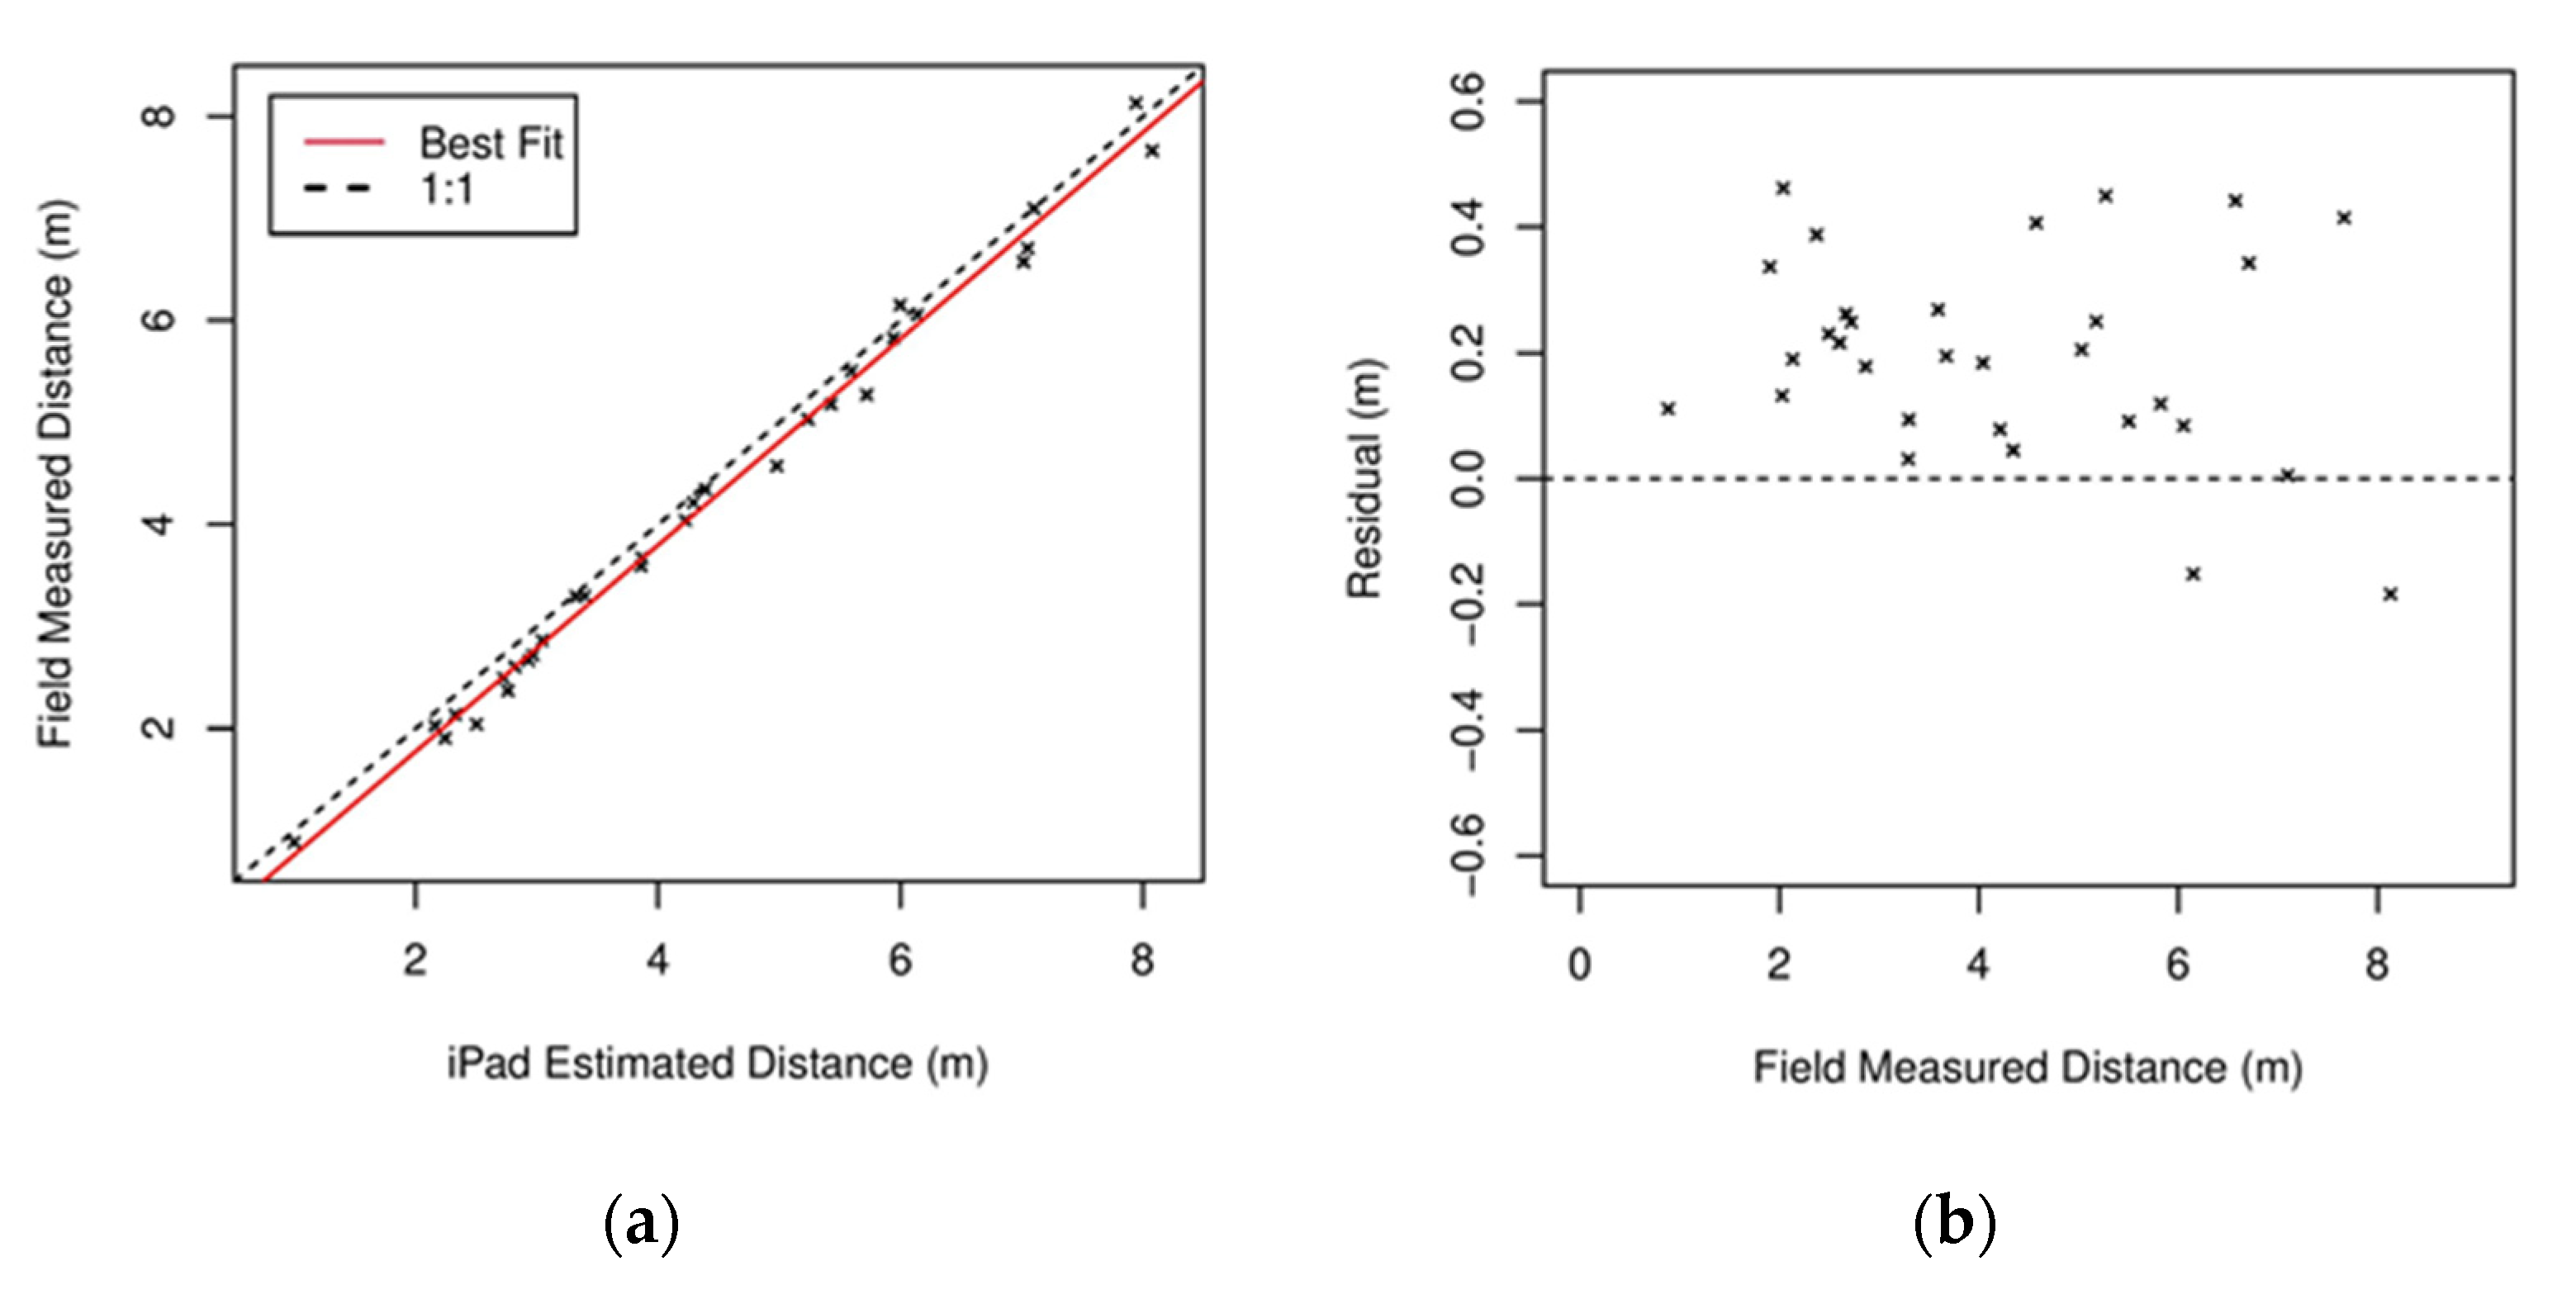
3.1.3. Comparison of Distance between Trees from iPad vs. Conventional Method (Laser Distance) in the Urban Forest Area

Graphs show a comparison of iPad distance estimates with field measured distance (Figure 19). In this study, 31 different distances were obtained from 32 trees. The longest distance between trees in the study area was 8.1 m; the shortest distance was measured as 0.8 m. The general average of the distances between the trees was 4.2 m. The mean residual error was 0.21 m, with an RMSE of 0.25 m. There were similar residual errors at each distance, so there was no relationship between distance and residual error, but there was a bias of about 0.2 m with the iPad sensor measurements (Figure 18b).

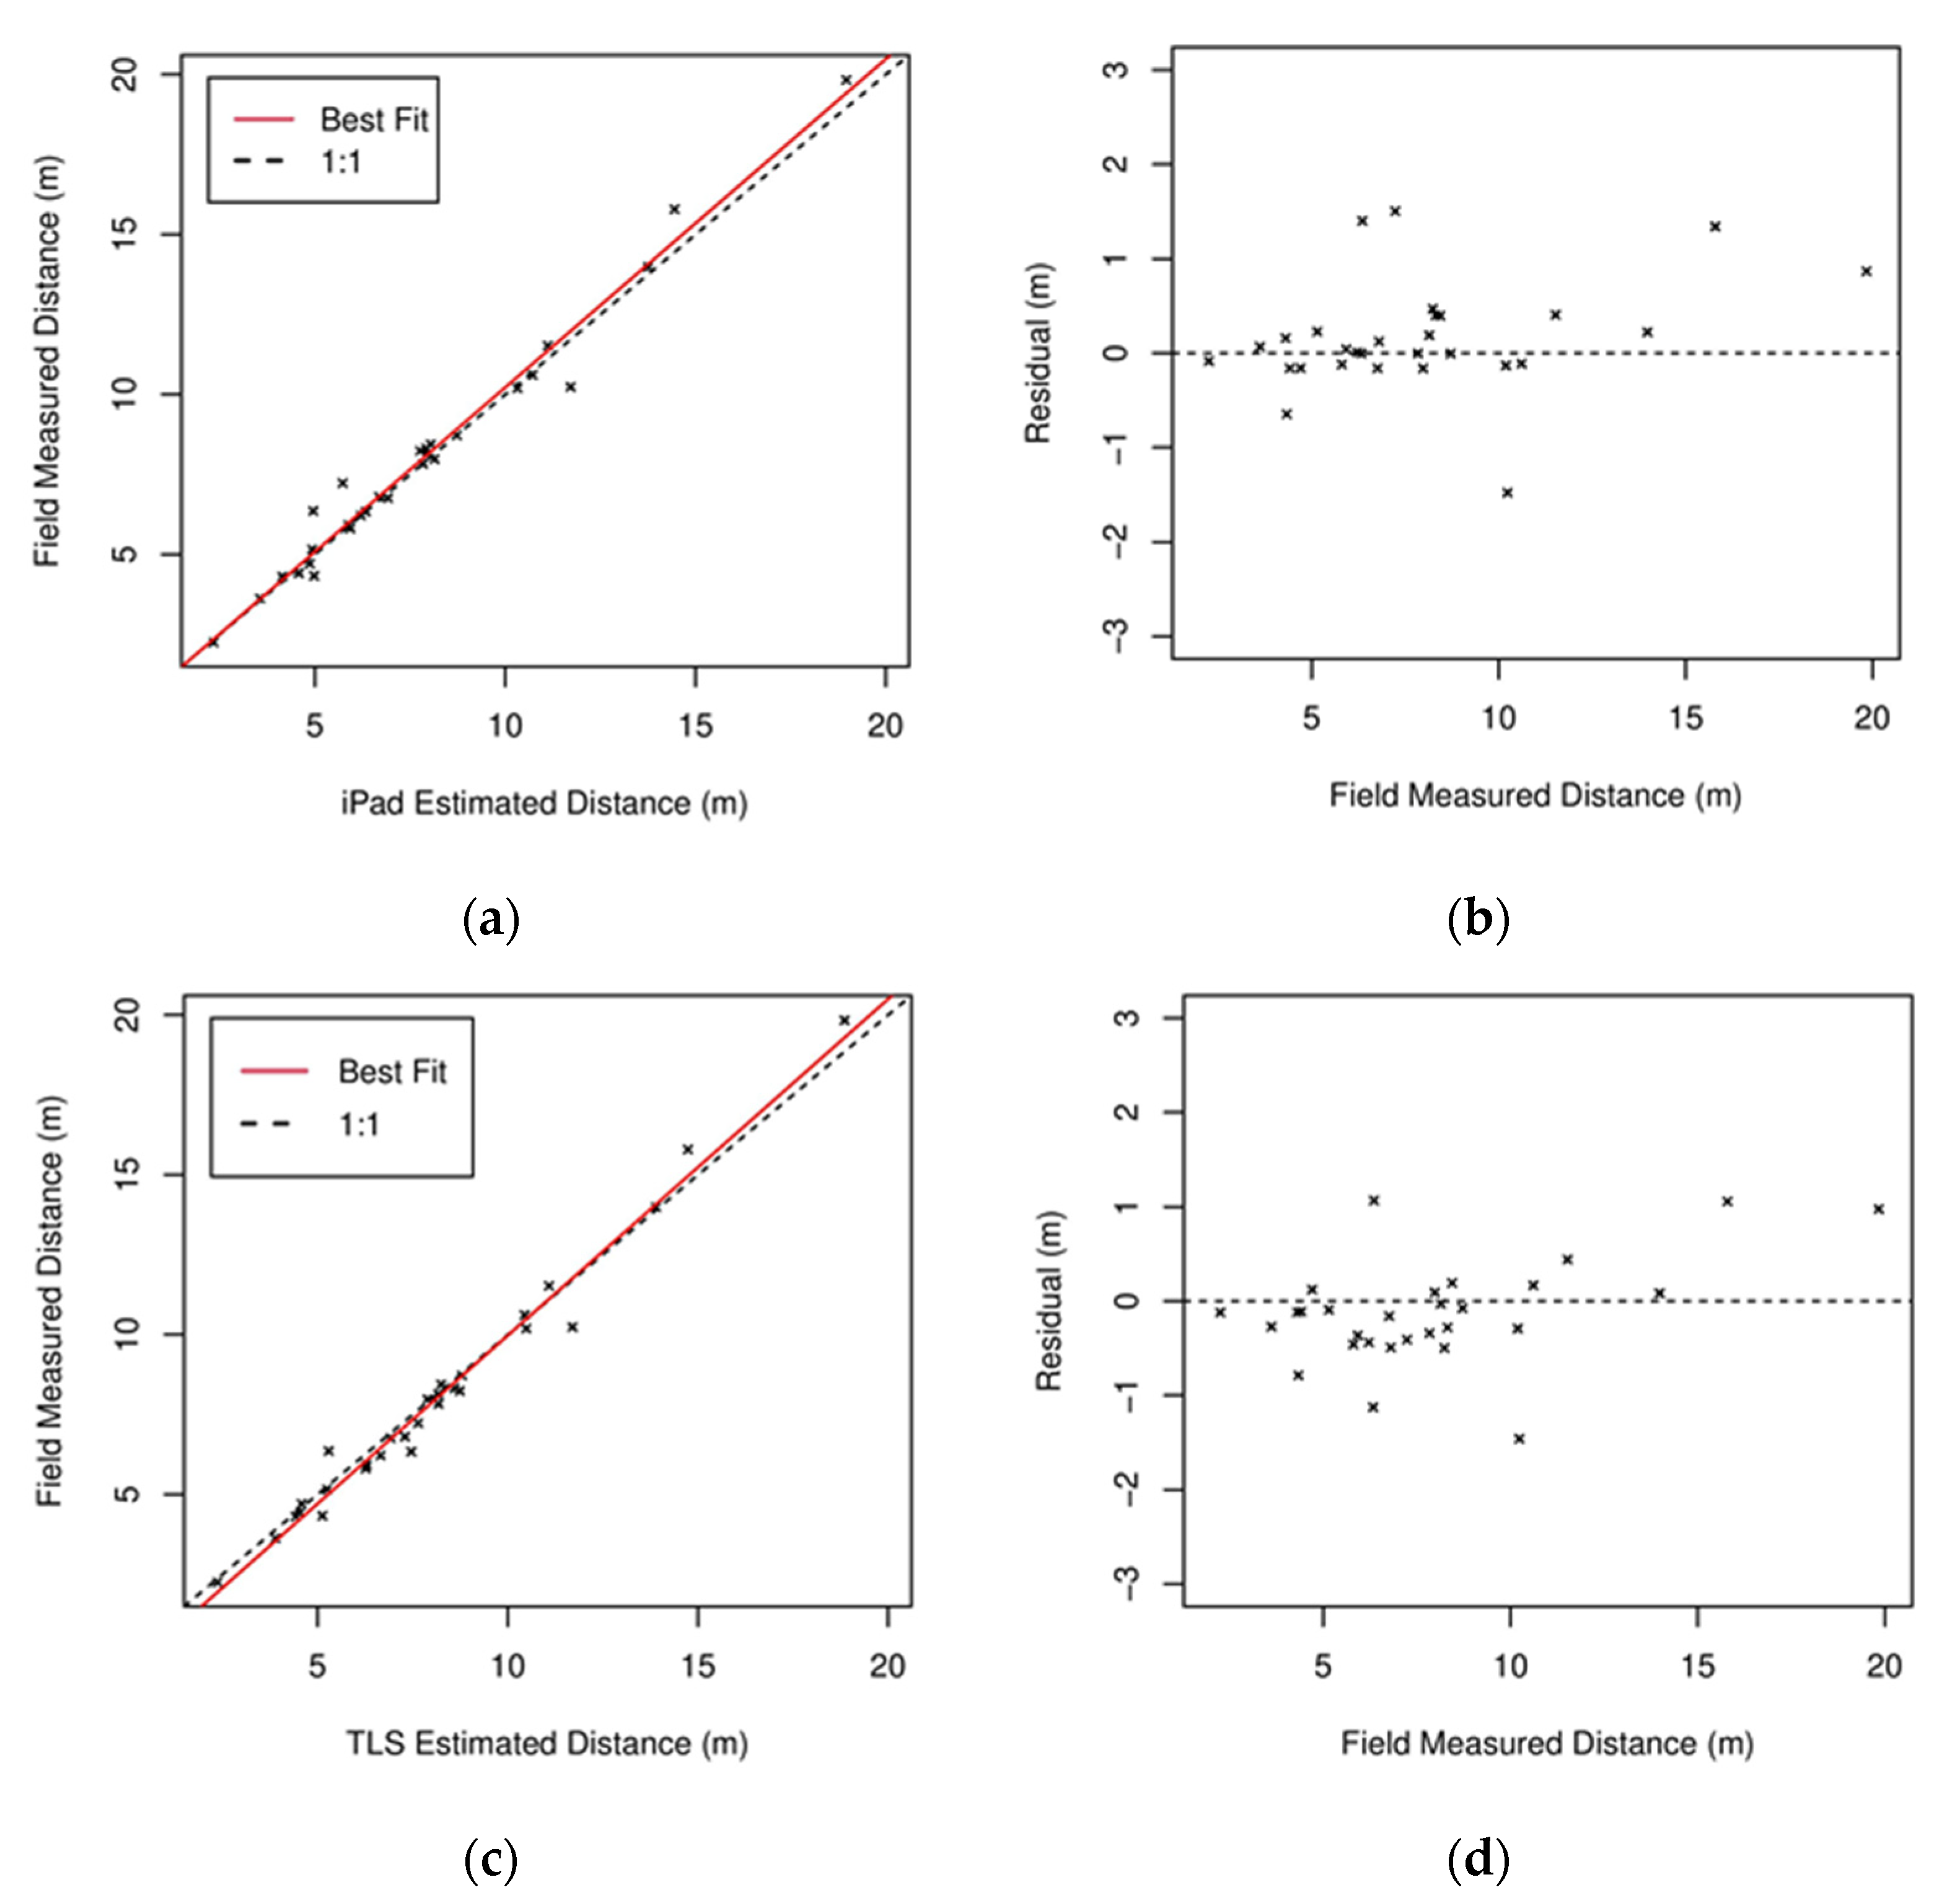
3.1.4. Comparison of Distance between Trees from iPad and TLS vs. a Laser Distance Meter in the Managed Forest Stand

Figure 19 shows a comparison of iPad distance estimations and TLS distance estimations, each with a separate field measurement, for the forest stand. Twenty-nine different distances were obtained from a total of 30 trees. The distance between the trees is similar in this managed forest stand, and based on the field measurements, the average distance was 7.9 m. The iPad estimated distance and TLS estimated distance plots are similar to each other (Figure 20a,c). The mean distance residual error of the TLS was 0.41 m, while the iPad mean distance residual was 0.38 m. In addition, TLS and iPad were found to have similar RMSE of 0.56 m and 0.59 m, respectively (Figure 20b,d). According to the iPad residual graph (Figure 19b), residual error increases at distances above 10 m.

3.2. Comparison of iPad LiDAR Scans from Different Distances

To compare the accuracy of iPad scanning based on the distance to the tree, an experiment was designed to determine accuracy of DBH measurements (Figure 8). For this test, a single pine tree in an open area was measured with a tape measure to determine its DBH (40.8 cm). It was then scanned from each of several different distances (1 m, 1.5 m, 2 m, 2.5 m, 5 m, and variable distances) with the iPad LiDAR sensor. Each scan was repeated three times, and the DBH was determined as detailed previously (Table 4).

4. Discussion

4.1. Ability of iPad LiDAR to Determine DBH and Tree Distance in Forest Stands

4.1.1. Evaluation of the iPad LiDAR Sensor for Measuring DBH

This study found that the DBH estimated from the iPad Pro LiDAR had nearly a 1:1 relationship with the field-measured DBH in both the managed forest stand and the urban forest area (Figure 16a and Figure 17a). The DBH of the scanned trees had average residual differences of 1.9 cm and 2.4 cm in the forest stand and the urban forest area, respectively (Figure 16b, Figure 17b and Figure 19b) when compared with the DBH based on field measurements with a tape measure. The DBH of trees scanned by the iPad usually had a residual error of 1–2 cm; however, DBH differences of 5–6 cm was observed in some trees. An evaluation of the error of DBH measurement at various differences (Table 4) found that there was greater error at the detection limit of the iPad LiDAR sensor (5m), with greatly reduced error at a 2 m scanning distance. This could help in understanding the variation in accuracies seen in this study. A visual examination of the iPad scans associated with trees with much higher-than-average residuals in DBH estimation (5–6 cm) (Figure 16b and Figure 17b), found that that there were bushes around these trees that prevented accurate scanning by the iPad. This indicates that errors in DBH scanning accuracy are most often because of a lack of line-of-sight visibility between the iPad LiDAR sensor and the tree at 1.3 m above the ground and not because of errors with the tree scanning. Additionally, an examination of the 3D forest structure data found that if 20–25% of the tree trunk was covered by ground vegetation, it did not significantly affect the success of the scanning. However, if 60–70% of the tree trunk was covered by this vegetation, it typically caused an increase in the error rate (Figure 21). In addition, no relationship was observed between these results and the size of the DBH of the trees, so there does not appear to be any systematic scanning error associated with larger or smaller diameter trees within the context of this study.

4.1.2. Evaluation of the iPad LiDAR Sensor for Measuring Distance between Trees

This study also examined if the iPad LiDAR sensor could accurately measure the 3D structure of the forest for future efforts to determine tree density or wildlife habitat based on a scan. Evaluating the accuracy of distance between trees was studied, compared with a more conventional method using a laser distance measurement device, to determine the accuracy of tree distance measurements. In this study, the distance between trees reached a maximum of 8.1 m in the urban forest area, while in the managed forest stand, it reached a maximum of 19–20 m. The average residual difference in distance between the trees was 0.38 m and 0.21 m in the forest stand and the urban forest area, respectively (Figure 17b, Figure 19b and Figure 20b).
Some or all of these differences may be attributed to field measurement errors because of the difficulty of holding the laser distance device level. While overall, the iPad provided reasonable accuracy for distance measurements between trees, the error difference increased to 1.1–1.3 m when the distance between the trees exceeded 10 m in the forest stand (Figure 20b). When the distance between trees exceeded 10 m, the residual error increased to over 1 m. There are possible explanations for this issue. If there are large distances between trees, the iPad may lose the relative position of the trees. Also, extensive ground cover between areas with sparse tree density may interfere with the ability to smoothly move the tablet between the trees, which could cause errors in the Forge application placement of trees.

4.2. Comparison of TLS and iPad

4.2.1. Comparison of the DBH between TLS and the iPad in the Forest Stand

This study used TLS and an iPad in the small forest area and then compared them with field measurements to evaluate their accuracy for forest metric determination. Studies have previously found that TLS is a reliable method to determine physical tree properties for forest inventory [5]. In the forest stand, the mean TLS residual error for DBH estimation was 4.8 cm compared with field measurements taken with a tape measure (Figure 18b). The TLS DBH typically had lower accuracy compared to the ground truth in the relationship plot (Figure 18a). It also appeared that the diameter of the trees had no effect on TLS residuals. Based on field measurements, there were 10–11 cm differences between field measurements and 3D forest estimates with the TLS data appeared for some trees (Figure 18b). While the DBH obtained from the iPad had a 1–2 cm error (Figure 17b) in the residual graph compared with the field measure, the TLS usually had a 4–8 cm error in the residual graph (Figure 18b). According to these results, the iPad was a more accurate method to estimate DBH compared with using the single point acquired TLS data. The reason why TLS data failed to determine DBH compared with the iPad may be explained by the way that some trees in the 3D point cloud representations created by TLS had insufficient point clouds at a tree height of 1.30 m. The accuracy of the TLS measurements would have likely been higher if multiple scans were combined before DBH and tree distance measurements were estimated. This can easily occur with the fixed location TLS scanning because some trees block other trees, which can prevent the scanning of trees that are not directly in the line of sight of the scanning LiDAR sensor. These partially blocked trees have insufficient point clouds (especially at 1.30 m), which increases the DBH estimation error rate increases. These errors can be reduced by combining multiple TLS scans from different positions to limit the number of blocked scans. While this study used three TLS scans, it did not combine the scans for analysis but instead picked out the best scan for a particular set of trees to be evaluated which likely reduced the accuracy of the presented TLS analysis.

4.2.2. Comparison of the Distance between Trees among TLS and iPad

The calculation of distances between trees was also evaluated with 3D forest data from TLS and iPad. After scanning the trees using TLS, the residual value of the distance between the trees was determined to be 0.41 m on average (Figure 20d). The points where the distance between the trees was between 5 m and 10 m had the lowest error when looking at the plot (Figure 20c); when the distance between the trees exceeded 15 m, the best fit line moved away from the 1:1 line (Figure 20c), and the residual difference increased. It is important to note that the TLS error could have likely been reduced if multiple scans, from different angles, were combined.

4.3. How Successful Is the iPad in Scanning from Different Distances?

The evaluation of LiDAR from fixed and variable distances can help understand the best practices for accuracy in a forested environment. Based on the scans at 1, 1.5, 2, 2.5, and 5 m, the residual errors were 1 cm, 1.2 cm, 0.2 cm, 2.8 cm, 6.5 cm, respectively, while the residual error of the zigzag was 3.7 cm. The lowest residual error (0.2 cm) was obtained with scanning from a 2 m distance to the targeted tree, while the highest error (6.5 cm) was obtained from scanning from a 5 m distance to the targeted tree, which is not surprising considering it is near the edge of the range of the LiDAR sensor. The 2m range may be the optimal distance for scanning. In addition, the residual error (3.7 cm) obtained in the zigzag (2 m to 5 m) scan shows that irregular movements during the scan decreased the scanning accuracy.

4.4. Future Application of iPad LiDAR for Crowdsourced Data Aquisition

The use of the LiDAR system for evaluating forests is steadily increasing. Multiple researchers have successfully used LiDAR in forestry by using various types of LiDAR scanning (TLS, PLS, ALS, etc.) [1,7]. However, since these systems are generally expensive, field-based LiDAR systems have found very limited use in many areas and countries. The iPad LiDAR sensor does have limitations, such as having a range of 5 m, but could be used for the accurate evaluation of DBH and forest density in small forest stands, and provides a unique potential to enable crowdsourcing of critical urban forest and forest metrics. The LiDAR system is being integrated into both phone and iPad Apple devices, so the availability of these devices could serve to democratize and allow crowdsourcing of urban forest and forest areas scans. Crowdsourcing spatial data has the potential to greatly improve scientific knowledge by enabling the public to collect data [29]. For example, crowdsourced tree density and DBH data could be combined with remote sensed tree height data (e.g., aerial LiDAR or photogrammetry) to better estimate tree carbon storage in urban forest and other forest areas. One of the main limitations of aerial LiDAR scanning is the inability to measure tree DBH and accurate distance between tree heights compared with mobile LiDAR scanning systems [30]. There are two distinct parts of forest data capture and metric determination with the iPad data. The data collection aspect requires little training and could be crowdsourced and uploaded to a repository where the analysis for DBH and forest density could be performed or automated by domain experts.

5. Conclusions

This study demonstrates the use of a consumer tablet with an embedded LiDAR sensor, with a companion tablet software application and processing methodology to estimate DBH accurately and rapidly, and the distance between trees for small forest stands. In the research, a 3D forest structure was created with the iPad Pro LiDAR sensor used to measure tree attributes based on the collected point cloud data. The accuracy of the iPad Pro was compared with TLS and field measurement methods, however, the accuracy of the TLS results was likely impacted by using only one scan instead of fusing multiple scans, and the distance from the TLS scanner to the tree when compared with the close-proximity iPad LiDAR scan. In the study, while the DBH of the 3D trees was determined with the 3D Forest software, the distances between the trees were measured with the CloudCompare software. While obtaining data from working areas with iPad LiDAR is faster than the conventional field measurements methods, it takes longer than scanning with a TLS system. The most significant disadvantage of the iPad Pro is that it has a range of up to 5 m, especially when compared with TLS, which has a range of 70 m. The iPad data were obtained from the forest stand and the urban area, which had an estimated mean residual error of 1.9 cm and 2.4 cm, respectively. In addition, in the study, the distances between trees were estimated with a mean residual error of 0.21 m and 0.38 m for the urban area and the forest stand, respectively. Analysis of the iPad LiDAR data provides accurate results in both the forest and urban forest study areas when compared with field measurement techniques. Use of the iPad system to characterize small forest areas has both limitations and advantages to other manual field sampling and LiDAR scanning systems. Two important limitations to note is that the iPad system cannot typically be used to determine tree height, and it can be difficult to scan trees in areas with significant groundcover. Tree height is a critical forest metric that would have to be acquired through a separate measurement technique (separate LiDAR distance sensor, aerial LiDAR data, etc.) to allow the iPad to replace existing methods. The iPad LiDAR is much lower cost compared with other LiDAR systems, which may increase the use of LiDAR for urban forest and forest characterization. The Apple LiDAR system is rapidly becoming available on millions of devices which could allow for crowdsourcing of forest areas scans because the use of this system requires little to no training. An additional advantage of the iPad system compared with manual tree measurement techniques is that the result of the scan is an accurate 3D representation of the trees that could be used to evaluate aspects of forest density not possible with manual methods. However, it is not practical to employ the iPad LiDAR system in large forest areas because of the time required to scan each tree, and this technique may be best suited for urban environments which commonly have less ground cover vegetation between trees, making it easier to navigate when scanning. The iPad system does not directly replace advanced LiDAR scanning systems and manual plot methods, but because if it’s ease of use, accuracy, and low cost, it could become a valuable tool in resource limited countries in both forest and urban areas.

Author Contributions

Conceptualization, C.J.P.; methodology, G.Y.Ç.; formal analysis, G.Y.Ç.; writing—original draft preparation, G.Y.Ç.; writing—review and editing, C.J.P., E.A.M., M.A.S. All authors have read and agreed to the published version of the manuscript.

Funding

Funding was provided by the Republic of Turkey National Education Ministry and Clemson University. The publishing of this article was partially supported by the Clemson University Libraries Open Access Publishing Fund and the Clemson Department of Forestry and Environmental Conservation.

Acknowledgments

We would like to thank the reviewers for their constructive comments and suggestions. We would also like to thank Abound Labs, Inc. for allowing us to use their pre-release Forge application.

Conflicts of Interest

The authors declare no conflict of interest.

References

  1. Gollob, C.; Ritter, T.; Nothdurft, A. Forest inventory with long-range and high-speed Personal Laser Scanning (PLS) and Simultaneous Localization and Mapping (SLAM) technology. Remote Sens. 2020, 12, 1509. [Google Scholar] [CrossRef]
  2. Magarik, Y.A.S.; Roman, L.A.; Henning, J.G. How should we measure the DBH of multi-stemmed urban trees? Urban For. Urban Green. 2020, 47, 126481. [Google Scholar] [CrossRef]
  3. Luoma, V.; Saarinen, N.; Wulder, M.A.; White, J.C.; Vastaranta, M.; Holopainen, M.; Hyyppä, J. Assessing precision in conventional field measurements of individual tree attributes. Forests 2017, 8, 38. [Google Scholar] [CrossRef] [Green Version]
  4. Ryding, J.; Williams, E.; Smith, M.J.; Eichhorn, M.P. Assessing handheld mobile laser scanners for forest surveys. Remote Sens. 2015, 7, 1095–1111. [Google Scholar] [CrossRef] [Green Version]
  5. Liang, X.; Kankare, V.; Hyyppä, J.; Wang, Y.; Kukko, A.; Haggrén, H.; Yu, X.; Kaartinen, H.; Jaakkola, A.; Guan, F.; et al. Terrestrial laser scanning in forest inventories. ISPRS J. Photogramm. Remote Sens. 2016, 115, 63–77. [Google Scholar] [CrossRef]
  6. Hummel, S.; Hudak, A.T.; Uebler, E.H.; Falkowski, M.J.; Megown, K.A. A comparison of accuracy and cost of LiDAR versus stand exam data for landscape management on the Malheur National Forest. J. For. 2011, 109, 267–273. [Google Scholar] [CrossRef]
  7. Brede, B.; Lau, A.; Bartholomeus, H.M.; Kooistra, L. Comparing RIEGL RiCOPTER UAV LiDAR derived canopy height and DBH with terrestrial LiDAR. Sensors 2017, 17, 2371. [Google Scholar] [CrossRef] [PubMed]
  8. Gollob, C.; Ritter, T.; Nothdurft, A. Comparison of 3D point clouds obtained by terrestrial laser scanning and personal laser scanning on forest inventory sample plots. Data 2020, 5, 103. [Google Scholar] [CrossRef]
  9. Watt, P.J.; Donoghue, D.N.M. Measuring forest structure with terrestrial laser scanning. Int. J. Remote Sens. 2005, 26, 1437–1446. [Google Scholar] [CrossRef]
  10. Maas, H.G.; Bienert, A.; Scheller, S.; Keane, E. Automatic forest inventory parameter determination from terrestrial laser scanner data. Int. J. Remote Sens. 2008, 29, 1579–1593. [Google Scholar] [CrossRef]
  11. Lim, K.; Treitz, P.; Wulder, M.; St-Ongé, B.; Flood, M. LiDAR remote sensing of forest structure. Prog. Phys. Geogr. 2003, 27, 88–106. [Google Scholar] [CrossRef] [Green Version]
  12. Del Perugia, B.; Giannetti, F.; Chirici, G.; Travaglini, D. Influence of scan density on the estimation of single-tree attributes by hand-held mobile laser scanning. Forests 2019, 10, 277. [Google Scholar] [CrossRef] [Green Version]
  13. Zhou, S.; He, G.; Kang, F.; Li, W.; Kan, J.; Zheng, Y. Extracting diameter at breast height with a handheld mobile LiDAR system in an outdoor environment. Sensors 2019, 19, 3212. [Google Scholar] [CrossRef] [Green Version]
  14. Hill, R.A.; Hinsley, S.A.; Broughton, R.K. Assessing habitats and organism-habitat relationships by airborne laser scanning. For. Appl. Airborne Laser Scanning 2014, 27, 335–356. [Google Scholar]
  15. Blakey, R.V.; Law, B.S.; Kingsford, R.T.; Stoklosa, J. Terrestrial laser scanning reveals below-canopy bat trait relationships with forest structure. Remote Sens. Environ. 2017, 198, 40–51. [Google Scholar] [CrossRef]
  16. Razenkova, E.; Radeloff, V.C.; Dubinin, M.; Bragina, E.V.; Allen, A.M.; Clayton, M.K.; Pidgeon, A.M.; Baskin, L.M.; Coops, N.C.; Hobi, M.L. Vegetation productivity summarized by the Dynamic Habitat Indices explains broad-scale patterns of moose abundance across Russia. Sci. Rep. 2020, 10, 1–12. [Google Scholar] [CrossRef] [Green Version]
  17. Hull, I.T.; Shipley, L.A. Testing the ability of airborne LiDAR to measure forage resources for wild ungulates in conifer forests. J. For. 2019, 117, 492–503. [Google Scholar] [CrossRef]
  18. Cox, S.K.; Straka, T.J. The new deal’s land utilization program and the Clemson University experimental forest. J. For. 2018, 116, 197–203. [Google Scholar] [CrossRef]
  19. Wang, Y.; Lehtomäki, M.; Liang, X.; Pyörälä, J.; Kukko, A.; Jaakkola, A.; Liu, J.; Feng, Z.; Chen, R.; Hyyppä, J. Is field-measured tree height as reliable as believed—A comparison study of tree height estimates from field measurement, airborne laser scanning and terrestrial laser scanning in a boreal forest. ISPRS J. Photogramm. Remote Sens. 2019, 147, 132–145. [Google Scholar] [CrossRef]
  20. Apple Inc. Apple. Available online: www.apple.com/newsroom/2020/03/apple-unveils-new-ipad-pro-with-lidar-scanner-and-trackpad-support-in-ipados/ (accessed on 21 May 2021).
  21. Anuj Bhatia The IndianEXPRESS. Available online: https://indianexpress.com/article/technology/tech-news-technology/what-is-lidar-and-why-is-it-in-apples-new-ipad-pro-2020-6323223/ (accessed on 21 May 2021).
  22. Apple Inc. Apple. Available online: www.apple.com/augmented-reality/ (accessed on 20 June 2021).
  23. TechTarget Contributor TechTarget. Available online: Whatis.techtarget.com/definition/augmented-reality-app-AR-app (accessed on 14 June 2021).
  24. Dimitrov, N.; Georgiev, I. Global geodynamics from 14 years of LAGEOS satellite ranging data. Int. Multidiscip. Sci. GeoConference Surv. Geol. Min. Ecol. Manag. 2019, 19, 149–156. [Google Scholar] [CrossRef]
  25. Trochta, J.; Krůček, M.; Vrška, T.; Král, K. 3D forest: An application for descriptions of three-dimensional forest structures using terrestrial LiDAR. PLoS ONE 2017, 12, e0176871. [Google Scholar] [CrossRef] [PubMed] [Green Version]
  26. Král, K.; Krůček, M. 3D Forest. Available online: www.3dforest.eu (accessed on 20 May 2021).
  27. CloudCompare. 3D Point Cloud and Mesh Processing Software. Open Source Project. 2019. Available online: http://www.cloudcompare.org/ (accessed on 20 May 2021).
  28. Xu and Oja DBH RHT. Available online: https://github.com/VUKOZ-OEL/3DForest/wiki/09.-Trees (accessed on 14 June 2021).
  29. Werts, J.D.; Mikhailova, E.A.; Post, C.J.; Sharp, J.L. An integrated WebGIS framework for volunteered geographic information and social media in soil and water conservation. Environ. Manag. 2012, 49, 816–832. [Google Scholar] [CrossRef] [PubMed]
  30. Donager, J.J.; Sánchez Meador, A.J.; Blackburn, R.C. Adjudicating perspectives on forest structure: How do airborne, terrestrial, and mobile Lidar-derived estimates compare? Remote Sens. 2021, 13, 2297. [Google Scholar] [CrossRef]
Figure 1. Location of the study areas in Pickens County, South Carolina (SC), USA.
Urbansci 05 00088 g001
Figure 2. Sampling locations: (a) stand in the Clemson Experimental Forest, (b) urban forest stand on the Clemson University Campus.
Urbansci 05 00088 g002
Figure 3. Project workflow.
Urbansci 05 00088 g003
Figure 4. 3D Forest structure created by a terrestrial laser scanner (TLS).
Urbansci 05 00088 g004
Figure 5. iPad LiDAR scanning error with one tree appearing as two separate trees.
Urbansci 05 00088 g005
Figure 6. iPad LiDAR scanning error with one tree appearing as two separate trees.
Urbansci 05 00088 g006
Figure 7. View of Forge application on the iPad Pro while scanning a forest stand.
Urbansci 05 00088 g007
Figure 8. Scanning the tree from five different distances and additionally scanning with zigzag path.
Urbansci 05 00088 g008
Figure 9. Measuring distance between trees in CloudCompare software.
Urbansci 05 00088 g009
Figure 10. TLS data imported into 3D Forest prior to segmentation.
Urbansci 05 00088 g010
Figure 11. iPad LiDAR data divided into terrain cloud (cream color) and vegetation cloud (brown).
Urbansci 05 00088 g011
Figure 12. An individual tree in the manual tree selection mode of the 3D Forest software.
Urbansci 05 00088 g012
Figure 13. Selecting trees in manual tree selection mode with 3D Forest software.
Urbansci 05 00088 g013
Figure 14. Identifying the tree base using the position lowest point function in the 3D Forest software.
Urbansci 05 00088 g014
Figure 15. Measurement of DBH from TLS data in the 3D Forest software.
Urbansci 05 00088 g015
Figure 16. A DBH comparison between iPad LiDAR-derived and field measured data in an urban forest: (a) regression plots for DBH from iPad LiDAR, and (b) residuals for the estimated field measured DBH.
Urbansci 05 00088 g016
Figure 17. Forest stand measurements: (a) DBH comparison between iPad LiDAR to field measurements (tape measure). (b) Regression plots for DBH from iPad LiDAR data residuals for the estimated DBH.
Urbansci 05 00088 g017
Figure 18. Forest stand measurements: (a) DBH comparison between TLS to field measurements (tape measure). (b) Regression plots for DBH from TLS residuals for the estimated DBH.
Urbansci 05 00088 g018
Figure 19. Distance comparison between iPad LiDAR and a conventional measurement method (laser distance meter) in an urban forest: (a) regression plots for the distance between trees measured using iPad LiDAR and laser distance meter, and (b) residuals for the estimated field measured distance.
Urbansci 05 00088 g019
Figure 20. Distance comparison between iPad LiDAR and a conventional measurement method (laser distance meter) and distance comparison between TLS and a conventional method (laser distance) in stand: (a,c) the regression plots for the distance between trees determined from iPad LiDAR and TLS, while (b,d) shows the residuals for the estimated field measured distance.
Urbansci 05 00088 g020
Figure 21. Low ground vegetation around the tree base blocking the view of iPad LiDAR sensor.
Urbansci 05 00088 g021
Table 1. Characteristics of the sites sampled.
CharacteristicsSampling Sites
Managed Forest StandUrban Forest Stand
Tree speciesLoblolly pineLoblolly pine
Number of trees sampled3032
Average tree DBH 41.23 cm49.98 cm
Slope5.4%10.5%
Plot size1310 m21150 m2
Type of useExperimentalRecreational
Ground vegetationSubstantialLow
Note: DBH = diameter at breast height.
Table 2. Comparison of traditional tape measurements with the iPad Pro LiDAR and a TLS system.
RequirementsTape MeasurementsScanning Devices
iPad Pro LiDARTLS
Set-up timeNANA15 min (for each scan)
Required field time95 min 35–40 min10–15 min (for each scan)
Processing timeNA2–3 minSpecialized desktop software
Persons needed
Cost
2
$40 (USD)
1
$1000 (USD)
2
>$15,000
Note: TLS = Terrestrial laser scanner. USD = U.S. dollars.
Table 3. Field plot characteristics.
MeasurementsSampling Sites
Managed Forest StandUrban Forest Stand
Number of trees sampled3032
Average tree DBH41.2 cm49.9 cm
Minimum DBH31.5 cm22.9 cm
Maximum DBH59.7 cm84.4 cm
Average distance between trees7.9 m4.2 m
Minimum distance between trees2.25 m0.88 m
Maximum distance between trees15.7 m7.6 m
Notes: DBH = diameter at breast height. Minimum distance between trees indicates the closest distance between any two trees in a plot. Maximum distance shows largest distance between any two trees in a plot.
Table 4. Evaluating iPad LiDAR performance from various distances.
Measurement and StatisticsScan DistanceZigzag Scan Pattern
1.0 (m)1.5 (m)2.0 (m)2.5 (m)5.0 (m)(2 to 5 m)
Average DBH (cm)39.839.641.038.034.337.0
Absolute residual error (cm)1.01.20.22.86.53.7
Publisher’s Note: MDPI stays neutral with regard to jurisdictional claims in published maps and institutional affiliations.

