1. Introduction
Population ageing has always been a topic of widespread concern all over the world. To balance between institutional and non-institutional care, housing options for older people have been created to meet the diversity of needs in the community, such as villages, naturally-occurring retirement communities, cohousing and university-based retirement communities etc. [
1]. Retirement villages have become a viable housing option for older people since they address some of the physical and social issues for older people, which are usually reflected in improving the service quality and promoting the convenience of facilities [
2]. In Australia, the retirement village industry currently accommodates approximately 5.7% of Australians aged 65+ and 10% of those 75+. Uptake is expected to rise to around 7.5% (over 380,000 aged 65+) by 2025 [
3]. The industry is perceived by government and society as delivering a critical element of housing options for older Australians [
4].
Nevertheless, Australian baby boomers, a total of about 5.57 million people born between 1946 and 1966, are not embracing retirement villages. Specially, retirement village occupancy rates have dropped steadily in recent years, from 93% in 2017 to 89% in 2019 [
5]. A primary reason is that retirement villages have been developed from the traditional ageing framework of ‘disengagement theory of ageing’, with the underpinning assumption that withdrawing from society and living in age-segregated (normally gated) communities is natural and acceptable [
6]. Retirement villages are thus commonly perceived as places for ‘old people’ or ‘senior citizens’ and are viewed by the vast majority of baby boomers as being places for those in need of care [
7]. Compared with prior generations, boomers are not only healthier and wealthier, but they are very proud of their independence and certainly do not want to be separated out into retirement communities in something akin to older-people’s ghettos [
8]. They want to remain within the community. Unfortunately, existing Australian retirement villages have been largely static and unresponsive to baby boomers’ expectations, with the main focus of the industry to date being on economic gains [
9,
10]. In addition, retirement village’s complicated fee structure and complex contracts may be another reason that causes the decrease in occupancy [
11]. Unsurprisingly, the penetration rate of the retirement village industry in Australia has grown slowly in recent years.
Based on individual retirement villages as the unit of analysis, prior studies have broadly discussed both social and built environment factors that affect active ageing of retirement village residents to explore major themes such as residents’ wellbeing and behavior, retirement villages development and operational management, and residents’ relocation decisions [
12]. However, there have been a dearth of geographical studies looking into the geographical distribution of existing retirement villages at the regional level. Moreover, the older population is distributed unevenly across geographic areas and is changing dynamically over time as a result of social, geographic, and economic factors [
13]. To some extent, the geospatial distribution of retirement villages reflects the preference and choice made by the ageing population. Therefore, understanding the geographical locations of retirement villages at the level of suburbs and municipalities will provide a significant parameter to better understand the current and future development of the retirement village industry.
Especially for areas such as Southeast Queensland in Australia, which is experiencing a growth in new project developments in recent years, information regarding the locations and geographical or spatial distributions of retirement villages is of great value to both the developers and local governments to better allocate services and resources to support existing residents and eventually attract more potential residents [
14]. However, so far, little is known about the concentration and distribution patterns of retirement villages across geographical space, nor the future trend of new retirement village development.
Spatial inquiry for large amounts of demographic data requires a broad understanding of the research locations and a large number of comparisons between smaller regions [
15]. The use of GIS allows a better understanding of the distribution patterns and demographic processes of retirement villages and facilitates the visualization of geographic reference data. Rivera-Hernandez, M. et al. [
16] identified the naturally occurring retirement communities within a region by geospatial statistical data to visualize the distribution pattern. For more complex analysis of retirement villages, GIS can be used to model different scenarios for future planning [
17]. Combining the demographic data of the older population to understand the spatial distribution of retirement villages will help discover the residential pattern of older individuals, thereby predicting the trend of future retirement village planning to optimize the allocation of resources.
Therefore, this study aimed to examine the locations and geographical distribution of retirement villages, comprising both for-profit and not-for profit, in the Greater Brisbane Region of Australia, that has the second largest retirement villages penetration rate (following Perth in West Australia) among the Australian capital cities. Revealing the special patterns of retirement villages will facilitate both the industry and policymakers to better plan and implement resource allocation, and more importantly, better understand and satisfy the underlying living requirements of current and potential retirement village residents.
2. Materials and Methods
The latest Australian Bureau of Statistics (ABS) Census data of 2016 and Queensland Government open data on registered retirement village of 30 November 2020 [
18] was used for the research purpose. All the Retirement Village Schemes registered with the Department of Communities, Housing and Digital Economy are publicly available online and updated quarterly. Details of retirement villages include names, locations (e.g., address, suburbs, postcodes, etc.), number of units available, tenure types (e.g., leased, licensed, freehold, etc.), and scheme operators of Retirement Village Schemes.
As the location information of the registered retirement villages is available at the suburb level, the ABS census information of household members [
19] (65 years old and above) who usually reside in the households on the State Suburbs (SSC) level was used for data analysis. More importantly, it excluded holiday visitors and persons living in the nursing homes. In addition, the information regarding the scheme nature of operations (i.e., for-profit or not-for-profit) was obtained through the database of Australian Charities and Not-for-profit Commission [
20]. Given that all the above databases are publicly available and do not contain sensitive information, ethics approval was not needed in this study.
The Greater Brisbane Region was chosen as the case locality for the data analysis as this region has become a popular retirement destination for older Australians [
21], with some local government areas such as Moreton Bay region, Brisbane City region, and Redland region holding 37.5% of the retirement villages within Queensland. The Greater Brisbane Region comprises eight local government areas and covers a total area of around 15,800 square kilometers or one percent of Queensland’s total area and home to 2.27 million people, almost half of Queensland’s population which is about 4.7 million [
22]. The Greater Brisbane region is on the coastal plain east of the Great Dividing Range (a cordillera system in eastern Australia), which has a humid subtropical climate with hot, wet summers and moderately dry, moderately warm winters [
23,
24]. The pleasant weather throughout the year and the relatively low cost of living and housing are the main factors attracting older immigrants from other states to the Greater Brisbane region for ageing.
Descriptive analysis of retirement village details (e.g., number, size, contract types, etc.) was first conducted to have an overall picture of the retirement village profiles in the Greater Brisbane Region. After that, four approaches of analysis were conducted to identify the distribution of retirement villages: (a) geovisualization, (b) global Moran’s I (spatial autocorrelation), (c) local Moran’s I (cluster and outlier analysis), and (d) Getis-Ord Gi* (hot spot and cold spot analysis). The software of ESRI ArcMap version 10.8.1 was employed for data analysis.
Geovisualization was conducted to identify the geographical distribution of retirement villages, which is useful for discerning patterns across large geographical areas [
25,
26]. Global Moran’s I was used to measure spatial autocorrelation of retirement villages, which evaluated whether the distribution pattern of retirement villages was clustered, dispersed, or random. Local Moran’s I, a local spatial autocorrelation statistic [
27], was used to identify local clusters or outliers of retirement villages in the suburbs to understand their contribution to the ‘global’ cluster statistic. Unlike the global Moran’s I, which assessed the overall pattern and trend of retirement village proportions, local Moran’s I assessed each feature of the suburbs within the context of neighboring features and compared the local situation to the global situation. Finally, Getis-Ord Gi* (Gi*) was used to verify statistically significant spatial clusters of high values (hot spots) or low values (cold spots) of retirement village units.
3. Results
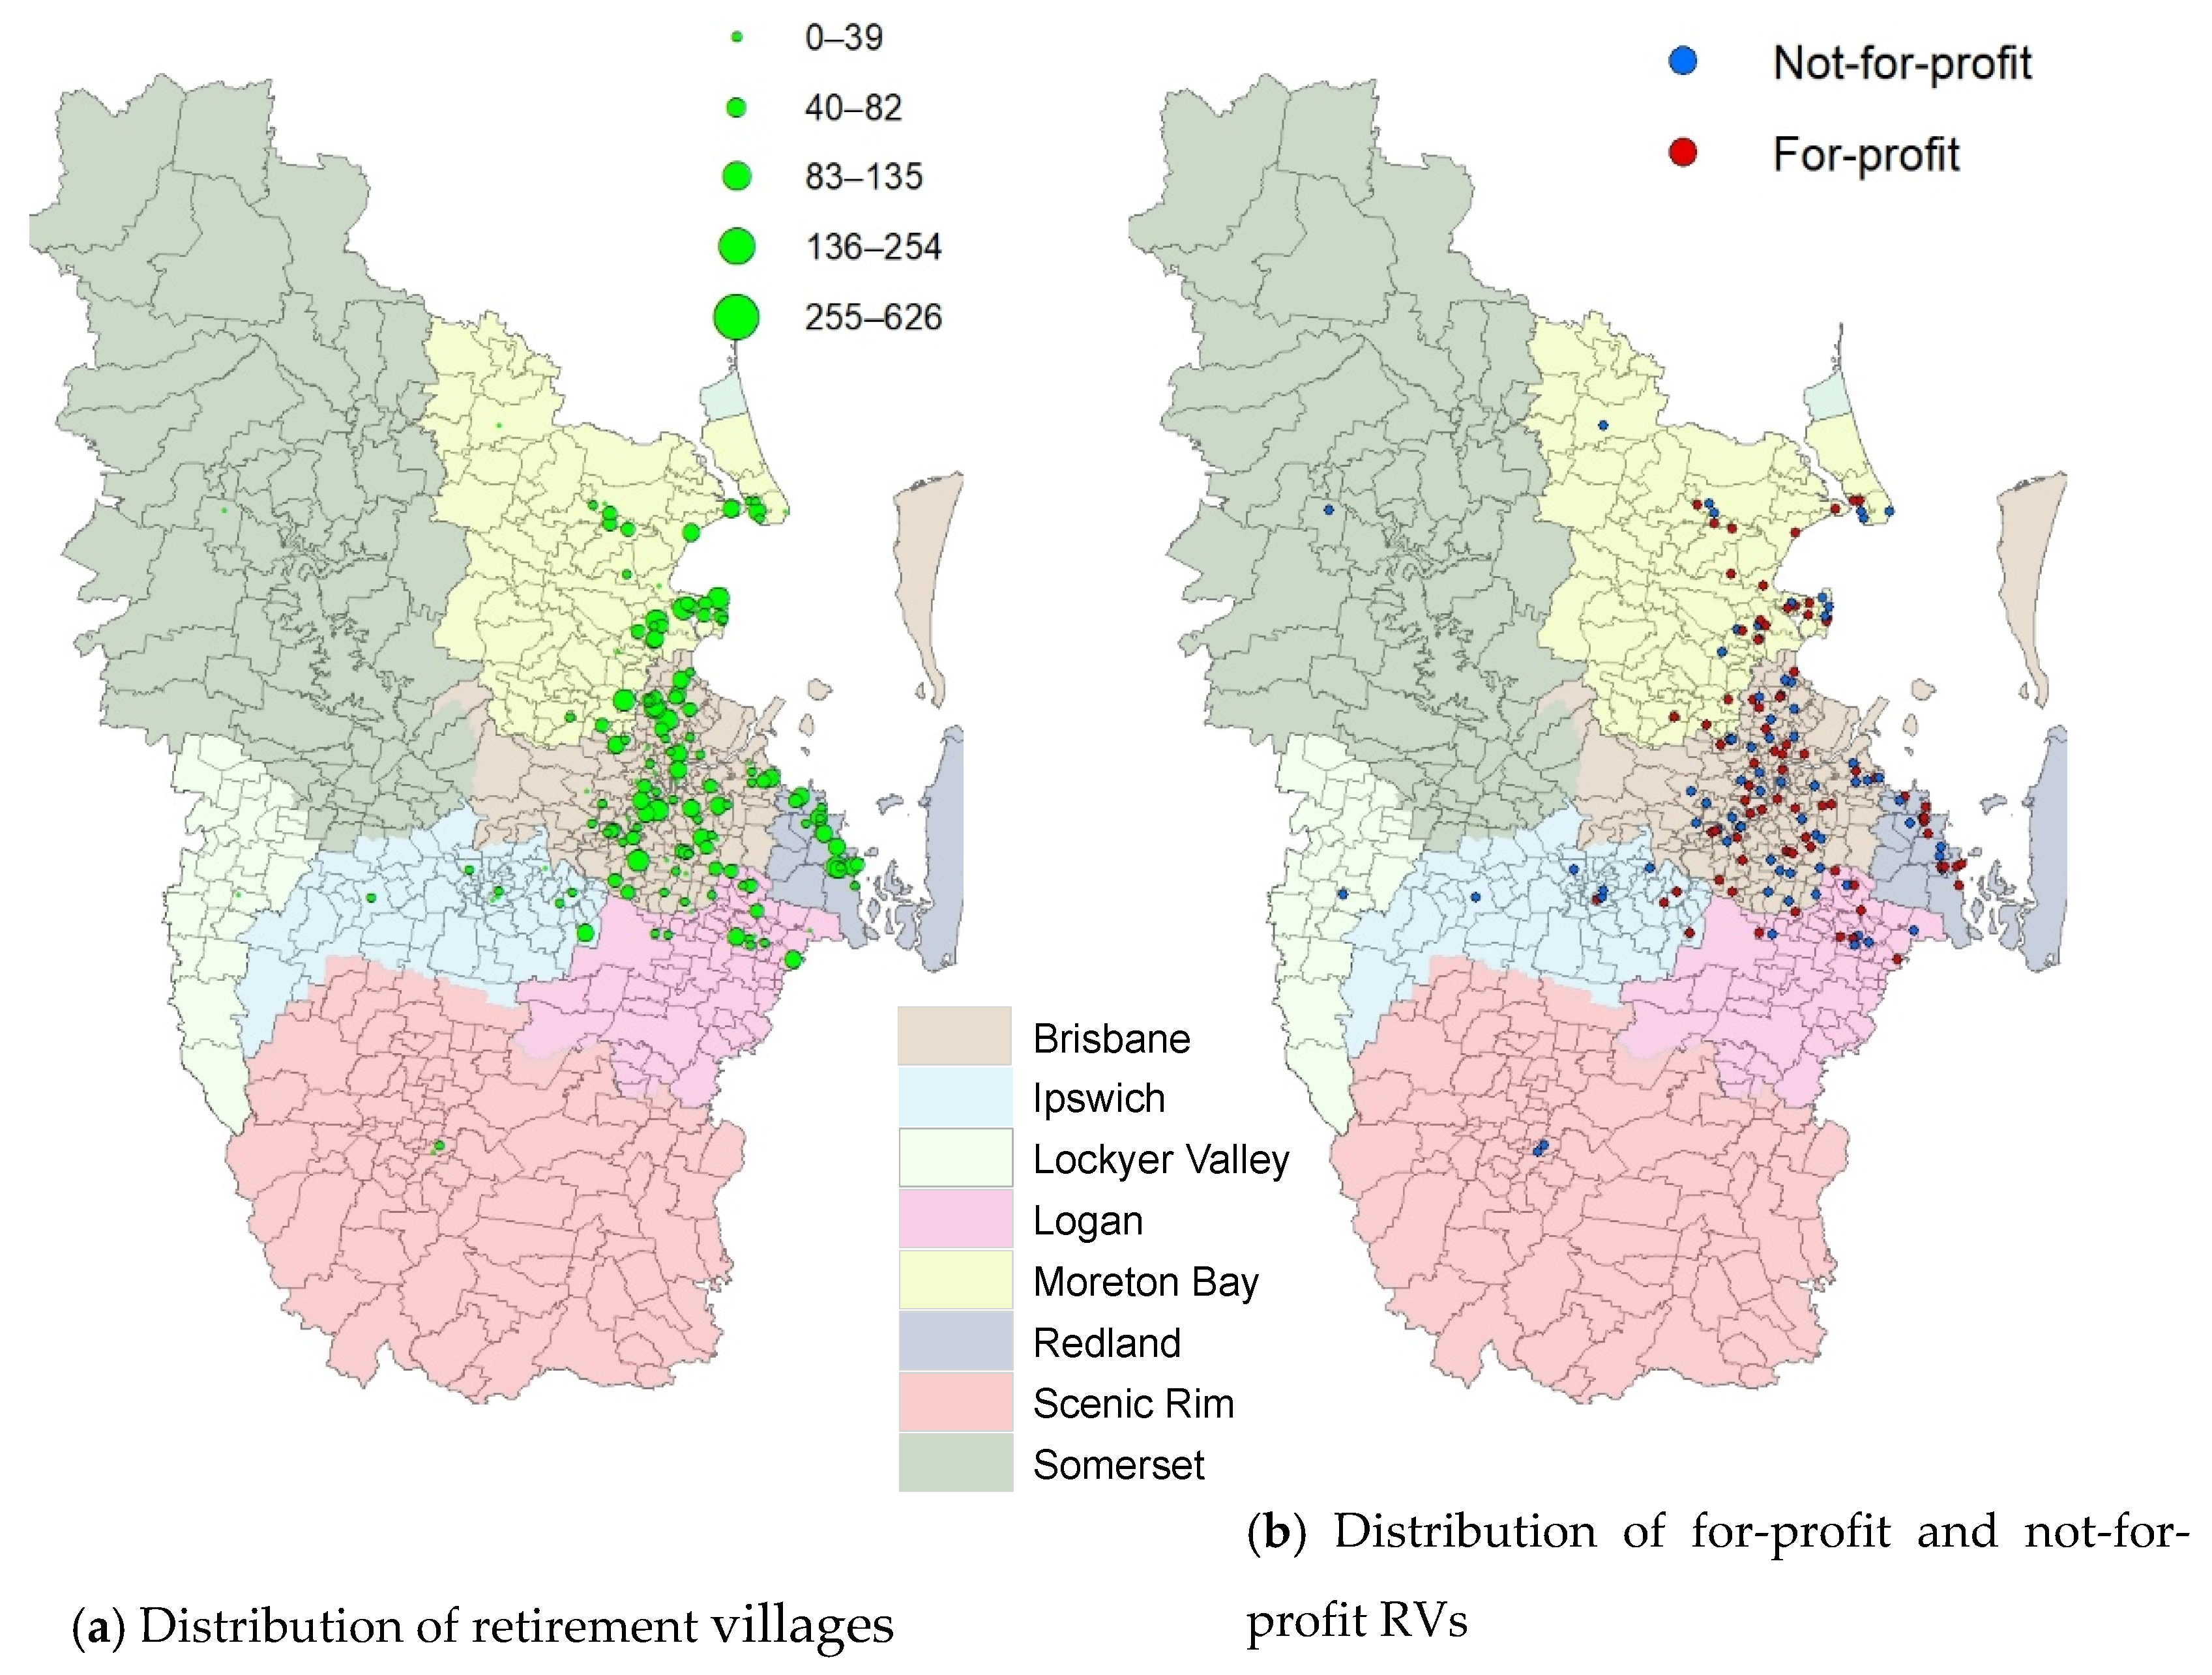
The total number of retirement villages in the greater Brisbane region was 154 (as of November 2020), located in 111 out of 671 suburbs. As shown in
Figure 1, most of the retirement villages were located in the local government areas of Brisbane region (
n = 73), Moreton Bay region (
n = 33), Redland Bay region (
n = 17), and Logan city council (
n = 15).
Figure 1b shows the distribution of for-profit and not-for-profit retirement villages and almost all the retirement villages located in the rural areas are not-for-profit ones of comparatively small size.
The 154 retirement villages contain a total of 15,001 units, of which the numbers of independent living unit, serviced apartment and other were 12,515, 1299, and 1187, respectively. The suburb with the highest number of units was Victoria Point which contained 812 units in total. As shown in
Table 1, of 154 retirement villages, 82 are for-profit ones, containing 10,201 total units, with the average size of 124 units in each retirement village. Comparatively, the not-for-profit retirement villages are smaller in size, containing 67 units in each retirement village on average.
Of the 15,001 units offered in 154 retirement villages, various types of contracts and agreements are devised by operators to describe contracts, including leased, licensed, freehold, and others. A leased agreement, also known as leasehold agreement, is the most frequently found operating model of retirement villages and a high level of security is provided to the resident as the lease of the unit is generally registered on the village’s title. As shown in
Table 2, the leased contract is the most widely used (58.8%), followed by licensed (32.6%) and freehold (7.2%) agreements. In addition, the leased (or leasehold) agreement is the most common one in for-profit units (77%), where the residents pay an ingoing contribution (generally for a 99-year lease period) so as to obtain an exclusive right to reside in an accommodation unit under the residence contract. Alternatively, the licensed agreement offers residents a right to occupy, which is often the least costly approach for residents but also offers the least security as the resident’s interest is not registered on the land’s title. The licensed agreement is preferred in not-for-profit retirement villages (77%), where residents make an interest-free loan (generally for the life of license only) to the operator in exchange for the right to reside. The freehold agreement, where the unit and land it stands upon are wholly owned by the resident, is only available in for-profit retirement villages. Usually in the form of community title schemes, freehold ownership can offer a sense of security and control to residents, and they also have a right to vote as part of the body corporate.
In order to assess whether the types of agreements adopted in for-profit and not-for-profit are significantly different, a chi-square test was conducted. The statistical result (p = 0.000) shows that for-profit and not-for-profit retirement villages have significantly different preference towards accommodation agreements.
In order to reveal the distribution patterns of retirement villages, in terms of spatial autocorrelation, cluster, and hotspot analysis, the following concept named retirement village prevalence for individual suburbs was designed for the statistical analysis:
Retirement village prevalence = the total number of retirement villages units/the number of older household members * 100%
This concept demonstrates how many retirement village units as per 100 older household members (65+) in individual suburbs. For example, the suburb with a high retirement village prevalence was Newstead (75.7%), which has 199 RV units in total but with only 263 older household members (65+) according to the ABS data.
Figure 2A visualizes the retirement village prevalence of individual suburbs in the greater Brisbane region of 2020.
Figure 2B shows the locations of retirement villages in individual suburbs with the different sizes of the spots indicating the different size of retirement villages (i.e., the number of total units in the retirement villages). It can be seen that suburbs with high retirement village prevalence are largely located along the costal line and urban areas, normally hosting large-size retirement villages. Those with low retirement village prevalence are primarily located in rural areas with a smaller village size.
To test whether the retirement villages are randomly distributed in the study area, Global Moran’s I statistic was conducted based on the information of retirement village prevalence. The result shows that the Global Moran’s I was 0.16 (z-score = 7.11; p < 0.001), which indicates that the overall distribution of suburbs with retirement villages were spatially auto-correlated or not randomly distributed (rejecting the null hypothesis). In other words, the suburbs with high retirement village prevalence tended to get close to similar ones. Given the z-score > 2.58 and p < 0.01, there was less than 1% likelihood that this clustered pattern could be the result of random chance. Furthermore, when Global Moran’s I statistics were conducted on Redland, Moreton Bay and Brisbane local government areas separately, the results were 0.09 (z-score = 0.82; p =0.41) for Redland region, indicating a random pattern; 0.28 (z-score = 4.42; p < 0.001) for the Moreton Bay region, revealing a cluster pattern; and 0.07 (z-score = 1.64; p =0.10) for the Brisbane region, showing the random distribution of retirement village in this region.
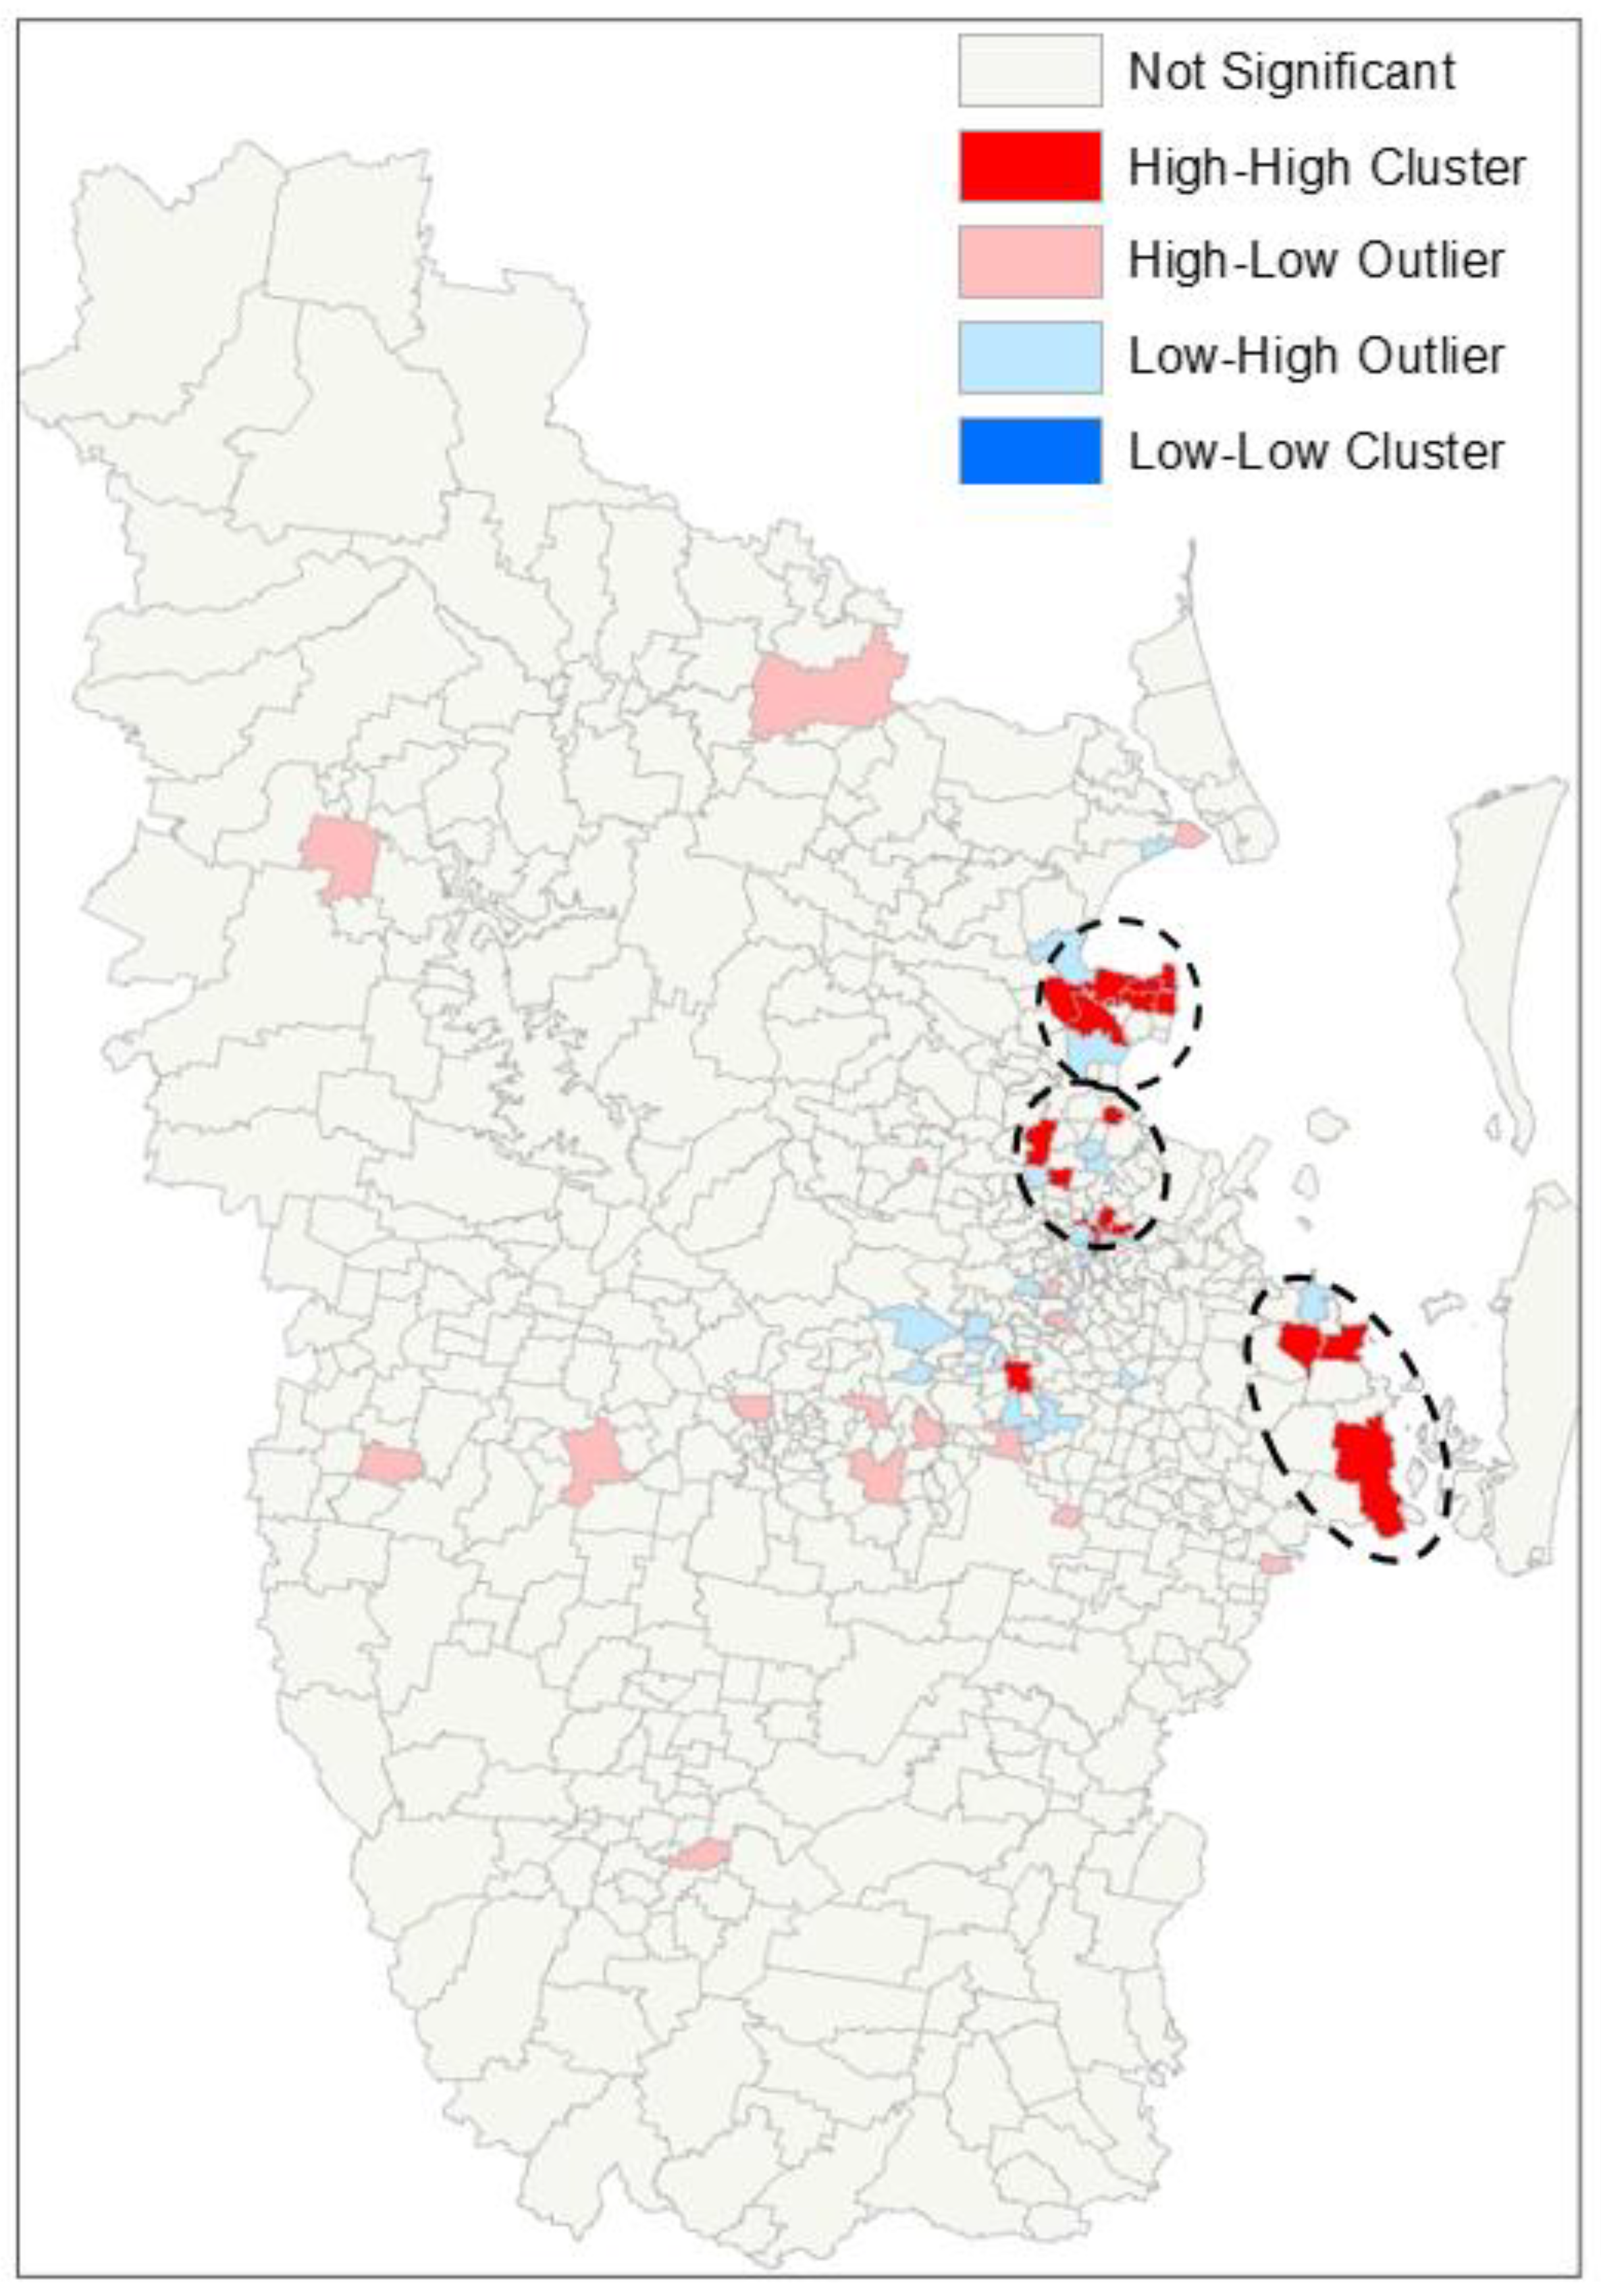
Local Moran’s I was used to detect clusters, outliers, and hot spots of suburbs with retirement villages.
Figure 3 shows that the high-high clusters of suburbs (i.e., suburbs with high retirement village prevalence that were co-located or clustered together, highlighted with red color) were located in some specific areas such as Clayfield, Redcliffe area, Redland Bay area. By contrast, there is no low-low cluster (where suburbs with low retirement village prevalence were co-located together) indicated in the research area. High-low outliers, i.e., suburbs with high retirement village prevalence are surrounded by suburbs with low retirement village prevalence, are mainly located in rural areas. By contrast, the low-high outliers, i.e., suburbs with low retirement village prevalence surrounded by those with high retirement village prevalence, are primarily located in the urban area or near the high-high clusters.
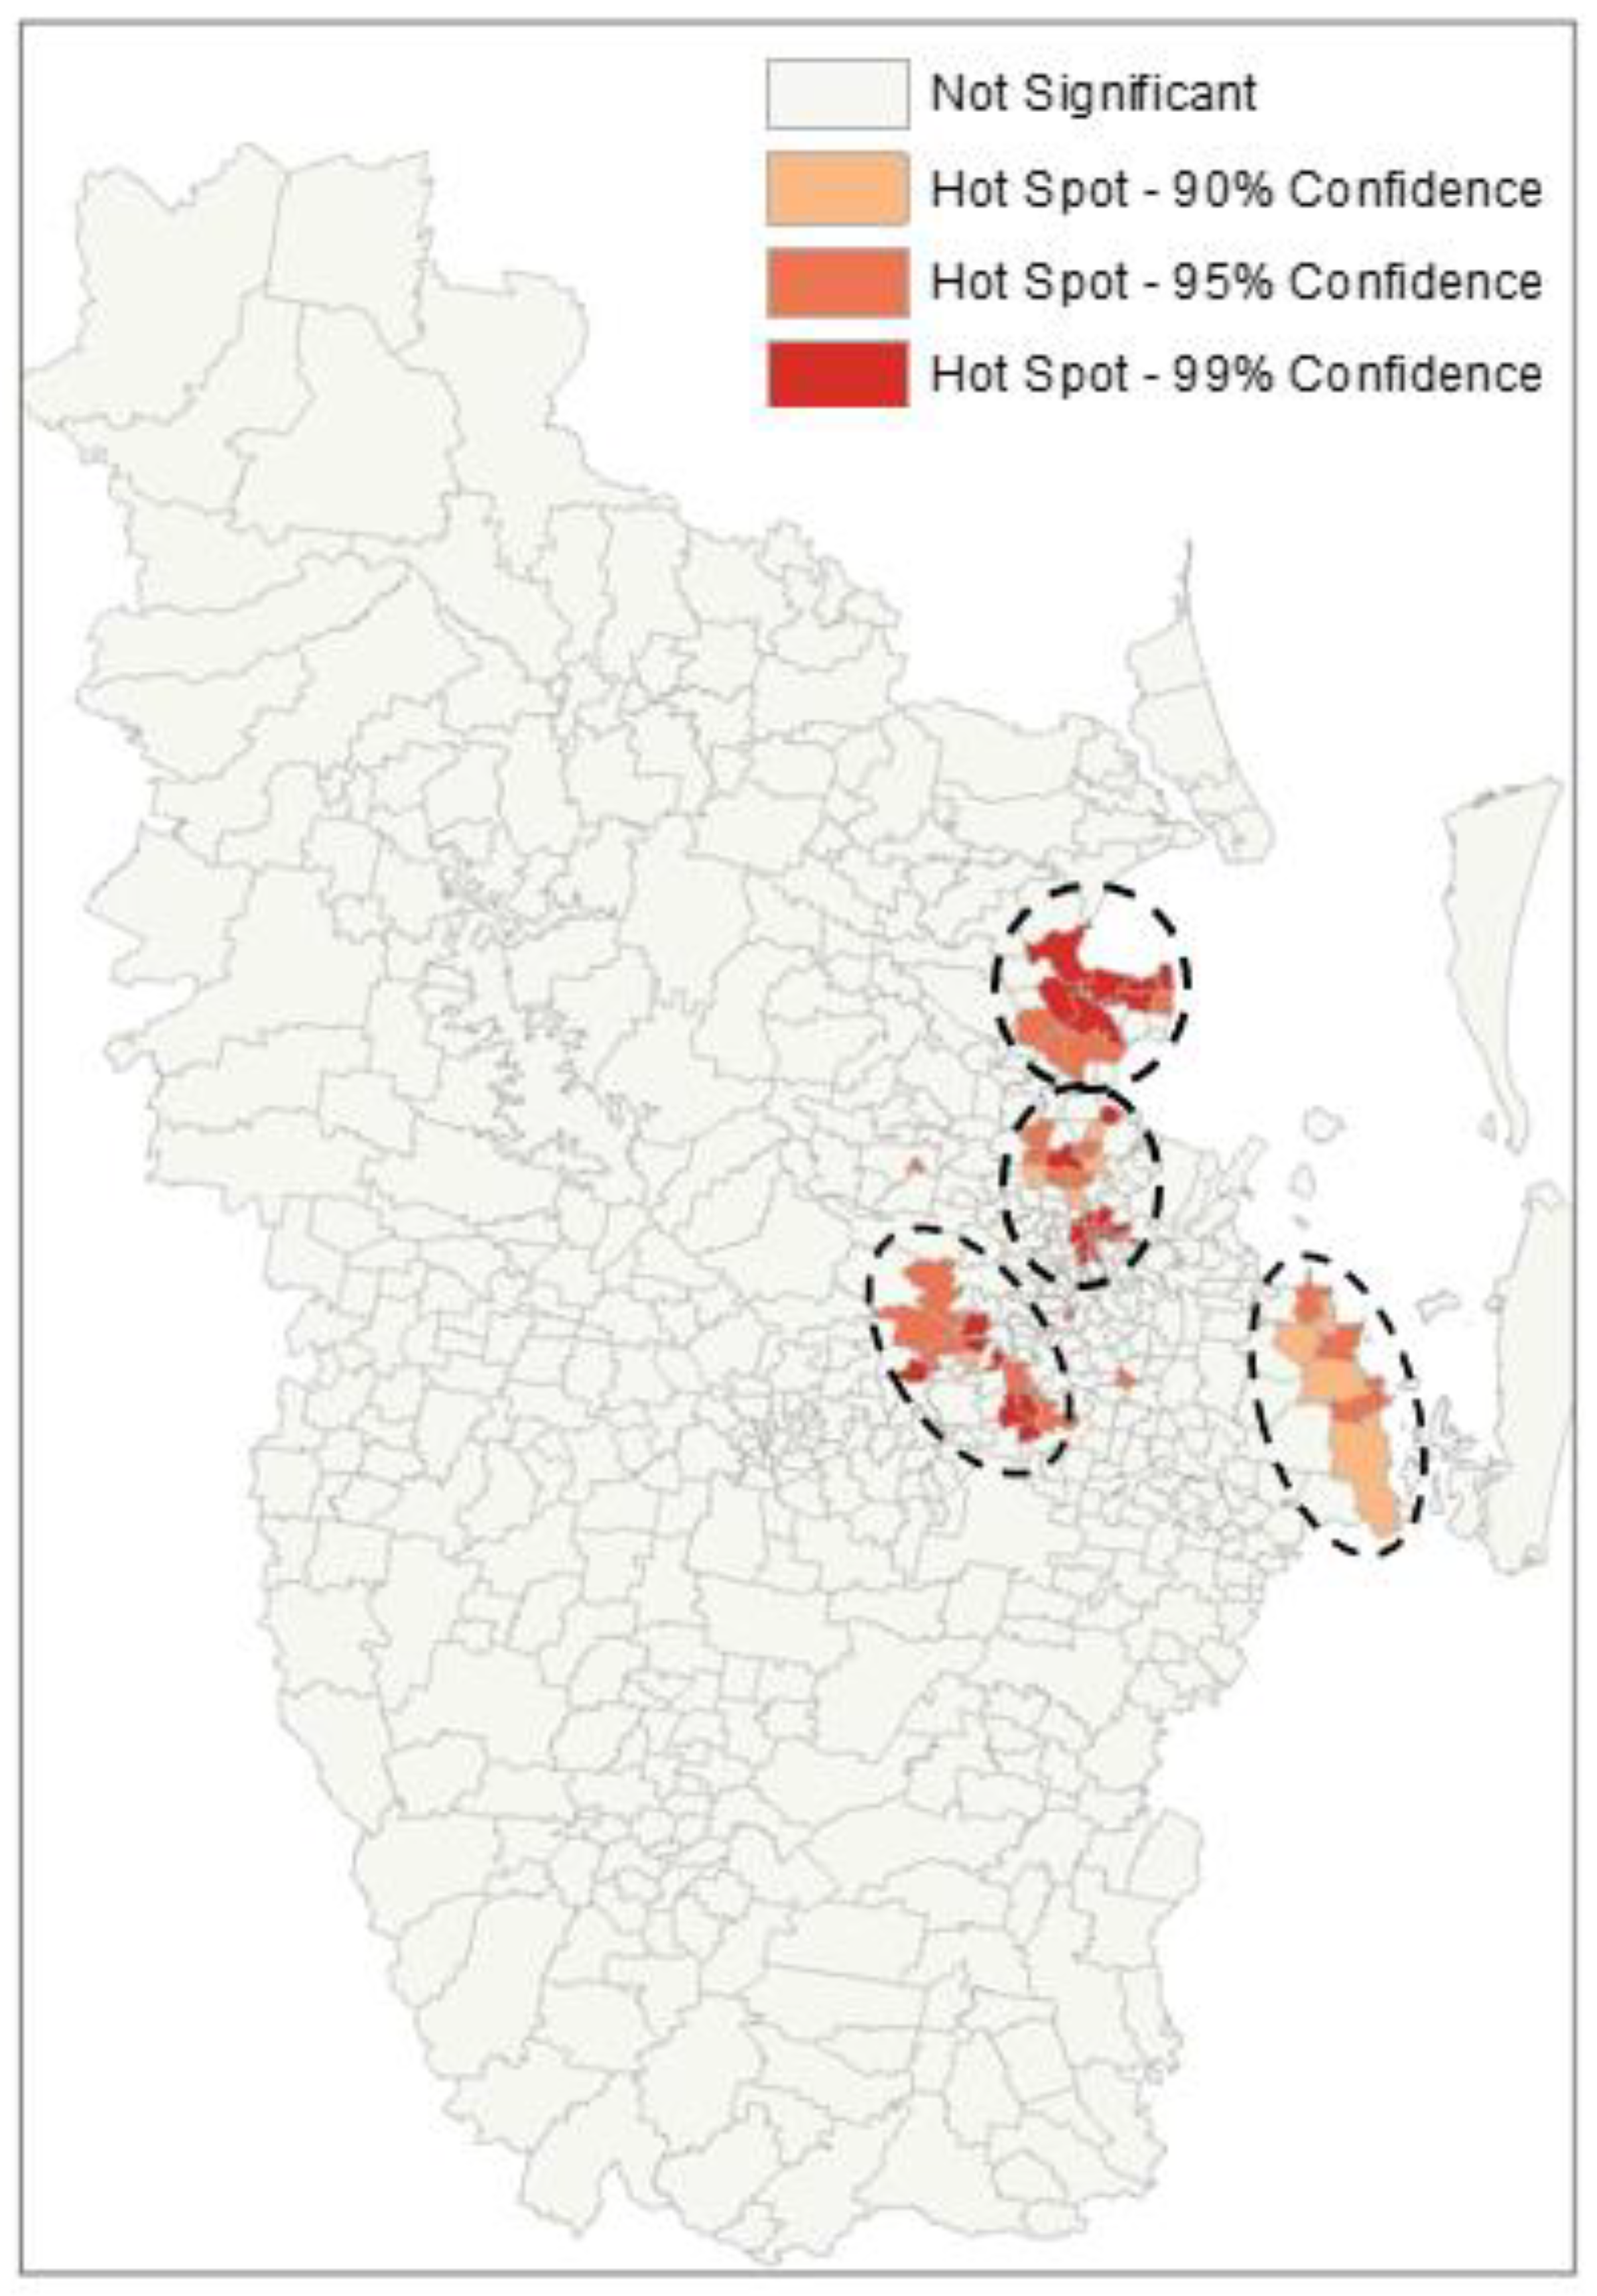
Getis-Ord Gi * (Gi *) test was used to identify significant spatial clusters of hot spots or low cold spot suburbs with retirement villages. The visualized hot spot map in
Figure 4 shows that the statistically significant hot spot suburbs of high retirement village prevalence are mainly distributed in four areas containing 56 suburbs marked on the map. Of the four hotspot areas, two are located along the costal line, one inner-middle urban area, and another middle urban area along the Brisbane River. The total number of household members (65+) living in those hot spot suburbs was 58,093, and the total number of retirement units was 6810 allocated in the hot spot regions, representing around 12% of retirement village prevalence.
4. Discussion
This study examined the geographical distribution of retirement villages in the Greater Brisbane region using geo-visualization and spatial statistical analysis. Many of the retirement villages are located in the most populous urban areas of the Brisbane city council. In addition, the locations of these retirement villages are relatively dispersed across individual suburbs, i.e., the random distribution pattern according to the Moran’s I statistic result. This clearly aligns with the geographical distribution of older people in this region and their preference towards retirement village living.
According to Stimson and McCrea [
28] and Xia et al. [
29,
30] most residents choose to move into those retirement villages within or close to their current suburbs/communities due to the word-of-mouth impact so as to maintain social connection and engagement with existing friends, neighbors, and family members. As a result, the retirement village developers need to cater to such needs of their customers and choose to locate retirement villages for individual suburbs when the older population is large enough to support the business, rather than building large scale retirement villages in one location to serve customers from various suburbs.
On the other hand, the retirement villages in Redland city council and Moreton Bay city council areas are mainly distributed along the costal line suburbs and clustered in some specific areas around Redcliff, Cleveland, and Vitoria Point. This is because the geographical distribution of older household members in these areas are largely driven by in-migration, i.e., many Australians relocate to the areas with seaside scenery, convenient seacoast facilities for physical and social activities [
31]. Unlike residents living in the populous Brisbane urban suburbs, who normally choose retirement villages near their communities, these ‘sea-changers’ [
32] tend to live in large scale retirement villages with sufficient facilities and service available on site. For retirement village developers, as the potential customers are not restricted to the local older citizens, it is reasonable to build retirement villages of a large size to obtain the benefits of economic scale.
For retirement villages in the rural and remote areas, most of them are operated by not-for-profit organizations with a comparatively small number of total units. According to Xia et al. [
33], not-for-profit retirement villages normally have a smaller size with relatively less services and facilities, but with lower price, mainly serving older people with low-to-medium financial capabilities. Because of the small older population in those suburbs, private retirement villages developers normally lack the incentive to operate business there due to the small market and low profit margin [
34].
In addition, the adoption of various tenure types also reflects the distinct business nature between for-profit and not-for-profit retirement villages. For example, the more expensive leased agreement is the most commonly used in for-profit retirement villages to provide more secure contract leasing to customers. On the contrary, although the licensed agreement provides less contract security, it is cheaper for customers, thus most commonly used in not-for-profit retirement villages. As expected, the most expensive (and most secure) freehold agreement is only available in for-profit ones.
The cluster and hotspot analysis confirmed that the coastal areas of the Moreton Bay region and Redland Bay regions have the largest high-high cluster and hotspot areas of retirement villages. Such patterns of retirement village distribution (i.e., suburbs with high retirement village prevalence are co-located or clustered together) clearly reflects the market-driven behavior of the industry.
Based on the cluster and hotspot result, along with the geographical distribution of older household members in Brisbane, it is reasonable to implicate that the concentration of retirement villages around the Redcliff and Redland Bay costal line areas will continue to expand due to the in-immigration and natural ageing influence. Meanwhile, as more young people/couples move into Brisbane urban areas for job opportunities along with some older people’s moving out after their retirement [
35], it is foreseeable that the hotspot of retirement villages in the inner-to-middle urban areas will dwindle steadily. Nonetheless, the hotspot areas along the Brisbane River shall grow gradually mainly due to the natural ageing of the population.
Retirement villages are at the heart of the senior living debate in most developed countries as they have been experiencing increasing numbers of older people [
36,
37,
38,
39,
40]. This study provides both knowledge and practical implications for the development of retirement villages. First, this is the first time in Australia identifying the distribution of retirement villages using the method of geovisualization. Although the approach is commonly used in the field of planning and social computing science nowadays [
41,
42,
43], it is rarely used for the analysis of retirement village distribution. In particular, the concept of retirement village prevalence is designed in this study combining the geographic information of retirement villages and the demographic statistical data to demonstrate the number of retirement village units as per 100 older household members (65+) in individual suburbs [
44].
Second, the spatial analytic approach visualized and documented the geographic locations, and distribution patterns of retirement villages, providing developers with geographical reference data for the choice of new development sites to meet the market demand of potential customers.
Third, relevant policies should be launched by the local governments to incentivize the industry to provide retirement village accommodation to older people living in rural and remote areas.
Fourth, the proposed approach of data visualization to interpret the spatial distribution of retirement villages can be used to incorporate longitudinal data, when available, to reveal the temporal evolvement of retirement villages.
Last but not least, as this study has revealed the hotspot areas of retirement villages, future studies can be conducted in these regions to reveal the underlying reasons that drive current residents’ relocation behavior, which will in turn help local government to launch ageing policies regarding retirement villages to provide a better living environment for the older Australian.
5. Conclusions
The world population, particularly the developed world, is rapidly ageing [
45,
46,
47]. Like many other nations, catering and providing a quality of life for older people is imperative in Australia [
48,
49,
50]. This study to understand the spatial distribution of retirement villages for the first time in Australia, taking the Greater Brisbane Region as the case locality. Although similar numbers of retirement villages are operated by both for-profit and not-for-profit organizations, the size of retirement villages and tenure agreements adopted are significantly different in between. In addition, the distribution of retirement villages shows the clustered and hotspot concentration, especially along the coastline areas around Redcliff, Cleveland, and Victoria Point suburbs, which are experiencing an increasing number of older people relocating to these areas for retirement living. This information is highly useful for local authorities to better cater the needs of concentrated senior citizen populations.
It should be noted that the findings of geographical distribution of retirement villages cannot infer whether these retirement villages are in the right place to meet the needs of older people. Meanwhile, the lack of cross validation with other data sources can be a research limitation, which calls for future studies to address this issue. In addition, future research on the provision of facilities and services within and surrounding retirement villages can be conducted to see whether current retirement villages support older people’s preference to ageing in place. For example, the points of interest data for key land use destinations, such as supermarkets, entertainment amenities, and other public services, within a 5 km radius around the retirement villages can be explored to measure the accessibility of individual retirement villages so as to assess whether the locations of retirement villages meet the daily needs of ageing Australians.


