Article

An Analysis of Self-Build and Custom Housebuilding in the South West of England

by
Annie Hamilton Gingell
1 and
Sina Shahab
2,*
1
Tetlow King Planning, Bristol BS16 5EL, UK
2
School of Geography and Planning, Cardiff University, Cardiff CF10 3WA, UK
*
Author to whom correspondence should be addressed.
Urban Sci. 2021, 5(1), 9; https://doi.org/10.3390/urbansci5010009
Submission received: 11 December 2020 / Revised: 8 January 2021 / Accepted: 12 January 2021 / Published: 16 January 2021

Abstract

:
This paper seeks to evaluate how successful national policy interventions have been at addressing land barriers to self-build and custom housebuilding when applied by Local Planning Authorities (LPAs) across the South West of England. A longitudinal triangulated mixed method approach was undertaken to comprehensively interrogate the research objective. This comprised submitting a Freedom of Information (FOI) request to each LPA within the study area; an assessment of the most recently produced Strategic Housing Market Assessments (SHMAs); deriving alternative demand estimates using national data as a proxy; and alternate estimates of supply calculated using BuildStore and The Land Bank Partnership plot search websites. The findings of the study revealed that LPA Registers can only be viewed as a minimum assessment of demand for self-build and custom housebuilding and the effectiveness of LPAs in classifying suitable development permissions for self-build and custom housebuilding was highly dependent on the mechanisms used to identify permissions.

1. Introduction

Self-build and custom housebuilding dwellings as a percentage of national housing completions in England have historically been very low compared to most developed countries [1,2]. Existing research highlights access to land, finance, conservative planning policies, and inadequate information as the key barriers preventing the development of the sector in the English housing market [3]. The 2011 Housing Strategy for England reported that there were over 100,000 people across the country looking for suitable plots to build their own homes [4] but a lack of access to suitable land in the right locations prevents most from realising this ambition [5,6]. The sector has not become marginalised because of the market, but rather due to inadequacies in the planning system at recognising and addressing these barriers [7].
In light of the national housing crisis engulfing in the UK for the past two decades, the Government has sought mobilise the sector through national policy and legislative instruments in order to help address the significant shortfall in housing stock. The Self-build and Custom Housebuilding Act 2015 placed a duty on Local Planning Authorities (LPAs) to keep a statutory Register of those within their respective administrative areas who wish to acquire a serviced plot of land. The Housing and Planning Act 2016 amended the 2015 Act to include an additional duty whereby LPAs must grant sufficient development permissions to meet demand arising on the Register during each base period within three years. This research seeks to understand how effective the national legislation has been at addressing barriers to land facing prospective self-builders. This study focuses on the South West of England as this region has the highest levels of demand for self and custom build plots in the country [8].
The main aim of this research is to evaluate how successful national policy interventions have been at addressing land barriers to prospective self-build and custom housebuilders when applied by local authorities across the South West of England. To this end, it addresses three research questions: (a) How accurate are local authority self-build Registers when identifying demand for self-build and custom housebuilding? (b) How effective have local authorities been at classifying suitable development permissions for self-build and custom housebuilding? and (c) How efficient have local authorities been at granting enough “suitable” development permissions to meet demand for self-build and custom housebuilding recorded on Registers?
The paper is structured as follows: First, it presents the literature on self-build and custom housebuilding and discusses the barriers to implement these types of housebuilding in the English housing market. Then, the empirical methodology used is presented. Using the secondary data extracted from various sources, the paper goes on to analyse the self-build and custom housebuilding policy in the South West of England. Finally, the paper concludes with recommendations on the ways in which LPAs can tackle the identified barriers and implement the self-build and custom housebuilding policy to achieve planning objectives.

2. Defining Self-Build and Custom Housebuilding

Self-build and custom housebuilding are somewhat umbrella terms used to describe a plethora of ways in which one can ‘self-provide’ their own home in one capacity or another. At its most basic form self-provided housing is where the first occupant of a property participates in its production [1]. Table 1 outlines eight key types of self-provided housing that encompass most self-build and custom housebuilding models within England. Whilst land ownership, project management, construction, and final ownership of the property within each of these forms involve the occupant to varying degrees, the commonality within each is the occupant of the dwelling constructed has had an input into the properties’ design [9].
Within the context of the English planning system, until very recently, there had been no clear definition of self-provided housing enshrined within national policy nor legislation. This was likely due to the historical absence of policy initiatives to stimulate and support this largely invisible sector [10]. The first time the Government sought to explicitly define self-provided housing in an English context was via the Self-build and Custom Housebuilding Act 2015. The 2015 Act (as amended) exclusively referred to self-provided housing as self-build and custom housebuilding, defining the terms as the building or completion of dwellings by “individuals, associations of individuals or persons working with or for individuals or associations of individuals, of houses to be occupied as homes by those individuals” [11]. The Act did not make any distinction between self and custom build provision, although as outlined in Table 1, there are a spectrum of options between the two. In summary, it can be said that a self-provided housing option is where occupant of the dwelling constructed has had an input into the properties design.

3. Barriers to Self-Build and Custom Housebuilding in the English Housing Market

Self-provided housing is capable of being a sizable mechanism of producing new homes. This is illustrated by its dominance in most developed countries as the primary mechanism for providing new owner-occupied dwellings [1]. In Germany, for example, over 60% of homes are commissioned by individual households and built by local companies. This figure is even higher in Austria with self-provision accounting for over 80% of all housing completions [12]. By comparison, the UK severely lags behind other developed countries in the proportion of new housing that is self or custom built [13].
The existing research highlights four key barriers that have habitually repressed the supply of self-build housing in England. These barriers are predominantly access to land, finance, conservative planning policies, and inadequate information [3]. The scarcity of land suitable to accommodate development plots alongside restrictive local planning policies were continuously raised as barriers to delivery of self and custom build dwellings through the existing literature. Parvin et al. (2011) found that fierce competition from speculative housebuilders for suitable land parcels has resulted in medium-sized and large sites suitable for housing being extremely difficult to acquire, with most self-builders priced out of the competition as a consequence.
There are only a few peripheral regions of the UK where speculative building does not normally operate that self-provision is a normal way of obtaining housing for the average household [14]. Due to the prevalence of speculative house builders in the UK and the planning system making little or no provision for this tenure, self-builders are often left searching for marginal sites no one else wants or paying the market price for suitable plots [1], requiring significant up-front capital, and thus pricing out those on middle and lower incomes. The 2011 National Custom and Self Build Association (NaCSBA) Action Plan recognised this issue, emphasising that many prospective self-builders spend years struggling to find a suitable site to develop and then getting the necessary consents to be able to start a build.
Successful policy intervention facilitating true disruption of the current market could make a meaningful contribution towards addressing national housing shortages, thus appeasing in part the national housing crisis engulfing the country for the past two decades. Given that 30 October 2019 was the first trigger date to meet the duties outlined in the 2015 Act (as amended), this research is well placed to understand its effectiveness in addressing the persistent land barriers facing prospective self-builders when applied at a local level.

4. Methodology

The aim of this research is to evaluate how successful national policy interventions have been at addressing land barriers to self-build and custom housebuilding when applied by LPAs across the South West of England. The three research questions to be addressed through this study are as follows:
  • RQ1. How accurate are local authority self-build Registers when identifying demand for self-build and custom housebuilding?
  • RQ2. How effective have local authorities been at classifying suitable development permissions for self-build and custom housebuilding?
  • RQ3. How efficient have local authorities been at granting enough ‘suitable’ development permissions to meet demand for self-build and custom housebuilding recorded on Registers?

4.1. Study Area

To comprehensively interrogate the application of duties placed on LPAs by the 2015 Act (as amended) an extensive study area was required. Research by NaCSBA in 2018 found that the highest levels of demand for self and custom build opportunities in England were generally concentrated in the South West, thus comprising the most suitable locality to conduct the research. The South West of England is home to metropolitan cities, historic towns, vast stretches of coastline, national parks, and many rural communities. However, the region is still plagued by the housing crisis.
The South West is the largest region in England, spanning six counties encompassing 36 LPAs [15], aptly positioning it to provide data from a range of urban and rural LPAs to thoroughly evaluate methodological variations and their corresponding implications over the study period. This was essential to the research, as comparing data provided over a spectrum of LPAs allowed for the identification of relationships between variables through implementation and monitoring mechanisms. It also made it possible to distinguish best practices and establish recommendations that are evidence-based.

4.2. Data Collection

We collected secondary data from a variety of quantitative and qualitative sources to explore the research aim and ultimately answer the interrelated research questions. These sources included Freedom of Information (FOI) requests [16,17] submitted to each LPA within the study area to obtain demand and supply data and the accompanying methods used to acquire the data provided; an assessment of the most recently produced Strategic Housing Market Assessments (SHMAs) covering LPAs in the study area and the methods therein to calculate demand; deriving alternative demand estimates from Office for National Statistics (ONS) mid-year population estimates using national data as a proxy; and an alternative estimate of plots in the study area calculated using BuildStore and The Land Bank Partnership plot search websites.
This study utilised a methodological triangulation approach which Denzin (1973) defines as the use of more than two methods to gather data [18]. A triangulation approach to research is where multiple methods are used to investigate research questions [19]. This approach to data collection allows the weaknesses of one method to be offset by the strengths of the others, thereby reducing potential measurement and sampling bias [20]. Table 2 summarises the methods used in this study, the types of data extracted, and which research questions they relate to.
FOI requests were submitted to collect self and custom build demand and supply data in September 2019. The 2000 Freedom of Information Act gives any person the right to access recorded information held by public sector organisations through the submission of such a request [17]. The format of this data collection method allowed the flexibility to request quantitative demand and supply data, whilst asking several qualitative questions to ascertain how LPAs had implemented the duties placed on them through the 2015 Act (as amended). This study also conducted a desktop review of the most recent SHMA produced for each LPA. SHMAs are generally produced in response to the production of a new local plan. If the most recent SHMA was produced prior to introduction of the 2015 Act (as amended) then it was omitted from the study as it would not have been prepared with the provisions of the 2015 Act (as amended) in mind.
The governments’ self-build portal website (administered by NaCSBA) directs users to three plot searching websites; of the three websites indicated, the PlotSearch service by BuildStore was selected as the second alternate assessment of supply for this research. This site was preferred over the others identified because it was the only building plot search website listed that had been used as a data source in SHMAs. The portal also directs those wishing to find a plot in the South West of England to The Land Bank Partnership website, which specialises in the sale of land with a planning consent or the potential for residential development in the Region. It was therefore rational to use the latter as the third assessment of supply within this study.
The Ipsos Mori statistics commissioned by NaCSBA annually between 2013 and 2016 have consistently demonstrated 1 in 50 people out of the national adult population wanted to purchase a self-build or custom build home in the forthcoming 12-month period when the data was weighted to the known population profile [21,22,23]. It was considered that the trend identified could be applied to national data to gauge an alternative measure of demand for self and custom building within each respective LPA. This allowed the calculation of an evidence-based policy off demand figure for each authority, as the inputs had not been influenced by national nor local policy interventions.

4.3. Data Analysis

To add the qualitative data extracted from the FOI requests to spreadsheets for comparison, content analysis was conducted on each question categorising the responses into common themes. Following this the answers were then refined a second time using keywords to present the findings in a quantitative format. After identifying the relevant SHMAs, a search was performed in each document to find any sections pertaining to self-build or custom housebuilding. Any relevant demand indicators, targets, and needs assessments were then extracted from the relevant section for comparative analysis with the data provided by LPAs.
Demand figures using national data as a proxy for each LPA were derived utilising population statistics from the Office for National Statistics (ONS). The adult population (15+) for each LPA was extracted from the ONS 2018 mid-year population estimates. The figures were then divided by 50 in line with the Ipsos Mori findings to determine projections of current self-build demand in each respective area. The figure for each LPA was then compared with the corresponding demand figures and implementation data provided through the FOI responses to determine trends.
The same sampling strategy was used to identify plots on the BuildStore and The Land Bank Partnership plot-search websites for consistency. A systematic sampling strategy was employed whereby the number of plots being marketed in each county within the study area on every Monday in November 2019 were recorded. Whilst sampling the websites systematically was an effective method of obtaining the data, it did not account for daily plot fluctuations. As such the supply data produced was incomparable with the supply data collected from LPAs. Instead, a review of the types of plots being marketed was undertaken to understand the efficiency of LPA monitoring mechanisms.

5. Findings and Analysis

The Self-build and Custom Housebuilding Act 2015 (as amended) placed a legal duty on LPAs to keep a Register (aka the ‘Right-to-Build’ Register) of those within their respective administrative areas who wish to acquire a serviced plot of land [11]. The Act was the culmination of the Government’s efforts to ascertain an accurate assessment of self and custom build demand across the country. To comply with the regulations of the Act, Registers were to be implemented by 1 April 2016; to be publicised; and several optional eligibility criteria could/can also be applied [24].
Following this, the Housing and Planning Act 2016 amended the 2015 Act to include an additional duty whereby LPAs must grant sufficient ‘development permissions’ to meet demand for self and custom housebuilding arising in their respective areas in each base period within three years of the end of said base period. This Act was the pinnacle of the Governments previous policy initiatives to address persistent land barriers facing those who wished to build their own home and mobilise the sector as a legitimate mechanism for increasing housing delivery as well as choice and mix in the market. The findings of this study are presented under each research question.

5.1. RQ1. How Accurate Are Local Authority Self-Build Registers When Identifying Demand for Self-Build and Custom Housebuilding?

As highlighted in the literature, the Government has historically had difficulties in identifying and implementing appropriate policy instruments to assess demand for self and custom build housing at a local level. Whilst the Right-to-Build Registers will generate an empirical set of demand figures for each LPA, it is likely the accuracy of the figures will be affected by flexibilities in the statutory duties and regulations.
The objective of this research question is to compare how duties placed on LPAs through the 2015 Self-Build and Custom Housebuilding Act (as amended) have been applied to assess demand for self and custom build plots across the study area. The Planning Practice Guidance (PPG) states the level of demand for each LPA “is established by reference to the number of entries added to an authority’s Register during a base period” [25]. The data informing this question has been extrapolated from the FOI responses received across the study area; SHMAs were published in the study area post 2015 and estimated demand using national data as a proxy.
Table 3 demonstrates the total demand for self-build and custom housebuilding plots recorded on Registers across the study area. The PPG clearly defines base period one as commencing on the day the Register starts and ending on 30 October 2016 [26]. Each subsequent base period runs from 31 October to 30 October each year. The figures are broken down by base period in line with national guidance.
Whilst the duties within the Act should have been implemented by 1 April 2016, the Act achieved royal ascension in March 2015 [27] meaning authorities had over a year to consider how and when to implement their Register. Table 4 demonstrates that six (21%) LPAs started their Register more than a month in advance of the deadline and a further five LPAs (18%) started two days before on 30 March 2016. Over 50% of LPAs in the study area started their Register on 1 April 2016.
The inconsistent dates when implementing Registers across the study area present several problems when comparing the data. As previously noted, the first base period for each LPA commences on the day the Register starts and ends on 30 October 2016. This means the earlier the Register is implemented, the longer first base period one will be. Table 5 below demonstrates the length of base period one for each implementation date in the study area.
These variations raise a number of issues when attempting to use base period one data to quantify demand and assess future needs. Firstly, the data is not directly comparable as the figures were not recorded over the same periods. For the same reason base period two data cannot be compared to base period one as any perceived increase or decrease in demand recorded may only be due to these discrepancies. This is especially true for LPAs that implemented their Register on 1 April 2016 as base period one only spans 6 months, 30 days meaning base period two covers almost double the amount of time. While the 2015 Act did not require LPAs to publish their Registers, the regulations were clear that its existence must be publicized [28,29]. When asked what types of publicity had taken place, all the LPAs in the study area indicated they had created a dedicated web page. It is must be taken into consideration that the creation of such a webpage is a minimum requirement as set out in the PPG and is arguably not a form of publicity in this context.
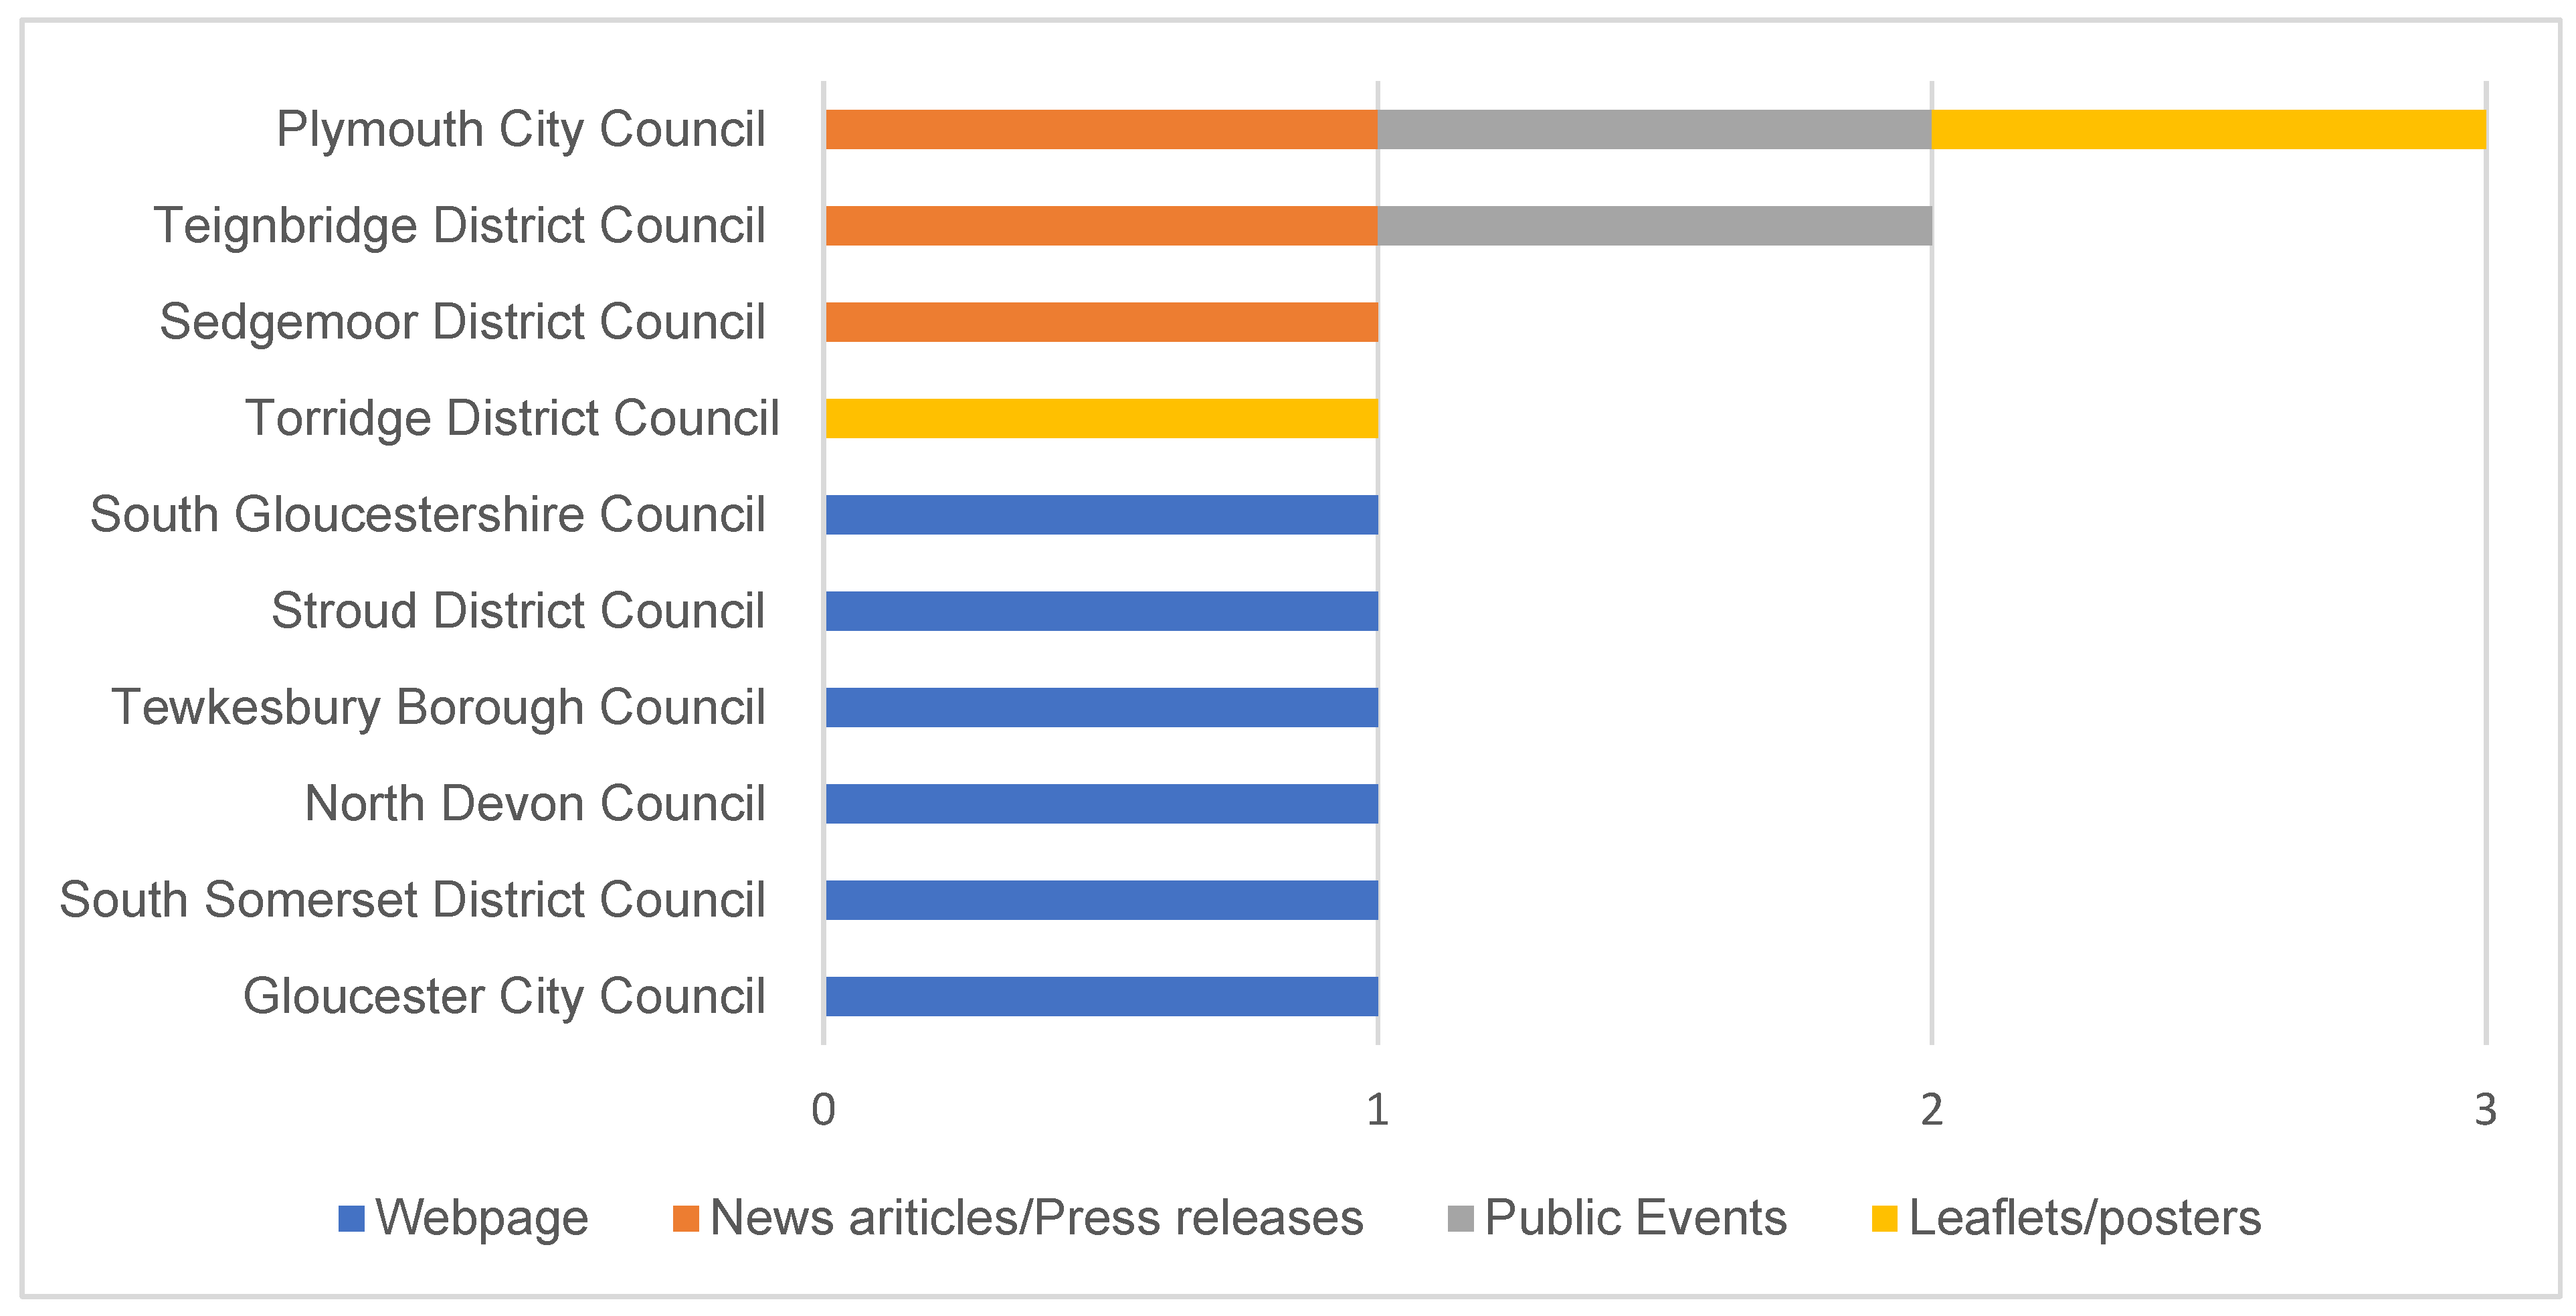
Figure 1 illustrates that just 10 (36%) LPAs in the study area indicated they had employed publication methods outside of creating a webpage by September 2019. A 2016 Ipsos Mori Survey found that just 13% of people were aware of Right-to-Build Registers, a time when most LPAs should have already implemented their websites and publicity exercises should have been at their peak. Clearly the establishment of a website in isolation does not constitute publicity as to look for it one must be aware of its existence and purpose. This means that almost 65% of LPAs in the study area will have likely failed to meet this basic statutory duty.
Given the above issues identified surrounding the accuracy of Registers, it is important to draw on other sources of demand to test the data. The PPG advises that LPAs should support demand data from Registers with additional data from secondary sources. As highlighted by Table 6, across the study area just six SHMAs were identified that met the research criteria. All the SHMAs identified, at a minimum, acknowledged self-build and custom housebuilding as a typology of need.
The PPG advises that in order to obtain a robust assessment of demand for self-build and custom housebuilding in SHMAs, data held on Registers should be assessed and reviewed [25,26]. The PPG continues that this data should be supplemented using existing secondary data sources including building plot search websites, ‘Need-a-plot’ information from the Self-build portal administered by NaCSBA, and the number of plot enquiries in the area from local estate agents. NaCSBA ‘Need a Plot’ data was the most prevalent indicator used, cited in 67% of the SHMAs identified (Table 7).
SHMA No. 3 was the only assessment to profess a demand figure. Arguably it is not a robust assessment of demand as it was not calculated in line with guidance set out in the PPG and does not take account of future trends. Instead the figure merely provided a current speculative demand for a snapshot in time rather than an Objectively Assessed Need (OAN) figure for self and custom build demand in the Housing Market Area (HMA) as required by national guidance. Comparisons of OAN figures for self and custom build demand and recorded Register demand figures were not possible for the rest of the study area as no demand figures had been produced.
Neither SHMA No.1 nor SHMA No.2 used Register data in line with PPG recommendations to inform their assessments yet both concluded there was limited evidence of demand. The HMA Register figures illustrated in Table 8 clearly demonstrate these statements to be inaccurate. What is even more surprising is that both these SHMAs were the most recently produced in the study area, benefiting from three full base periods worth of data at their disposal. This is remarkable given that calculating demand for this tenure in SHMAs has been enshrined in national policy and guidance since 2012.
An alternate estimate of demand for each LPA was calculated applying findings from Ipsos Mori polls commissioned by the NaCSBA [21,22,23] to ONS 2018-mid-year population estimates [35]. Table 9 demonstrates the results of this exercise compared with total recorded demand for base periods one to three. Unfortunately, the levels of demand recorded through this exercise cannot be verified in the absence of a full demand assessment i.e., SHMA. It should be noted the estimated data looks at a population profile of 15+, yet you must be 18+ to join a Register. This may account for the estimated figures being marginally higher than the Register figures in some cases.
The estimated figures indicate that the demand when using national data as a proxy for self and custom build development plots is significantly higher than indicated by most Registers. Estimated demand for the Isles of Scilly was the most akin to the level of demand recorded on the Register accounting for 79%. The council noted in their FOI response that the existence of the Register has been publicised via social media platforms. Given the Islands small population, estimated at just 2200 people in 2018 [35], and the significant reach attributed to social media, it is likely that this Register figure is fairly accurate.
Of the seven LPAs in Table 9 whose Register figures were 3% or less of estimated demand, just one had undertaken any publicity exercise outside of creating a website. When the estimated figures and Register data are viewed in light of the level of publicity within an LPA, it is apparent that knowledge of the Registers existence is paramount to its effectiveness. The research also highlights that the level and the types of publicity used are crucial. One could argue that to truly comply with statuary publication requirements LPAs must employ a method of publicity that would reach those who would not find out about the Register by other means.
Clearly most LPAs in the study have fallen significantly short of their statutory duties in this respect, in light of which one should consider the level of demand recorded on Registers to be a minimum as latent demand is likely to be much higher. Whilst it is probable the accuracy of Registers will improve with time; it is reasonable to conclude that at present they do not reflect true levels of demand for self and custom housing in the study area.

5.2. RQ2. How Effective Have Local Planning Authorities Been at Classifying Suitable Development Permissions for Self-Build and Custom Housebuilding?

The literature demonstrated that Government had acknowledged the scale of untapped delivery from the self and custom build sector and identified a lack of access to suitable land as a key barrier to its development from as early as 2011. Whilst the 2016 Act will surely trigger an increase in the supply of plots available to self and custom builders, the regulations are somewhat vague when setting out what the Act considers a “suitable” development permission to comprise.
This research question seeks to evaluate the effectiveness of provisions in the 2016 Housing and Planning Act as a suitable structure for LPAs in the South West to identify and monitor the delivery of plots for self and custom housebuilding within the study area. The Act considers a development permission to be “suitable” if it could include self or custom building. The data informing this question has been extrapolated from the FOI responses received across the study area; and plots search websites BuildStore and the LandBank Partnership.
Table 10 demonstrates the total supply of development permissions granted and considered to meet the duty recorded within the study area. Whilst the FOI sought data for base period one, Plymouth City Council was the only LPA in the study area to acknowledge that these figures do not count towards the duty in line with the regulations and had therefore not been recorded. It is unclear through the current research whether the other 21 LPAs that provided base period one data have counted such consents towards the duty.
The data shows that Cornwall Council reported a significantly higher rate of delivery than any other LPA in the study area, accounting for almost 63% of the total supply. It is rather concerning that the Councils of the Isles of Scilly and Dartmoor National Park reported they had not delivered a single suitable plot in the two-year period, given their respective Register figures of 18 and 118 registrants for base period one. Additionally, six LPAs in the study area reported they could not provide any figures. Given the statutory requirement to grant enough permissions (which logically necessitates monitoring permissions granted) had been in place for almost three years at the time of the request this is highly troublesome.
There is substantial void in national legislation, policy and guidance as to what the Government considers a “suitable” plot to meet the duty to be. It is therefore reasonable to deduce that the legal definition of self and custom building contained within the Act should be the starting point for LPAs when determining if permission could be considered suitable for to meet the duty. The 2017 PPG amendments build on the legal definition by stating that “In considering whether a home is a self-build or custom build home, relevant authorities must be satisfied that the initial owner of the home will have primary input into its final design and layout.” [25,26].
Aside from this LPAs have largely been left to their own devices when determining permissions that could be considered “suitable”. The FOI sought quantitative evidence from LPAs on how the plots recorded complied with the legal definition. 
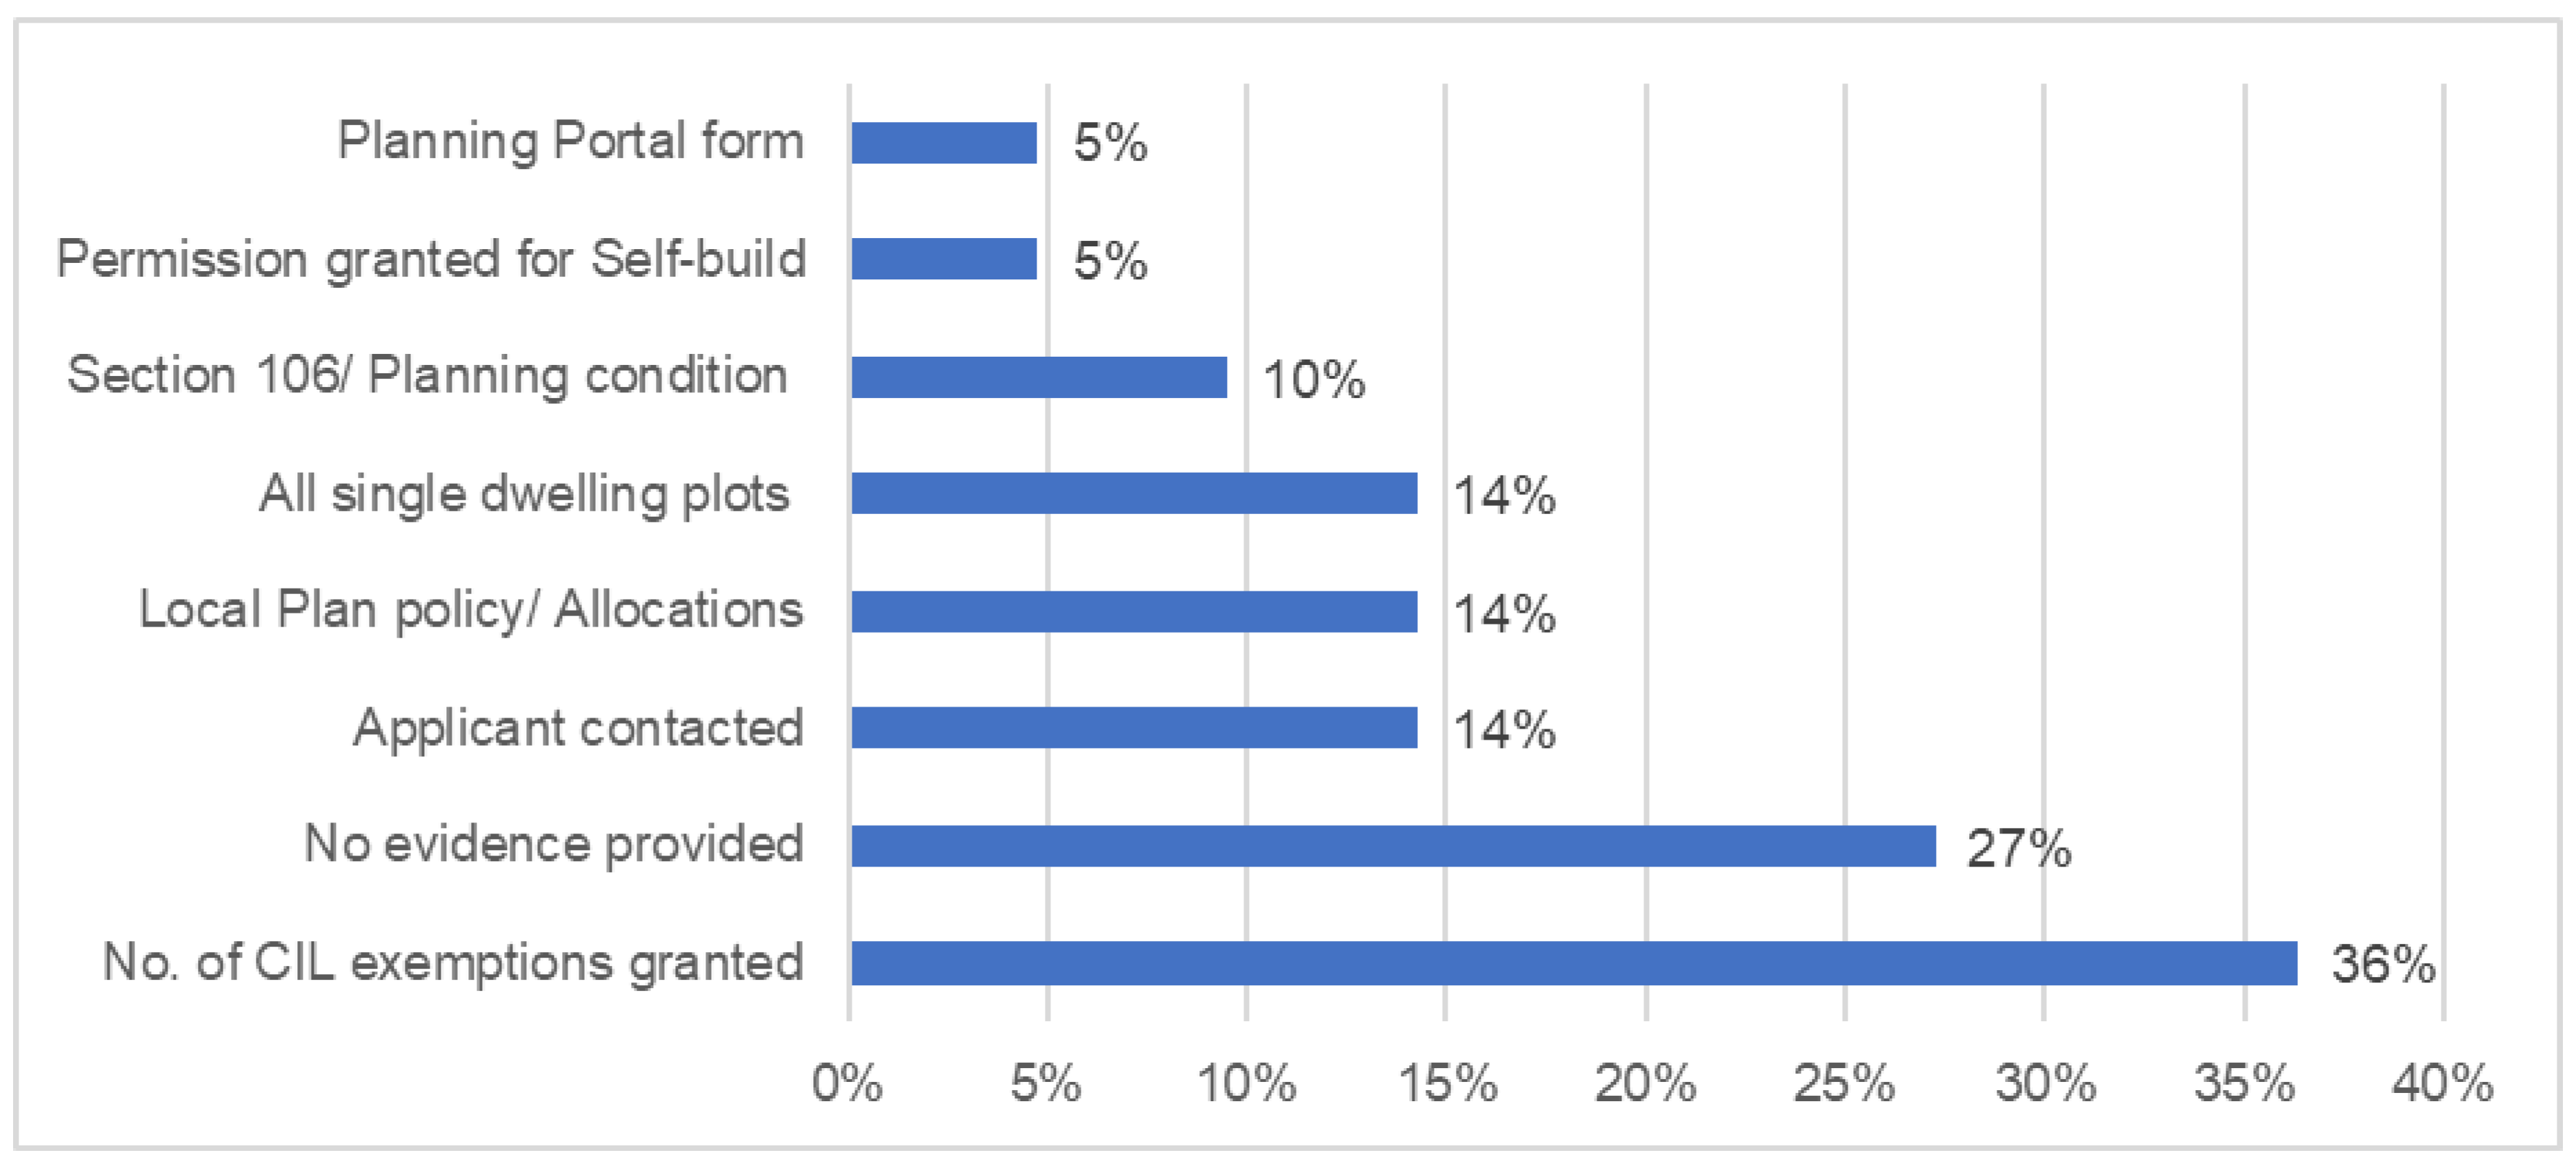
Figure 1 indicates that 6 (27%) LPAs in the study area who provided permissions data offered no specific evidence as to how the permissions recorded had been identified in compliance with the definition. It is therefore wholly unclear how some of the figures have been calculated and whether they do in fact meet the statutory definition thus contributing towards the duty.
Figure 2 identifies seven methods used for classifying “suitable” plots granted for self and/or custom building in the study area. The most prevalent method used was monitoring the number Community Infrastructure Levy exemptions (CIL) granted (36%). The research found this method to be one of the most efficient mechanisms as once an exemption is granted the permission is legally tied to a self-build use for a minimum of three years. The FOI responses highlighted that not all the LPAs in the study area had a Community Infrastructure Levy (CIL) in place and were therefore unable to utilise this method. In addition, many LPAs have a CIL that only covers specific areas within the authority [36], thus exemptions cannot wholly be relied upon.
Checking a Section 106 agreement (S.106) and/or planning condition attached to a permission for self-build occupation was a method used by 2 (9%) LPAs to identify supply in the study area. Like CIL exemptions, these documents can legally bind dwelling(s) to a self-build use and/or occupant. However, unlike CIL exemptions, planning conditions and S.106 agreements can be altered in certain circumstances therefore tainting their reliability as a source of supply data. The consequence of the removal of such a condition or agreement is that it allows the permission to be sold on thus departing from the definition which requires design input from the occupant. Although, it is reasonable to argue that the development was technically “suitable” at the point of permission and should count towards the duty regardless of future amendments. Contacting the applicant in some shape or form to capture the number of “suitable” plots delivered in a base period was employed by 3 (14%) LPAs in the study area. This could be weighed as a relatively robust approach given that applicants should know whether they intend to occupy the proposed dwelling; and will therefore logically be involved in its design and layout. It could however prove to be a time-consuming exercise for larger LPAs.
Another prevalent indicator used by 3 (14%) LPAs in the study area was counting the number of single dwelling permissions granted within a base period. It should be highlighted that the 2015 Act explicitly states the legal definition self and custom build does not include ‘the building of a house on a plot acquired from a person who builds the house wholly or mainly to the plans of specifications decided or offered by that person’. The stipulation that a self-build dwelling must have input from the applicant on its design throws in to question the ability to count all single dwelling plots towards the duty in compliance with the definition contained in the 2015 Act.
Notably Cornwall Council who reported 65% of supply in the study area only used single dwelling permissions to calculate the number of suitable plots delivered. In a September 2019 House of Commons debate, Richard Bacon MP called for further clarity on what kinds of permissions meet the definition stating “Some local authorities are gaming the system, and in some cases local authorities are not clear what counts towards their legal obligations to provide permissioned plots of land”. Clearly blindly counting all single dwelling permissions is inappropriate especially because these permissions can be more robustly captured through monitoring CIL exemptions granted, S.106 agreements, planning conditions or by contacting applicants.
Identifying plots granted through allocated sites and Local Plan polices was also a popular method being employed by 3 (14%) LPAs in the study area. Evidently this indicator can only be used where a policy to deliver self or custom build plots is in place or provision is explicitly included as part of an allocation. As the Act matures and evidence of demand on Registers becomes more reliable, it is probable more and more Local Plans will introduce these sorts of policies as a mechanism to boost supply towards the duty. Although this assumption is predicated on their being some form of policy implication/sanction for not councils not meeting the duty, which at present there is not.
Self-build plots delivered through dedicated policies will likely have some sort of legal agreement requiring them to be built out as such thus constituting a reliable data source. These plots may also be captured through CIL exemptions granted so systems to prevent double counting should be implemented. Overall plots delivered via dedicated policies should have occupancy conditions attached to them and as such can be better captured by other methods; however, plots through percentage-based policies or allocations should be counted towards the duty as they could accommodate self-build at the point of permission.
Tewksbury Council stated in its FOI response that it monitors permissions that have been specifically granted for self-build schemes (5%). It is wholly unclear from the FOI response how the Council does this and whether the permissions recorded comply with the definition. By contrast Mid Devon Council indicated they monitor permissions for self-build granted via counting the number of applicants whom marked their application as such on the Planning Portal application form (5%). It is unclear when the ability to mark an application as self or custom build on the Planning Portal application form was introduced; with most LPAs in the study area stating they could not provide this information either because they did not monitor this data, or they were not aware of this element of the form.
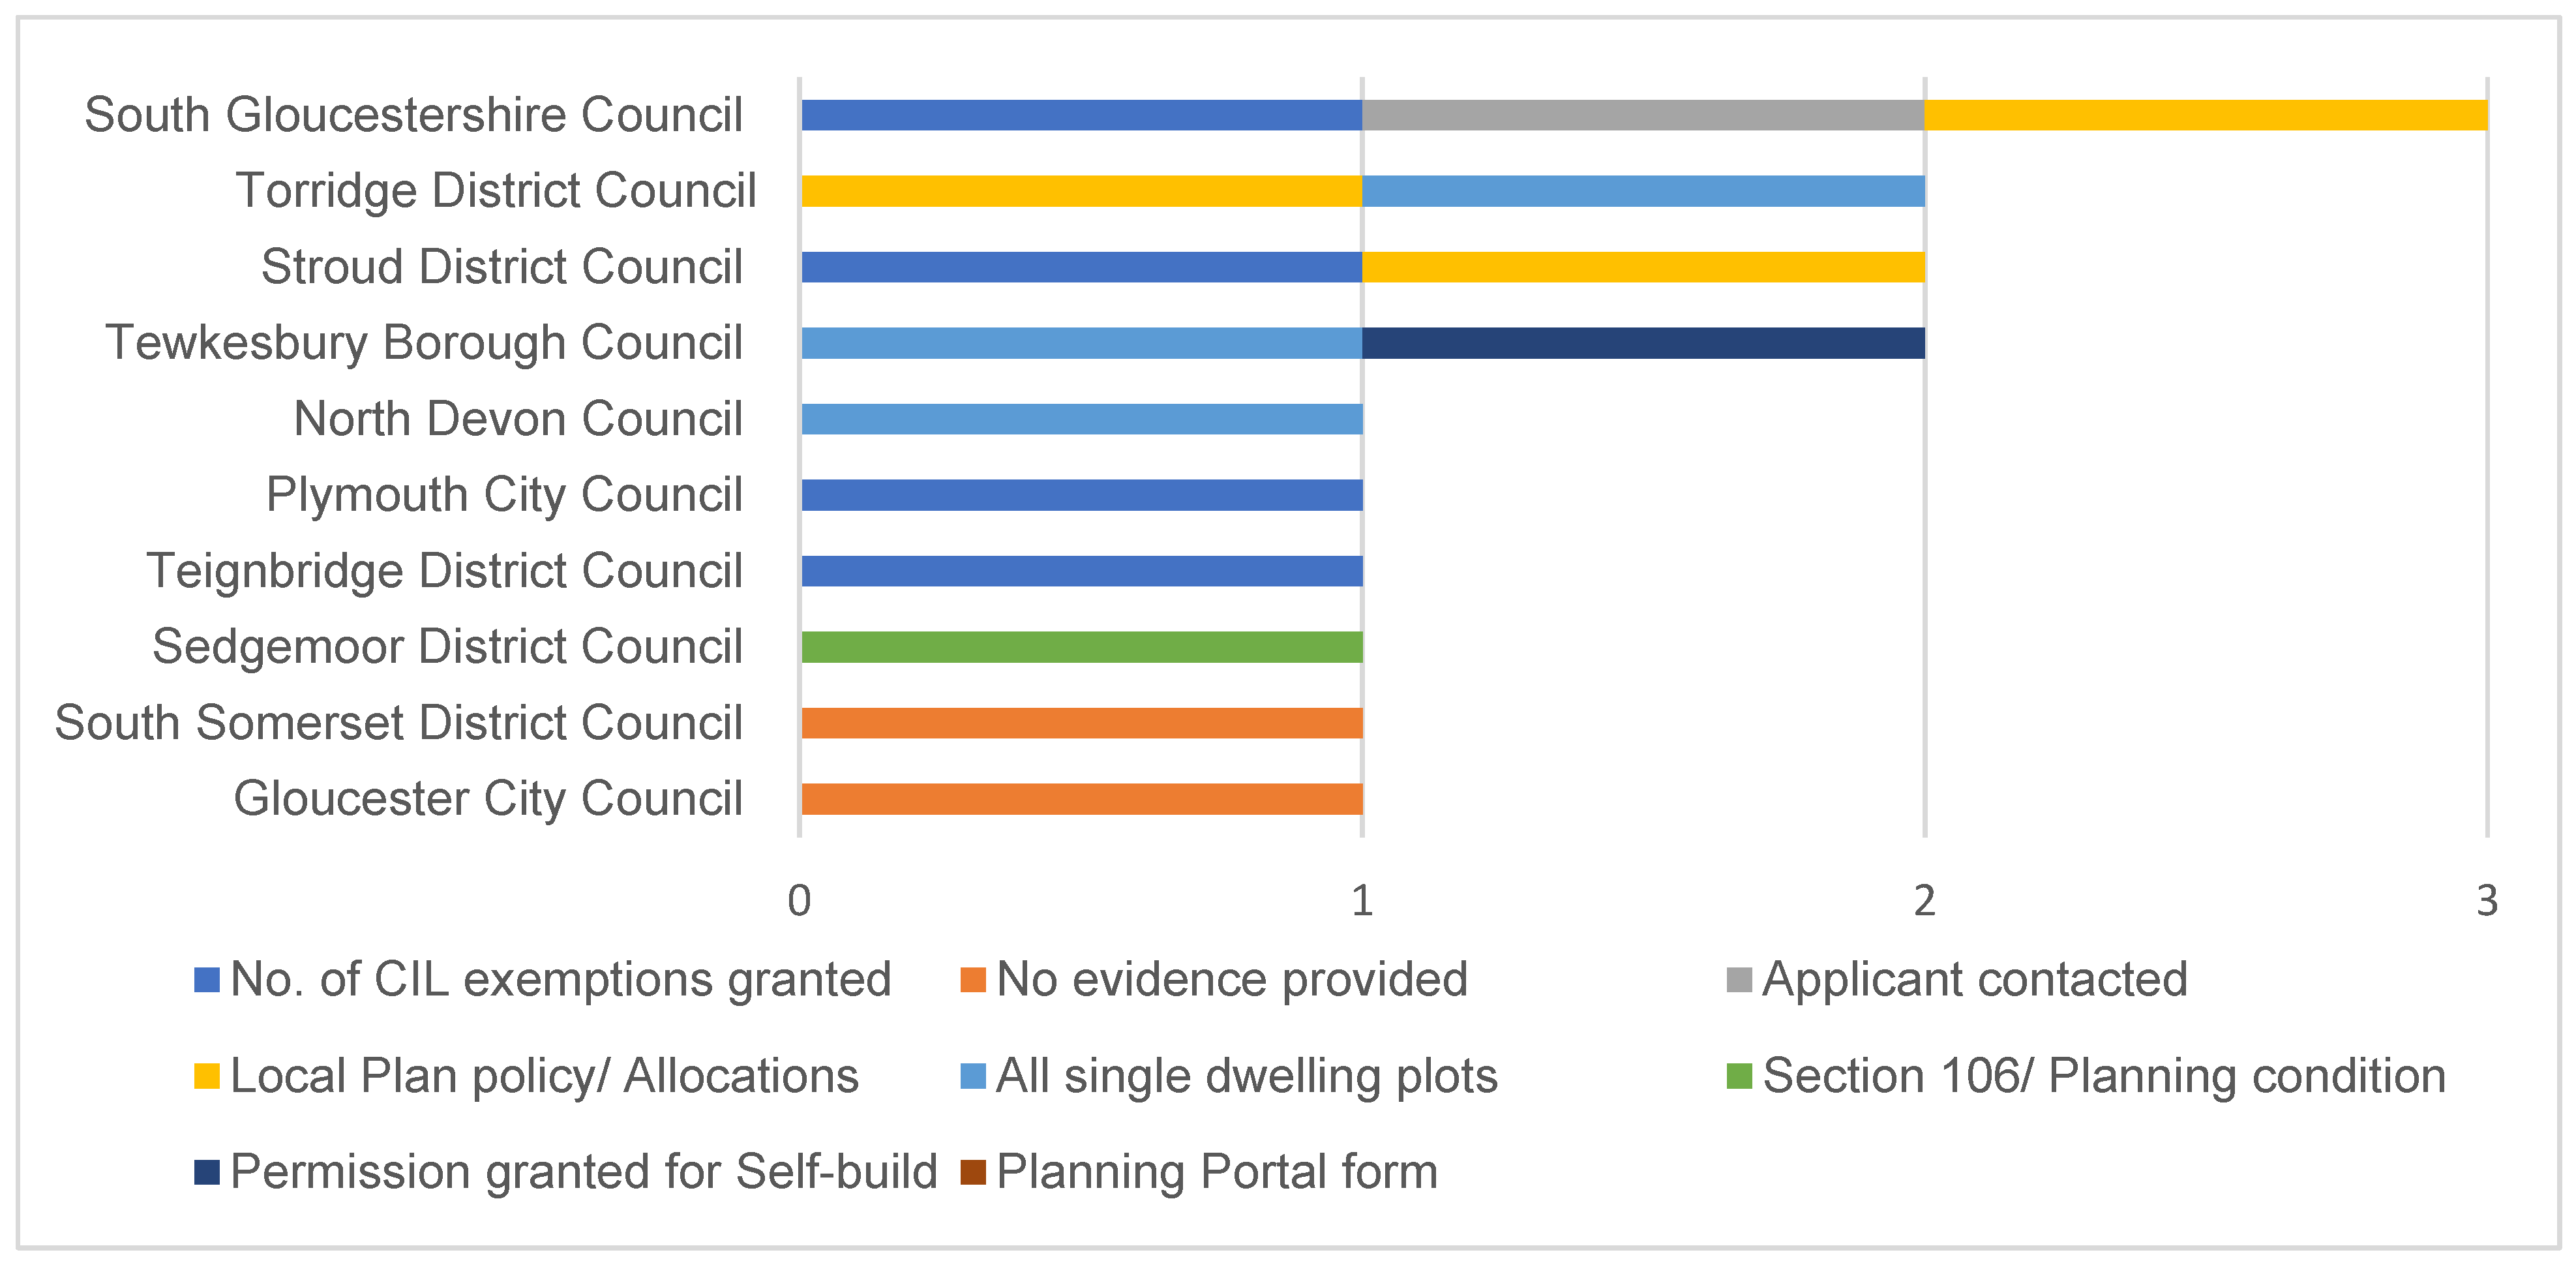
It should be noted that of the mechanisms described surprisingly just three LPAs in the study area used a combination of two methods to establish supply figures within their respective administrative areas. South Gloucestershire Council, who reported the third highest level of delivery, was the only LPA to use a combination of three mechanisms identified. The LPAs that used more than one method and the methods used are set out in Table 11.
It is clear from the above evidence that there are a number of methods for identifying suitable development permissions each with their own strengths and weaknesses. In order to further test the accuracy of the data provided plot data was sought from two different plot searching websites. Table 12 indicates that there were around 500 building opportunities available to prospective self-builders throughout November 2019 in the study area.
In order to determine what types of plots were being advertised, a review was undertaken of the 11 plots available to purchase in Wiltshire on 25 November 2019. Of the 11 plots identified all had detailed planning permissions for dwellings already in place. While the dwellings themselves may not have yet been built, when the permission is implemented, the dwellings will need to be built out in compliance with the approved plans. Clearly these building opportunities are a departure from the legal definition which explicitly discounts the building of a house to the specifications decided by another person.
Table 13 demonstrates there were a significantly lower level of plots advertised through the LandBank Partnership website [38] than on BuildStore [37]. This is likely because the website is subject to lower levels of publicity; however, this could also mean lower competition for plots. To understand variations in the types of plots advertised, a review was undertaken of all the plots for sale on the site on 25 November 2019. Of the seven plots identified, four had detailed planning consents. The remaining three plots identified on the website all had outline consents in place.
There is far more flexibility towards counting single dwelling outline planning permissions towards the duty than there is when it comes to detailed or ‘full’ permissions. This is because in most cases the design of the property will be reserved at outline stage, thus the purchaser of the plot will likely have control over what kind of layout and design the dwelling will take when submitting a reserved matters application. It is considered that the inclusion of single dwelling outline permissions encompasses the ‘could be suitable’ element of the duty, as any outline permission could be sold on to a self-builder to develop.
The evidence indicates that a significant proportion of the building opportunities advertised on BuildStore and LandBank Partnership throughout November 2019 were likely for plots that already had detailed planning permission. This tells us two things. Firstly, most plots advertised will not suitable development opportunities for self and custom builders, with the absence in fluctuations of plot numbers suggesting a constrained supply of suitable plots. Secondly, the proportion of single dwelling plots with detailed planning permission advertised for sale is further evidence that all single dwelling permissions granted during a base period should not be counted.
The above findings and analysis illustrate that the effectiveness of LPAs in classifying suitable development permissions for self and custom housebuilding is highly dependent on the mechanisms used to identify permissions. The research clearly demonstrates that LPAs who use legal mechanisms to identify permissions are likely to have significantly more accurate supply figures than those who simply count all single dwellings.

5.3. RQ3. How Efficient Have Local Authorities Been at Granting Enough “Suitable” Development Permissions to Meet Demand for Self-Build and Custom Housebuilding Recorded on Registers?

The Self-build and Custom Housebuilding Time for Compliance and Fees Regulations (2016) are clear: the time allowed to meet the duty is a period of three years beginning immediately after the end of that base period. This means that any permissions granted in the same base period as the Register base date cannot be counted toward meeting the duty. Therefore, should an LPA provide more plots in base period two than demand recorded in base period one the subsequent overprovision cannot be counted towards demand recorded on the Register in base period two. Given that base period one ended on 30 October 2016, the time allowed to grant permission to meet the demand recorded in this period ended on 30 October 2019. As previously highlighted, there are several variations affecting the way supply and demand data is recorded within the study area which may impact an LPAs compliance with duties and the subsequent figures reported.
The aim of this research question is to assess the success of the Self and Custom Housebuilding Act 2015 (as amended) as an appropriate framework for LPAs in the study area to grant enough suitable permissions to meet demand recorded on Registers in base period one. The data informing this question has been extrapolated from the FOI responses received across the study area. Comparisons are also made with the findings of RQ1 and RQ2.
Table 14 demonstrates that seven of the LPAs in the study area recorded a base period two supply figure that exceeds base period 1 demand. This means that across the study area there are a total of 1169 plots that cannot be counted towards the duty and remain in compliance with the regulations. Had this overprovision occurred in base periods three or four they would still be able to be counted towards meeting base period two demand. This process is then repeated through subsequent base periods meaning LPAs will need to check annually for any overprovision to be discounted.
Table 15 that illustrates that all of the LPAs who provided a complete set of supply data for base periods two to four, by their own estimations, had met the demand recorded on their Registers during base period one thus fulfilling their statutory duties. Interestingly, all but one LPA could demonstrate they had accrued a surplus of plots over the period. It is important to reiterate that any surplus accrued in base period two cannot be counted towards demand recorded in base period two in line with the Regulations, a fact which some LPAs seem to have overlooked.
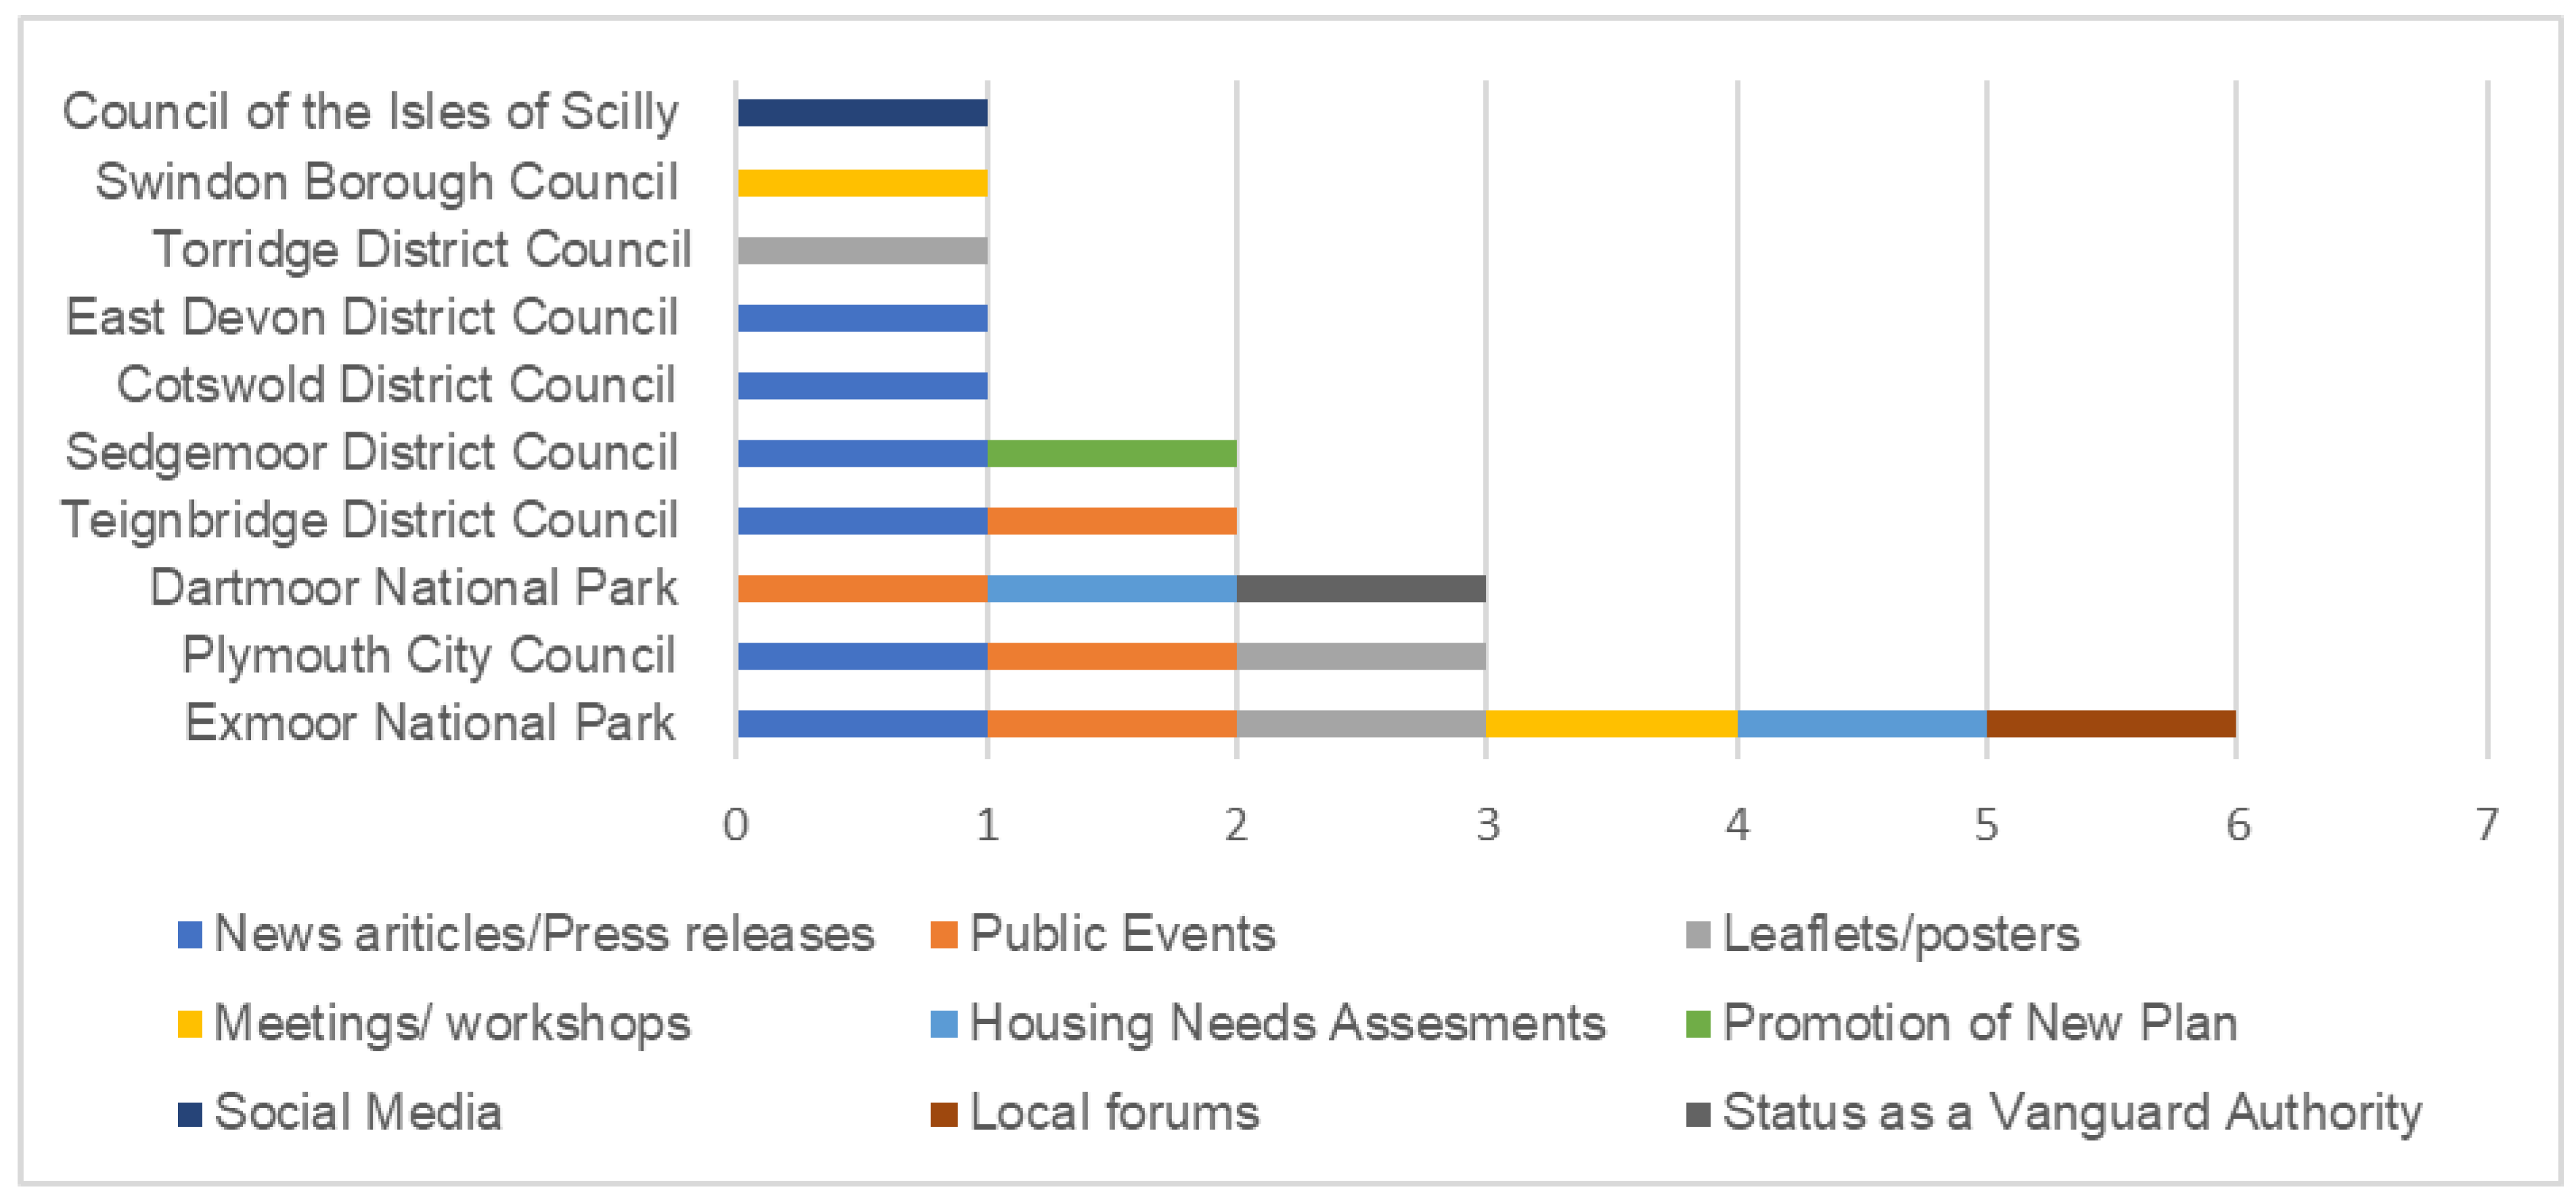
Figure 3 demonstrates the mechanisms used to identify the plots reported in Table 15. It is pertinent to note that between the first and second FOI requests, Tewkesbury Borough Council changed its monitoring procedure to include all single dwellings permitted towards meeting the duty as well as permissions granted specifically for self and custom build. The monitoring report provided with the second FOI response establishes that had the Council excluded single dwelling permissions from the duty, they would not have been able to demonstrate enough plots to meet demand. This is a clear indication that LPAs are inappropriately counting all single dwelling plots boost supply and create the illusion they are meeting their statutory duties.
Three of the four councils identified in Table 11 who used a combination of methods to identify suitable plots were able to demonstrate that supply exceeded demand. Evidently, in order to robustly capture all suitable dwellings, permitted a best practice approach, is to use a combination of appropriate monitoring indicators. That being said, one of the two indicators used by Torridge was the inclusion of all single dwellings permitted, which this research has repeatedly established to be inappropriate. This is also the case for North Devon Council who exclusively use this method to identify suitable plots, reporting the second highest surplus of plots over the period (243). Similarly, Somerset District Council and Gloucester City Council provided no specific evidence on how the permissions reported were derived. Given the significant oversupply in South Somerset District of some 329 dwellings (the highest reported) it is reasonable to assume that this calculation includes single dwelling permissions and should therefore be treated with caution.
Although looking at mechanisms to identify suitable plots is important, the demand figures recorded should also be interrogated. Figure 4 demonstrates that 60% of the LPAs who reported figures for the full period had undertaken no publicity exercises outside of creating a dedicated webpage. Therefore, irrespective of meeting recorded demand the LPAs have already failed to comply with the regulations and consequently the figures reported are not likely to represent true demand for self-build. These LPAs have evidently failed to comply with their statutory duties. In addition, 50% of LPAs had implemented eligibility requirements and 10% also charged a fee for entry. Although these additional requirements are permitted under the regulations, they are also likely to suppress recorded demand.
Using the evidence gathered through the research, Table 16 establishes whether the LPAs who reportedly met the demand recorded in base period one did so in line with statutory duties. Overall, 70% of LPAs had failed to comply with the Act in some shape or form yet were happy to report they had met the duty. Just 30% of LPAs could claim they had complied with all the regulations set out in the 2015 Act (as amended). This implies that the when the Act is implemented in full compliance with the accompanying regulations it can be considered an appropriate framework for LPAs to grant enough permission to meet demand. However, this assertion is predicated on LPAs understanding how the duties in the Act should be implemented and subsequently carried out.
The above findings and analysis highlight that the majority of LPAs in the study area were highly inefficient in carrying out the statutory duties ascribed to them through the 2015 Act (as amended). Just three LPAs in the study area could accurately state they had granted enough “suitable” development permissions to meet demand recorded in base period one. It is therefore reasonable to conclude that currently the 2015 Act (as amended) is not an appropriate framework for LPAs to grant enough suitable permissions to meet demand.

6. Conclusions and Recommendations

This section concludes the study by outlining the key findings of the research and makes recommendations to improve the functionality of the 2015 Self-build and Custom Housebuilding Act (as amended) when applied by LPAs in the future.

6.1. Demand for Self and Custom Housebuilding in the Study Area

While the regulations accompanying the 2015 Act (as amended) were clear that Register existence must be publicised, 64% of LPAs in the study area had not undertaken publicity exercises outside of creating a website. Correspondingly, the research concluded that demand recorded on Registers can only be viewed as a minimum figure, as a pre-requisite of their effectiveness is the knowledge of their existence.
Recommendation: Regulations should be amended to require LPAs to conduct publication exercises bi-annually as a minimum.
The research highlighted that some LPAs are taking advantage of implementing additional eligibility requirements. The PPG requires that the implementation of such a requirement must be in response to a recognised local issue. It was unclear from the research what local issue(s), if any, the LPAs implementing such requirements had identified. As a result, demand recorded for LPAs who have implemented local connection tests is likely to be constrained by such requirements and therefore can only be viewed as a minimum.
Recommendation: Amendments should be made to the PPG whereby LPAs are required to consult on any proposed eligibility requirements and should then submit evidence of their ‘strong justification’ to PINS for approval before any test can be implemented.
Charging fees to gain acceptance to a Register also acts as a disincentive to joining Registers. The research noted the Government is already aware LPAs are charging disproportionate fees as a mechanism to discourage people from signing up to Registers. Once again, LPAs who charge fees to join the Register are likely to have stifled demand figures and can therefore only be viewed as a minimum.
Recommendation: The Legislation should be amended to remove provisions allowing LPAs to charge a fee for entry onto a Register. This would reduce transaction costs of the process [39,40].
Even with the aforementioned deficiencies in recording Register demand, the research has clearly demonstrated there is a high demand for self and custom housebuilding plots in the study area. The level of demand reported cannot currently be verified in the absence of a full demand assessment, due to the fact that none of the SHMAs in the study area sought to make robust assessments of demand for this tenure contrary to national guidance.
Recommendation: Amendments should be made to the PPG to explicitly require SHMAs to disaggregate OANs calculated to provide a specific need for self and custom housebuilding over the plan period.

6.2. Classifying Suitable Development Permissions in the Study Area

The study determined the most efficient method for identifying suitable permissions was the number of CIL exemptions granted for self-build developments in a base period. In the absence of a CIL or where a CIL does not cover an entire LPA area, the study established that permissions granted for Self-build should be monitored through S.106 agreements or planning conditions tying a development to a self-build use.
Recommendation: The PPG should be amended to include a section outlining appropriate mechanisms for monitoring suitable development permissions, specifying CIL self-build exemptions granted, S.106 agreements, and planning conditions as recommended monitoring indicators.
The research repeatedly found counting all single dwelling permissions towards the duty inappropriate. The majority of single dwelling permissions granted were likely to be sold on, to be built out by a third party as demonstrated by The Landbank Partnership and BuildStore data. The only exception to this assertion was when an outline permission for a single dwelling was sold on, as the buyer is able to have input into the final design of a property.
Recommendation: The PPG should explicitly state that in the absence of a legal agreement single dwelling permissions cannot be counted towards meeting the duty unless the permission is outlined with design as a reserved matter.
Whilst contacting applicants was also a method prevalent in the study area used to identify permissions, this was found to be somewhat unreliable in isolation; and marking an application as self-build on the Planning Portal application form was also found to be an unreliable monitoring source. These methods are better used during the planning application process to enable LPAs to work proactively with potential self-builders.
Recommendation: Amendments to the ‘Residential Unit’s’ section of the Planning Portal form should be made to allow applicants to clearly specify how many proposed self-build plots are proposed on a development site.

6.3. Granting Suitable Development Permissions to Meet Demand

The research demonstrated that 18 LPAs were unable to provide complete sets of supply data and 70% of LPAs who provided data had failed to comply with the Act in some shape or form. When this is viewed in light of the volume of LPAs that incorrectly count single dwellings towards the duty, it is clear that the majority of LPAs in the study area perceive the duty as no more than a mathematical exercise.
Recommendation: The legislation should be amended to require LPAs to submit annual returns to Government AND an accompanying statement of how these permissions have been collated in compliance with the statutory definition.
Due to the wording of the Time for Compliance and Fees Regulations 2016, permissions granted cannot be counted towards fulfilling the duty in certain circumstances. This oversimplification acts as a disincentive for LPAs to increase supply above Register demand which, as the research has demonstrated, can only be viewed as a minimum.
Recommendation: The Time for Compliance and Fees Regulations 2016 should be amended to allow any overprovision to be rolled over to the next base period.
Due to there being no requirement to connect permissions granted to those on the Register, a self-builder who has found a plot may be removed from a Register prior to the end of the base period, yet their plot is still counted toward meeting current Register demand at the end of the period.
Recommendation: The PPG should be amended to require LPAs to link plots granted to those on the Register so that if a person has been removed due to being granted a permission, their demand and supply is still reported in the annual return to Government.

Author Contributions

Conceptualization, A.H.G. and S.S.; investigation, A.H.G.; writing—original draft preparation, A.H.G. and S.S.; writing—review and editing; A.H.G. and S.S.; supervision, S.S. All authors have read and agreed to the published version of the manuscript.

Funding

This research received no external funding.

Institutional Review Board Statement

The study was conducted according to the guidelines of the Declaration of Helsinki and the Ethics Committee of the School of Geography and Planning at Cardiff University.

Informed Consent Statement

Not applicable.

Data Availability Statement

Page: 21Secondary data were collected from a variety of sources, including Freedom of Information (FOI) requests submitted to each LPA within the study area.

Conflicts of Interest

The authors declare no conflict of interest.

References

  1. Duncan, S.S.; Rowe, A. Self-provided Housing: The First World’s Hidden Housing Arm. Urban Stud. 1993, 30, 1331–1354. [Google Scholar] [CrossRef]
  2. Ball, M. European Housing Review 2011; Royal Institute of Chartered Surveyors: London, UK, 2011. [Google Scholar]
  3. Wallace, A.; Ford, J.; Quilgars, D. Build-It-Yourself? Understanding the Changing Landscape of the UK Self-Build Market; Centre for Housing Policy, University of York: York, UK, 2013. [Google Scholar]
  4. HM Government. Laying the Foundations: A Housing Strategy for England; HM Government: London, UK, 2011. [Google Scholar]
  5. Barlow, J.G.; Jackson, R.; Meikle, J. Homes to DIY for. The UK’s Self-Build Housing Market in the Twenty-First Century; Joseph Rowntree Foundation: York, UK, 2001. [Google Scholar]
  6. Griffiths, M. We Must Fix It: Delivering Reform of the Building Sector to Meet the UK’s Housing and Economic Challenges; Institute of Public Policy Research: London, UK, 2011. [Google Scholar]
  7. Dickinson, D.; Shahab, S. Post Planning-Decision Process: Ensuring the Delivery of High-Quality Developments in Cardiff. Land Use Policy 2021, 100, 105114. [Google Scholar] [CrossRef]
  8. National Custom and Self-build Association. Mapping the Right to Build; National Custom and Self-build Association: Cheltenham, UK, 2018. [Google Scholar]
  9. Parvin, A.; Saxby, D.; Cerulli, C.; Schneider, T. A Right to Build The Next Mass-Housebuilding Industry; University of Sheffield: Sheffield, UK, 2011. [Google Scholar]
  10. National Custom and Self-build Association. An Action Plan to Promote the Growth of Self-Build Housing; National Custom and Self-build Association: Cheltenham, UK, 2011. [Google Scholar]
  11. HM Government. The Self-Build and Custom Housebuilding Act 2015. (c.17); The Stationery Office: London, UK, 2015. [Google Scholar]
  12. Benson, M.; Hamiduddin, I. Self-Build Homes Social Discourse, Experiences and Directions; University College London: London, UK, 2017. [Google Scholar]
  13. Geoghegan, J. How New Self-Build Duty Will Affect Councils’ Planning Strategies. Available online: https://www.planningresource.co.uk/article/1382911/new-self-build-duty-will-affect-councils-planning-strategies (accessed on 28 November 2019).
  14. Clapham, D.; Kintrea, K.; McAdam, G. Individual Self-provision and the Scottish Housing System. Urban Stud. 1993, 30, 1355–1369. [Google Scholar] [CrossRef]
  15. Ministry of Defence. Local Authorities in the South West of England. Available online: https://assets.publishing.service.gov.uk/government/uploads/system/uploads/attachment_data/file/794816/JSHAO-20-LOCAL_AUTHORITIES_IN_THE_SOUTH_WEST_OF_ENGLAND.pdf (accessed on 27 November 2019).
  16. HM Government. How to Make a Freedom of Information (FOI) Request. Available online: https://www.gov.uk/make-a-freedom-of-information-request/print (accessed on 7 November 2019).
  17. Information Commissioners Office. What Is the Freedom of Information Act? Available online: https://ico.org.uk/for-organisations/guide-to-freedom-of-information/what-is-the-foi-act/ (accessed on 7 November 2019).
  18. Denzin, N.K. The Research Act: A Theoretical Introduction to Sociological Methods; Transaction Publishers: Piscataway Township, NJ, USA, 1973. [Google Scholar]
  19. Gaber, J.; Gaber, S.L. Utilizing Mixed-Method Research Designs in Planning: The Case of 14th Street, New York City. J. Plan. Educ. Res. 1997, 17, 95–103. [Google Scholar] [CrossRef]
  20. Kennedy, P. How to Combine Multiple Research Options: Practical Triangulation. Available online: http://johnnyholland.org/2009/08/20/practical-triangulation (accessed on 7 November 2019).
  21. Ipsos Mori. Survey of Self-Build Intentions. Available online: https://www.ipsos.com/ipsos-mori/en-uk/survey-self-build-intentions (accessed on 7 November 2019).
  22. Ipsos Mori. Survey Shows Increase in Self Build Intentions as Plans for National Custom and Self Build Week. 2014. Are Unveiled. Available online: https://nacsba.org.uk/wp-content/uploads/2014/10/images_press-releases_nasbapresser_20140227SSI.pdf (accessed on 7 November 2019).
  23. Ipsos Mori. Survey of Self-Build Intentions. 2016. Available online: https://www.ipsos.com/ipsos-mori/en-uk/survey-self-build-intentions-2016 (accessed on 7 November 2019).
  24. Planning Advisory Service. Planning for Self- and Custom-Build Housing; Local Government Association: London, UK, 2016. [Google Scholar]
  25. Ministry of Housing, Communities & Local Government. Housing Needs of Different Groups. Available online: https://www.gov.uk/guidance/housing-needs-of-different-groups (accessed on 22 November 2019).
  26. Ministry of Housing, Communities & Local Government. Self-Build and Custom Housebuilding. Available online: https://www.gov.uk/guidance/self-build-and-custom-housebuilding (accessed on 22 November 2019).
  27. Wilson, W. Self-Build and Custom Build Housing (England); House of Commons Library: London, UK, 2018. [Google Scholar]
  28. HM Government. The Self-Build and Custom Housebuilding (Register) Regulations 2016; The Stationery Office: London, UK, 2016. [Google Scholar]
  29. HM Government. The Self-Build and Custom Housebuilding (Time for Compliance and Fees) Regulations 2016; The Stationery Office: London, UK, 2016. [Google Scholar]
  30. Opinion Research Services. Swindon & Wiltshire Strategic Housing Market Assessment; Opinion Research Services: Swansea, UK, 2017. [Google Scholar]
  31. Opinion Research Services. Bath HMA Strategic Housing Market Assessment (Volume 2); Opinion Research Service: Swansea, UK, 2019. [Google Scholar]
  32. David Couttiee Associates. Council of the Isles of Scilly Strategic Housing Market Assessment Final Report; David Couttiee Associates: Huddersfield, UK, 2016. [Google Scholar]
  33. JG Consulting. Mendip, Sedgemoor, South Somerset and Taunton Deane Strategic Housing Market Assessment; JG Consulting: London, UK, 2016. [Google Scholar]
  34. HDH Planning and Development. Strategic Housing Market Assessment Part 2—Objectively Assessed Need for Affordable Housing; HDH Planning and Development: Lancaster, UK, 2017. [Google Scholar]
  35. NOMIS. Population Estimates—Local Authority Based by Single Year of Age; Office for National Statistics: Newport, UK, 2019. [Google Scholar]
  36. Tetlow King Planning. Quarterly Monitoring for the South West Region; Tetlow King Planning: Bristol, UK, 2019. [Google Scholar]
  37. BuildStore. PlotSearch. Available online: https://plotsearch.buildstore.co.uk/findingland/default.aspx (accessed on 23 November 2019).
  38. The LandBank Partnership. Searching for Land Look no Further. Available online: http://www.thelandbankpartnership.co.uk/ (accessed on 27 November 2019).
  39. Shahab, S.; Viallon, F.-X. A transaction-cost analysis of Swiss land improvement syndicates. Town Plan. Rev. 2019, 90, 545–565. [Google Scholar] [CrossRef]
  40. Shahab, S.; Viallon, F.-X. Swiss Land Improvement Syndicates: ‘Impure’ Coasian Solutions? Plan. Theory 2020. [Google Scholar] [CrossRef]
Figure 1. Methods used to publicise Registers (excluding webpages). Source: LPA Freedom of Information Responses.
Urbansci 05 00009 g001
Figure 2. Indicators used to identify suitable development permissions granted. Source: LPA FOI responses.
Urbansci 05 00009 g002
Figure 3. Indicators used to identify suitable development permissions granted. Source: LPA Freedom of Information Responses.
Urbansci 05 00009 g003
Figure 4. Methods used to publicise Registers for LPAs in Figure 3. Source: LPA Freedom of Information Responses.
Urbansci 05 00009 g004
Table 1. Types of Self-provided housing.
TypeDefinition
Self-commissionA self-provider buys the land and assumes risk, but contracts more or less all work out to professionals.
Self-procureA self-provider buys land and contracts design and construction to professionals but manages the project themselves.
Self-finishA self-provider buys land and contracts design and construction to professionals, up until (for example) ‘first fix’. They then save money by finishing the construction themselves.
Self-buildSelf-provider does everything, perhaps contracting an architect or specialist subcontractors where necessary.
Community Land Trust + Self-provideLand is provided for self-providers through a Community Land Trust arrangement. This could be as individual plots but is more likely to be a co-operative model such as mutual home ownership.
Enabled Self-provideLand is provided (and possibly prepared) through a local authority or housing association, they then support self-providers to develop housing.
Community Land TrustA Community Land Trust acquires and procures houses on behalf of the community, these are sold or rented to the users at affordable rates.
Self-build for rentA non-profit Housing Association procures housing in the usual way but involves future tenants in the design or construction process (often as a form of skills training).
Source: Parvin et al. (2011) [9].
Table 2. Summary of research methods used and corresponding research questions.
Source of DataType of Data CollectedResearch Questions
RQ1RQ2RQ3
Freedom of Information requestsQuantitative & QualitativeXXX
Strategic Housing Market AssessmentsQuantitative & QualitativeX X
Office for National Statistics (ONS) mid-year population estimatesQuantitativeX X
BuildStore plot search dataQuantitative XX
Land Bank Partnership plot search dataQuantitative XX
Table 3. Total demand recorded on Registers.
AuthorityBase Period 1Base Period 2Base Period 3Total% of Total Demand
Torbay Council 2124180.3%
Council of the Isles of Scilly 1857300.6%
Exeter City Council 6209350.7%
Gloucester City Council 62313420.8%
Cheltenham Borough Council 19619440.8%
Mid Devon District Council 141714450.9%
Tewkesbury Borough Council 122113460.9%
Swindon Borough Council 162220581.1%
West Devon Borough Council 30245591.1%
North Devon Council 242017611.2%
Forest of Dean District Council 144910731.4%
Exmoor National Park Authority33644831.6%
Torridge District Council183440921.7%
East Devon District Council 3243271021.9%
South Somerset District Council 3144291042.0%
Mendip District Council 2958401272.4%
Sedgemoor District Council 3737541282.4%
Cotswold District Council 666991442.7%
Stroud District Council 4811221623.1%
Wiltshire Council 31481061853.5%
South Hams District Council8973271893.6%
Plymouth City Council 9372442094.0%
South Gloucestershire Council 12767792735.2%
Teignbridge District Council 131137603286.2%
Dartmoor National Park Authority1181571233987.5%
Bristol City Council 8532027668112.9%
Cornwall Council 31016322169413.2%
Bath & North East Somerset Council45625415286216.4%
Totals1895191314645272100%
Source: LPA Freedom of Information Responses.
Table 4. Dates LPAs implemented their Registers.
Date Register Started Percentage of LPAs
01 December 20147%
01 April 20154%
01 August 20157%
01 October 20154%
01 November 20154%
01 February 20164%
30 March 201618%
01 April 201654%
Total100%
Source: LPA Freedom of Information Responses.
Table 5. Base period one Register lengths.
Date Register Started Base Period One Length
01 December 20141 year, 10 months, 30 days
01 April 20151 year, 6 months, 30 days
01 August 20151 year, 2 months, 30 days
01 October 20151 year, 30 days
01 November 201511 months, 30 days
01 February 20168 months, 30 days
30 March 20167 months, 1 day
01 April 20166 months, 30 days
Source: LPA Freedom of Information Responses.
Table 6. Strategic Housing Market Assessments (SHMAs) published in the study area post 2015.
SHMA Ref No.SHMA TitleDate PublishedHousing Market Area
1Bath HMA Strategic Housing Market Assessment (Volume 2)2019Bath & North East Somerset
2Wider Bristol HMA Strategic Housing Market Assessment (Volume 2)2019Bristol, South Gloucestershire and North Somerset
3Council of the Isles of Scilly Strategic Housing Market Assessment2016Isles of Scilly
4Mendip, Sedgemoor, South Somerset and Taunton Deane Strategic Housing Market Assessment2016Mendip, Sedgemoor and South Somerset
5Strategic Housing Market Assessment Part 2—Objectively Assessed Need for Affordable Housing2017Plymouth, South Hams and West Devon
6Swindon & Wiltshire Strategic Housing Market Assessment2017Wiltshire and Swindon
Source: ORS, 2019; ORS, 2019; DCA, 2016; JG Consulting, 2016, HDH Planning and Development, 2017; and ORS, 2017 [30,31,32,33,34].
Table 7. Indicators of demand used in SHMAs.
Demand Indicator Used SHMA Ref No.% of SHMAs Using Indicator
123456
NaCSBA ‘Need a Plot’ xx x x67%
Register data xxx50%
BuildStore data x 17%
Information from letting agents x 17%
Household Survey Questionnaire x 17%
Total Indicators Used111412
Source: ORS, 2019; ORS, 2019: DCA, 2016; JG Consulting, 2016, HDH Planning and Development, 2017; and ORS, 2017 [30,31,32,33,34].
Table 8. Summary of comments on calculating demand in SHMAs whom did not produce a demand figure.
SHMA Ref No.Summary of Comments on DemandHMA Register Figure at Publication Date
1If someone requires a self-build plot, they will be counted in the OAN like with affordable housing. The evidence supports limited demand in the area, role of the sector will be better understood once the councils Register has had time to mature.862
2The evidence supports limited demand; however, this may under-estimate actual demand.954
4Any attempt to quantify demand and the nature of demand should be focused on the planning system rather than sales and marketing. The evidence points to the conclusion that significant demand exists for self and custom build projects and the biggest barrier to success is the lack of available land.97
5No comments other than stating Register figures [no date or base period provided].381
6A survey to ascertain levels of demand for self-build could be undertaken in future; however, it would be important to ensure that appropriate questions are designed that can effectively separate aspiration from effective market demand.117
Source: ORS, 2019; ORS, 2019: DCA, 2016; JG Consulting, 2016, HDH Planning and Development, 2017; and ORS, 2017 [30,31,32,33,34].
Table 9. Estimated demand across the study area using national data compared with demand recorded on Registers.
AuthorityEstimated DemandRegister DemandRegister % of Estimated Demand
Council of the Isles of Scilly 383079%
Bath & North East Somerset Council324186227%
Exeter City Council 2263515%
Teignbridge District Council 225232815%
South Hams District Council147118913%
Cotswold District Council 150714410%
Bristol City Council 76406819%
Stroud District Council 19811628%
Torridge District Council1156928%
Cornwall Council 95096947%
Mendip District Council 19111277%
Sedgemoor District Council 20421286%
West Devon Borough Council 945596%
South Gloucestershire Council 46522736%
Forest of Dean District Council 1462735%
Plymouth City Council 43652095%
East Devon District Council 24541024%
North Devon Council 1608614%
South Somerset District Council 28031044%
Mid Devon District Council 1352453%
Tewkesbury Borough Council 1526463%
Wiltshire Council 81871852%
Cheltenham Borough Council 1956442%
Gloucester City Council 2092422%
Swindon Borough Council 3581582%
Torbay Council 2287181%
Totals72,24047917%
Source: Ipsos Mori, 2013, 2014, 2015, 2016; NOMIS, 2019; LPA Freedom of Information Responses [21,22,23,35].
Table 10. Suitable permission granted in base periods 2 to 3 in the study area.
Local Planning AuthorityBase Period 2Base Period 3Total% of Total Supply
Cornwall Council 11991316251562.53%
South Somerset District Council1451192646.56%
South Gloucestershire Council 501632135.30%
Teignbridge District Council 75991744.33%
East Devon District Council 80361162.88%
North Devon Council 96901864.62%
Torridge District Council4933822.04%
Sedgemoor District Council 2354771.91%
Bath & North East Somerset 3437711.77%
Plymouth City Council 4739862.14%
Stroud District Council 1237491.22%
Bristol City Council 1827451.12%
Cotswold District Council 2320431.07%
Forest of Dean District Council 042421.04%
Exeter City Council 109190.47%
Swindon Borough Council 611170.42%
Exmoor National Park 95140.35%
Tewkesbury Borough Council 0550.12%
Gloucester City Council 1230.07%
Mid Devon District Council 0110.02%
Council of the Isles of Scilly 0000.00%
Dartmoor National Park 0000.00%
Totals187721454022100.00%
Source: LPA Freedom of Information Responses.
Table 11. Methods used by LPAs who applied multiple mechanisms.
MechanismNo. of CIL Exemptions GrantedApplicant ContactedLocal Plan Policy/AllocationsAll Single Dwelling PlotsSection 106/Planning Condition
Forest of Dean District Council X X
South Gloucestershire Council XXX
Stroud District Council X X
Torridge District Council XX
Source: LPA Freedom of Information Responses.
Table 12. BuildStore building opportunities advertised the study area during November 2019.
CountyBuilding Opportunities as at:
04/11/201911/11/201918/11/201925/11/2019
Cornwall189191184184
Devon158158157157
Gloucestershire43464038
Somerset and Avon87899087
Wiltshire10101111
Total487494482477
Source: BuildStore, 2019 [37].
Table 13. LandBank Partnership building opportunities advertised in the study area during November 2019.
CountyBuilding Opportunities as at:
04/11/201911/11/201918/11/201925/11/2019
Bristol 0211
Cornwall4632
Devon1111
Gloucestershire1000
Somerset2222
Wiltshire4611
Total121787
Source: LandBank Partnership, 2019 [38].
Table 14. Base period two over provision in the study area.
AuthorityBase Period 1 Register FigureBase Period 2
Supply Figure
Over Provision
Exeter City Council 6104
Tewkesbury Borough Council 122311
Torridge District Council184931
East Devon District Council 328048
North Devon Council 249672
South Somerset District Council31145114
Cornwall Council 3101199889
Total43316021169
Source: LPA Freedom of Information Responses.
Table 15. Base period one demand data compared with permissions granted between base periods two to four.
Authority Base Period 1 Register FigureTotal Plots Delivered
(Base Periods 2 to 4)
Shortfall/
Surplus
Gloucester City Council 330
Plymouth City Council 9311623
Stroud District Council 487931
Tewkesbury Borough Council 127159
Torridge District Council189577
Sedgemoor District Council 3713396
South Gloucestershire Council 127237110
Teignbridge District Council 131289158
North Devon Council 24267243
South Somerset District Council31360329
Totals 52416501126
Source: LPA Freedom of Information Responses.
Table 16. Compliance with statutory duties set out in the 2015 Act (as amended).
AuthorityDemand Recorded Incompliance with Regulations?Appropriate Monitoring Mechanism(s)?Complied with Statutory Duties in Full?
Gloucester City Council NoNoNo
South Somerset District Council NoNoNo
North Devon Council NoNoNo
Tewkesbury Borough Council NoNoNo
Stroud District Council NoYesNo
South Gloucestershire Council NoYesNo
Torridge District CouncilYesNoNo
Sedgemoor District Council YesYesYes
Teignbridge District Council YesYesYes
Plymouth City Council YesYesYes
Publisher’s Note: MDPI stays neutral with regard to jurisdictional claims in published maps and institutional affiliations.

