Article

A Study of the Spatial Distribution of Danwei Compounds in the Old Town of Hefei, China

Division of Global Architecture, Graduate School of Engineering, Osaka University, Suita 565-0871, Japan
*
Author to whom correspondence should be addressed.
Urban Sci. 2021, 5(1), 7; https://doi.org/10.3390/urbansci5010007
Submission received: 26 October 2020 / Revised: 4 January 2021 / Accepted: 8 January 2021 / Published: 13 January 2021

Abstract

:
Danwei compounds have experienced a steady decline since the 1997 Urban Housing System Reform. Existing research suggests that Danwei compounds, which were characteristically walled neighbourhoods of work and residence, have experienced socio-spatial changes in social structure, community management and spatial form. However, there is limited understanding of its current spatial function and relation to the city. This study analysed the spatial distribution of Danwei compounds, their spatial features and accessibility to selected public facilities in comparison with non-Danwei residential sites in the old town of Hefei city. ArcGIS was used to analyse building density, plot ratio of the residential sites and their accessibility to public facilities. Further quantitative analysis was done using binary logistic regression and descriptive statistics to identify spatial features of the residential sites. The results show that even though the urban land reforms have led to a steady rise in non-Danwei residential sites, Danwei compounds predominate the urban spatial structure. Comparatively, Danwei compounds have lower plot ratios with higher levels of accessibility to commercial centres and hospitals but poor accessibility to schools. The paper suggests the need for local planning officials to support the revitalisation of old residential compounds through integrated and community-centred spatial planning.

1. Introduction

The urban neighbourhood constitutes the basic unit of the urban living environment, and critical focus on urban planning and policy initiatives in both the developed and emerging world [1]. In China, emphasis on the urban neighbourhood emerged at the beginning of the urbanisation process, particularly in the establishment and adoption of the “Danwei system”. It is a unique community-level socio-spatial system which emerged after the founding of the People’s Republic of China (PRC) in 1949 and developed during the early period of socialist construction [2].
The Danwei system, which originated in the middle of the 20th century, is a grassroots urban community structure with strong organisational and mobilisation capacity and administrative power [3]. Generally, a “Danwei” could be understood as a publicly-owned institution, e.g., a school, a hospital, a weather forecasting station, etc., while the “Danwei system” is the social-political system built on the “Danweis” [2]. Based on the “Danwei system”, a number of “Danwei compounds” (also called “Danwei communities” or “Danwei compound communities”) were established as the spatial unit of the Danwei system. Basically, the term “Danwei compound” refers to a compound enclosed of walls with one or several gates for access. The interior is often a mixed-use spatial environment of offices, dwelling and public facilities and thus includes all the working, living, and relaxing spaces and facilities of a Danwei [4].
Danwei compounds dominated China’s urban development when urban development was almost equivalent to the construction of new Danwei compounds before the 1980s [5]. It has been argued that the noticeable decline of the Danwei system occurred after the 1997 Urban Housing System reform [6], which permitted land transactions between legal persons, and housing transactions between natural/legal persons. Consequently, most of the new rural–urban migrants tended to live in other types of residential areas, such as real estate housing and government-provided affordable housing [7]. This urban spatial reconfiguration has meant that Danwei compounds have become purely residential while market-led development has been expanding old city boundaries and urban life beyond the walls of old neighbourhoods.
Given the above, a number of studies have been conducted to comprehend the process and its underpinnings. Within the broader context of urban studies, and specifically urban planning, a large number of studies on Danwei compounds has focused on historical analyses or case studies of individual Danweis [5,8,9]. Zhang [8] analysed the historical process of the Danwei compounds’ decline and found that the decline and decomposition of the compound is an inevitable consequence of social development. He suggested reorganisation of the Danwei compound in terms of improving the social security system, encouraging the subdivision of compounds by government fiscal policy and the marketisation of land. In another study, Qiao [9] investigated the spatial design features and history of Danwei compounds in Beijing. His results indicated that the Danwei compounds still had a significant influence on the existing spatial structure of Chinese cities. More recently, Li [5], focusing on spatial typology analysis, illustrated the formation and link between Danwei compounds and the city of Nanchang.
While these studies provide useful understanding of the Danwei system and the spatial aspects of the urban living environment, there is still limited understanding on the current state of Danwei at the city level in terms of their spatial distribution and spatial features. Are Danwei’s still a major component of the urban spatial configuration? Moreover, as the land and housing reforms triggered a boom in private real estate development and associated public facilities, recent research has not engaged a comparison between the old Danwei’s and new residential units in Chinese cities in terms of spatial characteristics. How do the old Danwei compounds compare with non-Danwei sites in terms of spatial features such as plot ratio, building density and access to public facilities? Underlying these two questions is the fact in the international scholarly literature, little is known of Danwei as part of China’s urban system since most of the research outputs have been published in Chinese (see in [2,3,4,5,8,9] etc.). Therefore, quantitative and spatial research on the state quo of Danwei compounds, including studies on the current distribution of Danwei compounds is scarce, especially in English language. In the international scholarly literature, most of the discussions on Danwei system and Danwei compound are focused on political economy [10,11,12], and a few on urban spatial studies about Danwei compounds [13]. For example, the book edited by Lü and Perry [10] provides a series of analyses of the Danwei from perspectives of historical development, international comparisons and reforms. Bray [11] investigated the Danwei compound and Danwei system and described them as neighbourhood social space and local governance of China. He identified enclosed walls as the distinctive of the compound. In another study, Bian [12] introduced the Danwei system of China by exploring different kinds of industries and enterprises promoted by such a system. Peiling’s recent study [13] provided a comprehensive survey of the Jingmian Danwei compound in Beijing through micro-space analyses. He identified that the most serious issue in the Jingmian compound might be residents’ dislocated identity of whether they are socialist workers, rural farmers or modern citizens.
This paper seeks to add to emerging work on Danwei in the international English-based literature by using a spatial distribution approach. Spatial distribution is a common research method to map a specific kind of object in urban space and study about their characteristics. Dang et al. studied the spatial distribution of affordable housing development in Beijing [14]. Quinn et al. mapped the neighbourhood physical disorder in New York City using a similar approach [15]. Within the spatial distribution approach, accessibility analyses have been used as an analytical tool to understand spatial equalisation [16]. For example, Lotfi and Koohsari studied the accessibility of neighbourhood facilities in Tehran, Iran [17], while Oh and Jeong studied the accessibility of urban parks in Seoul, South Korea [18]. Indeed, evidence shows that for urban neighbourhoods, their distribution and connection to the city in terms of access to commercial and public facilities are important components of the overall quality of the urban living environment. For example, Bonaiuto et al.’s study showed that having adequate commercial coverage, a variety of goods, and good schools and health facilities in the neighbourhood that can be easily reached on foot are important indicators for residents to quality of their residential areas [19]. In line with this, commercial services, schools and hospitals were selected as the main public facilities in this study.
Therefore, this paper focuses on two questions: (1) What is the current spatial distribution of the Danwei compounds in Hefei old city? (2) What spatial features (e.g., plot ratio, building density and accessibility) distinguish Danwei compounds and other residential sites? By doing this, the paper aims to contribute to the existing literature in two ways. First, we provide an empirical understanding on the distribution of Danwei compounds as an entry for future in-depth analysis on their conditions and socio-spatial transformation, and second to provide insights at the city scale on accessibility to public facilities in terms of the reshaping of the urban environment following recent housing reforms (e.g., The 1997 Urban Housing Reform).
The paper is structured as follows. The next section will provide readers with the study’s materials and methods. Section 3 provides the results of the study, which is followed by a discussion of the findings. The paper concludes with expandable directions for future research.

2. Materials and Methods

This paper examines the spatial distribution of Danwei compounds in the Hefei old town using pedestrian sheds of public facilities as the basis of the analysis. It addresses the following research questions. (1) What is the current spatial distribution of the Danwei compounds in Hefei old city? (2) What spatial features differ between the Danwei compound and other residential sites?
In order to answer the first research question, a quantitative study of the distribution and location status of the Danwei compounds in the old town of Hefei was conducted. Raw data were collected from current land use map, Open Street Map API, Amap.com API and a previous study of the authors. Spatial analysis of mapping, plot ratio and building density, and pedestrian shed analysis was done in ArcGIS software. Further statistical analysis was done in IBM SPSS software (version 22). To answer the second question, non-Danwei residential sites were used as a control group against the Danwei compound.
The term Non-Danwei residential site, as used in this paper, refers to all residential sites in the old town except the Danwei compounds. It includes social housing neighbourhoods formed before the 1997 reform and real estate sites built after the 1997 reform. The word site is therefore used to refer to “Danwei compound” and “Non-Danwei residential site”. A site’s “type” will be used to refer to whether it is a “Danwei compound” or “Non-Danwei residential”.
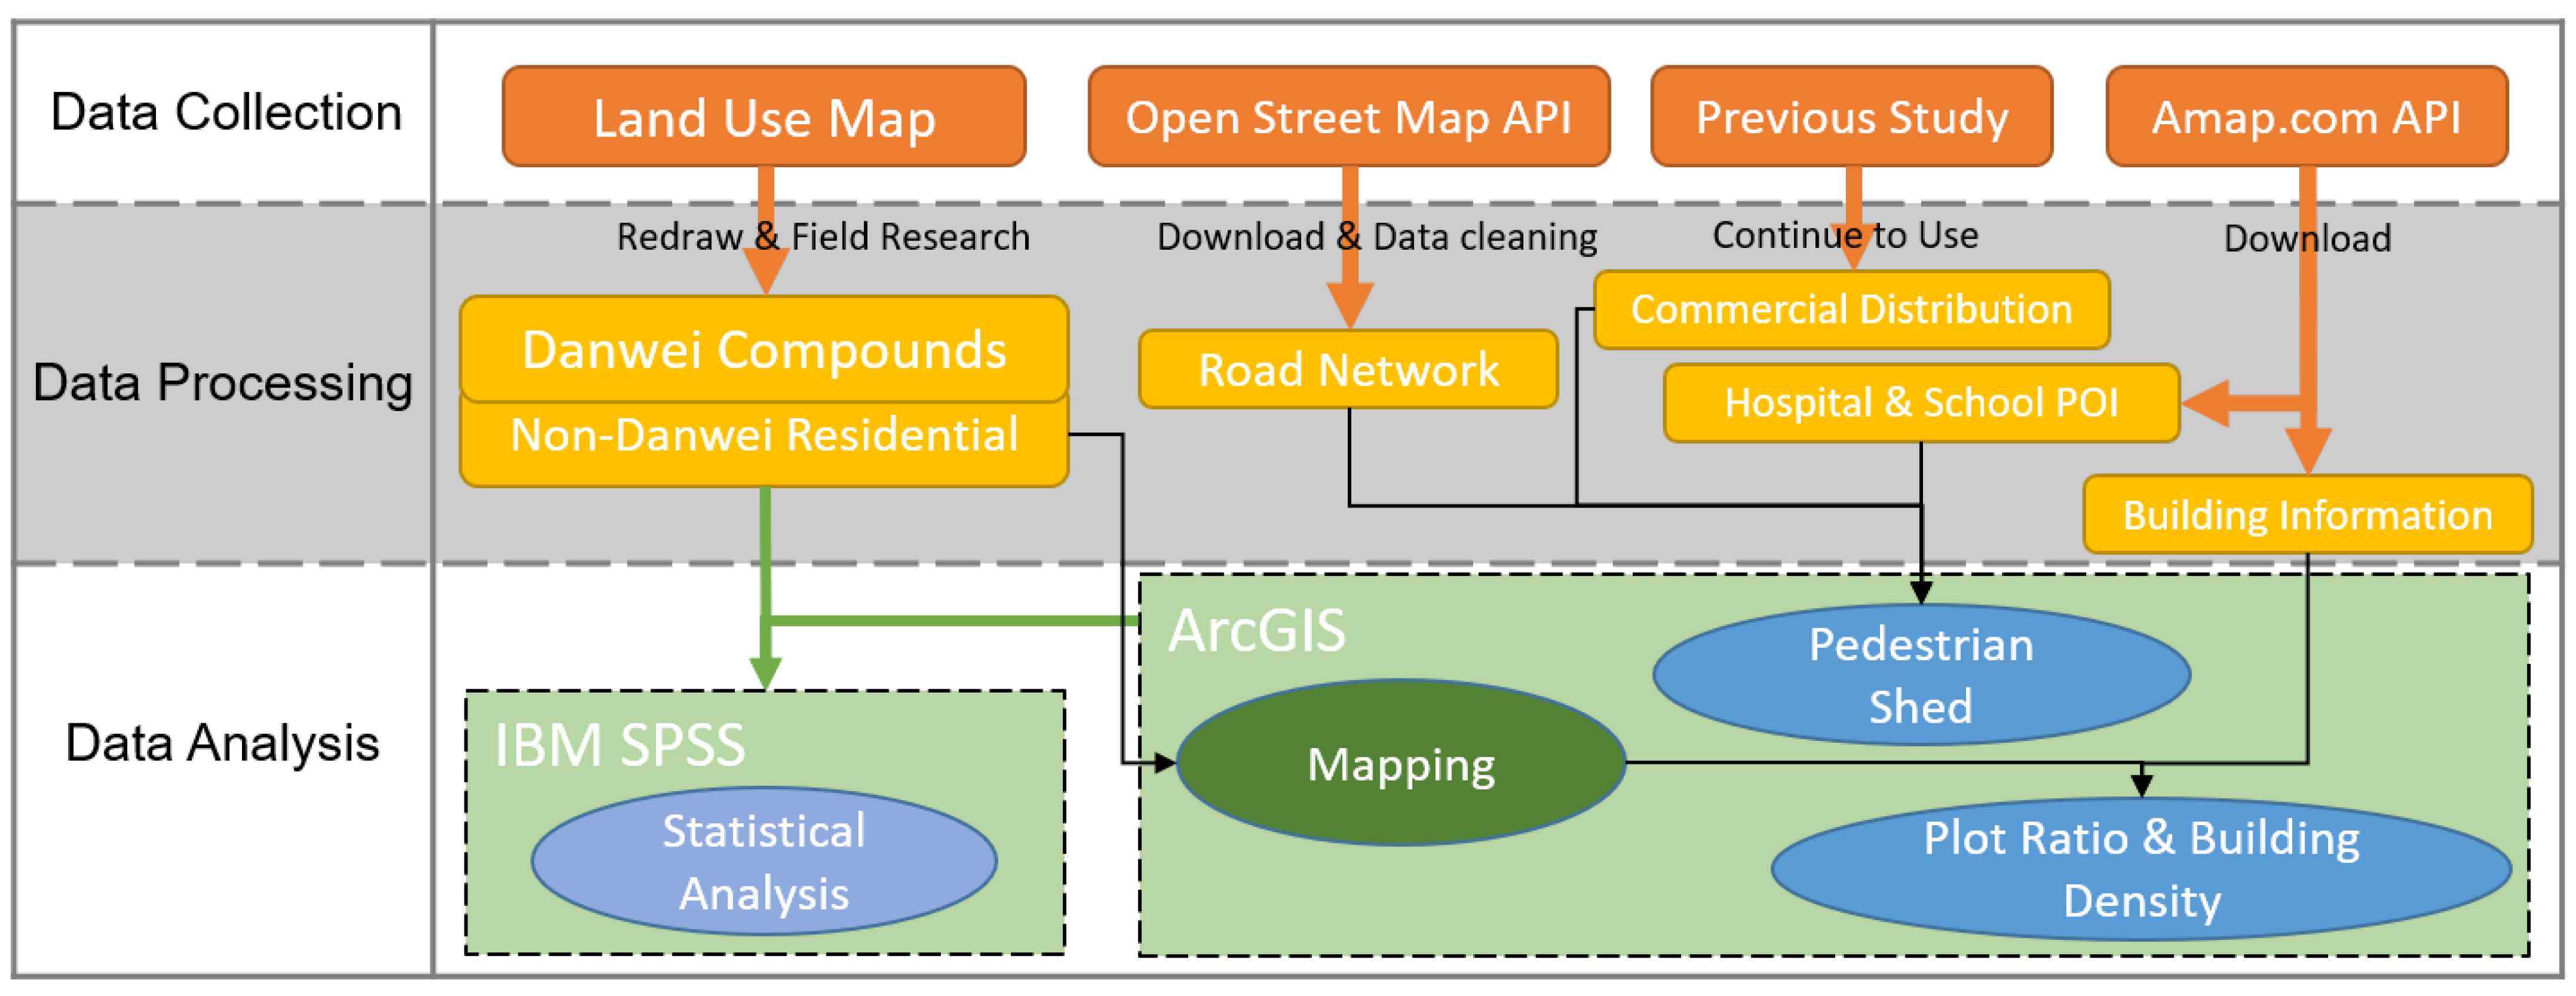
For the propose of this study, the workflow was separated into three stages: data collection, data processing and data analysis (Figure 1). From the above-mentioned data sources, four main categories of geo-spatial information of Hefei old town and the surrounding area were collected: urban land use conditions, road network conditions, location of public facilities and building conditions. All the raw data was then processed to fit the need for data analysis. Additionally, the spatial analysis of pedestrian outside ofpublic facilities, plot ratio and building density of each Danwei compound and non-Danwei residential sites were done in ArcGIS software. The accessibility analyses of sites to public facilities, land occupation, plot ratio, building density of each Danwei compounds and non-Danwei residential sites were recorded. The recorded data was collated and analysed in IBM SPSS software using descriptive statistics and binary logistic regression.

2.1. Study Context: The City of Hefei and Its Old Town Area

Hefei City is located in the middle and lower reaches of the Yangtze River Plain, with flat terrain in the built-up area [20]. As of 2019, Hefei has a total area of 11,445.1 square kilometres, a resident population of 8,189,000 and an urbanisation rate of 76.33% [21].
According to the Hefei Urban Planning Record [20], the city of Hefei has a history of over 2000 years. The population peak before 1949 was around 1,600,000 in the year of 1820. Since then, with the overall recession of China and various wars, the population dropped rapidly. After World War II, the urban built-up area was extensively damaged. The population was only 69,015 (according to the Hefei Local Gazetteers Compilation Committee [
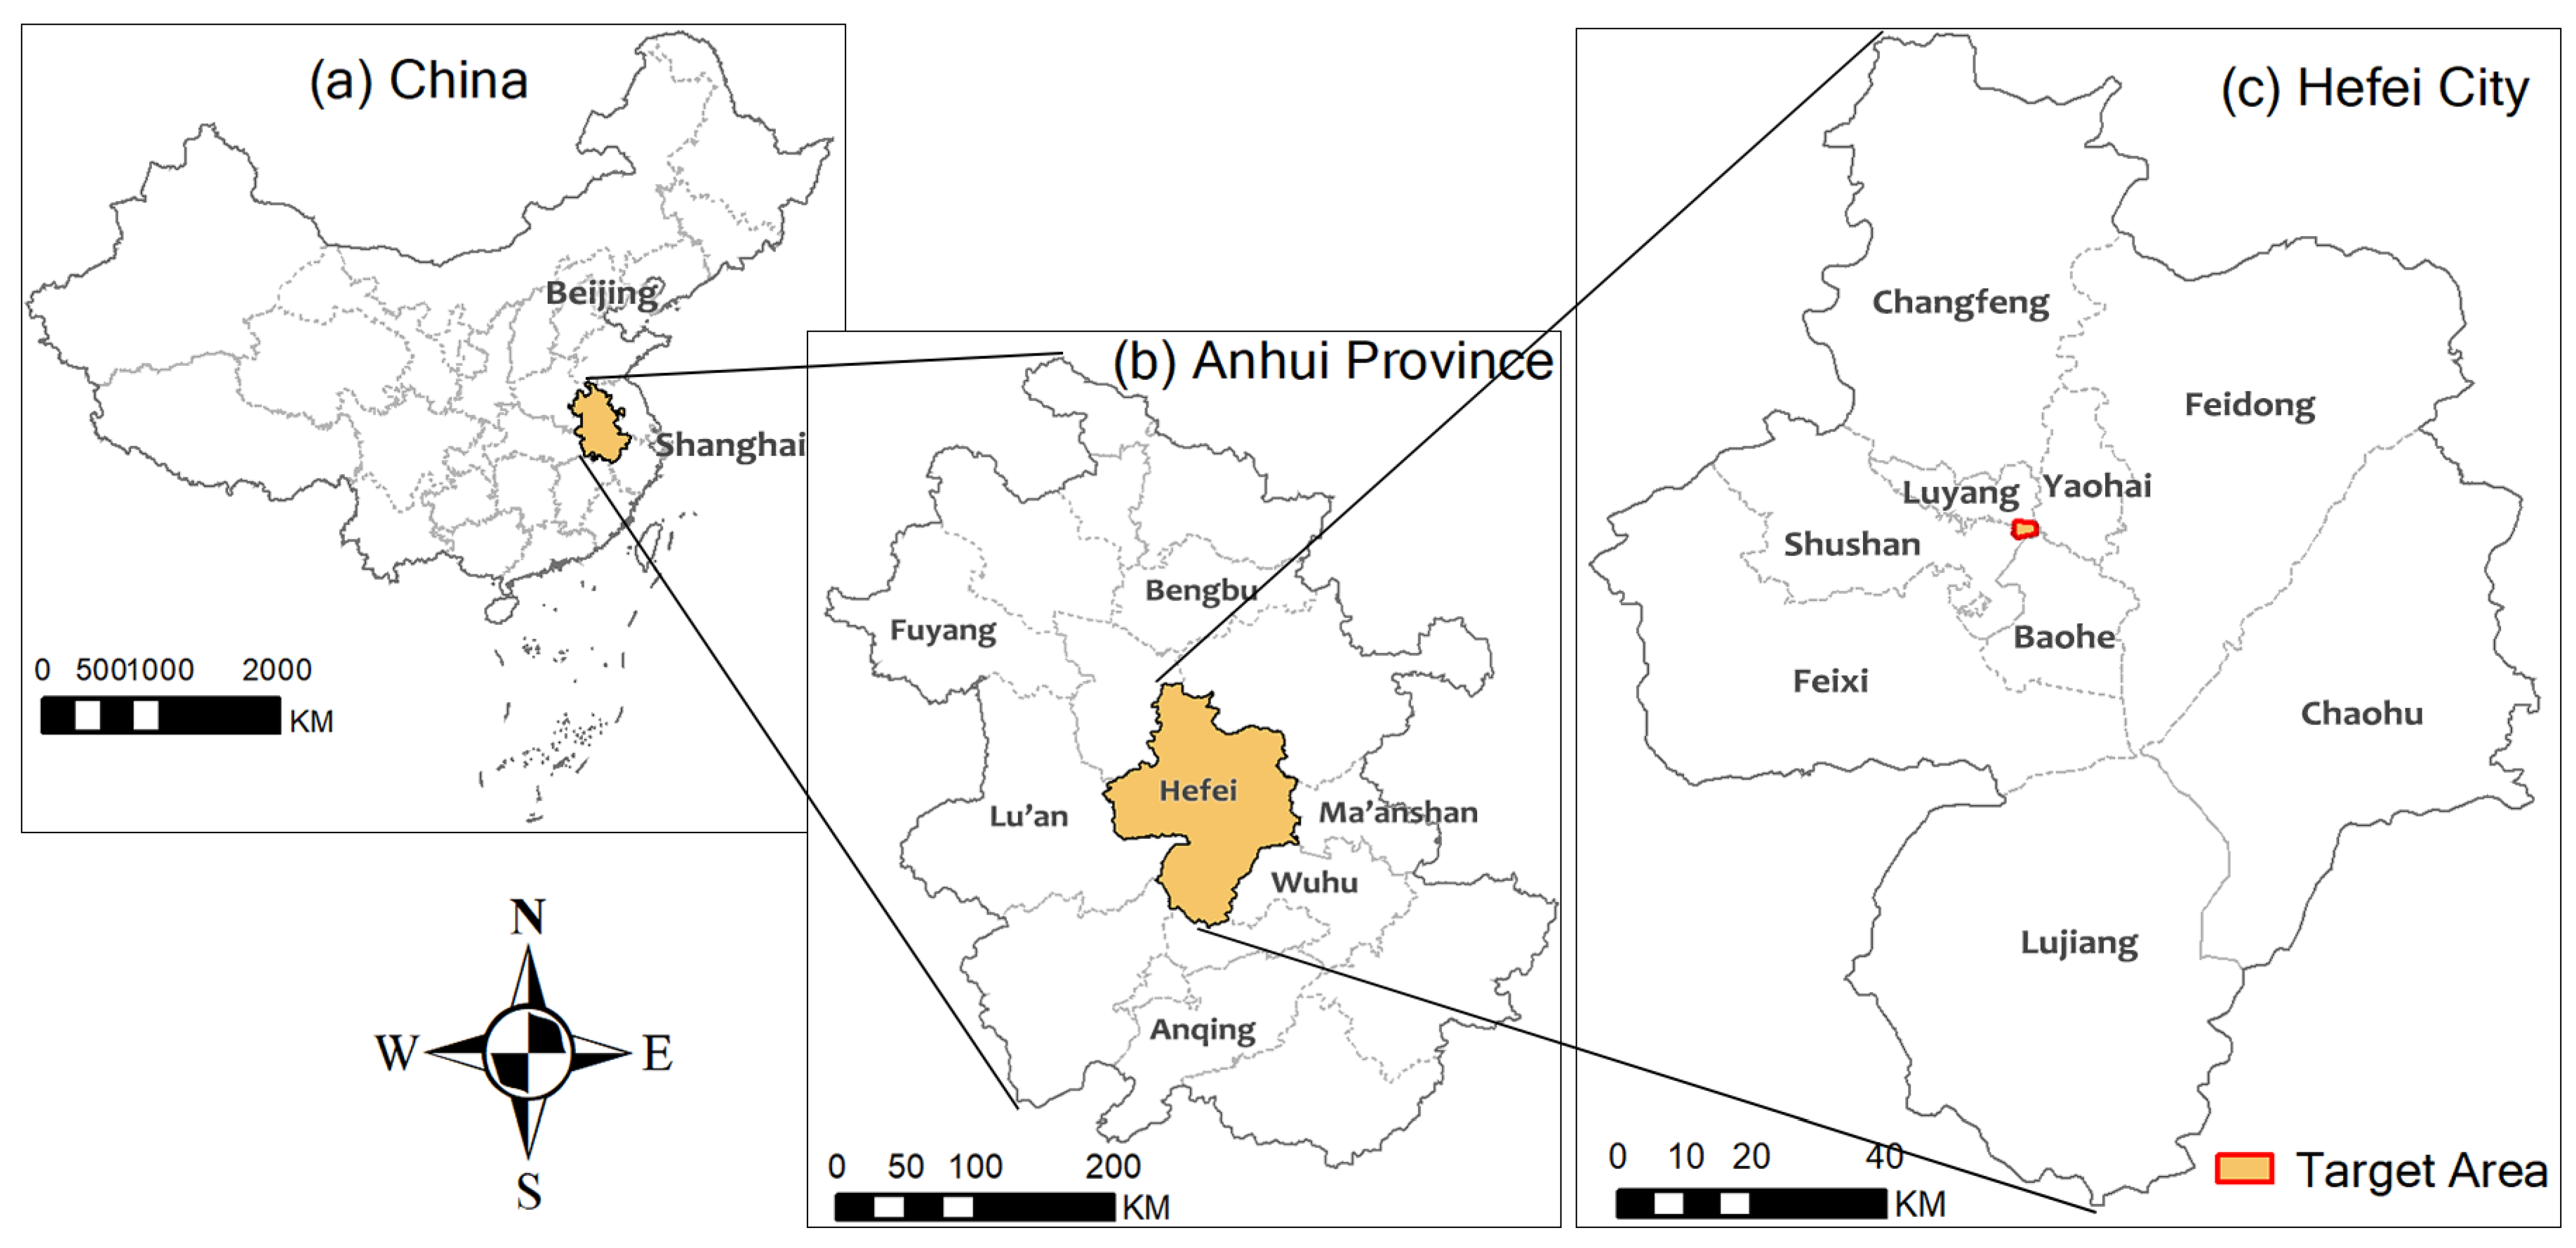
22]) when the civil war ended in 1949. Hefei was positioned as the provincial capital of Anhui Province in 1952. Anhui Province is located on the eastern part of China, and borders JiangSu province to the east; ZheJiang and Jiangxi province to the south; and HuBei, HeNan and ShanDong to the west and north. The city of Hefei locates in the middle of Anhui province, about 400 km to the west of the city of Shanghai (Figure 2).
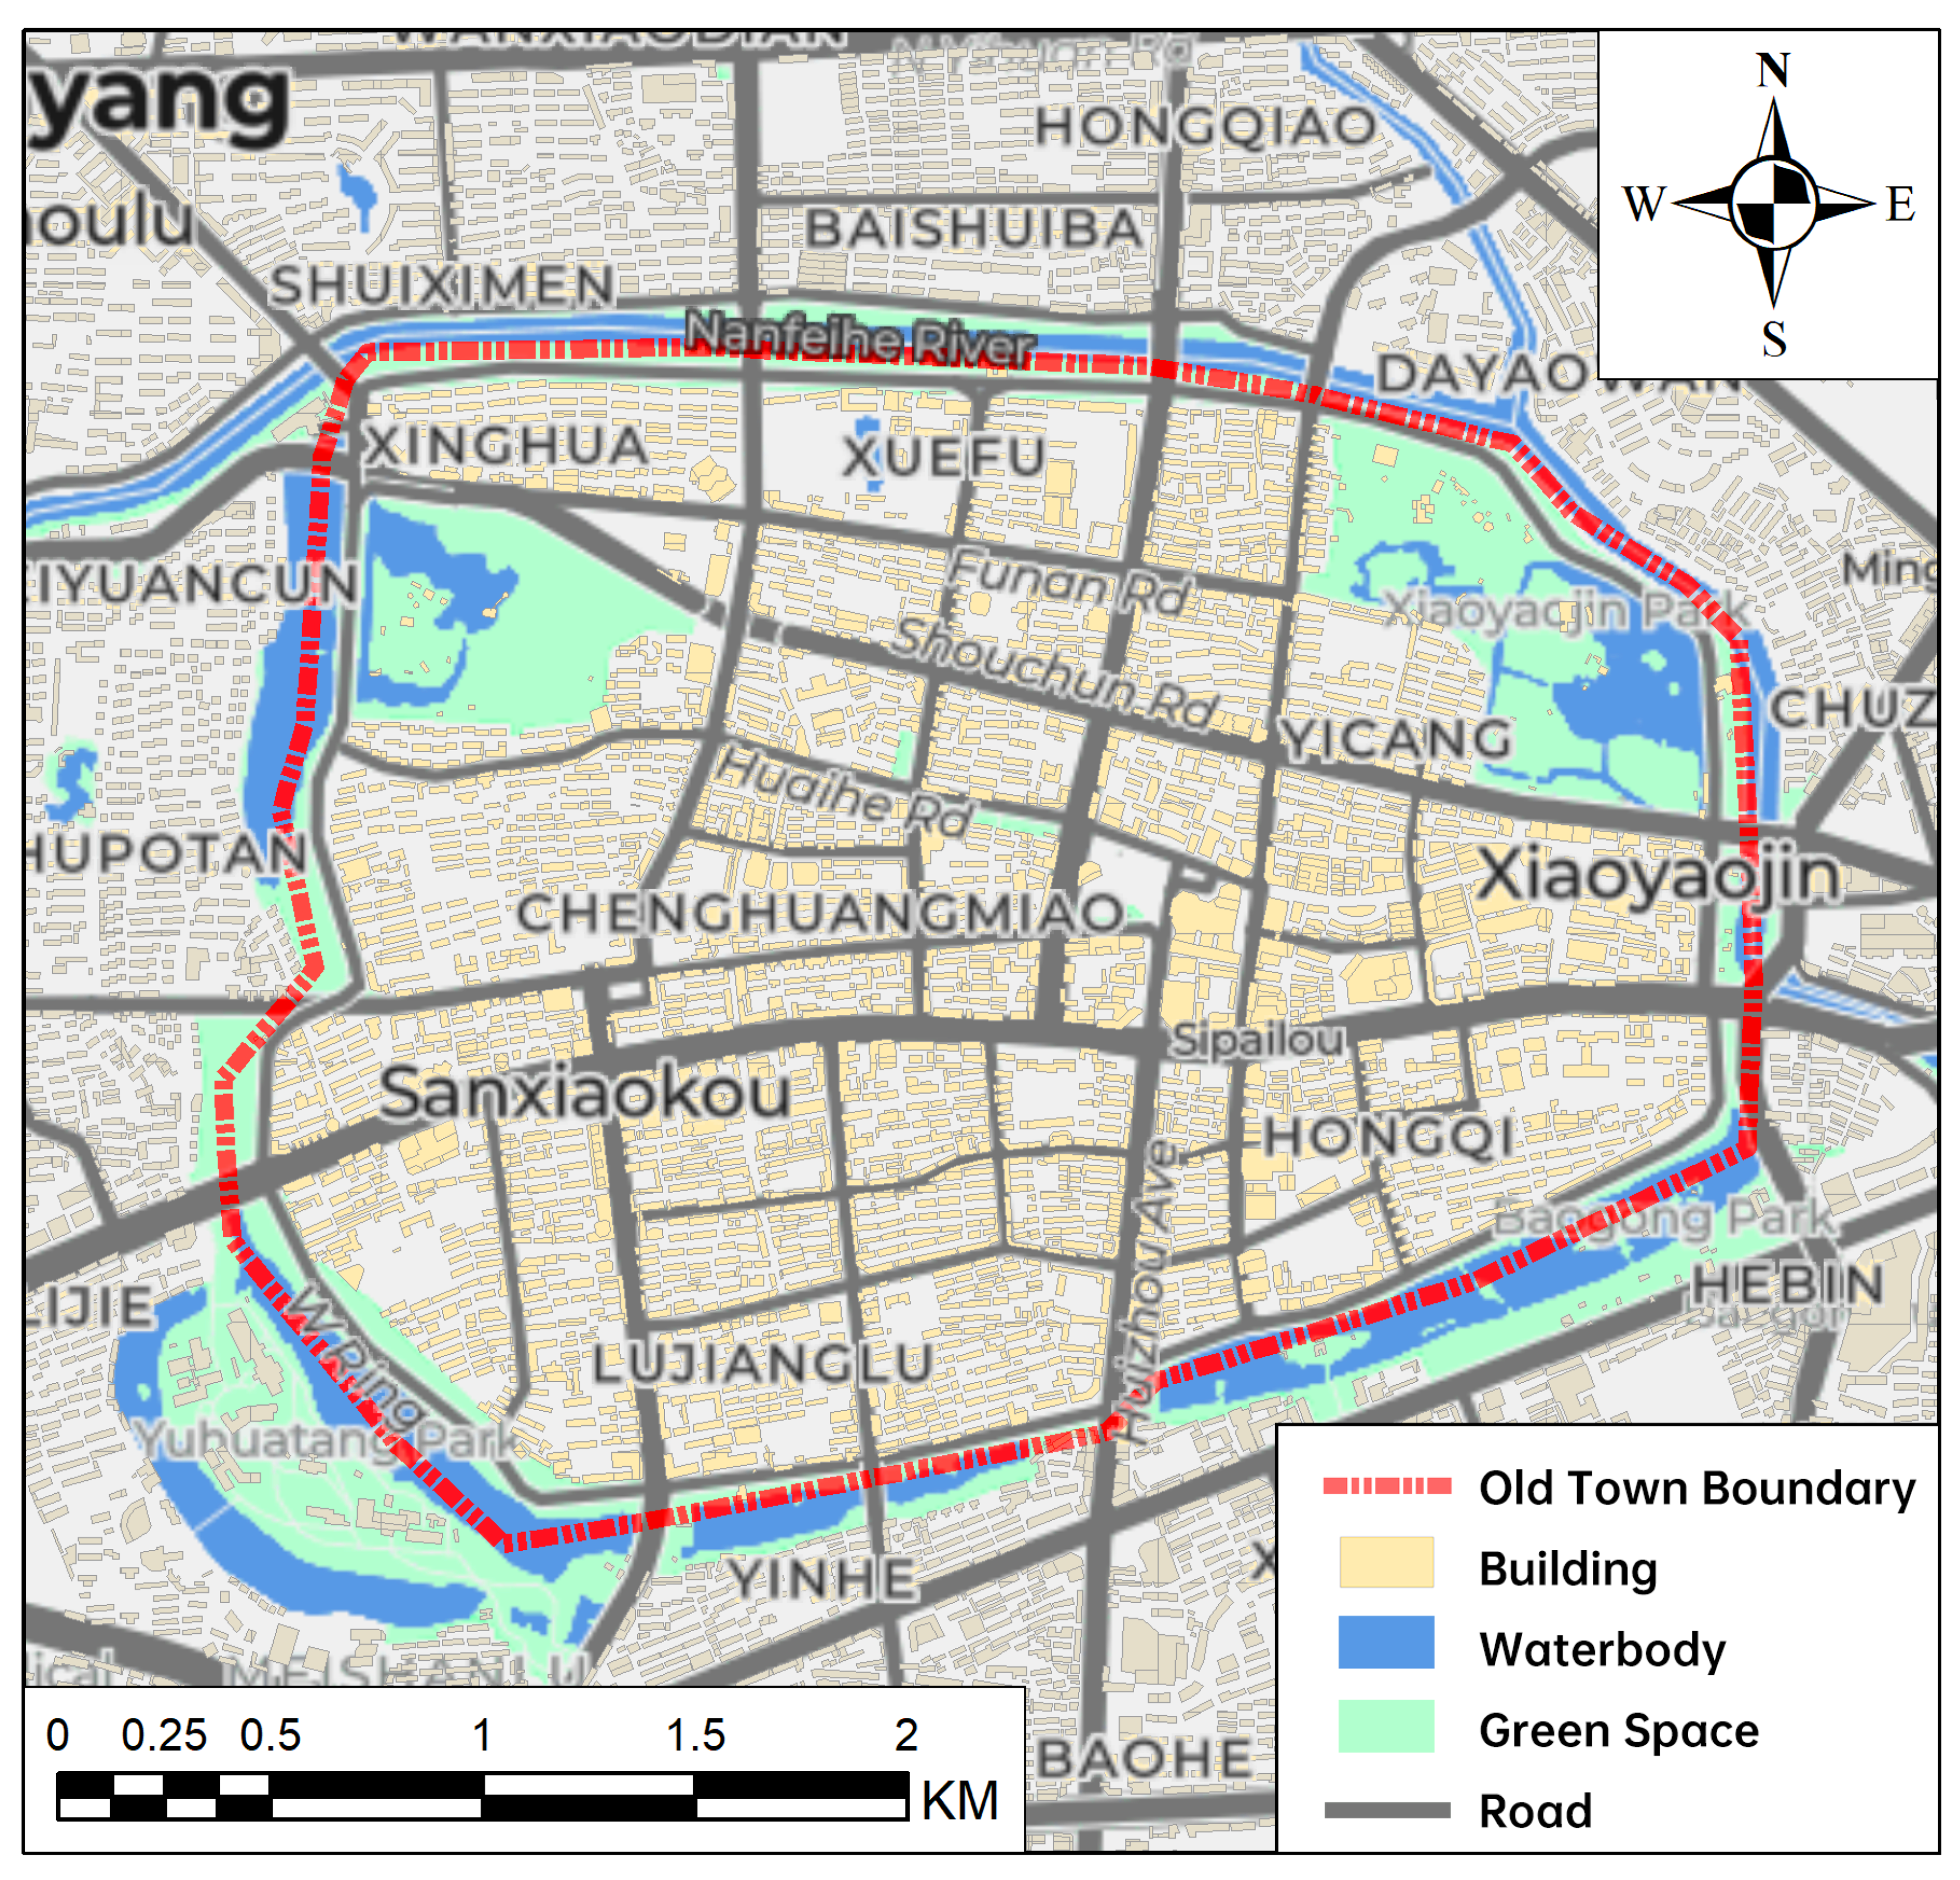
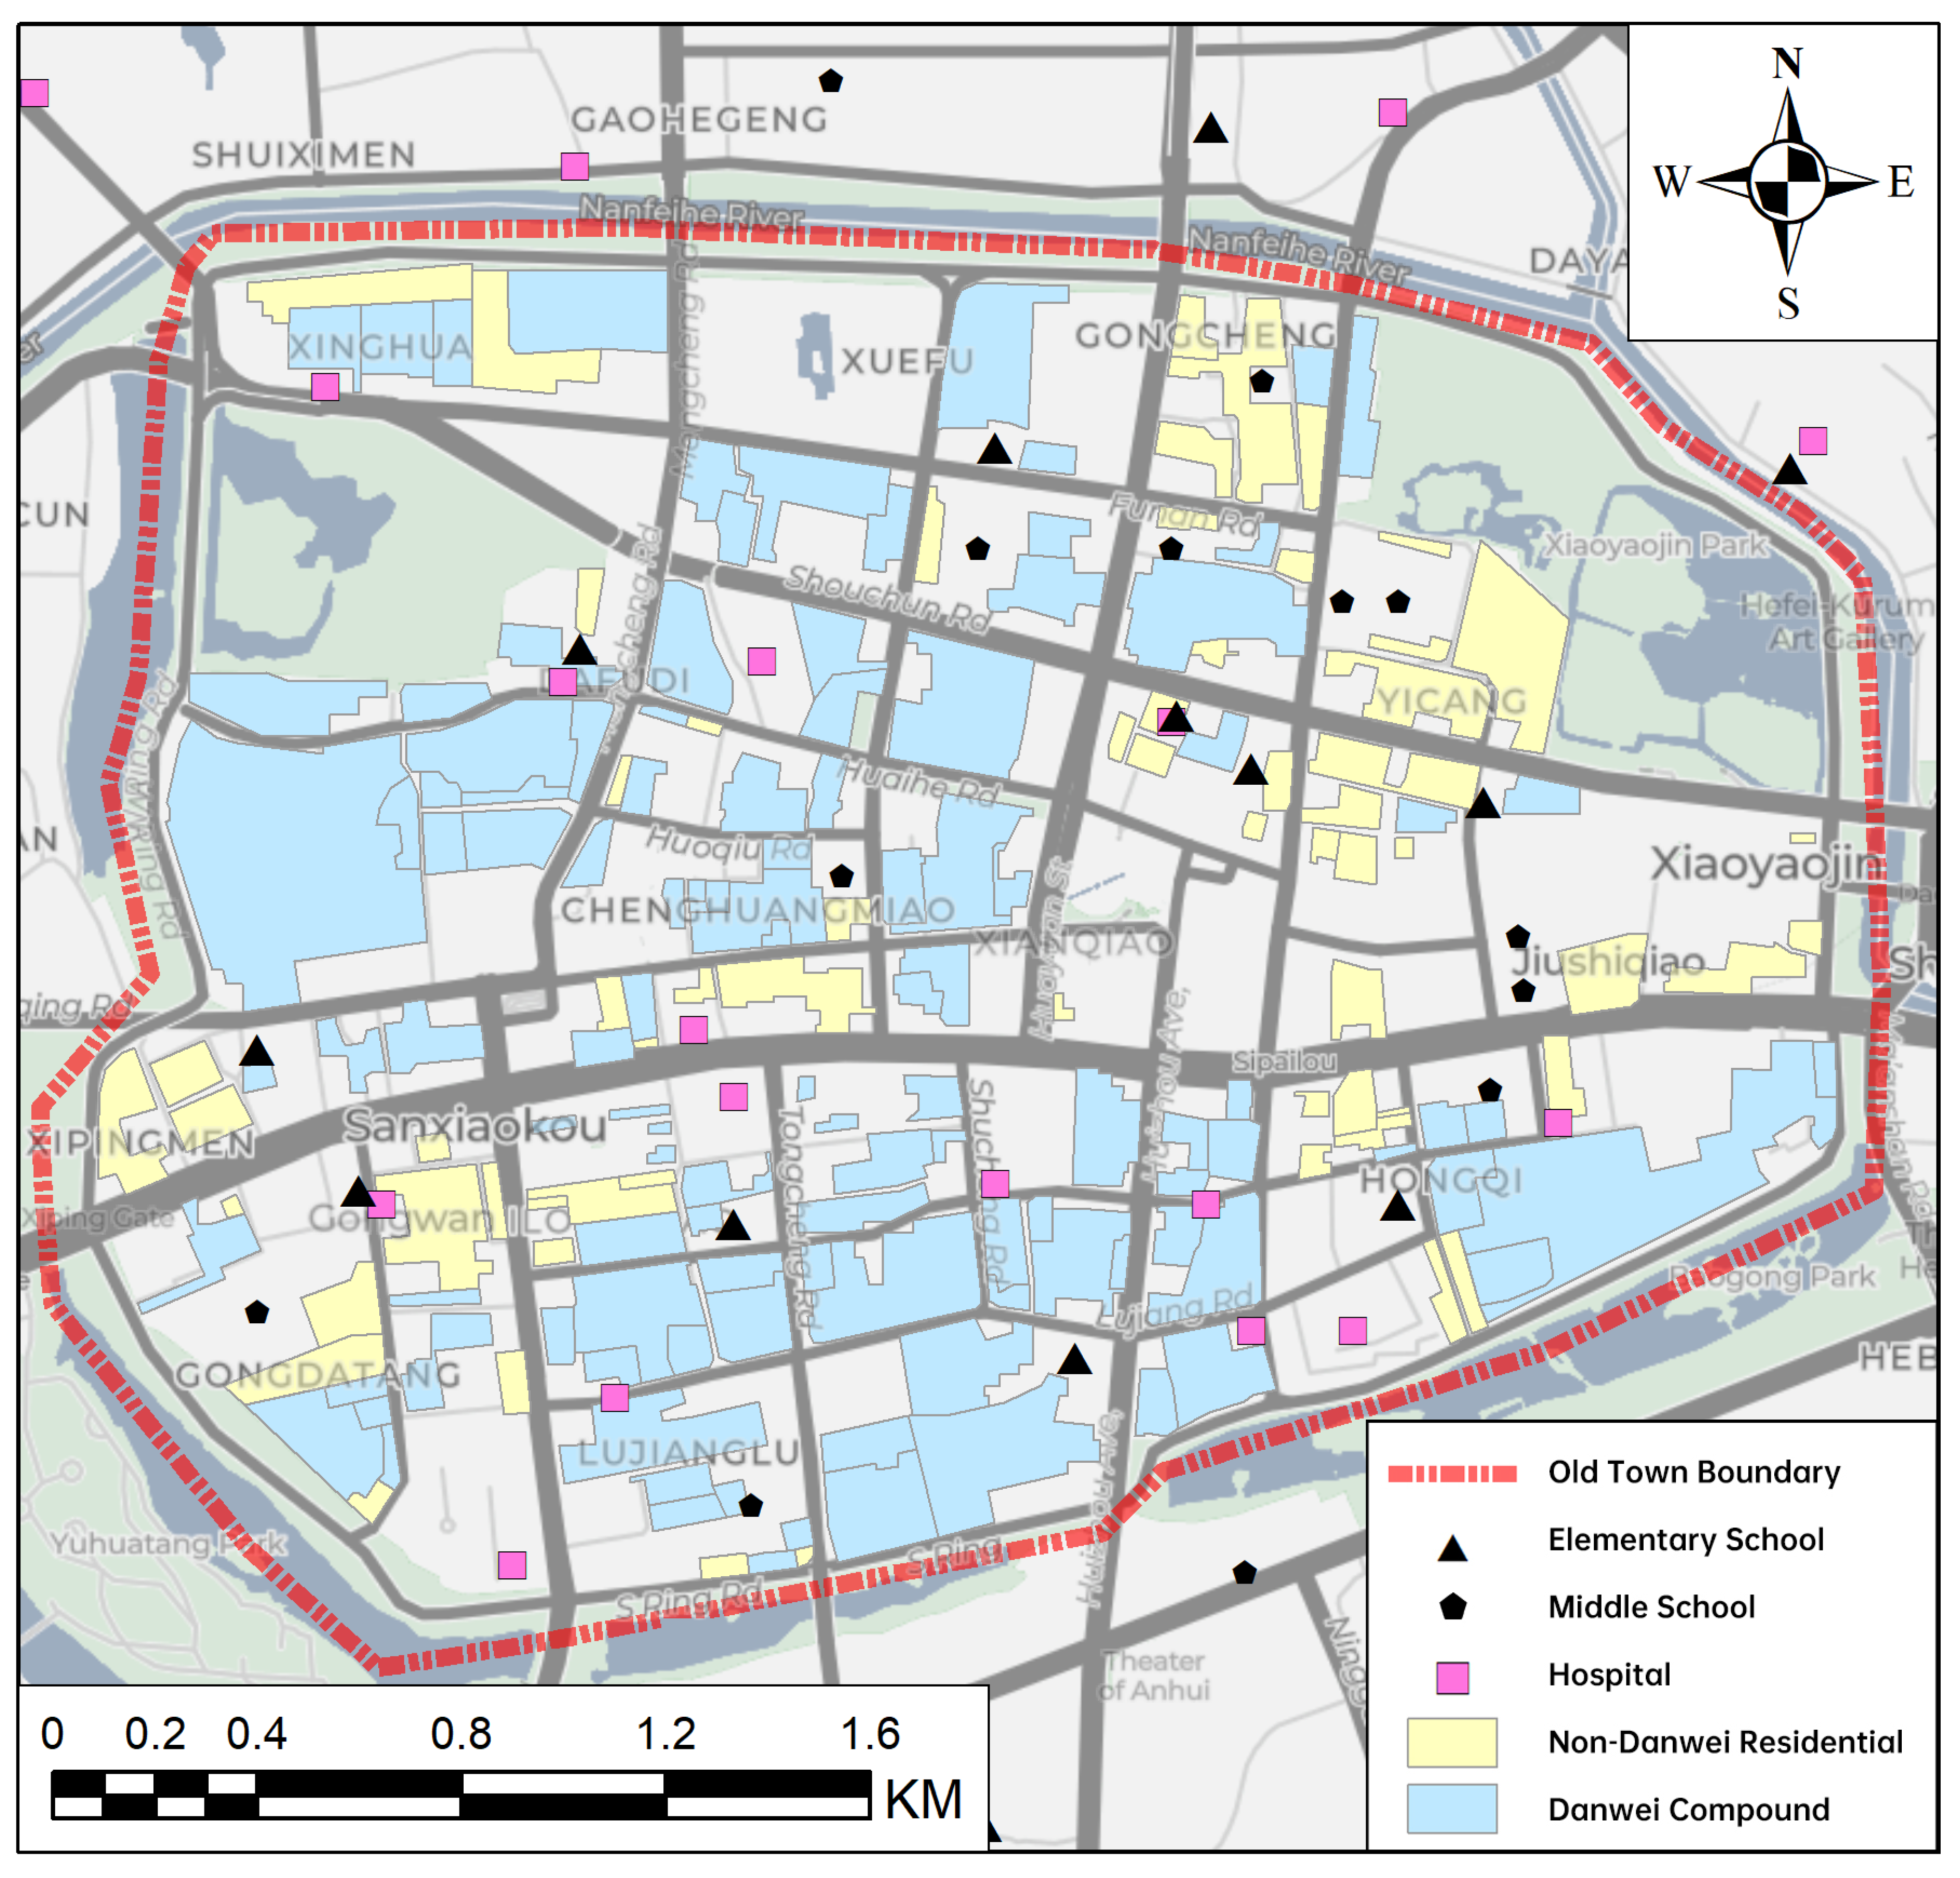
Although Hefei city has a long history, there were few historical remnants due to various destructive factors such as wars and economic crises. In recent years, the overall population trend of Hefei City has been increasing rapidly, from 69,000 in 1949 to 7.96 million in 2017. The existing old town of Hefei was built during the Southern Song Dynasty (1127–1279 AD), while the city of Hefei underwent several expansions to counter the invasions of the nomadic peoples (e.g., the Khitan, the Jurchen and the Mongols) from the north. The old town of Hefei was a typical ancient Chinese city surrounded by a city wall and a moat (the wall was demolished in 1951 and converted into a ring road and park, the moat remains to this day) with an orthogonal urban road network. In the early years of the PRC, the construction of Hefei city was concentrated in the old town and surrounding areas. The Hefei old town is located within the Huancheng Park, which was built above the remains of the old city walls, and covers an area of 5.9 square kilometres (
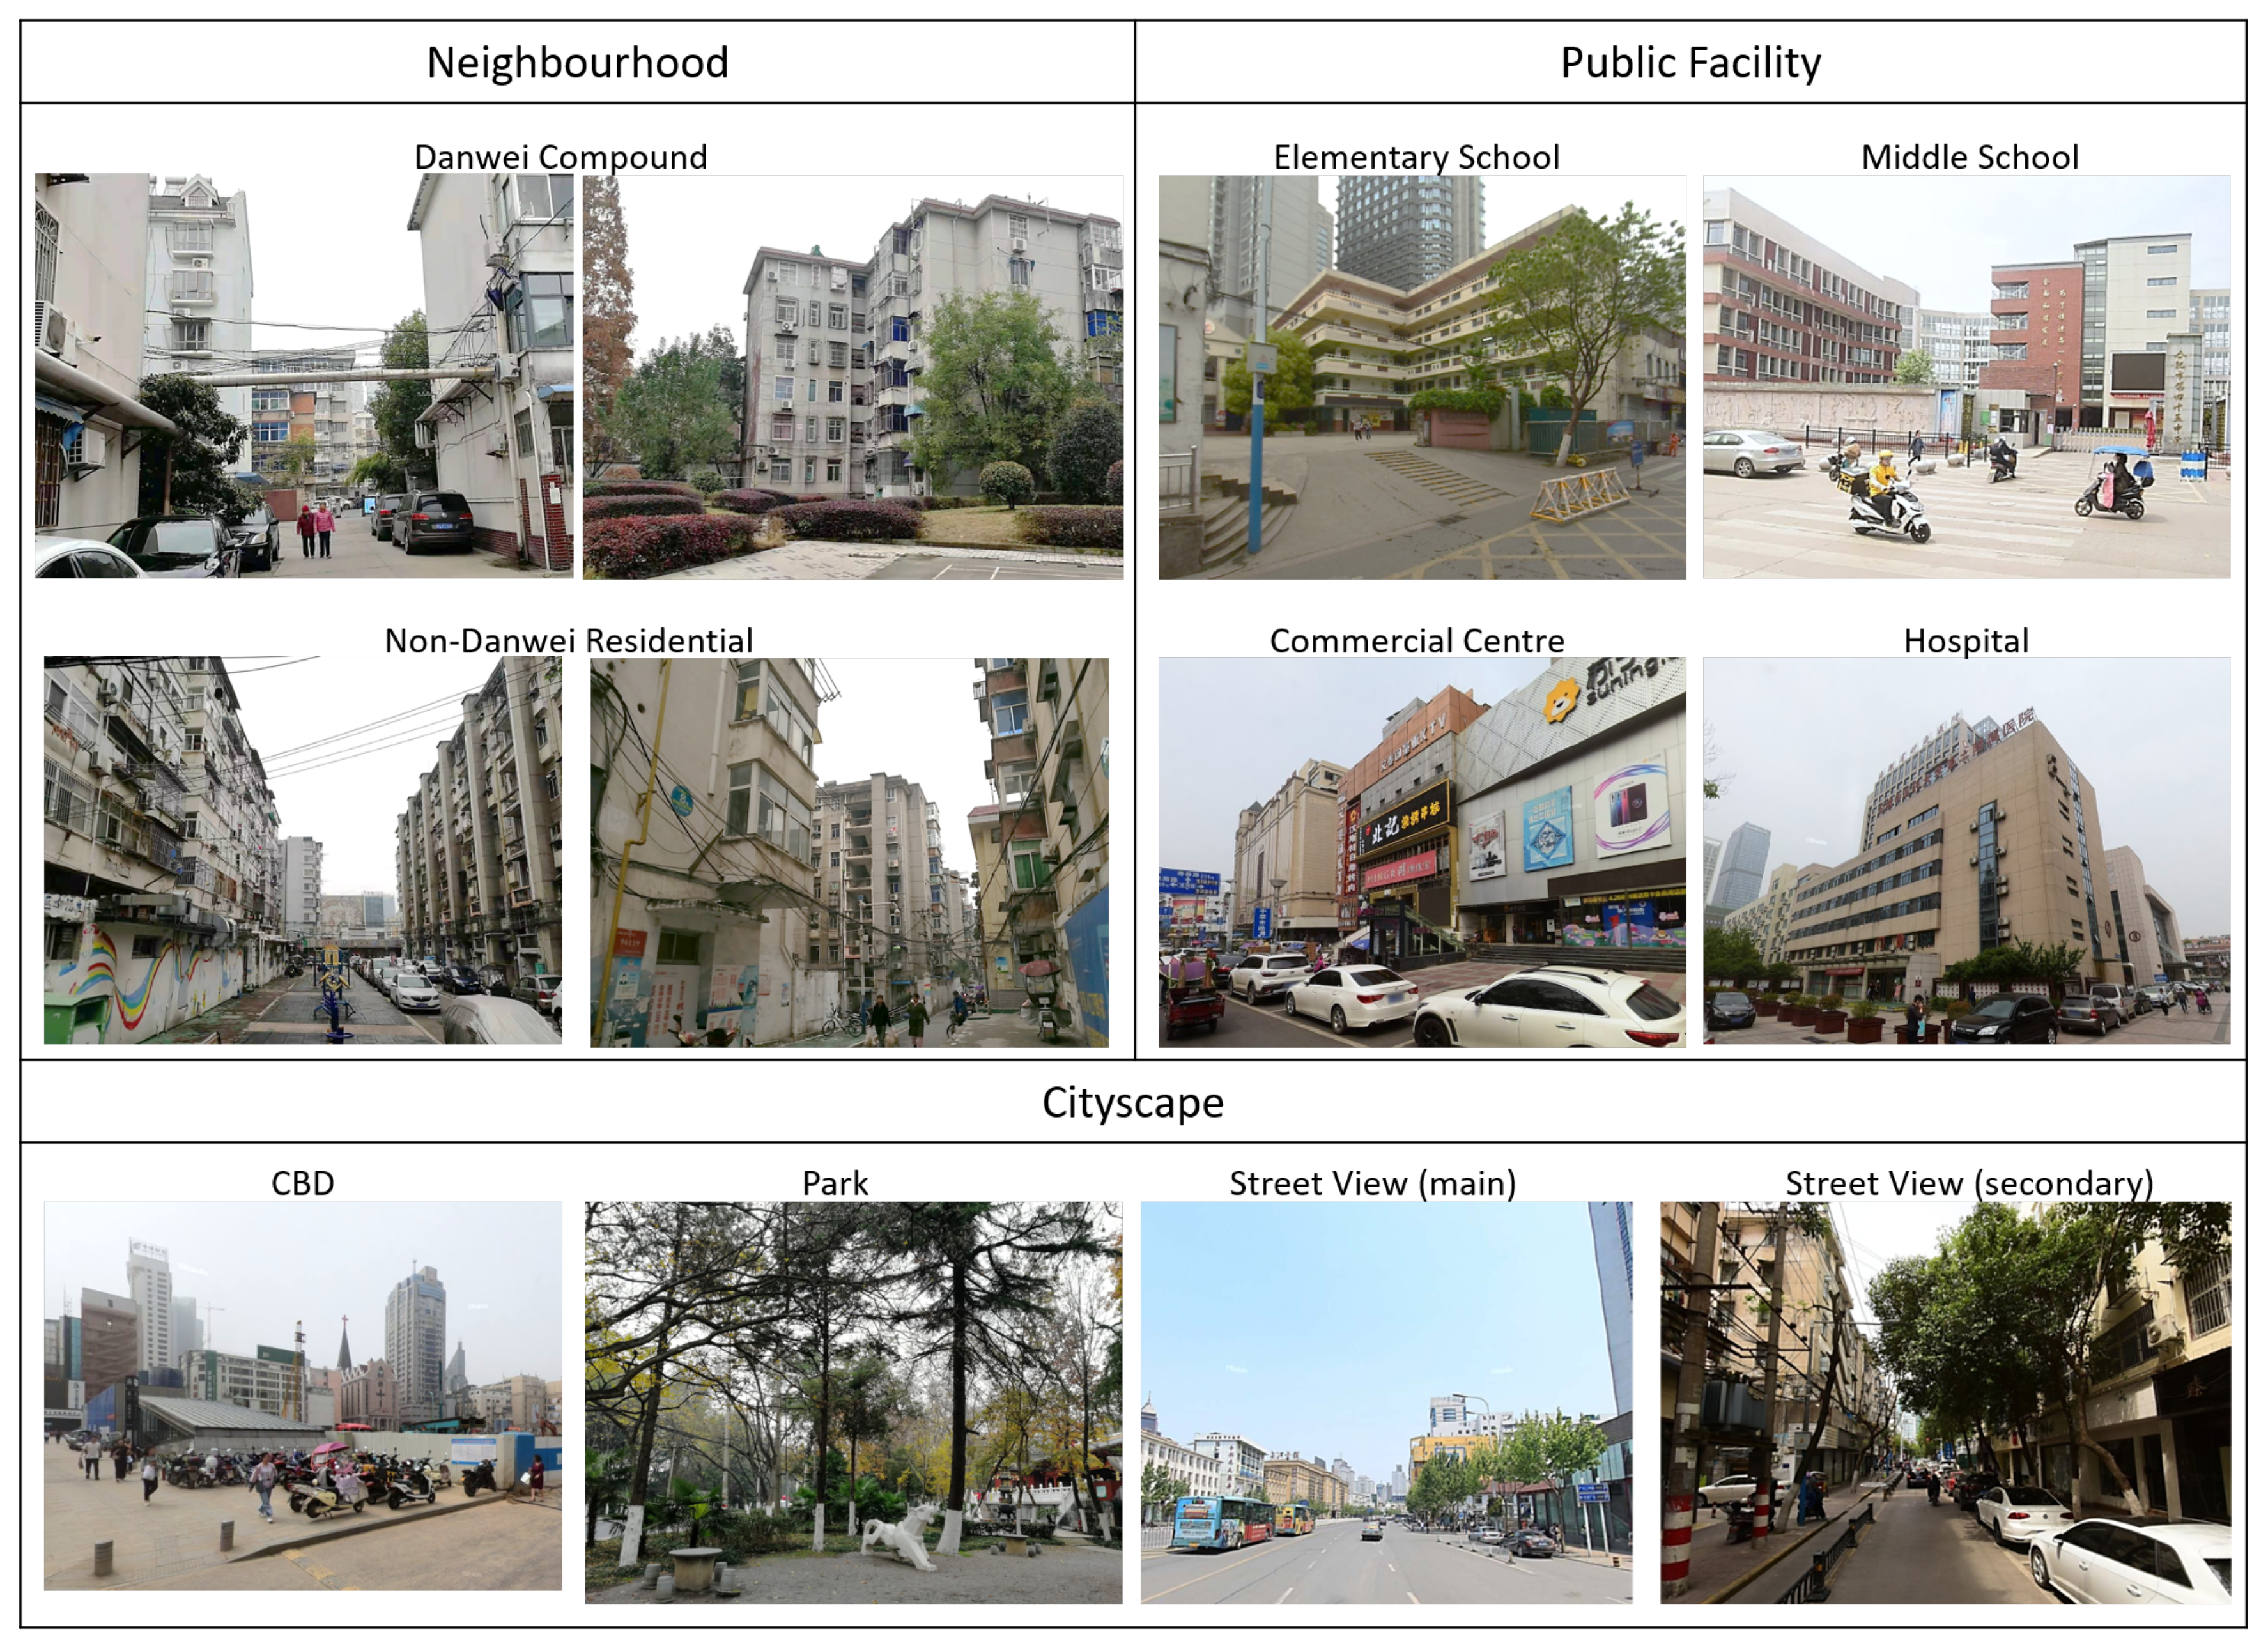
Figure 3). It had been the core of the city’s mono-nuclear structure. The old town area mainly contained Danweis with functions such as government and related public agencies, public services and commerce. Industrial production, universities, and other large-scale, resource-intensive or polluting Danweis are mostly arranged outside the old town. Now, the Old Town mainly comprises commercial, public services, residential and office functions. To present a pictorial perception of the study area, Figure 4 provides photographs of the neighbourhoods, public facilities and cityscape of the Hefei old town.
The old town of Hefei was selected as the research target area due to the following reasons: (1) it was severely damaged during the wars, the current city of Hefei was built from scratch after 1949, which means that its urban development process coincides with the development of Danwei system and Danwei compounds. In other words, most of the urban neighbourhood in Hefei old town were Danwei compounds, which makes it a suitable case for the study. (2) Although older with stable boundaries for over 800 years, most developments in the city emerged from the old area the development after 1949.

2.2. Data Collection and Processing

Four kinds of data were collected and processed for this research. First, the current land use map of the old town area of Hefei, which was provided by the Hefei City Planning Bureau. A digital map was processed from this data. Due to the limited amount of information on the map, a field visit was undertaken in the old town area in August 2018 to manually marked all the residential sites by type: Danwei compounds and non-Danwei residential units. The distinction between Danwei compounds and non-Danwei residential sites were identified from the land use map the names of most sites. Typically, the name of a Danwei compound is attached to a public Bureau, company or institution (e.g., Anhui Academy of Medical Science Compound, Hefei City Government Compound) while non-Danwei residential sites are generally identified by their names in addition to the common suffix new village or community (e.g., Guangming New Village/Xiaoyaojing Community) or even no identifiable name. To check for accuracy, local residents residing in those areas were interviewed to confirm the classification.
Second, the road network map of Hefei was collected from the open street map website API. The data was imported into ArcGIS and cleaned to remove irrelevant information. Third, data on commercial centres, schools and hospitals were selected as the referencing facilities. Hefei city commercial distribution data were obtained from a previous study by the first author [24]. The distribution data of schools and hospitals were obtained by Point-of-interest (POI) data from the Amap.com API. POI refers to a specific point location that a person may find in online maps, which often include schools, stores, museums, hotels and so on [25]. In this study, only the POI data of schools and hospitals were used. For schools, elementary schools and middle schools were selected and processed separately. All the position data of public facilities was imported into ArcGIS. The fourth data type was building information data. The Amap.com provides building data of each building with its location, outline and floor numbers. It therefore allows for the estimation of each building’s foot area and floor area in ArcGIS.
Finally, to ensure the accuracy of the analysis and also meet the local authority’s confidentiality restrictions on the use original maps received from the public entities, maps were redrawn and all data marked using the coordinate system provided by the open street map as the reference frame.

2.3. Data Analysis

2.3.1. Pedestrian Shed: Accessibility to Public Facilities

For the purpose of this study, the concept of Pedestrian Shed, also known as “5 min walk”, is used in this research to measure the accessibility to public facilities. It is the distance people are willing to walk before opting to drive. In recent years, it has become a commonly used method for accessibility analysis in urban road network analysis. Based on the average walking speed, a “5 min walk” is represented by a radius measuring 1/4 of a mile or about 400 m [26,27]. It is a benchmark often used in the field of urban research and city design [28,29]. Nonetheless, some studies also adopt a 10/15 min walk (800/1200 m) as the measure radius [30].
For commercial facilities, only the most stringent metric of 5-minute Pedestrian Shed of the city commercial centres is used in this study to evaluate the sites for clarity and better differentiation. The rationale for this is due to the fact that old town of Hefei is the centre of the whole city, with an area of only 5.2 square kilometres, and consequently unsuitable for the 10/15 min benchmark walking [24]. Moreover, Hefei city’s urban retail sector is still underdeveloped, and a considerable part of the small businesses are individual grocery stores of low quality [31]. Therefore, city residents are more likely to go to large commercial centres for their daily shopping if they exist within walking distance. For schools, the elementary and middle schools are used for the pedestrian shed analysis separately. Moreover, all the hospitals are used for the pedestrian shed analysis. The focus on hospitals rather than low tier health facilities is due to the fact that, in China, there are few clinics and the major suppliers of health service are hospitals, even at local neighbourhood scale.
Further, Pedestrian Shed analysis was executed using the grid analysis function of ArcGIS, based on the position data of public facilities. We carried out separate Pedestrian Shed analysis for commercial, schools and hospitals based on the following four assumptions:
  • the “5 min walk” is used as the basic analysis unit for the Pedestrian Shed;
  • the average human walking speed is 80 m/min, which translates into a 5-min walking distance of 400 m;
  • the roads are isotropic; and
  • the accessibility between the public facilities and the roads facing it is extremely high.
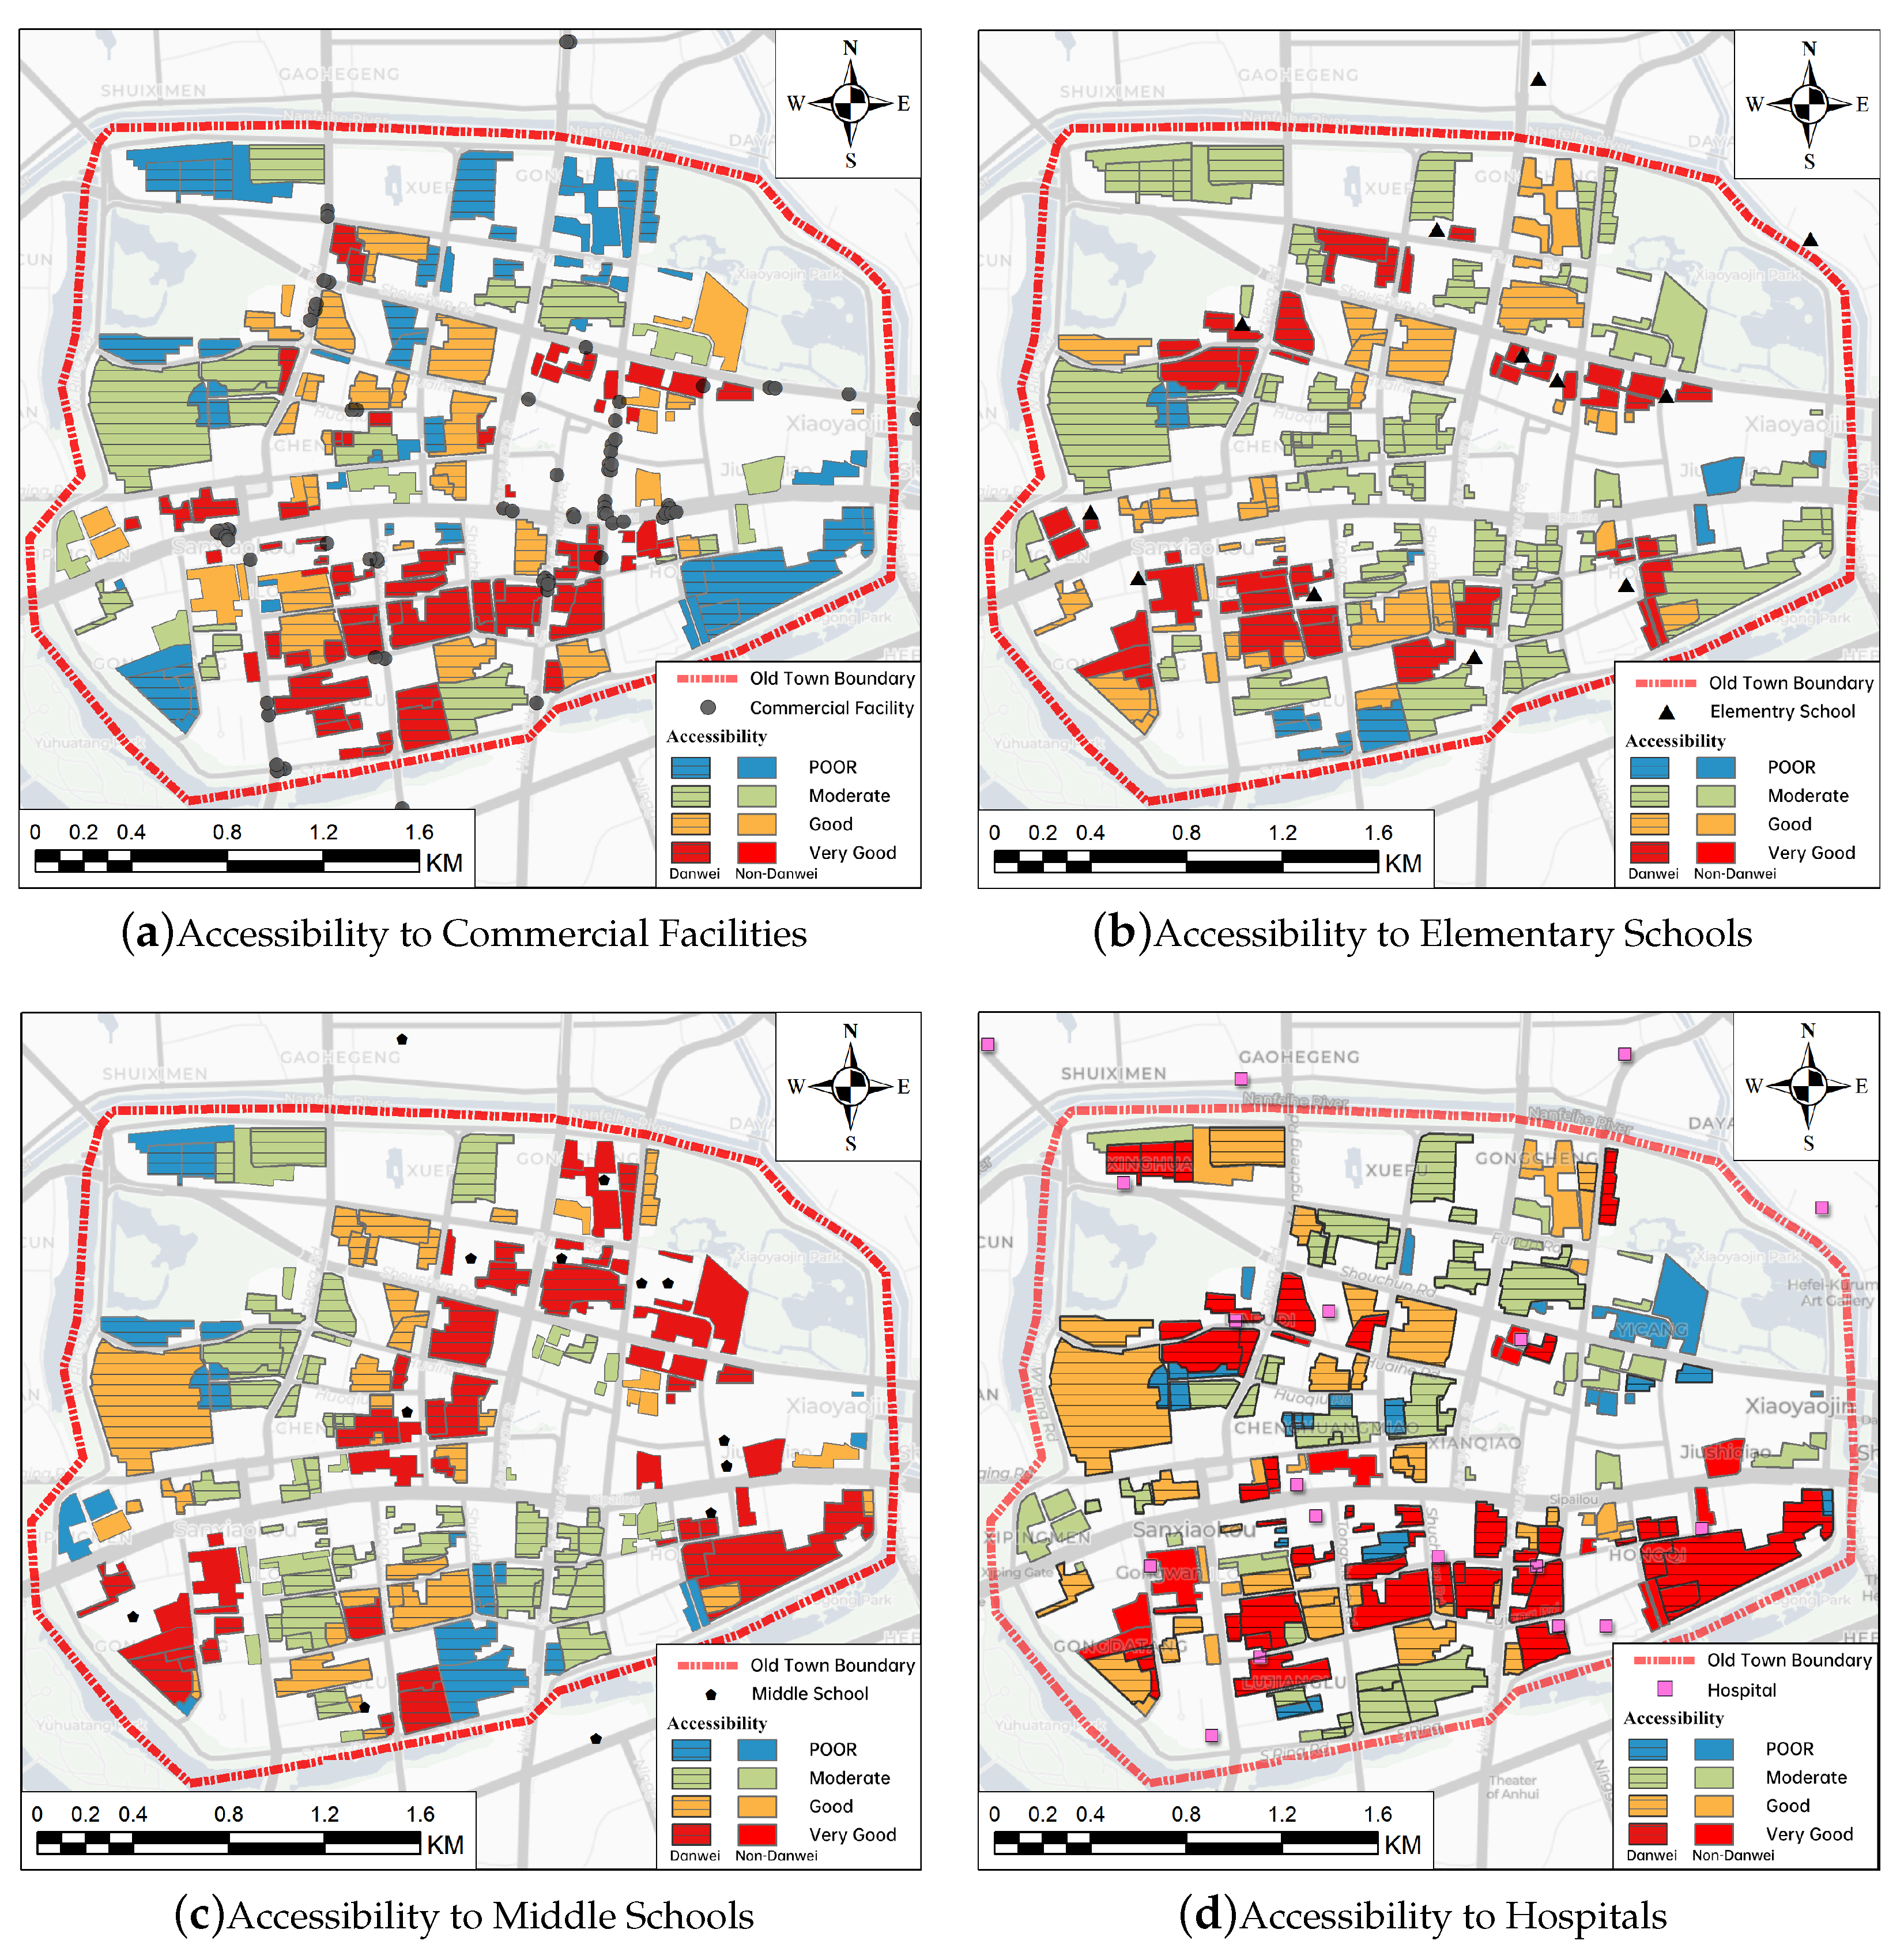
After the Pedestrian Shed analysis, we marked each site with its accessibility to different kinds of public facilities. With reference and modification to the classification criteria of Lotfi et al. [17], the accessibility was measured in four levels of “Very Good, Good, Moderate and Poor”. Because of the different coverage of different kinds of public facilities, these four levels were defined slightly differently for each kind of public facility to make the results clearer and differentiated. For schools and hospitals, the sites with most of their land inside the 5 min Pedestrian Shed will be marked as “Very Good”, sites with most of their land inside the 5–10 min Pedestrian Shed will be marked as “Good”, sites with most of their land inside the 10–15 min Pedestrian Shed will be marked as “Moderate” and sites outside the 15 min Pedestrian Shed will be marked as “Poor”. For commercial facilities, the sites with all of their land inside the 5 min Pedestrian Shed will be marked as ”Very Good”, sites with most of their land inside the 5 min Pedestrian Shed will be marked as “Good”, sites with some of their land inside the 5 min Pedestrian Shed will be marked as “Moderate” and sites outside the 5 min Pedestrian Shed will be marked as “Poor”.

2.3.2. Statistical Analysis

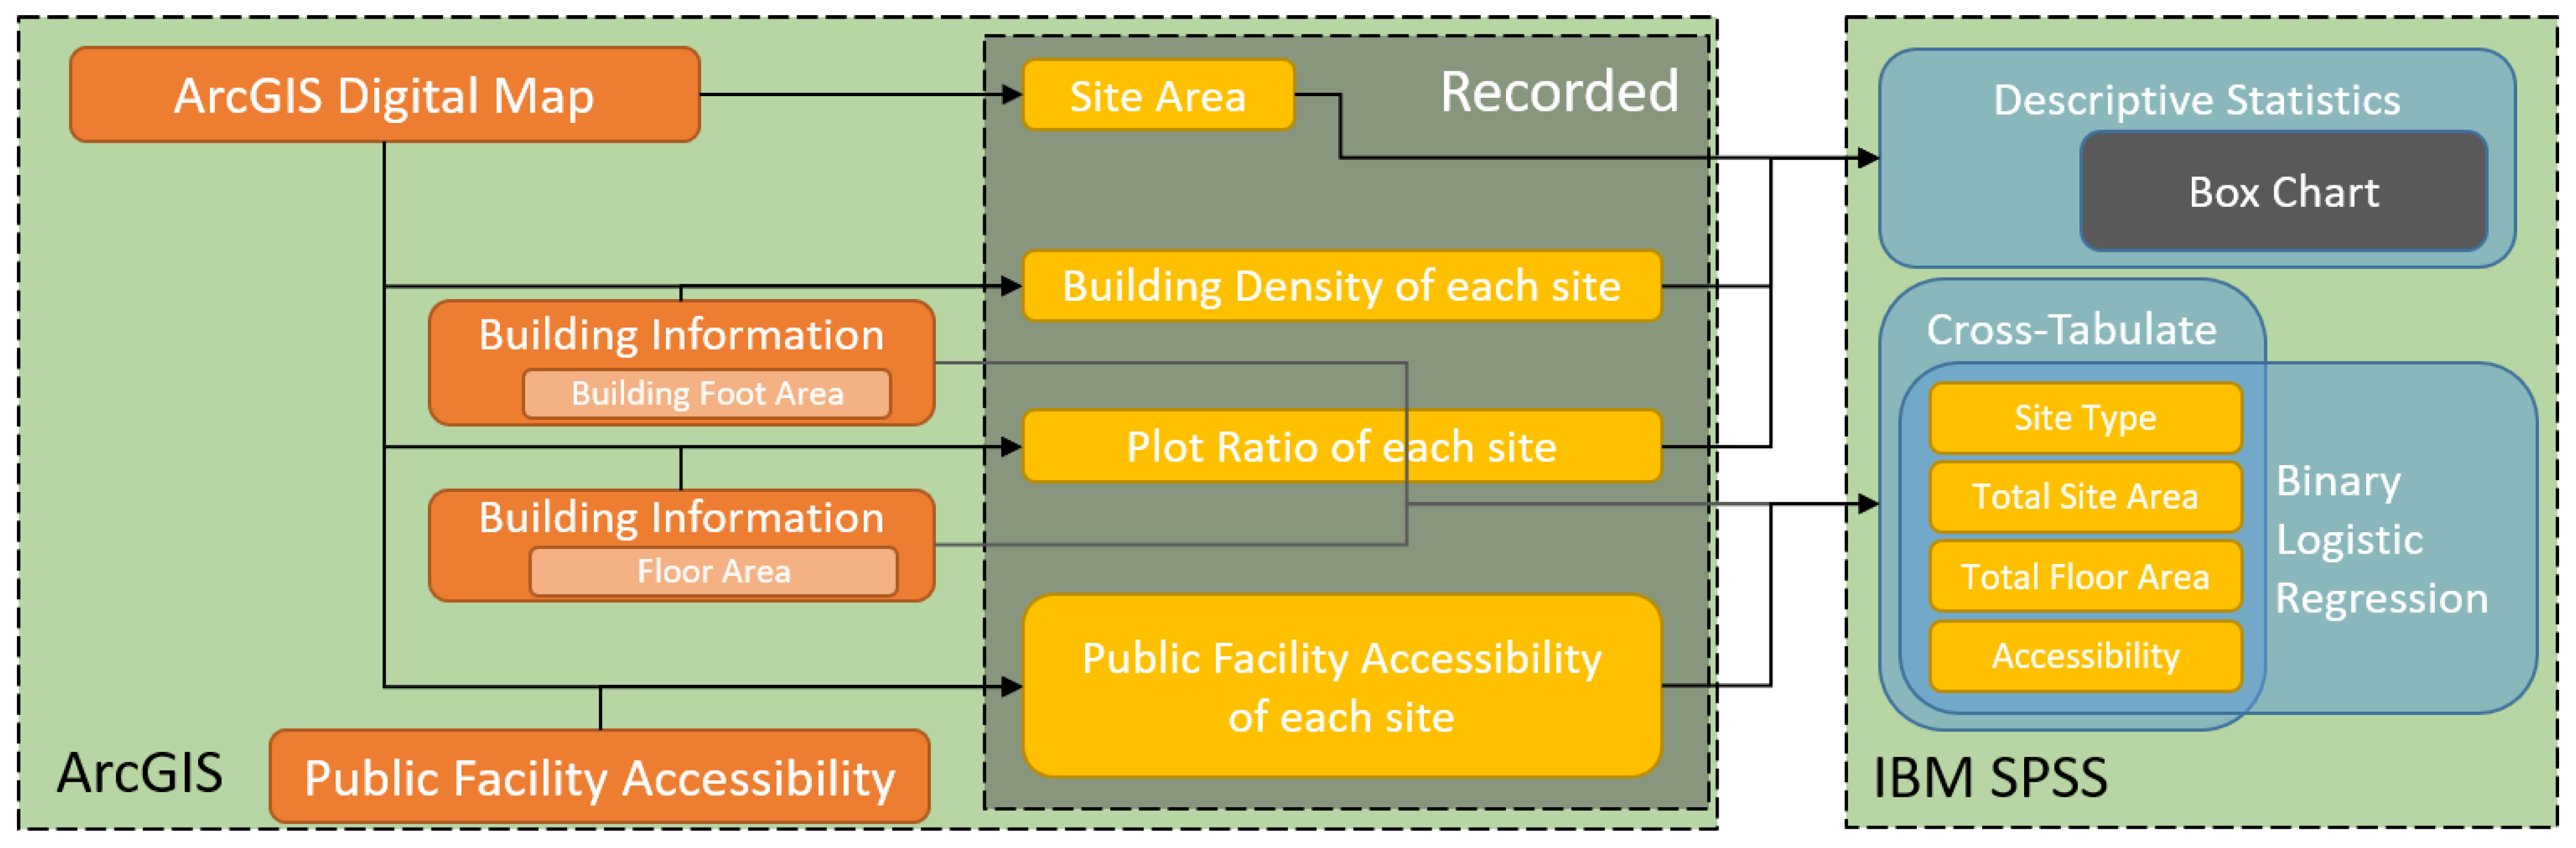
Statistical analysis was undertaken using 6 key steps (Figure 5). First, the area of each site digital map prepared in ArcGIS with its own Calculate Geometry Attributes function. Second, by binding the previously prepared building information data to the sites in the digital map via ArcGIS’ Spatial Join function, the total building foot area and total floor area of each site were obtained to calculate the plot ratio and building density of each. Third, site area, total building foot area, total floor area, plot ratio, building density and accessibility level to different kinds of public facilities were recorded. These data were further analysed in IBM SPSS. Fourth, basic statistical analysis of the site area, plot ratio and building density was recorded in addition to plotting box chart for all sites in IBM SPSS. Fifth, in order to study the similarities and differences between Danwei compounds and non-Danwei residential sites in terms of accessibility to public facilities, we cross-tabulated the type of site and its accessibility to public facilities by total site area, total floor area and count for all sites in IBM SPSS. Finally, a binary logistic regression was implemented in IBM SPSS, with the site type (Danwei compound or non-Danwei residential) as the dependent variable; while site area, plot ratio, building density and accessibility to commercial, hospitals, elementary and middle schools as covariates.

3. Result

3.1. Spatial Distribution of Danwei Compounds and Non-Danwei Residential Sites in the Old Town of Hefei

The distribution map of Danwei compounds and non-Danwei residential was developed in ArcGIS (Figure 6). The land use map shows that the Danwei compounds are still the main land use type in the old town of Hefei. As shown in Figure 6 and Table 1, Danwei compounds are widely distributed over the old town of Hefei, except the northeast corner which functions as the central business district and a city park. Twenty-seven percent of the land in the old town is occupied by Danwei compounds, much higher than the 8.3% of non-Danwei residential units. If the estimated road occupancy of 10–20% is considered, the Danwei compound accounts for more than 30% of the available land in the old town of Hefei. The remaining sites locate public facilities such as parks, hospitals, schools, and commercial areas. It should be noted that all the land in the old town is either public or semi-public.
In order to identify the area value numerical distribution pattern of the sites, site area box chart (Figure 7) was developed and presented with the corresponding specific values (Table 2). Some outliers above the maximum value can be observed for extremely large Danwei compounds. A nonlinear scale on the y-axis is used in Figure 7, due to the presence of two enormous extreme values in the Danwei compound. From Figure 6 and Table 1, it could be observed that Danwei compounds are superior in both quantity and average area over non-Danwei sites. In addition, Figure 7 and Table 2 indicates that individual Danwei compound areas are significantly larger than non-Danwei sites in terms of median, maximum and minimum values. Furthermore, there are two outliers where the Danwei compound with the area size far exceeds that of the other Danwei compounds and non-Danwei sites, at 136,430 m2 and 94,760 m2, respectively.

3.2. Plot Ratio and Building Density

In order to compare the spatial condition inside the two kinds of sites, we calculated the plot ratio and building density of each site. The larger the plot ratio and building density, the more crowded the site is, and the less open space it tends to have (Figure 8 and Figure 9; Table 3). The results indicate that the non-Danwei residential sites tend to have a higher plot ratio and building density than the Danwei Compounds in all dimensions. This suggests that non-Danwei sites are more crowded than Danwei compounds. Due to the state-owned land system in Chinese cities [32], the non-built part of residential areas is overwhelmingly public space. Therefore, the average plot ratios (Danwei compound: 2.065, non-Danwei site: 2.338) and the average building densities around 0.4 (Danwei compound: 0.390, non-Danwei site: 0.411) indicates that each square meter floor area in Danwei compounds shares 0.295 m2 of public land, which is 17.1% more that non-Danwei sites’ 0.2525 m2.

3.3. Accessibility to Public Facilities in Danwei and Non-Danwei Compounds

This section presents the results of the accessibility of Danwei and non-Danwei residential units to commercial centres, hospitals and schools (Figure 10) based on the pedestrian shed as explained in the methodology section. As can be seen from Figure 10, the accessibility to the selected public facilities varies considerably across the city. However, none of the public facilities achieved full service area coverage.
Based on the results of the pedestrian shed analysis above, a cross-tabulation of the area and count of sites for each type and accessibility to public facilities was developed (Table 4). The results show that 50 Danwei compounds (area of 435,400 m2) have a “Very Good” level of access to commercial facilities compared 19 for non-Danwei residential sites (area of 75,220 m2). While 45 Danwei compounds (area of 645,120 m2) have a “Very Good” level of access to hospitals, only 14 such compounds were recorded for non-Danwei residential sites (area of 137,010 m2).
Meanwhile, Danwei compounds’ accessibility to elementary and middle schools was mainly concentrated in the “Moderate” level, with 53 and 46 sites respectively, while non-Danwei sites were more evenly distributed at all levels.

3.4. Binary Logistic Regression: Which Spatial Features Distinguish Danwei Compounds from Non-Danwei Sites?

Acting as a synopsis of this study, a binary logistic regression was used to bring all the spatial features studied above together to comprehend the main difference between Danwei compound and other residential sites in terms of spatial features.
The binary logistic regression model has a Cox & Snell r2 of 0.0119 and the Nagelkerke r2 of 0.164, demonstrating a good fitting effect. The confusion matrix is shown in Table 5. The model shows a good precision in the prediction of Danwei compounds (87.0%). For non-Danwei residential sites, the precision is not satisfactory (34.9%). Overall, the model has an accuracy of 68.5%, which is sufficient as a reference for the analysis.
Therefore, the correlation and significance between the corresponding spatial features and compound types can be determined by reading the “B” and “Sig.” columns in Table 6. Collectively, Danwei compounds and non-Danwei sites differ significantly in the spatial features of accessibility to commercial facilities, accessibility to elementary schools and accessibility to hospitals. Danwei compounds have higher accessibility to commercial facilities and hospitals, whereas non-Danwei sites have higher accessibility to elementary schools. It should be noted that, due to the small sample size, the results of this regression analysis are only statistical conclusion about the old town but not entire city area of Hefei.

4. Discussion

4.1. Danwei Compounds Dominate in the Spatial Organisation of the Hefei Old Town

The spatial distribution of the residential units shows that Danwei compounds dominate the old city of Hefei’s built environment. While the major reforms in the urban land and housing sector, coupled with market led urban development [33] have indeed led to a boom in the private estate [34,35] and social housing [36] residential units, this situation has not diminished the predominance of old Danwei compounds as some studies assert [3,37,38,39]. This is apparently due to the fact that the Danwei compound, the main spatial unit of the Danwei system, has not declined in tandem with the Danwei system—the socio-political structure [10]. This notwithstanding, Danwei compounds have experienced functional changes from an integrated space for “work, life and housing” [2] into purely residential spaces. Although these changes have emerged as inevitable consequences of earlier reforms, it is suggestive that their existing function as residential space needs particular attention from local government and planning authorities in terms of improvement in spatial conditions and urban functions and preservation. Indeed, evidence from similar cases in other East Asian cities [40] suggests that locally-based spatial improvement strategies that are integrated into urban developments plan with community involvement can enhance the attractiveness old neighbourhoods.

4.2. Public Space in Danwei Compounds Provides the Basis for Community Building

The lower plot ratio and building density of Danwei compounds indicate the existence of more public spaces in comparison with non-Danwei residential sites. Historically, this could be due to the abundant supply of land and space in the early years of Danwei construction and development, where compounds were designed to be more open and less dense [41]. Given the observation that public spaces in Chinese cities are in a gradual decline [42], the case of non-Danwei compounds offers potential for restoring the public realm, community and social interactions in urban China [43]. Thus, these public spaces can play a positive role in the reconstruction of community [44], social capital [45] and reinvigorating a sense of belonging in the community [46]. It is suggestive that these spaces can be used to organise community events, build common facilities to increase social engagement and interaction opportunities for local residents.

4.3. Uneven Distribution of Public Facilities in Hefei Old Town

Among the different spatial features studied, results also show that the main element that significantly distinguishes Danwei compounds from the non-Danwei site is accessibility to commercial centres, elementary school and hospitals, in particular, the poor accessibility to elementary schools from Danwei compounds. The lack of good accessibility to elementary schools has a significant negative impact on an urban community [19]. This has ramifications for the overall quality of the living environment as Bonaiuto et al.’s earlier study asserts that elementary schools in a community have a beneficial effect on the residents’ sense of belonging and vitality [19]. Furthermore, the difference in the accessibility of public facilities between Danwei compounds and non-Danwei sites means that some residents are unable to access some public services within walking distance, which is detrimental to global and local agenda’s of urban sustainability, especially with regards to compact and walkable neighbourhoods [47,48]. This situation requires a response from the local planning authority to improve the coverage of public services and better community planning and design that enhances the pedestrian environment. Clearly, this informs better collaboration with residents and educational, health and commercial service providers in spatial planning.
In spite of the findings above, the study has some limitations that restrict its application and generalisation to the wider context of Danwei in the province or other old Chinese neighbourhoods. First, the paper does not provide comparative historical analysis in line with the spatial distribution of Danwei compounds due to the unavailability of historical maps. Second, a comprehensive characterisation of the development and decline process of Danwei compound and Danwei system was not considered. Third, an improved evaluation of the spatial location of a residential site might consider the accessibility of various public services, including public transport and other facilities which could not be undertaken due to time and resource constraints. These limitations coupled with the findings, therefore provide entry points for future studies such as the comparison of Danwei compounds in the same urban area across different historical periods.

5. Conclusions

This paper has analysed the spatial distribution of Danwei compounds in the old town of Hefei, Anhui, China. As urbanisation, urban reforms and market led development has contributed to the reshaping of Chinese cities and urban areas, the intellectual scholarly literature has followed up with critical analysis of socio-spatial transformation and underlying political and economic processes and structures [10,11,
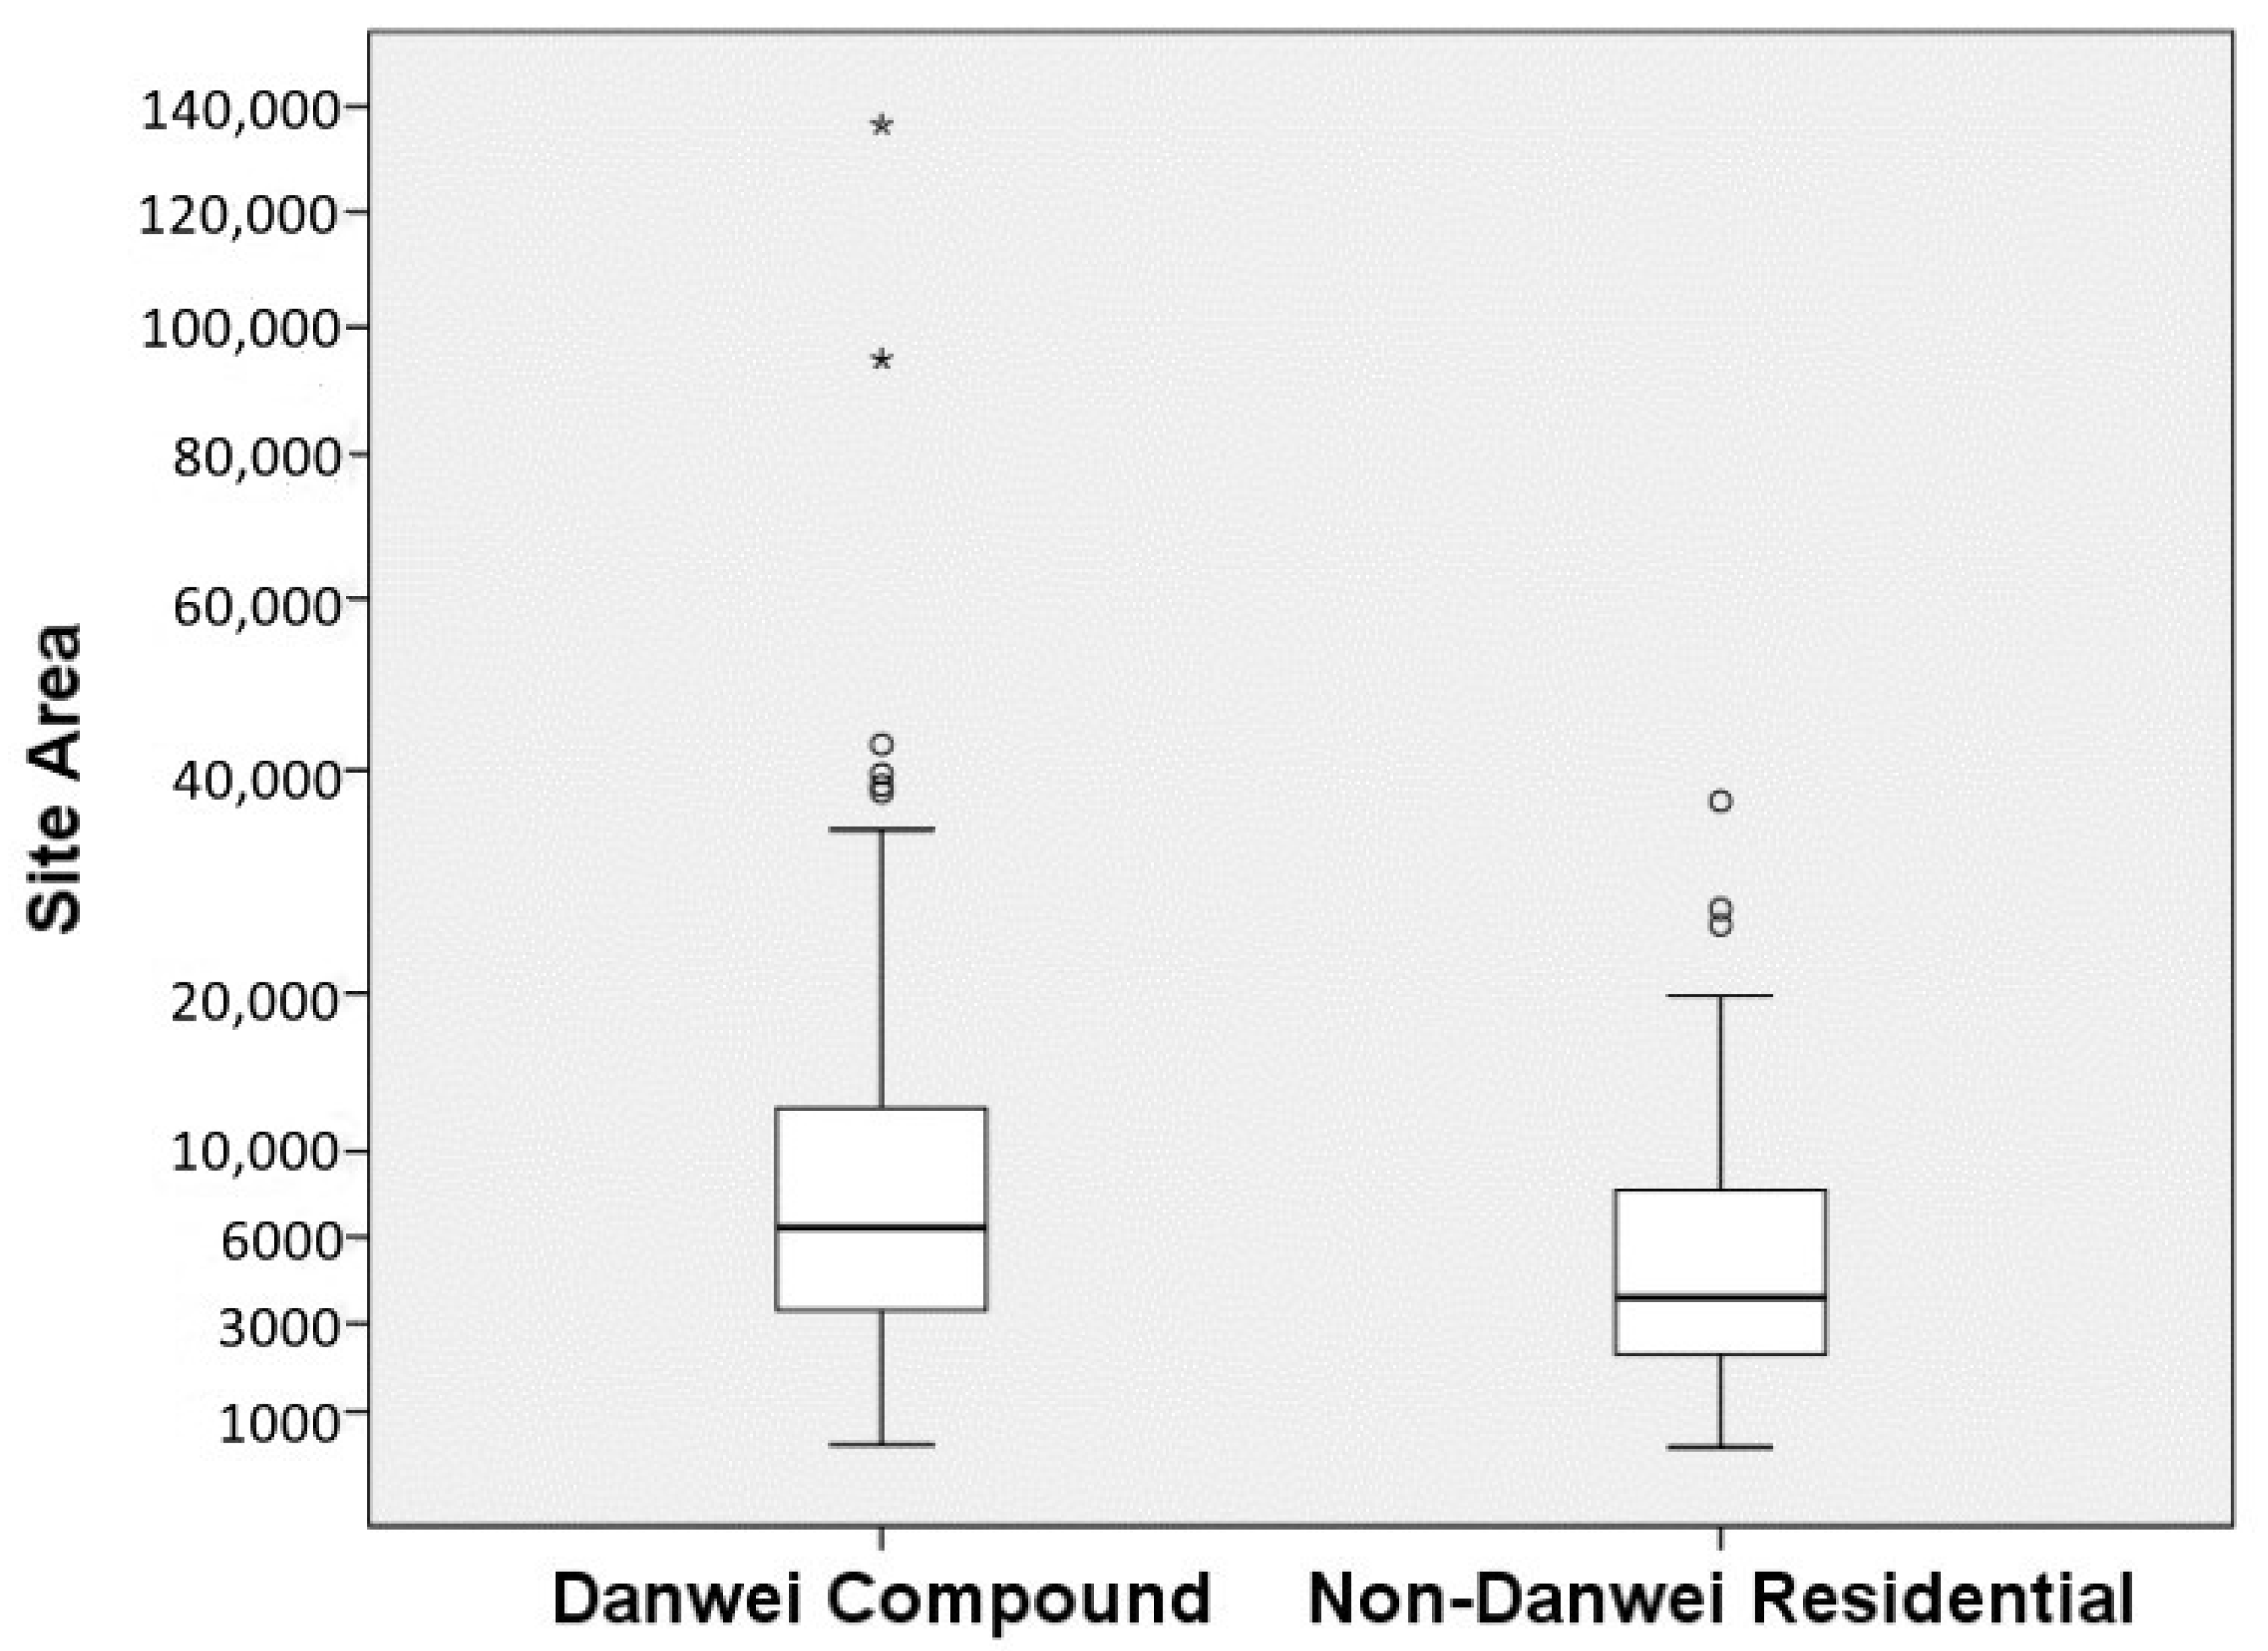
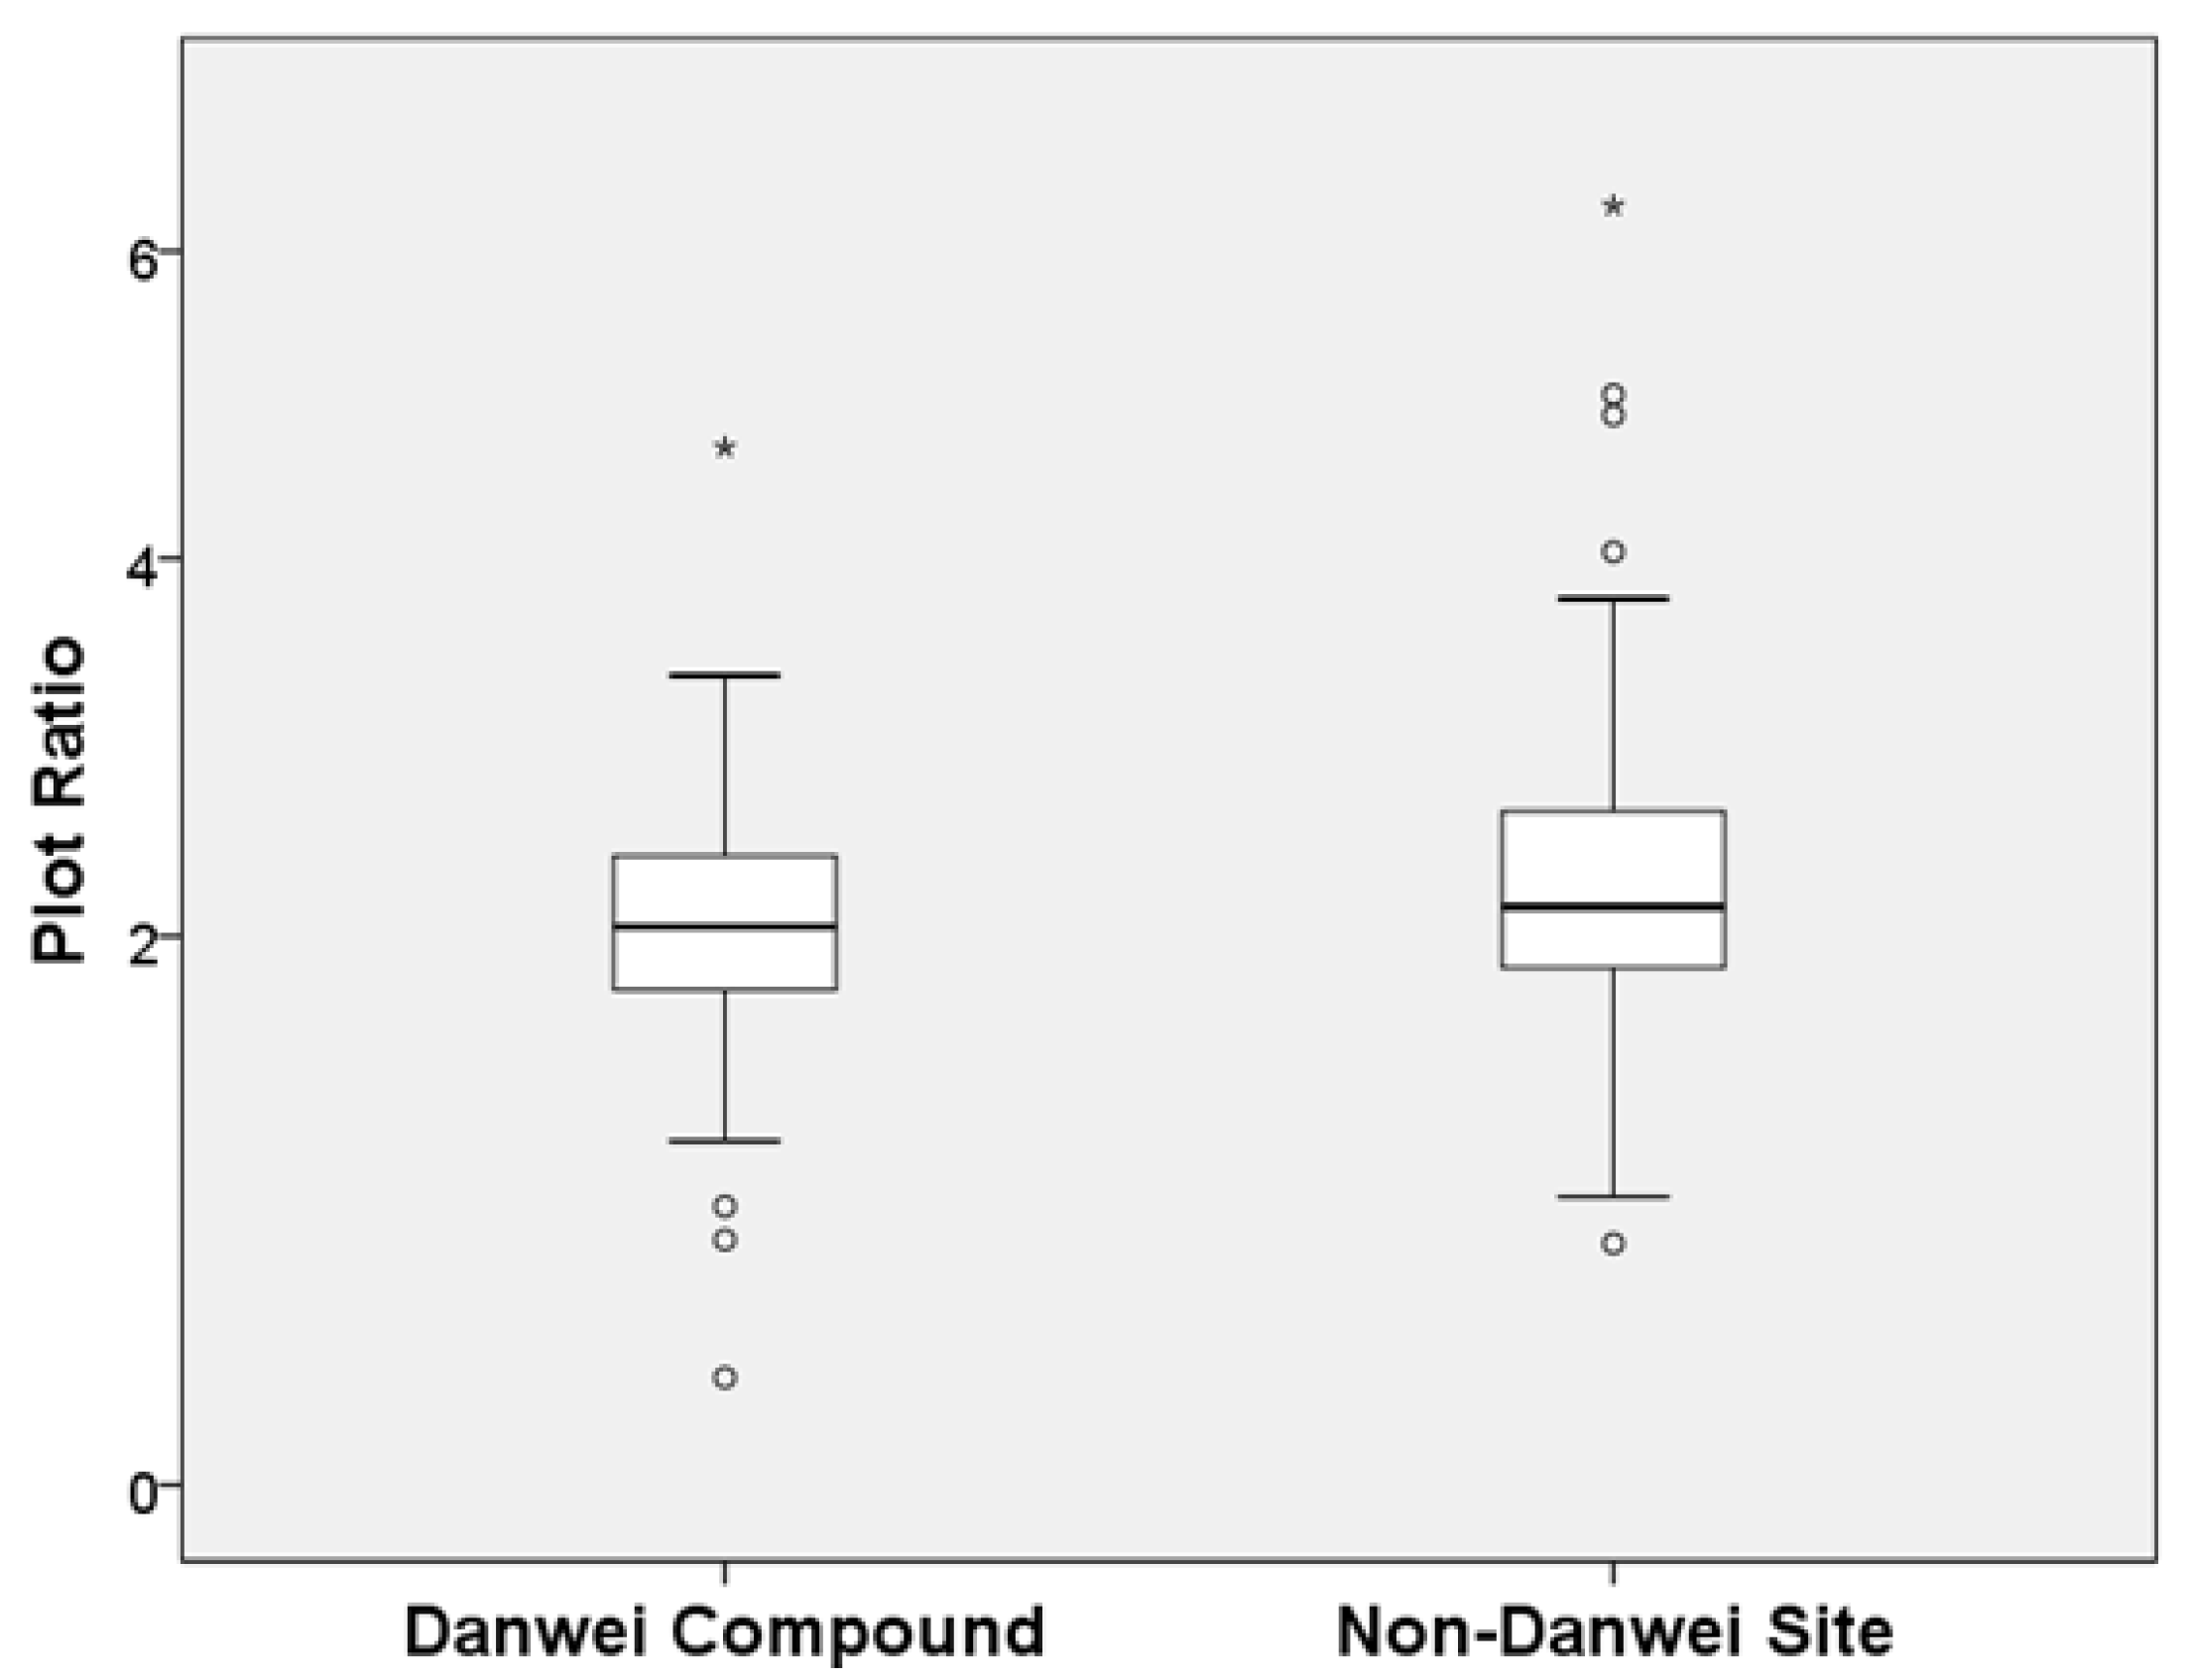
12]. However, old city neighbourhoods, such as Danwei compounds, that have been left behind in these urban socio-spatial transformations have not received equal attention, at least in the international scholarly discourse. This study aimed to bring to the fore the case of old Danwei compounds that emerged during the socialist construction period, following the formation of modern China. Through a spatial distribution analysis that compares old Danwei compounds with other residential units, the study has provided evidence of the persistence of Danwei compounds as the major urban residential units in the old town area with relatively lower density. In terms of accessibility to public facilities, this study has shown that Danwei compounds have relatively better access to commercial facilities and hospitals but poor access to elementary schools.
Overall, the study contributes to existing research on Danwei and, more generally, historical urban neighbourhoods in China by providing the current spatial distribution of Danwei compounds and exploring differences with non-Danwei residential sites. In particular, the existence of public spaces, which has become rare at the community level in old neighbourhoods, could potentially play a role in community building. In view of China’s urban development and urbanisation process, it provides pathways for local government and planning authorities to pay attention to old neighbourhood units that seem to lie secondary to the current massive redevelopment efforts at the city level. Thus, better strategies to propel such areas attractiveness and liveability is critical to their overall urban quality and improvement.

Author Contributions

Conceptualization, N.Y., M.K., S.M., M.S. and S.A.O.; methodology, N.Y., M.K. and M.S.; software, N.Y.; validation, N.Y., M.K., S.M., M.S. and S.A.O.; formal analysis, N.Y.; investigation, N.Y.; resources, N.Y., and S.M.; data curation, N.Y.; writing—original draft preparation, N.Y. and S.A.O.; writing–review and editing, N.Y., S.A.O. and M.K.; visualization, N.Y., S.M. and M.S.; supervision, N.Y., S.A.O. and M.K.; project administration, N.Y.; funding acquisition, M.K. All authors have read and agreed to the published version of the manuscript.

Funding

This research received no external funding.

Institutional Review Board Statement

Not applicable.

Informed Consent Statement

Not applicable.

Data Availability Statement

Not applicable.

Conflicts of Interest

The authors declare no conflict of interest.

Abbreviations

The following abbreviations are used in this manuscript:
PRCPeople’s Republic of China
CNYChina Yuan (Currency of Mainland China)

References

  1. Cotterrell, R. A Legal Concept of Community. Can. J. Law Soc. 1997, 12, 75–91. [Google Scholar] [CrossRef]
  2. Tian, Y. Changes in the “Danwei Community“ and Urban Community Renewal, 1st ed.; National Achievements Library of Philosophy and Social Sciences, Central Compilation & Translation Press: Beijing, China, 2014. (In Chinese) [Google Scholar]
  3. Chai, Y.; Chen, L.; Zhang, C. Danwei System Changing: An Important Perspective on China’s Urban Transformation. World Reg. Studies 2007, 16, 60–69. (In Chinese) [Google Scholar] [CrossRef]
  4. Wang, L. The Urban Form Transformation Mode of the Unit Community and Their Impact to the Urban Space. Master’s Thesis, Dalian University of Technology, Dalian, China, 2010. (In Chinese). [Google Scholar]
  5. Li, C. Danwei Compound and Urban Physical Spatial Form of Nanchang, China. Ph.D. Thesis, Southeast University (China), Nanchang, China, 2016. (In Chinese). [Google Scholar]
  6. Chai, Y. From socialist danwei to new danwei: A daily-life-based framework for sustainable development in urban China. Asian Geogr. 2014, 31, 183–190. [Google Scholar] [CrossRef]
  7. Zhang, K.H.; Song, S. Rural–urban migration and urbanization in China: Evidence from time-series and cross-section analyses. China Econ. Rev. 2003, 14, 386–400. [Google Scholar] [CrossRef]
  8. Zhang, F. Research on the Evolution, Problem and Countermeasure of the Unit Compound in Transformation Period —Typical Cases in Beijing. Master’s Thesis, Southeast University, Nanchang, China, 2004. (In Chinese). [Google Scholar]
  9. Qiao, Y. History Flux of Beijing Unit Yard and Its Effect on Beijing Urban Space. Huazhong Archit. 2004, 22, 91–95. (In Chinese) [Google Scholar]
  10. Lü, X.; Perry, E.J. Danwei: The Changing Chinese Workplace in Historical and Comparative Perspective; Socialism and Social Movements, M. E. Sharpe: Armonk, NY, USA; London, UK, 1997. [Google Scholar]
  11. Bray, D. Social Space and Governance in Urban China: The Danwei System from Origins to Reform; Stanford University Press: Stanford, CA, USA, 2005. [Google Scholar]
  12. Bian, M.L. The Making of the State Enterprise System in Modern China: The Dynamics of Institutional Change; Harvard University Press: Cambridge, MA, USA; London, UK, 2005. [Google Scholar]
  13. Peiling, Z. A socio-economic-cultural exploration on open space form and everyday activities in Danwei: A case study of Jingmian compound, Beijing. Urban Des. Int. 2014, 19, 22–37. [Google Scholar] [CrossRef]
  14. Dang, Y.; Liu, Z.; Zhang, W. Land-based interests and the spatial distribution of affordable housing development: The case of Beijing, China. Habitat Int. 2014, 44, 137–145. [Google Scholar] [CrossRef]
  15. Quinn, J.W.; Mooney, S.J.; Sheehan, D.M.; Teitler, J.O.; Neckerman, K.M.; Kaufman, T.K.; Lovasi, G.S.; Bader, M.D.M.; Rundle, A.G. Neighborhood Physical Disorder in New York City. J. Maps 2016, 12, 53–60. [Google Scholar] [CrossRef] [Green Version]
  16. Kelobonye, K.; Zhou, H.; McCarney, G.; Xia, J. Measuring the accessibility and spatial equity of urban services under competition using the cumulative opportunities measure. J. Transp. Geogr. 2020, 85, 102706. [Google Scholar] [CrossRef]
  17. Lotfi, S.; Koohsari, M.J. Measuring objective accessibility to neighborhood facilities in the city (A case study: Zone 6 in Tehran, Iran). Cities 2009, 26, 133–140. [Google Scholar] [CrossRef]
  18. Oh, K.; Jeong, S. Assessing the spatial distribution of urban parks using GIS. Landsc. Urban Plan. 2007, 82, 25–32. [Google Scholar] [CrossRef]
  19. Bonaiuto, M.; Fornara, F.; Bonnes, M. Indexes of perceived residential environment quality and neighbourhood attachment in urban environments: A confirmation study on the city of Rome. Urban environmental quality and human wellbeing. Landsc. Urban Plan. 2003, 65, 41–52. [Google Scholar] [CrossRef]
  20. Hefei Planning Bureau. Hefei Urban Planning Record; HuangShan Books: Huangshan, China, 2013.
  21. Hefei City Statistics Bureau. Hefei City 2019 National Economic and Social Development Statistics Bulletin; Hefei City Statistics Bureau: Hefei, China, 2020.
  22. Hefei Local Gazetteers Compilation Committee. Local Gazetteers of Hefei; Anhui Sheng di Fang zhi Cong Shu, Anhui Peoples Publishing House: Hefei, China, 1999. [Google Scholar]
  23. Baidu.com. Baidu Streetview. Available online: http://lbsyun.baidu.com/index.php?title=jspopular (accessed on 10 December 2020).
  24. Ye, N.; Wang, B.; Kita, M.; Xie, M.; Cai, W. Urban Commerce Distribution Analysis Based on Street View and Deep Learning. IEEE Access 2019, 7, 162841–162849. [Google Scholar] [CrossRef]
  25. Ren, X.; Song, M.; E, H.; Song, J. Context-aware probabilistic matrix factorization modeling for point-of-interest recommendation. Neurocomputing 2017, 241, 38–55. [Google Scholar] [CrossRef]
  26. City of Ventura Government. 24M300-Definitions-Pedestrian Shed; City of Ventura Government: Ventura, CA, USA, 2016. Available online: https://www.cityofventura.ca.gov/DocumentCenter/View/1640/24m300 (accessed on 15 September 2016).
  27. Morphocode. The 5-Minute Walk; Morphocode. Available online: https://morphocode.com/the-5-minute-walk/ (accessed on 8 November 2018).
  28. Mehaffy, M.; Porta, S.; Rofe, Y.; Salingaros, N. Urban nuclei and the geometry of streets: The ‘emergent neighborhoods’ model. Urban Des. Int. 2010, 15, 22–46. [Google Scholar] [CrossRef]
  29. Vale, D.S. Transit-oriented development, integration of land use and transport, and pedestrian accessibility: Combining node-place model with pedestrian shed ratio to evaluate and classify station areas in Lisbon. J. Transp. Geogr. 2015, 45, 70–80. [Google Scholar] [CrossRef]
  30. Zhou, Z.; Xu, Z. Detecting the pedestrian shed and walking route environment of urban parks with open-source data: A case study in Nanjing, China. Int. J. Environ. Res. Public Health 2020, 17, 4826. [Google Scholar] [CrossRef] [PubMed]
  31. Mao, Z.; Lin, Y. International Comparison of Retail Development and Policy Orientation of Retail Development in China. J. Pla Nanjing Inst. Politics 2017, 5, 50–56. (In Chinese) [Google Scholar]
  32. Huang, D.; Huang, Y.; Zhao, X.; Liu, Z. How Do Differences in Land Ownership Types in China Affect Land Development? A Case from Beijing. Sustainability 2017, 9, 123. [Google Scholar] [CrossRef] [Green Version]
  33. Yeh, A.G.O.; Yang, F.F.; Wang, J. Economic transition and urban transformation of China: The interplay of the state and the market. Urban Studies 2015, 52, 2822–2848. [Google Scholar] [CrossRef]
  34. Chen, K.; Wen, Y. The Great Housing Boom of China. Am. Econ. J. Macroecon. 2017, 9, 73–114. [Google Scholar] [CrossRef] [Green Version]
  35. Glaeser, E.; Huang, W.; Ma, Y.; Shleifer, A. A Real Estate Boom with Chinese Characteristics. J. Econ. Perspect. 2017, 31, 93–116. [Google Scholar] [CrossRef] [Green Version]
  36. Wang, Y.P.; Murie, A. The New Affordable and Social Housing Provision System in China: Implications for Comparative Housing Studies. Int. J. Hous. Policy 2011, 11, 237–254. [Google Scholar] [CrossRef]
  37. Chai, Y.; Zhang, C. The Introduction to the Research of Danwei in Transitional Urban China. Urban Plan. Int. 2009, 24, 1. (In Chinese) [Google Scholar]
  38. Ta, N.; Chai, Y. The Study on Neighborhood Change of Staff-Living Community: A Perspective of Filtering Theory. Hum. Geogr. 2010, 25, 6–10. (In Chinese) [Google Scholar]
  39. Mao, Z.; Chai, Y. The Evolution and Direction of Community Governance in China’s Danwei Community: A Case Study of Maofangnan Community, Beijing. Urban Studies 2013, 20, 17–22. (In Chinese) [Google Scholar]
  40. Kusakabe, E. Advancing sustainable development at the local level: The case of machizukuri in Japanese cities. Prog. Plan. 2013, 80, 1–65. [Google Scholar] [CrossRef] [Green Version]
  41. Du, C.; Chai, Y.; Zhang, T.; Xiao, Z. The Comparative Study of the Unit Yard and the Housing Estate from the Perspective of the Neighborhood Theory. Urban Dev. Studies 2012, 19, 88–94. (In Chinese) [Google Scholar]
  42. Wang, F. Streets and Lanes. DisP-Plan. Rev. 2017, 53, 45–49. [Google Scholar] [CrossRef] [Green Version]
  43. Tian, Y. The Pain of Urban Social Management in China in Transition—An Analytical Perspective on Social Atomisation. Explor. Free Views 2012. (In Chinese) [Google Scholar] [CrossRef]
  44. Ding, Y. Community building in China: Issues and directions. Soc. Sci. China 2008, 29, 152–159. [Google Scholar] [CrossRef]
  45. Curley, A.M. Neighborhood Institutions, Facilities, and Public Space: A Missing Link for HOPE VI Residents’ Development of Social Capital? Cityscape 2010, 12, 33–63. [Google Scholar] [CrossRef] [Green Version]
  46. Francis, J.; Giles-Corti, B.; Wood, L.; Knuiman, M. Creating sense of community: The role of public space. J. Environ. Psychol. 2012, 32, 401–409. [Google Scholar] [CrossRef]
  47. Gao, Y.; He, Q.; Liu, Y.; Zhang, L.; Wang, H.; Cai, E. Imbalance in Spatial Accessibility to Primary and Secondary Schools in China: Guidance for Education Sustainability. Sustainability 2016, 8, 1236. [Google Scholar] [CrossRef] [Green Version]
  48. UN. The Sustainable Development Goals Report, 2020; UN: Manhattan, NY, USA, 2020. [Google Scholar] [CrossRef]
Figure 1. Study’s workflow.
Urbansci 05 00007 g001
Figure 2. Location of Hefei City and the Old Town.
Urbansci 05 00007 g002
Figure 3. Map of Hefei Old Town (Data Source: Mapbox.com, Amap.com).
Urbansci 05 00007 g003
Figure 4. Photos of Hefei Old Town (Photo Source: By the Author, Baidu Map [23]).
Urbansci 05 00007 g004
Figure 5. Statistical analysis flowchart.
Urbansci 05 00007 g005
Figure 6. Distribution of Danwei compounds and non-Danwei residential in Hefei old town (Data Source: Mapbox.com, Amap.com).
Urbansci 05 00007 g006
Figure 7. The Site Area box chart by Site Type.
Urbansci 05 00007 g007
Figure 8. The plot ratio ratio box chart.
Urbansci 05 00007 g008
Figure 9. The Building Density Box Chart.
Urbansci 05 00007 g009
Figure 10. Accessibility to Public Facilities.
Urbansci 05 00007 g010
Table 1. Quantity and area of residential sites in Hefei Old Town area.
Site TypeQuantityTotal Area (km2)Proportion of Old Town AreaAverage Area (m2)
Danwei Compound1151.3425.70%11,690
Non-Danwei residential630.438.30%6810
Total1781.7734.00%9959
Table 2. Key values of Figure 7.
Site TypeMaximum AreaMinimum AreaMedian AreaInter Quartile Range
Danwei Compound1,136,43053063809070
Non-Danwei residential36,79049037906000
Total1,136,43049053808800
Table 3. Key values of Figure 8 and Figure 9.
Site TypeAverageMaximumMinimumMedianInter Quartile Range
Plot RatioDanwei Compound2.0654.6860.3072.0440.634
Non-Danwei residential2.3386.3260.7482.1370.771
Building DensityDanwei Compound0.3900.5600.0950.3980.094
Non-Danwei residential0.4110.8170.1150.4030.094
Table 4. The Number and total area Statistics by site types and accessibility to public facilities.
AccessibilitySite TypePoorModerateGoodVery GoodTotal
CountArea (m2)CountArea (m2)CountArea (m2)CountArea (m2)CountArea (m2)
CommercialDanwei30415,69014441,53021339,19050435,4001151,631,810
Non-Danwei23188,1506103,30015153,9501975,22063520,620
Total53603,84020544,83036493,14069510,6201782,152,430
Elementary SchoolDanwei1071,82053889,80025342,87027327,3201151,631,810
Non-Danwei532,98021224,3501591,57022171,72063520,620
Total15104,800741,114,15040434,44049499,0401782,152,430
Middle SchoolDanwei14197,24046496,08027455,10028483,3901151,631,810
Non-Danwei870,09025110,620649,29024290,62063520,620
Total22267,33071606,70033504,39052774,0101782,152,430
HospitalDanwei1888,02025376,58027522,09045645,1201151,631,810
Non-Danwei992,82025177,63015113,16014137,01063520,620
Total27180,84050554,21042635,25059782,1301782,152,430
Table 5. Confusion matrix of the binary logistic regression model.
Predicted
Type Precision (%)
Danwei CompoundNon-Danwei Residential
ActualTypeDanwei Compound1001587.0
Non-Danwei Residential412234.9
Accuracy(%) 68.5
Table 6. Variables in the equation.
BS.E.WalddfSig.Exp(B)95% C.I.for EXP(B)
LowerUpper
Step 1commercial−0.290.144.261.000.040.750.570.99
elementary school0.410.184.881.000.031.501.052.16
middle school0.060.170.131.000.721.060.771.47
hospital−0.350.174.341.000.040.710.510.98
Site_Area0.000.003.221.000.071.001.001.00
plot_ratio0.440.282.471.000.121.560.902.71
building_density−0.032.220.001.000.990.970.0175.23
Constant−0.970.921.121.000.290.38
For the dependent variable of this model, “0” stands for Danwei compounds and “1” stands for non-Danwei sites.
Publisher’s Note: MDPI stays neutral with regard to jurisdictional claims in published maps and institutional affiliations.

