Abstract
Few studies have investigated the urban morphology of informal settlements at fine-grain level, limiting effective urban planning and policies targeting such areas. This study presents a high-resolution morphological analysis of five informal settlements located in central areas of major cities in East Africa. The analysis is based on indicators of urban form, statistical comparison, and field interviews on household conditions. The method improves the replicability and increases the spatial granularity compared to previous studies. Outcomes show that all case studies are characterised by organic street layouts. Three settlements form a comparable group with denser urban fabrics (small block size, high coverage ratios, and small private spaces), while the remaining two cases have less compact forms. The field interviews show high rates of tenancy, overcrowding, and inadequate access to water and sanitation in the first group and low rates of these conditions in the second group. We suggest that these differences are partially an outcome of levels of informal land supply. We argue that decreased informal land supply leads to increased competition and higher prices of accommodation, leaving fewer household resources for infrastructure investments and consequent compromised livelihoods. Accordingly, we argue that some modes of informal urban development should be accepted in Sub-Saharan Africa.
1. Introduction
In Sub-Saharan Africa, the urban majority resides in informal settlements, characterized by limited state control of the urban development, inadequate infrastructure, and compromised livelihoods. The likelihood of continued high population growth, high rural-to-urban migration and limited state capacity to administer the consequent urban growth will likely result in continued proliferation of informal urban development [1]. Accordingly, improving knowledge on the formation and development of informal settlements is of increased importance in the African context. Although the use of the UN-defined ‘slum’ term is contested [2], it specifies some of the challenges facing informal urban development, i.e., substandard housing, overcrowding, insecure tenure as well as inadequate access to water and sanitation [3]. However, spatial factors and urban form such as inadequate access conditions, inefficient use of space, high ground occupation, and limited public space are not included in the definition, even though they arguably constitute fundamental urban deficiencies. The work presented in this paper seeks to contribute to the understanding of informal settlements through the analysis of urban form.
Urban morphology is the study of the form of human settlements with the aim of describing their spatial structures and understanding the process of their development [4]. The research field has developed different methods of classifying urban typologies based on quantitative and qualitative data. In recent years, quantitative studies have emerged, in part as a result of technological development, which have advanced the understanding of urban environments through digital processing and statistical analysis of large-scale fine-grained data sets. Such studies have found links between urban form and a wide range of issues, such as health, energy consumption, and liveability of neighbourhoods [5,6,7]. However, such analyses have only been applied to the study of informal settlements to a limited degree, particularly in the context of Sub-Saharan Africa.
Several scholars in this field have developed theories on the form and development of informal settlements. Davis [8] suggests a typological classification of informal settlements based on location, formal/informal conditions and proximity to job opportunities. Dovey and King [9] outline eight typologies of informal settlements (districts, waterfronts, escarpments, easements, sidewalks, adherences, backstage, and enclosures) based on the process of settling on unclaimed land as indigenous villages, inserting into the leftover urban space, and attaching onto the structures of the formal city. However, these typological models primarily focus on the relation between entire informal settlements and the wider urban context and thus lack focus on the spatial structures within the settlements. Iovene et al. [10] argue that informal settlements develop similarly to premodern cities based on a comparative study with several urban form metrics, focusing on an informal settlement in Lima, Peru, and a neighbourhood in Venice, Italy. Hillier et al. [11] argue that spatial and locational factors influence the development and level of consolidation of informal settlements, based on analysis of informal settlements in Santiago, Chile. The study found that options for development of edge-oriented commercial activity and consequent participation in the wider local economy is determined by the levels of spatial integration within the surrounding context and is significant for consolidation of the built form of informal settlements. However, Hillier et al. primarily focus on features of the street network, thus missing further aspects of the built environment, while Iovene et al., although focused on multiple aspects of urban form, proposed a method difficult to replicate as it is based on fine grained spatiotemporal data, hardly obtainable for multiple informal settlements.
This paper presents some of the first high-resolution urban morphology analyses of multiple informal settlements in Africa and discusses possible drivers for spatial variations. This study features a mixed approach, including eight spatial factors derived from high-resolution maps, statistical comparison, field interviews, and field observations. The spatial factors include block size, coverage ratio, floor area ratio, private and public space ratios, surface area to volume ratio, average node degree, and average betweenness. The proposed mixed approach overcomes the limitations of previous methods, as it is based on multiple descriptors of urban form, is replicable, more statistically robust, and provides outcomes at an unprecedented level of detail. In this paper, it is applied to data from informal settlements located in central areas of Antananarivo, Dar es Salaam, Kampala, Nairobi, and Maputo to address the following research questions: what are the morphological similarities across these settlements? What are the morphological differences? What are the drivers of these similarities and differences?
2. Methodology
The methodology presented in this paper is based on four parts: acquisition of spatial data, field interviews, computation of the indicators of urban form, and statistical comparison.
2.1. Acquisition of Spatial Data
Two techniques were used to obtain data at a fine level of spatial granularity. The former relied on the use of an unmanned aerial vehicle (drone), for systematic collection of high-resolution aerial imagery, and Pix4D, a photogrammetry software (https://www.pix4d.com), for processing the images and generating high-resolution georeferenced orthophotos, Digital Surface Models (DSMs), and 3D models of the surveyed areas. Since orthophotos cannot fully map the intricate path systems typical of informal settlements, these were mapped by walking along the boundaries of every block in each settlement with a handheld GPS device (smartphone) equipped with SW Maps (http://swmaps.softwel.com.np/#), an app that records GPS traces. The GPS traces and the high-resolution orthophotos were then automatically scaled in GIS and subsequently exported in a design software application. Here, all buildings were traced manually based on the orthophotos. Multi-storey buildings were identified using the elevation maps and the 3D models and separate layers were created for each floor. Finally, street networks and blocks were manually drawn based on the GPS traces and orthophotos, respectively. Buildings, blocks, and street networks in vector format constituted the base files for carrying out the spatial analysis presented in this paper.
2.2. Field Interviews
The field interviews were carried out alongside the physical surveys. Ten residents of each neighbourhood were interviewed based on random selection, in different parts of the neighbourhoods. This entailed a fairly even distribution of gender and relative socioeconomic diversity among the interviewees within each context. The questions included household access to water, sanitation and electricity, as well as household size, dwelling size, whether the respondent was a tenant or house owner, and monthly cost of rent. As such, the questions included three of five of the UN-defined indicators of slums (overcrowding and household access to water and sanitation) [3]. We acknowledge that ten residents might not be fully representative of the case studies considered. However, random selection and diversity of gender and socioeconomic status of the interviewees contravene, to a certain extent, to this issue. Surveys for each settlement were carried out during the following periods of time: Antohomadinika, Antananarivo (Madagascar): February 2019; Katanga, Kampala (Uganda): May 2019; Kibera, Nairobi (Kenya): May 2019; Maxaquene, Maputo (Mozambique): May 2019; Hananasif, Dar es Salaam (Tanzania): January 2020.
2.3. Indicators of Urban Form
To characterise the urban form of the settlements under examination, we used a set of eight indicators at the block level. These were computed in GIS and through the Momepy Python library [12]. Six of these indicators are widely used in the fields of urban design and morphology. Two are more experimental. The former include:
- Block size (BS) corresponds to the total area of each block;
- Coverage ratio (CR) quantifies the percentage of land which is occupied by buildings in each block. It is computed by multiplying the sum of the building footprints in each block by 100 and by dividing this value by BS;
- Floor area ratio (FAR) measures the built-up density of the block. It is calculated by summing up the gross floor areas (GFAs), obtained by multiplying building footprints by number of floors, of each building pertaining to the block and by dividing such value by BS;
- Surface area to volume ratio (SAV) quantifies the level of fragmentation of the building envelopes in each block. Typically, a simple box-shaped building would have a small SAV, as it is compact and thus does not have any protruding parts or cavities. On the contrary, a complex building with many recesses and/or protruding elements would have a greater SAV. This indicator is largely used in studies focusing on the energy efficiency of buildings. See, for example, the work by Ratti et al. [13]. SAV is computed by multiplying the perimeters of the buildings in each block by their relative heights, summing two times the sum of the building footprints in each block to this value, and by dividing this sum by the total built-up volume in each block;
- Average node degree (AND) measures the level of connectivity at the block level. It is computed by averaging the node degrees relative to the street intersections surrounding each block. In practice, a block surrounded by many dead-end streets (i.e., node degree equals 1) would have a low average node degree and thus low local connectivity. Conversely, a block surrounded by several four-way intersections (i.e., node degree equals 4) would have a greater average node degree and thus higher local connectivity. Node degree is a widespread measure of network connectivity used, for example, in social networks [14] and communication [15].
- Average betweenness at 400 m (AB400) measures through movement in street networks. It was reported to correlate with several urban phenomena such as concentration of commerce and services [16], employment density [17], and street quality [18]. The formula of betweenness centrality [19] can be adapted to output levels of through movement at different urban scales (e.g., neighbourhood, district, or city region). Since the settlements under examination have sizes comparable to that of city neighbourhoods, we computed betweenness centrality on their street networks with a radius of 400 m, a measure typically associated with the neighbourhood scale [20]. Finally, each block was assigned with the average value of betweenness centrality of its surrounding streets.
The experimental indicators presented next are both variations of the open space ratio (OSR), which is computed by dividing the non-built space in the block by its total GFA [21]. While OSR does not make distinction between non-built public and private spaces, our indicators do. More specifically:
- Private space ratio (PrSR) quantifies the amount of private space relative to the built-up density. It is computed by subtracting the sum of building footprints from BS and by dividing this value by the sum of the gross floor areas (GFAs) of each building within the block.
- Public space ratio (PuSR) measures the amount of public space relative to the built-up density. The amount of public space in each block is obtained by subtracting BS from the area of the polygon enclosed by the road centre lines surrounding each block. PuSR is computed by dividing such value by the sum of the gross floor areas (GFAs) of each building within the block.
2.4. Statistical Comparison
To investigate possible patterns of similarity across the settlements, we produced density distribution plots of the eight indicators of urban form and applied the Kolmogorov–Smirnov test (KS test). The former is a way of visualising data over a continuous interval through a kernel smoother function that reduces the noise and renders distribution functions easier to compare [22]. The latter is a non-parametric null hypothesis test that assesses the statistical similarity between two distribution functions [23]. In practice, the KS test measures the distance between the empirical distributions of two variables, under the null hypothesis that they are taken from the same distribution. Thus, if the null hypothesis can be retained, i.e., the p-value of the test is above 0.01 (corresponding to a confidence level of 99%), the distance between the tested distributions is small and the similarity is confirmed. Conversely, if the null hypothesis is rejected, i.e., the p-value of the test is below 0.01, the distance between the tested functions is greater, thus they are not similar. The KS test was applied to assess similarities among the distribution functions of the eight indicators presented in the previous section, across all possible combinations of settlements.
3. Case Studies
The case studies considered in this paper (i.e., Antohomadinika, Hananasif, Katanga, Kibera, and Maxaquene) were selected for being representative of informal urban development in different East African metropolitan contexts. More specifically, they all feature a low-income population, unplanned/organic urban form, and are centrally located, thus representing some of the densest informal urban areas within their respective contexts. The processed orthophotos and vector maps for each settlement are presented in Figure 1, while brief descriptions for each case study, based on field observations, are presented next.
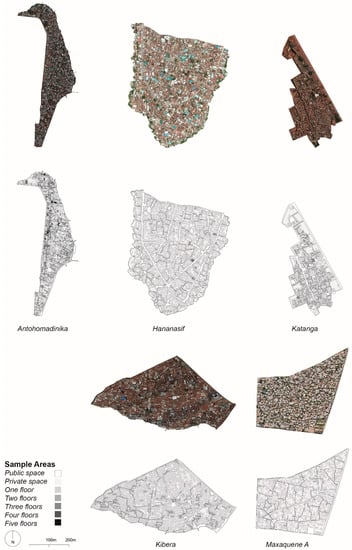
Figure 1.
Orthophotos and vector maps of the five settlements under examination.
Antohomadinika is located approximately 1 km from the central business district (CBD) of Antananarivo, the capital of Madagascar. The settlement is characterized by multi-storey buildings, high ground occupation, limited public space and poor public hygiene due to the frequent flooding of the area, in part due to the low-lying terrain. The vast majority of the buildings have small footprints, indicating small plot sizes. Antananarivo features mountainous orography and distinctive large-scale agriculture intertwining the urban neighbourhoods. These are largely rice fields, characterised by wetland conditions.
Hananasif is located approximately 3 km from the CBD of Dar es Salaam, the largest city in Tanzania. The settlement is characterized by single-storey detached housing units and relatively wide streets, allowing access for cars. It is surrounded by wetlands to the South-West, South and East. Its landscape slopes following these directions, while more central areas stay relatively flat. Dar es Salaam is characterized by a formal urban centre surrounded by a continuous belt of informal urban development with some enclaves of formal areas, stretching approximately 30 km into the land.
Katanga is located approximately 2 km from the CBD of Kampala, the capital of Uganda. It is located next to the main city hospital and is surrounded by formal urban areas. The urban fabric of Katanga is mostly characterized by single-storey dense clusters of buildings and parking lots in the periphery of the settlement. Kampala is characterized by intertwined formal and informal areas.
Kibera is the largest informal settlement in Africa [24] and is located approximately 5 km from the central business district (CBD) of Nairobi, the capital of Kenya. The settlement is characterized by large-scale 1–3 storey buildings, large blocks, limited public space, and poor public hygiene due to lack of infrastructure. It is located in a hilly terrain to which the street layout adapts in some cases. The informal settlements in Nairobi mostly consist of enclaves with identifiable boundaries.
Maxaquene A (referred to as Maxaquene) is located approximately 3 km from the CBD of Maputo, the capital of Mozambique. The urban fabric of Maxaquene is characterised by single-storey detached households, open private space, and large blocks. Its landscape is relatively flat. However, since it is located at a lower altitude compared to the neighbouring areas to the East, it is subject to flooding. Maputo is characterized by a formal urban centre surrounded by a continuous belt of informal urban development, stretching approximately 30 km into the land.
4. Results
This section presents the outcomes of the field interviews and provides a summary of the statistics for the eight indicators of urban form along with the observed similarities and differences between the distributions across the five settlements under examination.
4.1. Field Interviews
The interview data (Table 1) shows large variations in tenure types, dwelling size, household size, people per room, as well as household access to water and sanitation across the case studies. Access to electricity is high in all case studies. The data shows that residents in settlements with greater percentages of tenants (Antohomadinika, Katanga, and Kibera) have significantly lower access to water and sanitation than residents in settlements with smaller percentages (Hananasif and Maxaquene). Furthermore, the tenants have almost exclusively single-room dwellings while the homeowners have an average dwelling size of 4.48 rooms. While the average household size in Hananasif and Maxaquene is almost double that in Antohomadinika, Katanga and Kibera, households in the latter have almost twice as many people per room. Sample areas with greater percentages of tenants have less access to water and sanitation, along with smaller dwelling size, smaller household size, and more overcrowding. The interview data is based on a relatively limited sample size and findings may thus not be fully representative of the case studies under examination. However, similar statistics were reported for the same settlements in previous studies [25,26,27,28,29].

Table 1.
Interview data for the five settlements under examination.
4.2. Settlement Characteristics, Similarities, and Differences
The eight indicators of urban form computed for each settlement under examination are summarised in Figure 2. Maps for each indicator and settlement are presented in the Appendix A. Visual inspection of Figure 2 revealed that AND, BS, PrSR seemed to align across settlements. However, FAR, SAV, and AB400 seemed not to. The KS test was used to perform a statistical comparison in a systematic manner across all indicators and settlements (Figure 3). The similarities found were 23 on a total of 80 different combinations, corresponding to a similarity rate of 29%. The strongest pattern of similarity is found for the metric AND. More specifically, all combinations of settlements had statistically similar distribution functions, with most values concentrating approximately 2.6 and 3, that is most intersections surrounding their blocks were bifurcations (i.e., Y- and T-junctions). The only exception is found for the Kibera–Hananasif combination, as their distribution functions, although being generally aligned with the behaviour explained above, diverged sharply, for a smaller number of blocks, at approximately 2.5.
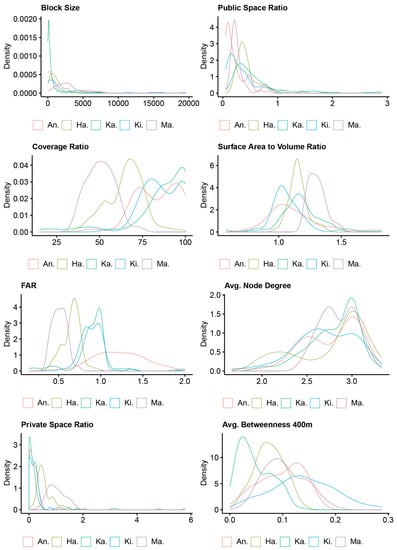
Figure 2.
Density distribution plots of the eight indicators of urban form for each of the settlements under examination. Each line corresponds to the value distribution of a specific indicator and settlement. Peaks represent where values concentrate over the observed interval. An.: Antohomadinika; Ki.: Kibera; Ma.: Maxaquene; Ha.: Hananasif; Ka.: Katanga.
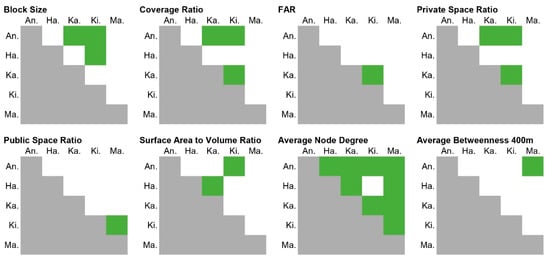
Figure 3.
Results of the KS test performed on the distributions of the indicators of urban form, across all possible combinations of settlements. Green corresponds to a statistically valid similarity between the distribution functions of the same indicator across two settlements. Conversely, white corresponds to absence of a statistically valid similarity. An.: Antohomadinika; Ki.: Kibera; Ma.: Maxaquene; Ha.: Hananasif; Ka.: Katanga.
The second strongest pattern of similarity involves Antohomadinika, Kibera, and Katanga and is found for the metrics BS, CR, PrSR. Regarding BS, Figure 2 shows that the curves of the distribution functions of the three settlements overlap and peak at approximately 390 m2, meaning that most of the blocks are relatively small, approximately 1/30 of a manzana (block) in Barcelona, which measures 12,837 m2 [30]. However, since Kibera has some larger blocks, the curve is not as steep as the ones of Antohomadinika and Katanga, thus a statistical similarity is also found with Hananasif, which has blocks measuring approximately 1000 m2. Maxaquene has much larger blocks on average, measuring approximately 3000 m2. Regarding CR, most blocks in Antohomadinika, Kibera, and Katanga have a great CR (between 75% and 100%). Most blocks in Hananasif and Maxaquene have a lower CR (66% and 50%, respectively), instead. Concerning PrSR, most blocks in the three high-density settlements have a PrSR of approximately 0.1 (the overall range for this metric is 0–5.78), reflecting denser urban fabrics, with small or no private open space within the blocks. Most blocks in Hananasif and Maxaquene, being less dense, have a lower PrSR (0.5 and 1, respectively).
Further similarities are found, however, for fewer combinations of settlements. SAV is similar in Antohomadinika and Kibera, wherein most blocks have a SAV of approximately 1, corresponding to a fairly compact urban fabric (the overall range for this metric is 0.576–1.822). In Katanga and Hananasif, most blocks have a SAV of approximately 1.2, corresponding to a slightly more fragmented urban fabric. However, since Antohomadinika has greater FARs than Kibera, this means that the latter is much more compact. Most blocks in Maxaquene have greater values of FAR (1.3). FAR is similar in Kibera and Katanga, wherein most blocks have a FAR of approximately 1.0. The other three settlements show different distribution functions. Most blocks in Antohomadinika have a greater FAR (1.2), while most blocks in Hananasif and Maxaquene have smaller FARs (0.7 and 0.5, respectively). PuSR is only similar in Kibera and Maxaquene, wherein most blocks have a PuSR of approximately 0.2, corresponding to a scarcity of public space (the overall range for this metric is 0.05–2.90). Hananasif and Katanga, which are more densely built than Maxaquene, have more public space (0.4). This is likely due to the presence of small squares in the urban fabric of both settlements. Most blocks in Antohomadinika have small public spaces (0.1). Distribution functions of the metric AB400 are similar only in Antohomadinika and Maxaquene, with most blocks having a value close to 0.1, corresponding to moderate levels of through movement in the street network at the settlement level (the overall range for this metric is 0–0.288). Kibera shows the greatest levels of potential through movement, while Katanga and Hananasif show the smallest levels. This is likely related to different spatial contexts at the edges of the settlements. While Kibera seems to be more integrated into the surrounding street network, Katanga and Hananasif are more inward oriented. The former developed in the interstices of the planned city and has few connections with the surrounding street network. The latter has three on four edges surrounded by wetlands, with only one side connected to the surrounding street network.
5. Discussion
The main commonality of the settlements under examination is that their street networks are predominantly characterised by values of AND close to 3, which signifies that most intersections have three streets converging at them, i.e., Y- and T-shaped junctions. This is a feature seen in urban fabrics built through self-organised, bottom–up approaches, determined by the mobility needs of pedestrians. Previous studies [31,32] found that the emergence of street networks mainly organised through Y- and T-shaped junctions is related to the movement of pedestrians between different places of interests (e.g., schools, places of worship, and markets). Ribeiro [31] also suggests that while the first type of junction is generally associated with the diverging or converging to a place of interest and thus with flow in the street network, the second type marks the connection with a more residential circulation system (e.g., dead-end streets).
This study identified three settlements with comparable features (Antohomadinika, Kibera, and Katanga) and two settlements (Hananasif and Maxaquene) that are not only different from the former group but also from each other. More specifically, Antohomadinika, Kibera, and Katanga are densely built, with relatively small blocks (approximately 390 m2), high coverage ratios (between 75% and 100%), and small private spaces within blocks (0.1 in a range 0–5.78). The built-up densities are also comparable as most blocks have FARs between 1 and 1.2. We suggest that there are several reasons behind these dense urban fabrics.
Angel [33] argues that greenbelt policies increase costs of affordable housing due to containment of urban expansion and consequent decreased land supply, resulting in increased competition and higher prices. A similar tendency may condition accommodation costs in the informal settlements under examination. If the informal land supply is constrained through government restrictions (see [34]), less informal land is available, leading to increased competition and higher prices. Conversely, when governments adopt less stringent policies towards informal urban development, informal land supply is less restricted, leading to less competition and lower prices (see [35]). As the urban majorities are financially excluded from the formal land market [1], the extent of the informal land supply and size of the urban poor population likely determine the population densities of informal settlements. We thus suggest that a smaller supply of informal land is one of the likely causes of the high densities found in Antohomadinika, Kibera, and Katanga. Glaeser & Gottlieb [36] argue that higher housing prices do not necessarily correspond to an increase in national wealth, since the values have been offset by the higher costs for securing a basic necessity. Accordingly, increased competition in the informal land market is likely related to higher rents and thus to fewer household resources for investments in infrastructure. This, in turn, leads to increased overcrowding, substandard housing, and decreased access to water and sanitation. The household survey data and the outcomes of the quantitative analysis highlight that areas with high urban densities also have greater proportions of tenants, more overcrowding, and lower levels of access to water and sanitation. However, the relation between property prices, location, and urban density of informal settlements in Sub-Saharan Africa remains under-researched [37]. Accordingly, further studies are needed to validate the hypotheses formulated in this paper.
Distance to CBD might further explain the high densities in Antohomadinika, Kibera, and Katanga. Generally, built densities are highest in the CBD and decrease as a function of distance and transportation costs [38]. Peripheral areas thus tend to have lower land prices and higher transportation costs, which induce lower densities. Conversely, more central areas tend to have higher land prices and lower transportation costs, which result in higher densities. However, this seems to hold only for Antohomadinika and Katanga (i.e., 1 km and 2 km away from the CBD, respectively), but not for Kibera, which is located 5 km away from the CBD. We suggest that, since Kibera was established at the beginning of the 20th century [39], it might have consolidated and developed the characteristics of a subcentre (e.g., higher employment densities, better connectivity to the metropolitan system) over time, thus attracting speculative housing market practices similar to that of more centrally located settlements. Indeed, Kibera’s street network has the most through movement among the case studies considered, a plausible sign of its integration with the surrounding neighbourhoods. A further possible reason for the misalignment of Kibera might be associated with the existence of two parallel land markets. As built densities are not only determined by the transportation costs to reach the CBD, but also determined by the volume of informal land in the city and its relative centrality within the informal land market, formal and informal neighbourhoods with comparable centrality might display large variations in built densities (e.g., dense informal settlements next to suburban neighbourhoods). Consequently, although Kibera is at a considerable distance from the CBD, it might be centrally located within the informal land market and transportation costs to the CBD may be relatively low compared to other informal settlements in the city.
Our analysis also highlights that Hananasif and Katanga, which are more densely built than Maxaquene, have more public space than the latter, in the form of larger streets and squares. In Hananasif, this is the effect of local governance practices and a slum upgrading project which expanded the streets and nearby open areas [28]. In Katanga, the presence of more public spaces is probably not the outcome of local governance but rather the effect of a canal passing through the settlement, which stopped urbanisation from happening on its banks and immediate surroundings due to yielding ground. The small blocks in this settlement (i.e., most of them measure approximately 219 m2) might have also required more public space for basic accessibility. This outcome shows that quantifying open space through two sperate indicators (i.e., PrSR and PuSR) can be advantageous for obtaining information that could eventually guide interventions in two realms with different levels of operational restriction.
The three case studies with high built densities show larger shares of tenants as well as overcrowding, and inadequate access to water and sanitation. We suggest that government control of the land market limits the informal land supply affordable for the urban poor majorities and leads to the increased price of informal land. Consequently, residents pay higher rents, leading to fewer resources for investments in infrastructures and consequent proliferation of the three UN-defined slum characteristics mentioned above. This is a notable finding, as it suggests that the rule of law, in this particular case, leads to increasingly compromised livelihoods. Less stringent rules on informal land together with infrastructure investment could be a way forward for improving living conditions in informal settlements.
The proposed methodology overcomes limitations of previous ad-hoc qualitative assessments, for example [8,9], as it is based on a set of systematic steps and focuses on blocks rather than entire settlements. It also provides advantages over existing quantitative methodologies, for example [10,11], as it describes the urban form of informal settlements through a comprehensive set of indicators, measuring aspects of the urban fabric and configuration of the street network, the scale of which permits replicability. The application presented in this paper shows that outcomes are detailed and varied, i.e., through interview data (Table 1), maps of the indicators (Appendix A), density plots (Figure 2), and similarity matrices (Figure 3), thus providing a solid basis for the interpretation of local dynamics that affect the development and form of informal settlements and the eventual proposal of design strategies aimed at their upgrading. The main challenges of the proposed methodology involve carrying out field surveys, as they can be costly and time consuming, as well as organising and interpreting the detailed outputs.
6. Conclusions
The scarcity of studies on the morphology of informal settlements at a fine level of spatial granularity limits knowledge on the formation and development of such areas as well as the capacity to develop effective policy and urban planning in this context. In this paper, we present a morphological analysis at the block level of five informal settlements in East Africa (Antohomadinika, Kibera, Katanga, Hananasif, and Maxaquene). Outcomes show the emergence of a general pattern across the settlements, i.e., street networks are characterised by organic layouts based on bifurcations (i.e., Y- and T-junctions), a feature found in self-organised/bottom–up settlements. Furthermore, most blocks in Antohomadinika, Kibera, and Katanga were found to be densely built with limited open space. We suggest that this was due to stronger forms of control of the informal land market, speculative housing markets and the relative distance to the CBD. Hananasif and Maxaquene were not only found to be statistically different from the above-mentioned group of settlements, but also to each other. More precisely, most blocks in Hananasif were slightly denser than the blocks in Maxaquene. Counterintuitively, although Hananasif possessed these features, it had more public space than Maxaquene. This was suggested to be the result of local administration practices and a slum upgrading initiative aimed at enlarging the streets of the settlement. The proposed methodology overcomes limitations of previous works, especially concerning replicability, scale, and robustness. It can be applied to further cases to gain a better understanding of local features of informal settlements and eventually guide ad-hoc strategies, which could deliver more effective urban planning and policies.
We argue that limited informal land supply, partly caused by government control of the land market, leads to higher costs of accommodation and consequently fewer resources for private investments in infrastructures and home improvements. This, in turn, leads to proliferation of slum conditions in informal settlements, such as overcrowding and inadequate access to water and sanitation. We thus argue that accepting some modes of informal urban development will likely improve living conditions, as it would increase the informal land supply and thereby decrease the price of accommodation and free resources for investments in basic infrastructures. On this basis, we argue that governments should rather focus on guiding developments of informal settlements and invest in infrastructures rather than evicting them. This could be pioneered through state-financed allocation of small plots with leasehold titles on government-owned land, with allocation of sufficient street space, common water and sanitation units, and local guidance for autoconstruction without enforcement of the building code. This study suggests that this will be a viable path towards improved living conditions for the urban poor majorities in East African cities.
Author Contributions
J.M.: conceptualisation, methodology, software, data curation, writing—original draft preparation, visualisation, investigation, and writing—reviewing and editing. A.V.: conceptualisation, methodology, software, data curation, writing—original draft preparation, visualisation, investigation, and writing—reviewing and editing. All authors have read and agreed to the published version of the manuscript.
Funding
This study was funded by The Danish Council of Independent Research (ID: 7023-00007B), KADK—The Royal Danish Academy of Fine Arts School of Architecture. It was also supported by the French government, through the UCA JEDI Investments in the Future project managed by the National Research Agency (ANR) with the reference number ANR-15-IDEX-01.
Acknowledgments
We would like to thank the municipality and local authorities in the five settlements studied in this paper for permitting the spatial surveys as well as the members of the communities of each settlement who participated in the field interviews. Finally, we would like to thank the following residents who facilitated the field work: Mario Mugano Xikumbane, Ali Muhammed Muhina, Ally Hassan Ally, Daniel Futwax, John Saturday Bwambale, David Esenga, Kyeyune Daniel, Vero Razafinirina, Ravaonirina Andrine, Rasoanirina Zoeline, and Rabevaza Selestin.
Conflicts of Interest
The authors declare no conflict of interest.
Appendix A
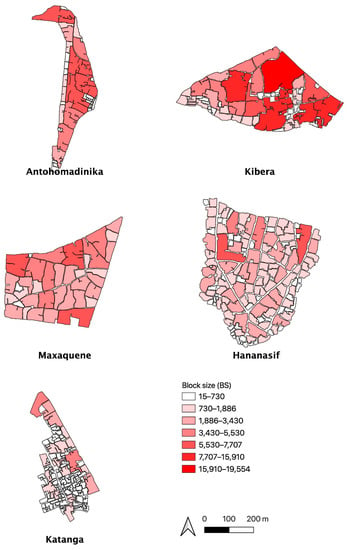
Figure A1.
Maps of block size (BS) for the five informal settlements under examination.
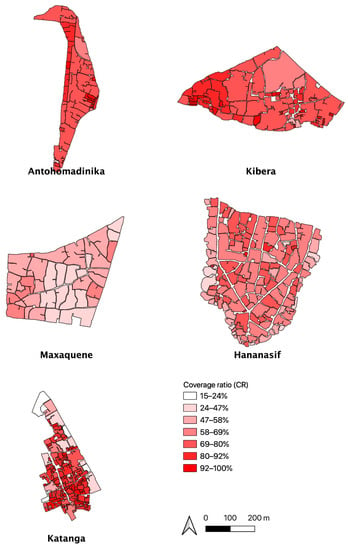
Figure A2.
Maps of coverage ratio (CR) for the five informal settlements under examination.
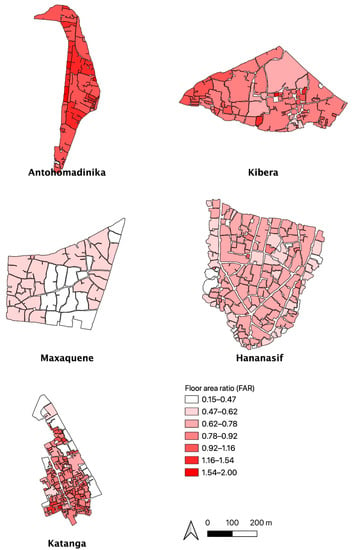
Figure A3.
Maps of floor area ratio (FAR) for the five informal settlements under examination.
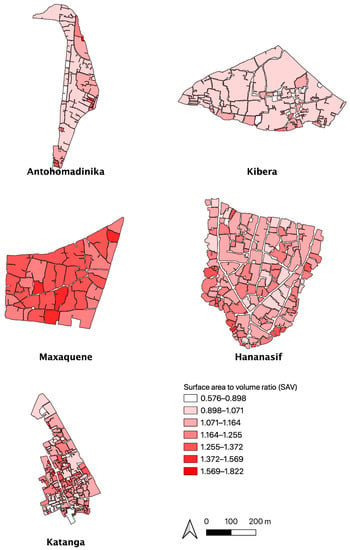
Figure A4.
Maps of surface area to volume ratio (SAV) for the five informal settlements under examination.
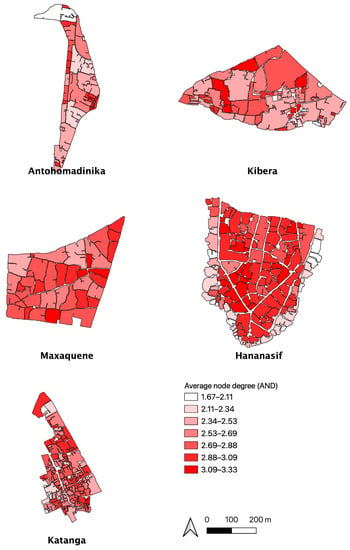
Figure A5.
Maps of average node degree (AND) for the five informal settlements under examination.
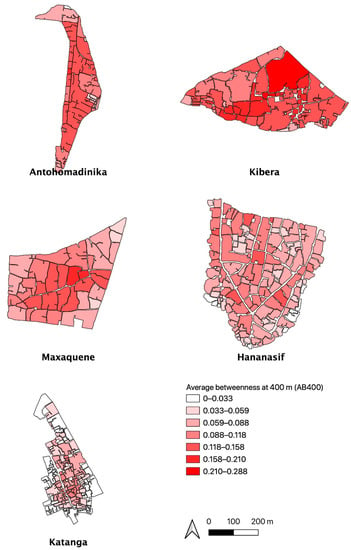
Figure A6.
Maps of average betweenness at 400 m (AB400) for the five informal settlements under examination.
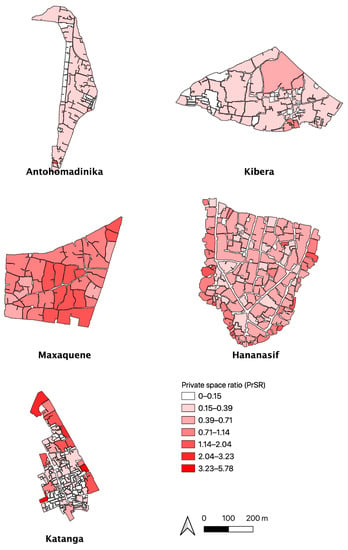
Figure A7.
Maps of private space ratio (PrSR) for the five informal settlements under examination.
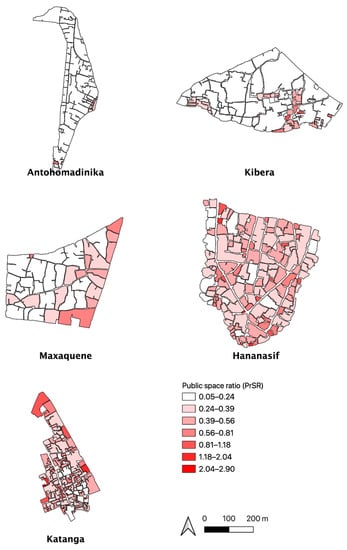
Figure A8.
Maps of public space ratio (PuSR) for the five informal settlements under examination.
References
- UN-Habitat. State of the World’s Cities 2012/2013: Prosperity of Cities; Routledge: New York, NY, USA, 2013. [Google Scholar]
- Jenkins, P. Urbanization, Urbanism, and Urbanity in an African City: Home Spaces and House Cultures; Palgrave Macmillan: New York, NY, USA, 2013. [Google Scholar]
- UN-Habitat. Slums of the World: The Face of Urban Poverty in the New Millennium; UN-Habitat: Nairobi, Kenya, 2003. [Google Scholar]
- Moudon, A.V. Urban morphology as an emerging interdisciplinary field. Urban Morphol. 1997, 1, 3–10. [Google Scholar]
- Frank, L.; Engelke, P.; Engelke, S.F.P.; Schmid, T. Health and Community Design: The Impact of the Built Environment on Physical Activity; Island Press: Washington, DC, USA, 2003. [Google Scholar]
- Liu, C.; Shen, Q. An empirical analysis of the influence of urban form on household travel and energy consumption. Comput. Environ. Urban Syst. 2011, 35, 347–357. [Google Scholar] [CrossRef]
- Venerandi, A. A Quantitative Method to Study the Relationship between Urban Form and City Liveability Indexes. Ph.D. Thesis, UCL (University College London), London, UK, 2017. Available online: https://discovery.ucl.ac.uk/id/eprint/1569319/ (accessed on 20 June 2020).
- Davis, M. Planet of Slums; Verso: London, UK, 2006. [Google Scholar]
- Dovey, K.; King, R. Forms of informality: Morphology and visibility of informal settlements. Built Environ. 2011, 37, 11–29. [Google Scholar] [CrossRef]
- Iovene, M.; Fernández de Córdova, G.; Romice, O.; Porta, S. Towards Informal Planning: Mapping the Evolution of Spontaneous Settlements in Time. In Proceedings of the 24th ISUF International Conference, València, Spain, 27–29 September 2017. [Google Scholar]
- Hillier, B.; Greene, M.; Desyllas, J. Self-generated Neighbourhoods: The role of urban form in the consolidation of informal settlements. Urban Des. Int. 2000, 5, 61–96. [Google Scholar] [CrossRef]
- Fleischmann, M. Momepy: Urban morphology measuring toolkit. J. Open Source Softw. 2019, 4, 1807. [Google Scholar] [CrossRef]
- Ratti, C.; Baker, N.; Steemers, K. Energy consumption and urban texture. Energy Build. 2005, 37, 762–776. [Google Scholar] [CrossRef]
- Opsahl, T.; Agneessens, F.; Skvoretz, J. Node centrality in weighted networks: Generalizing degree and shortest paths. Soc. Netw. 2010, 32, 245–251. [Google Scholar] [CrossRef]
- Lü, L.; Zhou, T.; Zhang, Q.M.; Stanley, H.E. The H-index of a network node and its relation to degree and coreness. Nat. Commun. 2016, 7, 10168. [Google Scholar] [CrossRef]
- Porta, S.; Latora, V.; Wang, F.; Rueda, S.; Strano, E.; Scellato, S.; Cardillo, A.; Belli, E.; Cardenas, F.; Cormenzana, B.; et al. Street centrality and the location of economic activities in Barcelona. Urban Studies 2012, 49, 1471–1488. [Google Scholar] [CrossRef]
- Wang, F.; Antipova, A.; Porta, S. Street centrality and land use intensity in Baton Rouge, Louisiana. J. Transp. Geogr. 2011, 19, 285–293. [Google Scholar] [CrossRef]
- Remali, A.M.; Porta, S.; Romice, O.; Abudib, H.; Vaughan, L. Street quality, street life, street centrality. In Suburban Urbanities: Suburbs and the Life of the High Street; UCL Press: London, UK, 2015; pp. 104–129. [Google Scholar]
- Porta, S.; Crucitti, P.; Latora, V. The network analysis of urban streets: A primal approach. Environ. Plan. B Plan. Des. 2006, 33, 705–725. [Google Scholar] [CrossRef]
- Mehaffy, M.; Porta, S.; Rofe, Y.; Salingaros, N. Urban nuclei and the geometry of streets: The ‘emergent neighborhoods’ model. Urban Des. Int. 2010, 15, 22–46. [Google Scholar] [CrossRef]
- Berghauser-Pont, M.Y.; Haupt, P. Spacematrix: Space, Density and Urban Form; NAi Publishers: Rotterdam, The Netherlands, 2010; pp. 297–298. [Google Scholar]
- Hastie, T.; Tibshirani, R.; Friedman, J. The Elements of Statistical Learning: Data Mining, Inference, and Prediction; Springer Science & Business Media: New York, NY, USA, 2009. [Google Scholar]
- Conover, W.J. Practical Nonparametric Statistics; John Wiley & Sons: New York, NY, USA, 1971. [Google Scholar]
- Desgroppes, A.; Taupin, S. Kibera: The biggest slum in Africa? Les Cahiers d’Afrique de l’Est/East Afr. Rev. 2011, 44, 23–33. [Google Scholar]
- Laureau, C.; Blanchard, C.; Godinot, X. Making Health Services Work for Poor People: Ten Years of Work in Tananarive, Madagascar. World Bank Work. Pap. 2006, 77, 37. [Google Scholar]
- African Population and Health Research Center (APHRC). Population and Health Dynamics in Nairobi’s Informal Settlements: Report of the Nairobi Cross-Sectional Slums Survey (NCSS) 2012; APHRC: Nairobi, Kenya, 2014. [Google Scholar]
- Raimundo, J.A.; Raimundo, I.N. Operation of the Market Study: Land Access in Urban Areas, the Case of Maputo; Urban LandMark: Pretoria, South Africa, 2012. [Google Scholar]
- Precht, R. Informal settlement upgrading and low-income rental housing: Impact and untapped potentials of a community-based upgrading project in Dar Es Salaam Tanzania. In Proceedings of the 3rd World Bank Urban Research Symposium on Land Development, Urban Policy and Poverty Reduction, Brasilia, Brazil, 4–6 April 2005. [Google Scholar]
- Mbiggo, I.; Ssemwogerere, K. An Investigation into Fire Safety Measures in Kampala Slums—A Case of Katanga-Wandegeya. Civ. Environ. Res. 2018, 10, 30–34. [Google Scholar]
- Aibar, E.; Bijker, W.E. Constructing a city: The Cerdà plan for the extension of Barcelona. Sci. Technol. Hum. Values 1997, 22, 3–30. [Google Scholar] [CrossRef]
- Ribeiro, G. An ecological approach to the study of urban spaces: The case of a shantytown in Brasilia. J. Archit. Plan. Res. 1997, 14, 289–300. [Google Scholar]
- Hamouche, M.B. Can chaos theory explain complexity in urban fabric? Applications in traditional Muslim settlements. In Nexus Network Journal; Birkhäuser: Basel, Switzerland, 2009; pp. 217–242. [Google Scholar]
- Angel, S. Housing Policy Matters: A Global Analysis; Oxford University Press: Oxford, UK, 2000; pp. 31–33. [Google Scholar]
- Talukdar, D. Cost of being a slum dweller in Nairobi: Living under dismal conditions but still paying a housing rent premium. World Dev. 2018, 109, 42–56. [Google Scholar] [CrossRef]
- Jenkins, P. Emerging Land Markets for Housing in Mozambique: The Impact on the Poor and Alternatives to Improve Land Access and Urban Development—An Action Research Project in Peri-Urban Maputo; Research Paper; Edinburgh College of Art/Heriot-Watt University, School of Planning & Housing: Edinburgh, UK, 2001; Volume 75. [Google Scholar]
- Glaeser, E.L.; Gottlieb, J.D. The wealth of cities: Agglomeration economies and spatial equilibrium in the United States. J. Econ. Lit. 2009, 47, 983–1028. [Google Scholar] [CrossRef]
- Visagie, J.; Turok, I. Getting urban density to work in informal settlements in Africa. Environ. Urban. 2020, 21, 309–329. [Google Scholar] [CrossRef]
- Bertaud, A. Order without Design: How Markets Shape Cities; MIT Press: Cambridge, MA, USA, 2018; pp. 143–219. [Google Scholar]
- De Smedt, J. “Kill Me Quick”: A History of Nubian Gin in Kibera. Int. J. Afr. Hist. Stud. 2009, 42, 201–220. [Google Scholar]
© 2020 by the authors. Licensee MDPI, Basel, Switzerland. This article is an open access article distributed under the terms and conditions of the Creative Commons Attribution (CC BY) license (http://creativecommons.org/licenses/by/4.0/).