Article

Simplified Numerical Model for Analyzing the Effects of the Urban Heat Island upon Low-Rise Buildings by Using a Free-License Thermal Simulation Program

by
Ivan Oropeza-Perez
Department of Architecture, Universidad de las Américas Puebla, Ex Hacienda Sta. Catarina Mártir, San Andrés Cholula, Puebla 72810, Mexico
Urban Sci. 2020, 4(2), 30; https://doi.org/10.3390/urbansci4020030
Submission received: 11 May 2020 / Accepted: 19 June 2020 / Published: 25 June 2020

Abstract

:
In this document, the thermal effect of a heat island upon an urban area and its surrounding low-rise buildings is analyzed with the building thermal simulation program EnergyPlus and its EnergyPlus weather files (EPW). By using a top-down approach, a simplified numerical model is developed, which is used to simulate the urban heat island effect, and that deals with the performance of various cooling methods according to the physical, urban, and climatic characteristics of the urban site. The calculated results of outdoor air temperature considering the heat island effect achieve good agreement with the already-published results. Then, different methods of shading and cooling, varying physical values such as urban thermal transmittance, and urban thermal absorption are applied in order to find the most influencing feature upon the indoor temperature drop into a simulation loop. With this, it is found that a maximum average decrease of indoor temperature of 5.1 °C can be achieved. Furthermore, carrying out a sensitivity analysis, it is found that the albedo of both building surface and urban layout is the most influencing parameter onto the indoor thermal comfort. With this, it is expected to have a reliable model that helps to understand the urban heat island effect in a simple and cheap manner and in terms of the indoor thermal comfort of its surrounding buildings.

1. Introduction

The so-called urban heat island (UHI) is a phenomenon that grows every day in amount and intensity. This phenomenon comprises the increase of the local air temperature, the indirect solar radiation, and other physical characteristics that imply thermal discomfort upon the inhabitants. Consequences of the UHI are transferred onto the surrounding buildings, which are affected in their indoor environment, generally by an increase in indoor temperature: Use of cooling methods such as fans and air-conditioning (AC) systems are therefore required to maintain acceptable living conditions [1].
The phenomenon of UHI onto a metropolitan area consists in “more released anthropogenic heat, a higher blockage effect against urban ventilation, a higher absorption of solar radiation due to the implementation of artificial materials, and eventually a reduced long-wave emission to sky due to the blockage effect of buildings” [2]. Furthermore, authors have found that the UHI effect, by increasing the indoor air temperature and sometimes the relative humidity of the immediate buildings, produces a growth of indirect CO2 emissions [3].
According to the literature, the first cause of the temperature increase is the modification of land surfaces, followed by waste heat from a certain activity. The main heat flows of the UHI can be seen in Figure 1. For each of these heat flows, various solutions have been proposed such as green infrastructure, reflective materials, and urban natural ventilation, among other approaches [4,5,6,7,8,9,10,11].
In this sense, weather research and forecasting (WRF) and other weather data interfaces have been used to simulate UHI in previous documents on different parts of the world [12,13,14,15]. Furthermore, there are plug-ins such as Ladybug and Honeybee, which help to connect weather files and building simulation programs such as Radiance, Daysim, and OpenStudio with graphic tools such as Rhino and Grasshopper to simulate the thermal comfort at urban scale [16]. Also, there are programs that are capable of simulating the urban microclimate and thermal performance in a straightforward manner, such as ENVI-Met and Modelica [17].
Nevertheless, there is not, to the best of our knowledge, an integrated approach that analyses the urban thermal performance and the indoor thermal performance of the surrounding buildings with a free-license tool such as EnergyPlus [18] and a commercial software such as Microsoft Excel, for both weather files and simulation modeling, which is useful for analyzing the UHI effect in a fast and affordable manner. Moreover, this article carries out an assessment of the AC consumption of the buildings located where the UHI is taking place considering a low-rise buildings arrangement.
Therefore, in this document, a combination of weather files with a building energy model (BEM) is applied in order to estimate, in a simple manner, reliable consumptions of AC upon buildings and carry out an assessment of the different strategies of reduction of the UHI effect.
This document has the purpose of assessing the different techniques of shading and others that reduce the air temperature and the direct solar radiation, mainly through a numerical model that calculates the physical characteristics of the UHI. The first input data (global solar radiation, dew point, temperature of sky, and air temperature) are estimated with the EnergyPlus weather files (EPW) of the building thermal simulation program EnergyPlus [18]. Then, the numerical model determines the second input data (outdoor temperature and relative humidity) considering the UHI effect. These data are used in the BEM, i.e., EnergyPlus, to calculate the indoor temperature and relative humidity and the thermal comfort by using the predicted mean vote (PMV) index. Finally, the daily cooling demand is estimated. The main workflow of the model, considered as a top-down approach, can be seen in Figure 2.
In Figure 2, one can see that when the assessed thermal comfort is not reached, the input data on the simplified numerical model are adjusted. This can be carried out upon a calculation loop until thermal comfort is achieved. Furthermore, the input data that are changed within the simplified model are thermal values onto the urban layout, i.e., thermal absorption, thermal transmittance, and the urban convective heat flow. Thereby, in order to assess the different approaches of UHI mitigation, the numerical model is applied in order to generate the new input data (outdoor temperature and outdoor relative humidity) to the BEM and thus calculating the new indoor temperature and indoor relative humidity of the surrounding buildings.

2. Methodology

2.1. Weather Files

The EPW files of EnergyPlus dispatch atmospheric features such as cloudiness, solar radiation, wind speed, wind direction, atmospheric pressure, relative humidity, and outdoor temperature of a determined location. Several documents have studied their reliability, finding a proper performance for building simulation [19,20,21,22,23,24], even calibrating their accuracy onto a UHI context [25,26].
In this document, some of these data are taken as input in an hourly manner upon a simplified numerical model developed hereby to calculate an input dataset that is used in EnergyPlus, thus calculating the hourly indoor thermal comfort conditions of the surrounding buildings. The EPW files are considered as the typical meteorological year (TMY) of the analyzed site [19]. It is important to mention that the TMY manages averaged values of the different climate characteristics within a certain period of years. Before, during, and after this period, lower or higher values can be present in the site due to various factors such as atypical weather behavior. As an example, the EPW files of Mexico City, imported to Microsoft Excel can be seen in Figure 3 (outdoor air temperature), Figure 4 (relative humidity), and Figure 5 (global solar radiation).

2.2. Simplified Numerical Model

With the heat flows onto the UHI, a simplified numerical model is developed to calculate the outdoor temperature and the relative humidity considering the UHI effect and after using the methods of shading, reflecting surfaces, and ventilation proposed in literature.
The temperature of the outdoor air, or temperature sol-air, is used as a boundary condition in the part ‘outdoor temperature’ in the EnergyPlus idf editor to estimate the hourly indoor temperature of the building thermal zone. This temperature, including the UHI effect, is calculated as follows:
T s o l a i r = T o + α · I C Q i r h o + T U H W
where To is the outdoor air temperature [°C], α is the thermal absorption [dimensionless]; IC is the incident solar radiation [W/m2]; ΔQir is the additional infrared radiation due to the difference between the outdoor temperature and the temperature of the apparent sky [W/m2]; ho is the coefficient of heat transfer by radiation and convection of the urban morphology [W/m2K]; and TUHW is the outdoor temperature due to the urban heat wastes [°C]. TUHW is hourly calculated as follows:
T U H W = W H · 3600   s e c ρ · V · C p
where WH is the heat from motor traffic, mainly [W], ρ is the air density [kg/m3], V is the volume of the space where the motor traffic stands [m3], and Cp is the specific heat of the air [kJ/kgK]. In addition, the incident radiation and the additional infrared radiation are calculated as the following:
I c = I G · τ
Q i r = F r · h r · T o u t d o o r s k y
where IG is the global solar radiation [W/m2]; τ is the thermal transmittance of the urban site [dimensionless]; Fr is the form factor between the element and the sky [dimensionless]; hr is the external radiative heat transfer coefficient of the urban surface [W/m2K]; and ΔToutdoor-sky is the difference between the outside dry-bulb air temperature and the sky mean radiant temperature [K].
Thereby, the temperature sol-air is calculated based on the outdoor characteristics of radiation, infrared radiation, convection and radiation heat flow, and the optical characteristics of the place (transmittance, absorption). The solar radiation, the infrared radiation, and the outdoor temperature are estimated with the EPW files, while its other parameters are the factors to vary in order to counter the UHI effect. The external radiative heat transfer coefficient, hr, is set at 5.34 W/m2K, in accordance with [27].
Furthermore, the relative humidity, φ [%], is calculated as follows [28]:
φ = P v P v s · 100
where Pv and Pvs are estimated as the following:
P v = 6.112 · e x p [ 17.7 · T d T d + 243.5 ]
P v s = 6.11 · e x p [ 17.27 · T o T o + 237.3 ]
where Pv is the actual vapor density [g/m3]; Pvs is the saturation vapor density [g/m3]; and Td is the temperature of dew point [°C].
From Equations (5) to (7) it is seen that the relative humidity only depends on the calculated outdoor temperature and the dew point of the place. In this document, these parameters are taken from the EPW files of the respective location.
Thereby, with Equations (1) to (7), the temperature sol-air and the relative humidity can be controlled by three main urban variables: Urban transmittance, urban absorption, and urban heat transfer coefficient by radiation and convection. For the three factors, one respective solution is hereby proposed as follows:
  • For low absorption (α), green and/or reflective surfaces.
  • For low incident solar radiation (I), low transmittance, shading vegetation, and/or urban shading methods.
  • For high coefficient of radiation and convection heat transfer (ho), urban canyons and/or urban natural ventilation.
It is worth to mention that in this document, there is a distinction between ‘shading vegetation’ and ‘green surfaces’. The first term comprises mainly trees that make a shade upon buildings, ground etc., whereas the second term refers to vegetation that do not make any kind of visible shade upon the urban area but decreases both the absorption and the emittance of the surfaces.
Thereby, the calculation method is presented in this document as hourly output data of the relative humidity and air temperature. Hence, these output data are set as input data in EnergyPlus thus, calculating the indoor air temperature and indoor relative humidity, where the building is considered as a single thermal zone. As a comparison, other programs such as urban weather generator (UWG) [28] consider different asymmetric urban morphologies of the city (urban canyons, building construction, etc.) whereas in this document, the environment is calculated only for a uniform and symmetric urban morphology (Fr = 0.1). Another difference between UWG or ENVI-Met and the numerical model developed hereby relies on the simplified link between EnergyPlus using the EPW files in Microsoft Excel only, while ENVI-Met and UWG are combined with parametric simulation modules such as Rhinoceros 3D and using additional coding programs such as MatLab [29,30].

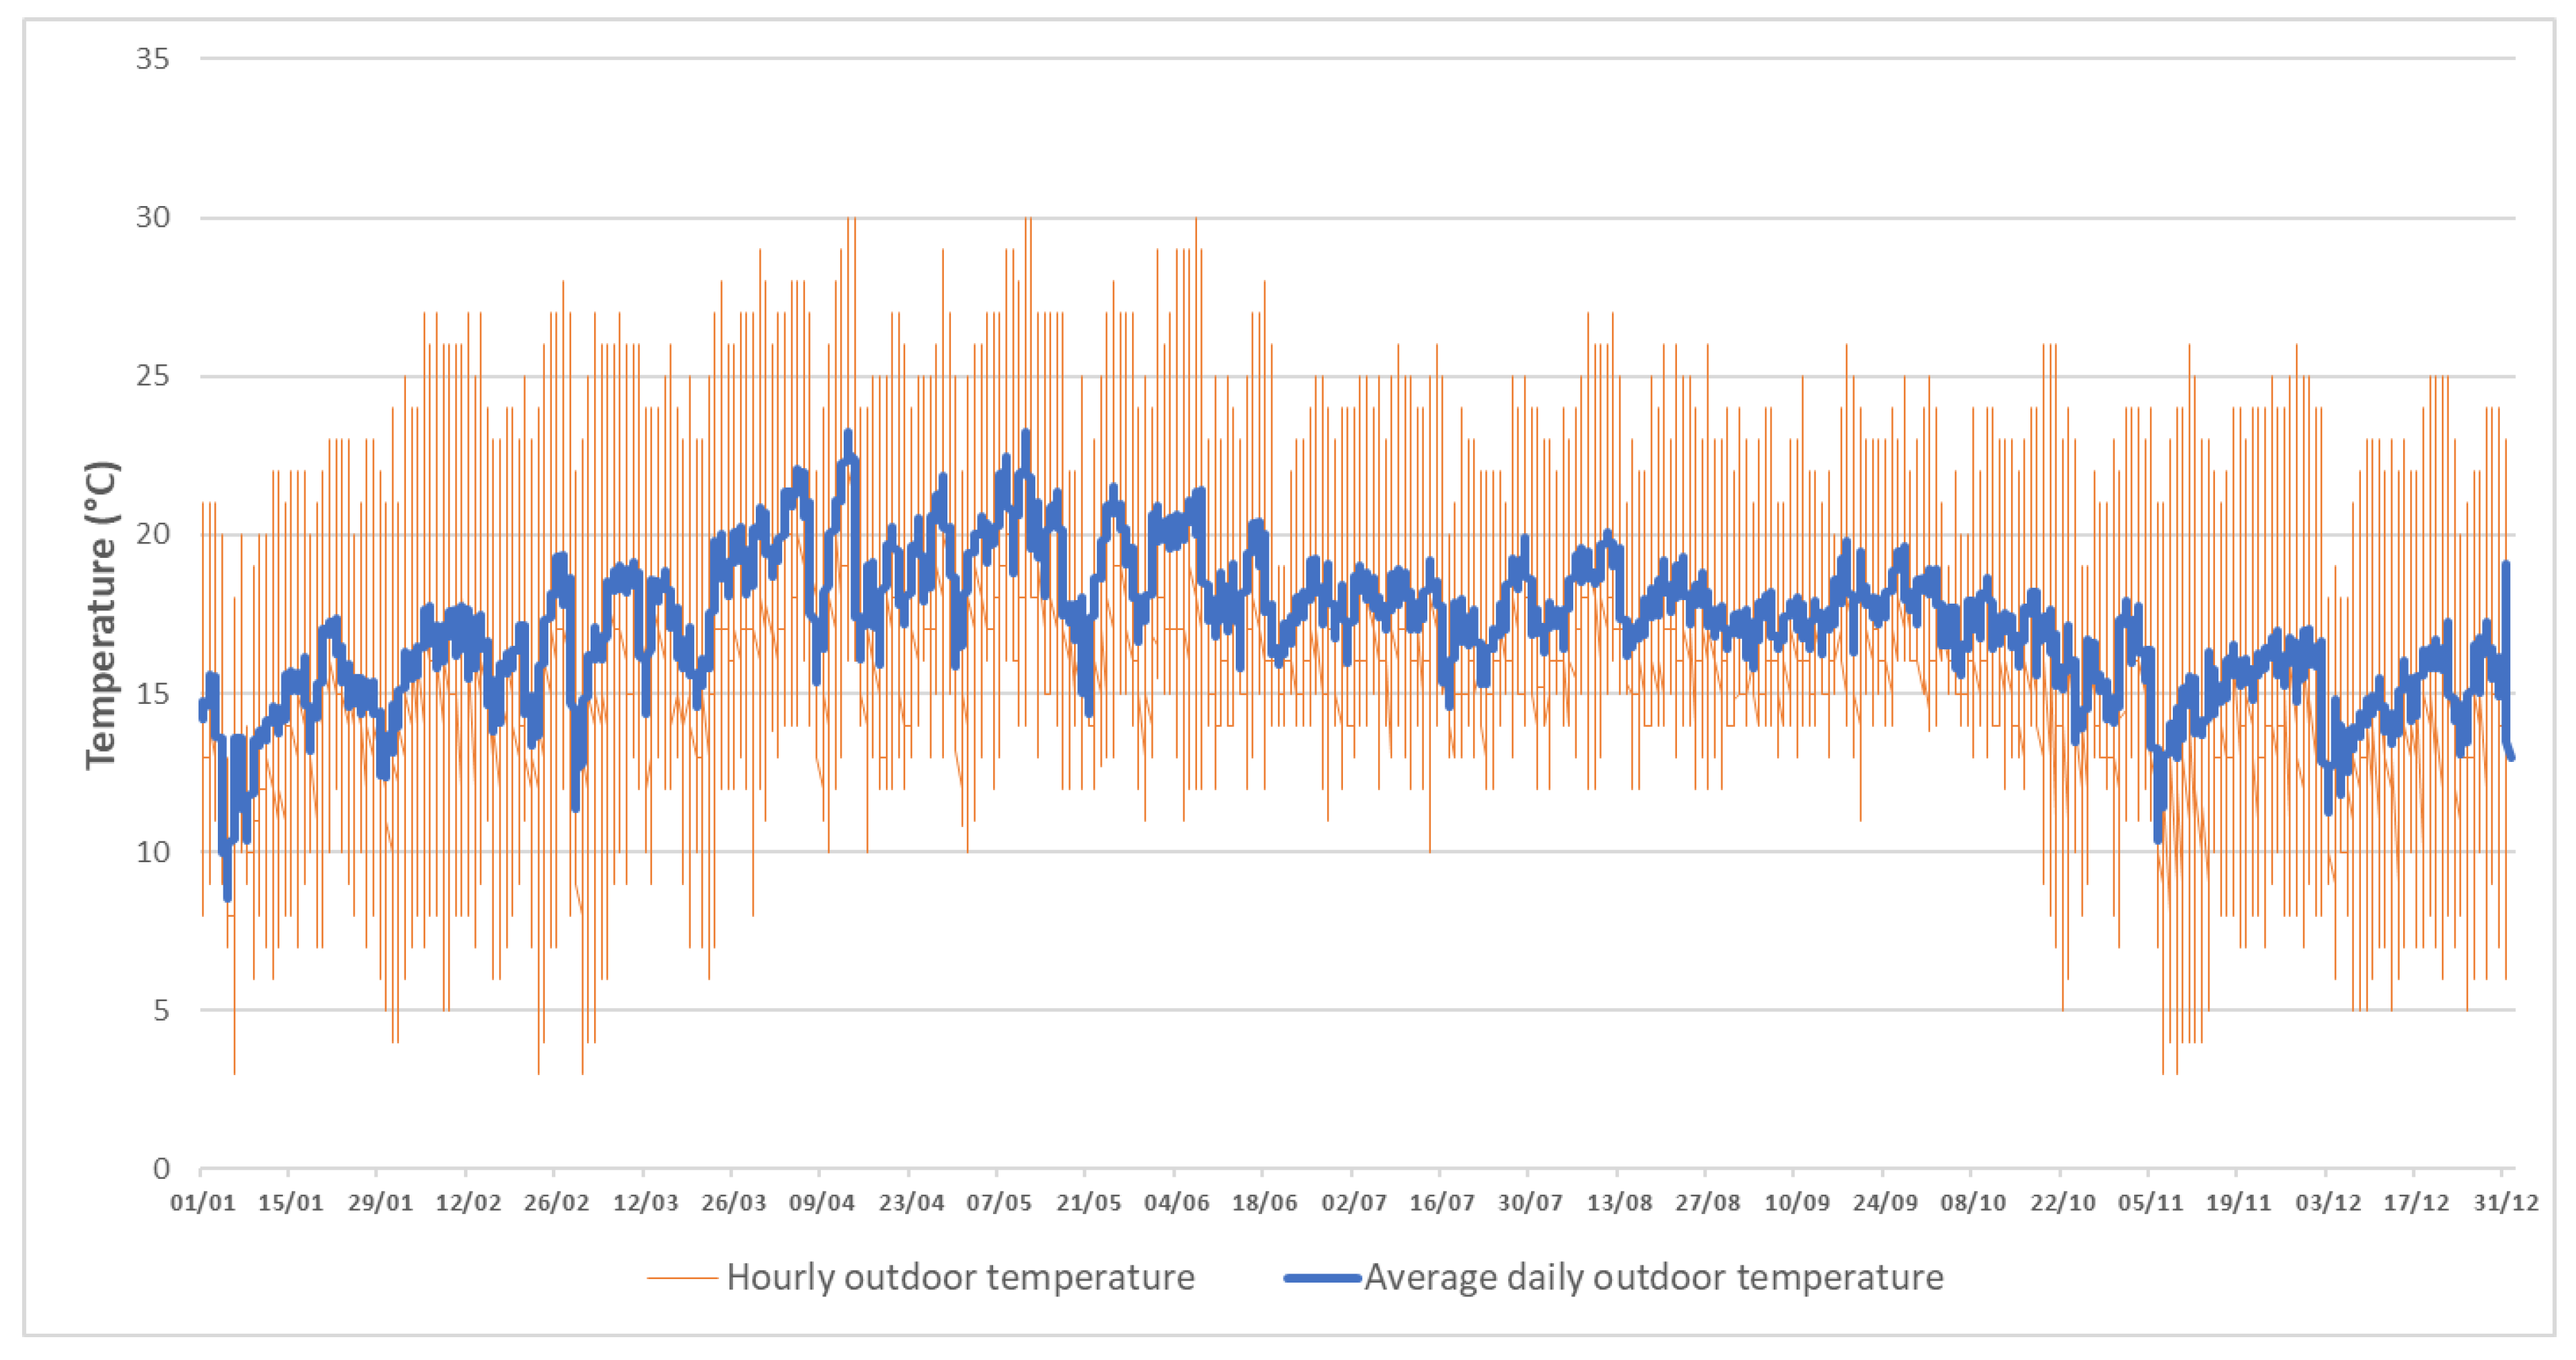
2.3. Outdoor Conditions

The first step of the calculation is getting the outdoor conditions from the EPW model, where UHI effect is considered, therefore these data are set as the first outdoor conditions of the calculation method. Mexico City is taken as case study due to its vulnerability for the UHI effect, finding a temperature difference between a rural and an urban area of 10 °C in 2010, including a temperature difference during nighttime [31]. Moreover, this city is considered because of the potential that it has to apply the proposed approaches presented here (vegetation, mainly) due to its conditions of high humidity and rainfall.
Another reason to choose Mexico City relies on the fact that it can be considered to hav a low-rise building layout, as it can be seen in Figure 6. For this kind of urban morphology, the UHI effect is more noticeable during daytime, rather than other layouts such as high-rise buildings, where the UHI effect can be noticed during nighttime, mainly [32,33]. In this sense, it is important to mention that although the urban heat waste is considered in the model as well, the direct solar radiation has a high influence on the UHI effect. Therefore, this effect is more noticeable during daytime. Nonetheless, in the BEM, the heat storage in the buildings is considered, mainly in the absorbed heat by the envelope during the day, causing thermal discomfort towards the building occupants.

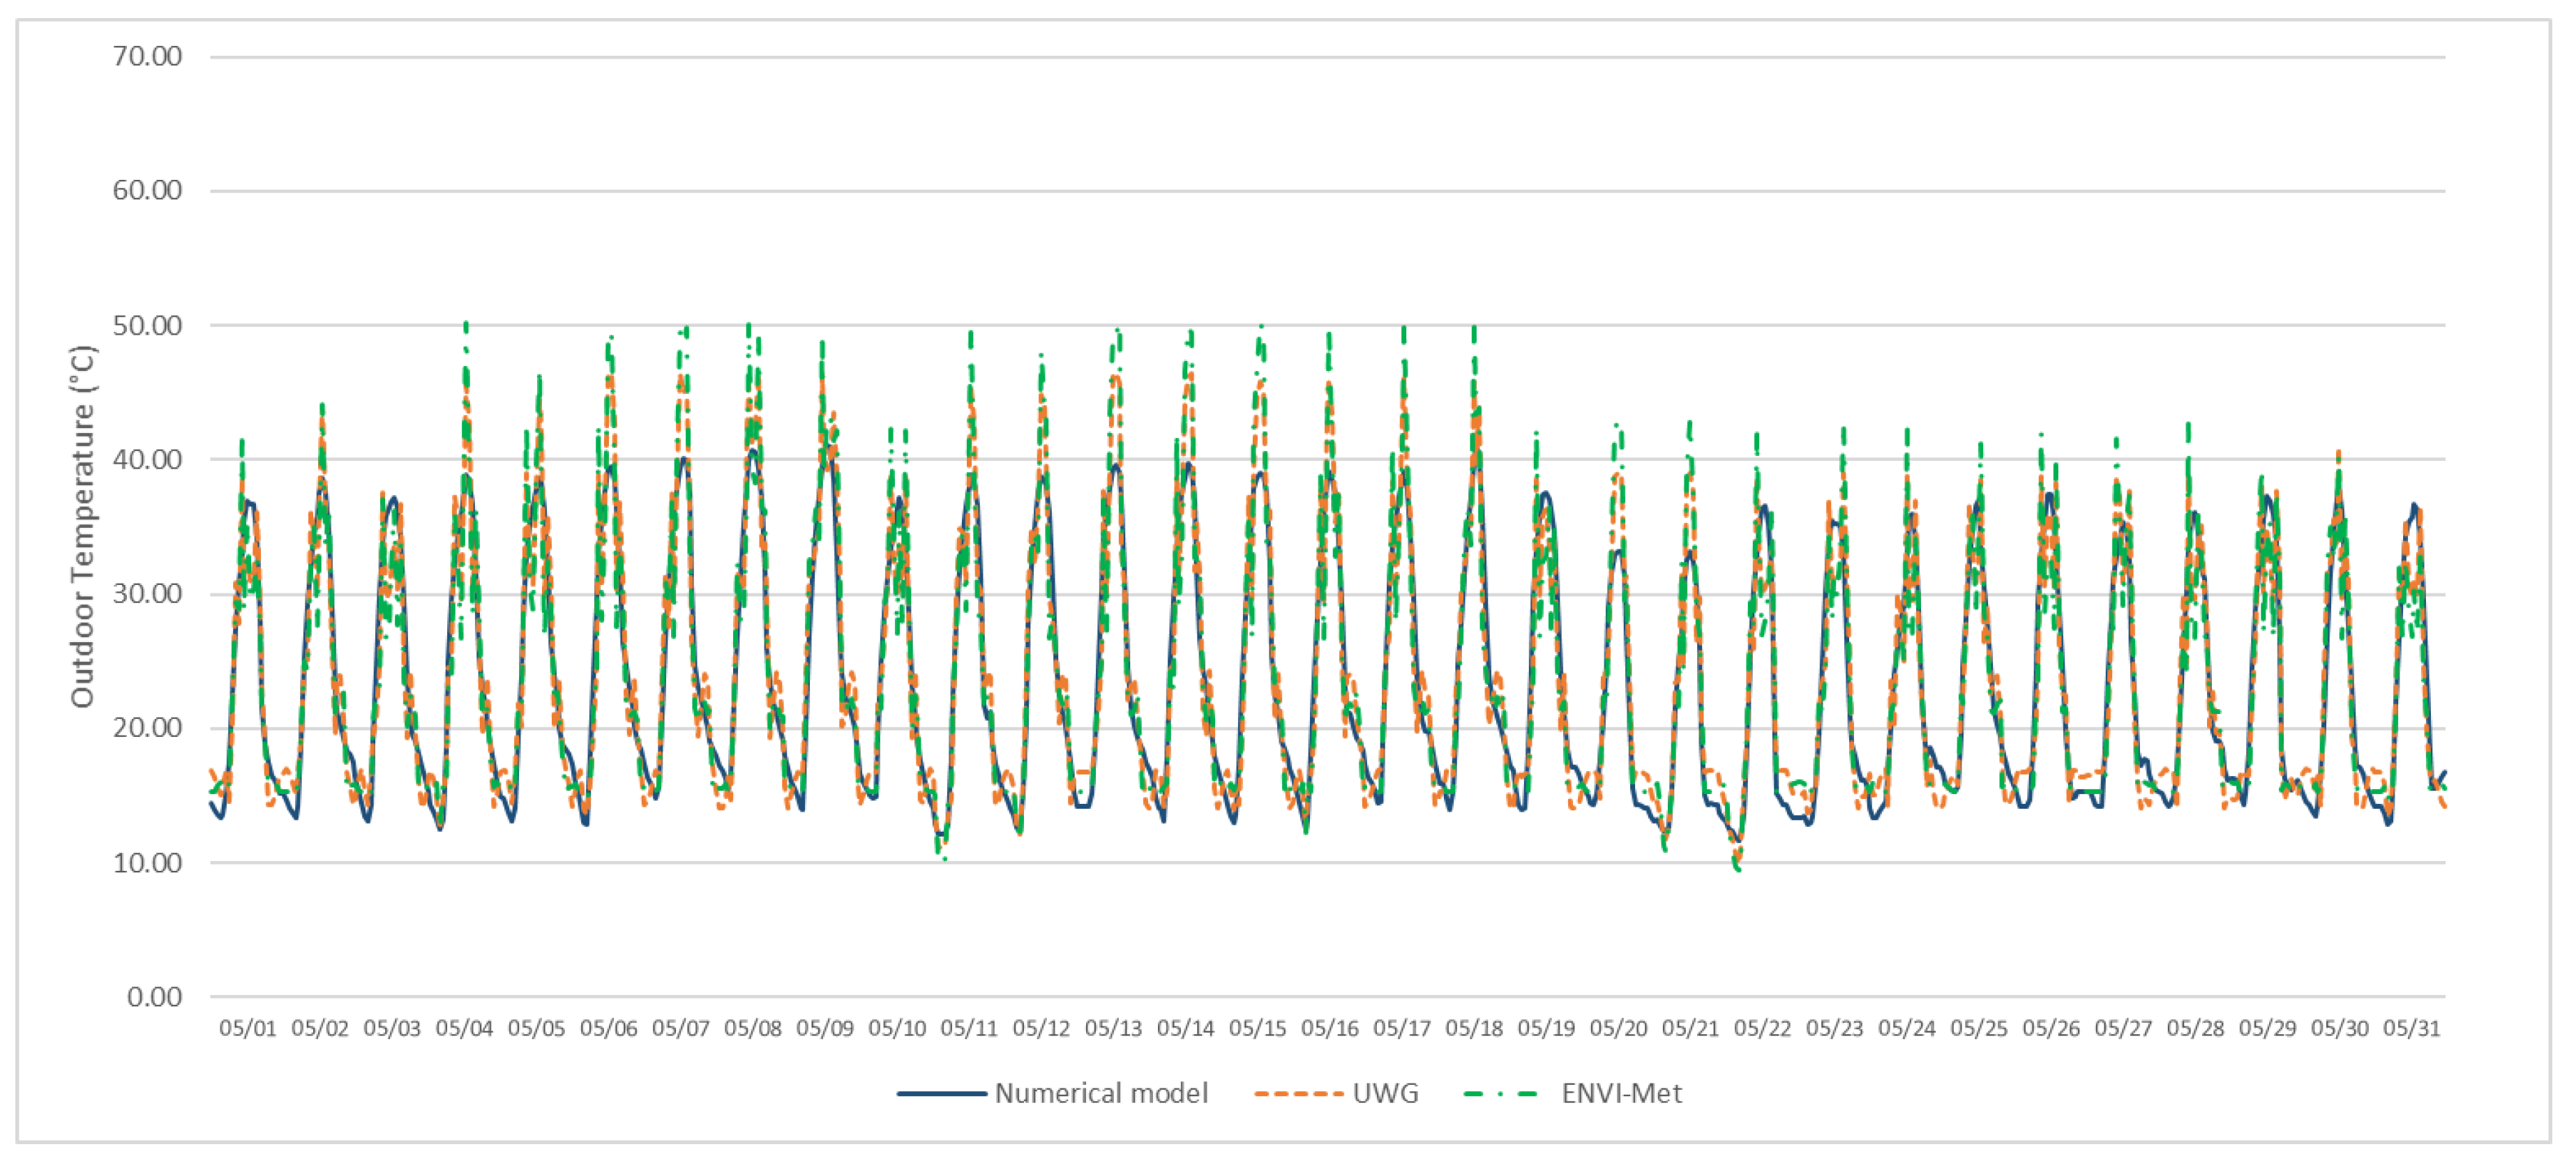
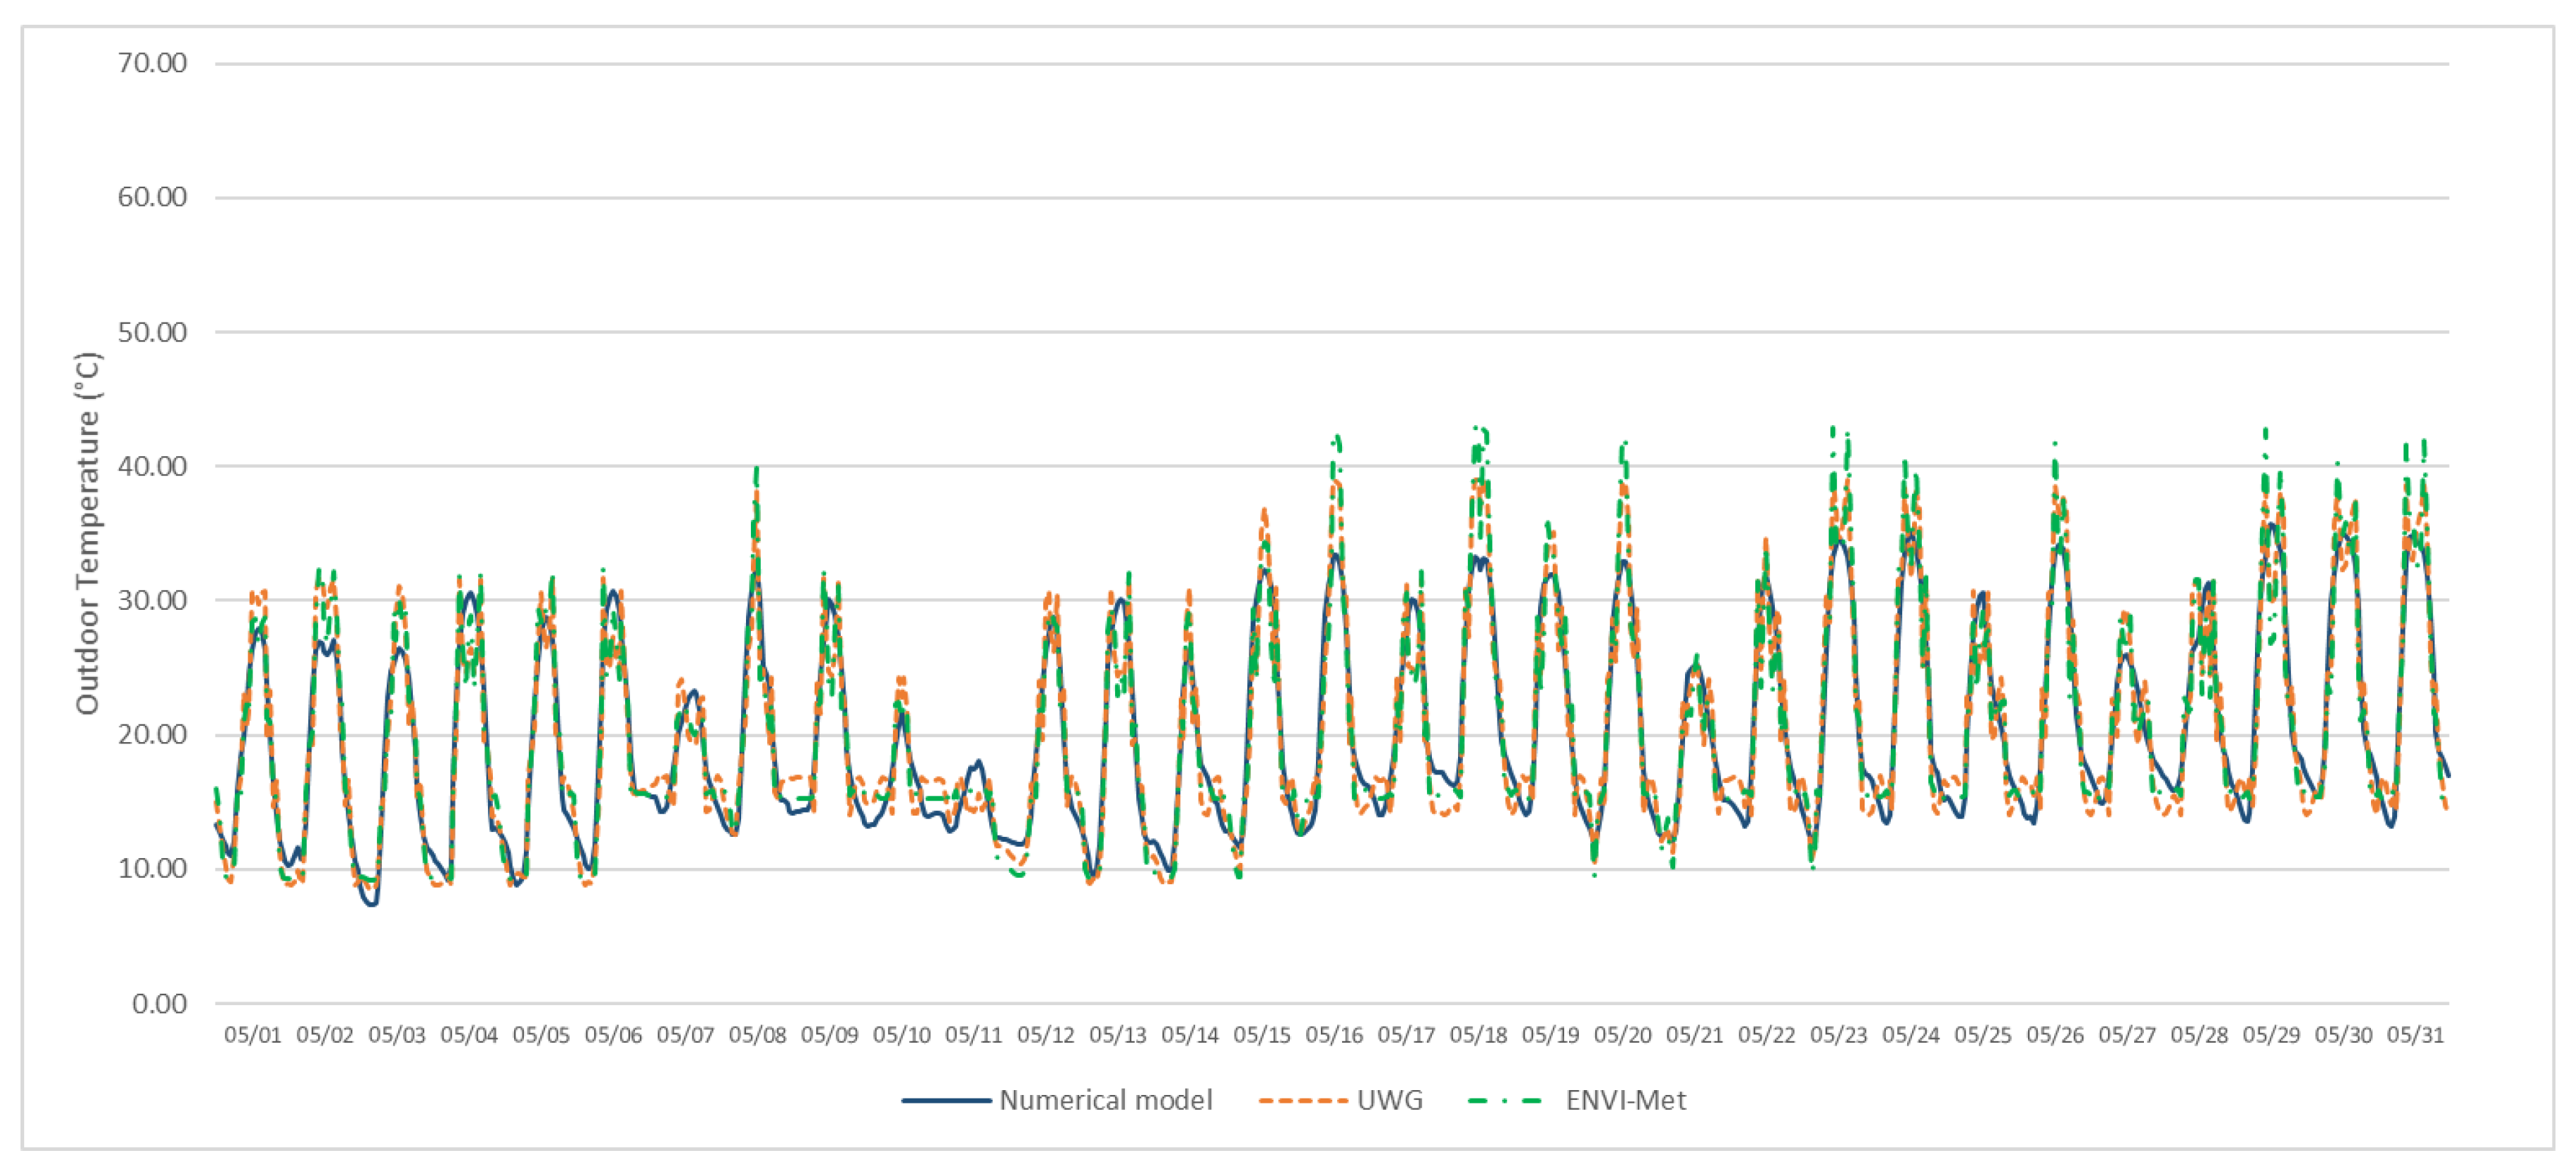
2.4. Comparison of the Numerical Model with Other Similar Models

The simplified numerical model developed here is compared to other two similar models, i.e., ENVI-met 3.1 and UWG 4.1. It is worth to mention that for ENVI-met 3.1 was obtained as a freeware program from https://envi-met.software.informer.com/3.1/ (retrieved on 2 March 2020) while UWG 4.1 was obtained from https://urbanmicroclimate.scripts.mit.edu/uwg.php (retrieved on 2 March 2020).
As an example period, a warm month is considered, i.e., May. Mexico City, Barcelona, and New Delhi were chosen since they have similar urban layouts, i.e., low-rise buildings, thus they are expected to have higher UHI effects during daytime.
In the case of the model developed here, Equations (1)–(7) were used. In the case of UWG 4.1 the weather data were created from the nearby station. Then, a .xlsm file was created according to the morphological characteristics of the site; finally, the files were run in the code of MatLab given by UWG and the EPW files considering the UHI were generated.
In the case of ENVI-met, the freeware version was run for an entire year calculating the hourly values of temperature sol-air and relative humidity with the same urban physical characteristics and urban morphology and geometry than the other two models. The input data were horizontal wind speed, air temperature, and relative humidity, using the open lateral boundary conditions approach. Furthermore, although a whole year was calculated, for comparison purposes, only the month of May was considered in this document.
For estimating the hourly sol-air temperature considering the UHI effect, the outdoor conditions for Mexico City, Barcelona, and New Delhi for the three models were taken from the EPW files of the weather stations of their respective international airports; this is considering that the climate data of these stations are still under rural conditions. Furthermore, the physical urban conditions for the three cases are as follows: One building with a general absorption of 0.7, a general transmittance of 0.9, and a convective and radiation coefficient for urban areas of 45.7 W/m2K [34]. The additional infrared radiation due to the difference between the outdoor temperature and the temperature of the apparent sky is calculated with a form factor, Fr, between the surface element and the sky. For instance, if Fr is 0.5, it means that the urban surface is completely vertical, whereas if Fr is 1.0, it means that the urban surface is completely horizontal. In this case, an Fr of 0.75 is set, considering that the layout of the surfaces of the urban area is half vertical and half horizontal, i.e., the solar radiation is received with a horizontal surface equal to the vertical surface.
The general layout of the geometry can be seen in Figure 7. In addition, in Figure 7, the boundary conditions used for the three models are shown. Furthermore, in Figure 8 the simulation made by ENVI-Met for the same case study is also displayed.
For this numerical model, the TUHW is estimated considering a waste heat of a single car of 100 W (average engine efficiency of 0.3), a volume of the space of 1500 m3 (in accordance with the urban geometry), an air density of 1.2 kg/m3, and a specific heat of the air of 1.012 kJ/kgK. Therefore, the TUHW is calculated at 1.18 °C.
Thereby, Figure 9, Figure 10 and Figure 11 show the hourly values of the sol-air temperature calculated by this numerical model and compared to results shown by ENVI-Met and UWG for Mexico City, Barcelona, and New Delhi, respectively.
As it can be seen in Figure 9, Figure 10 and Figure 11, the three models agree with the results, showing that ENVI-Met and UWG achieve higher values. This can be explained considering the high influence of the anthropogenic heat generated by the regular activities of the city and that these models calculate in a deeper manner than the numerical model developed here. Nevertheless, it can be concluded that the numerical model developed here is considered as valid, since its results are in the same order of magnitude for the three cities compared with the already-published models.

2.5. Validation of the Results for Mexico City

Regarding the validation of the results compared to data presented by [35,36,37] for Mexico City, it is noticed that the maximum temperature difference for the four documents, both for daytime and nighttime, is on the same order of magnitude as it is shown in Table 1. It is important to state that the parameters used in this document are based on the physical parameter of the urban layout (transmittance, absorption, and convective coefficient). In the three mentioned studies, the estimations were carried out with other parameters proper of the meteorological stations such as relative humidity and diffuse radiation. Nevertheless, taking account of the simplicity of the model, the results are considered as valid and useful for estimating the influence of the solutions for countering the UHI effect.

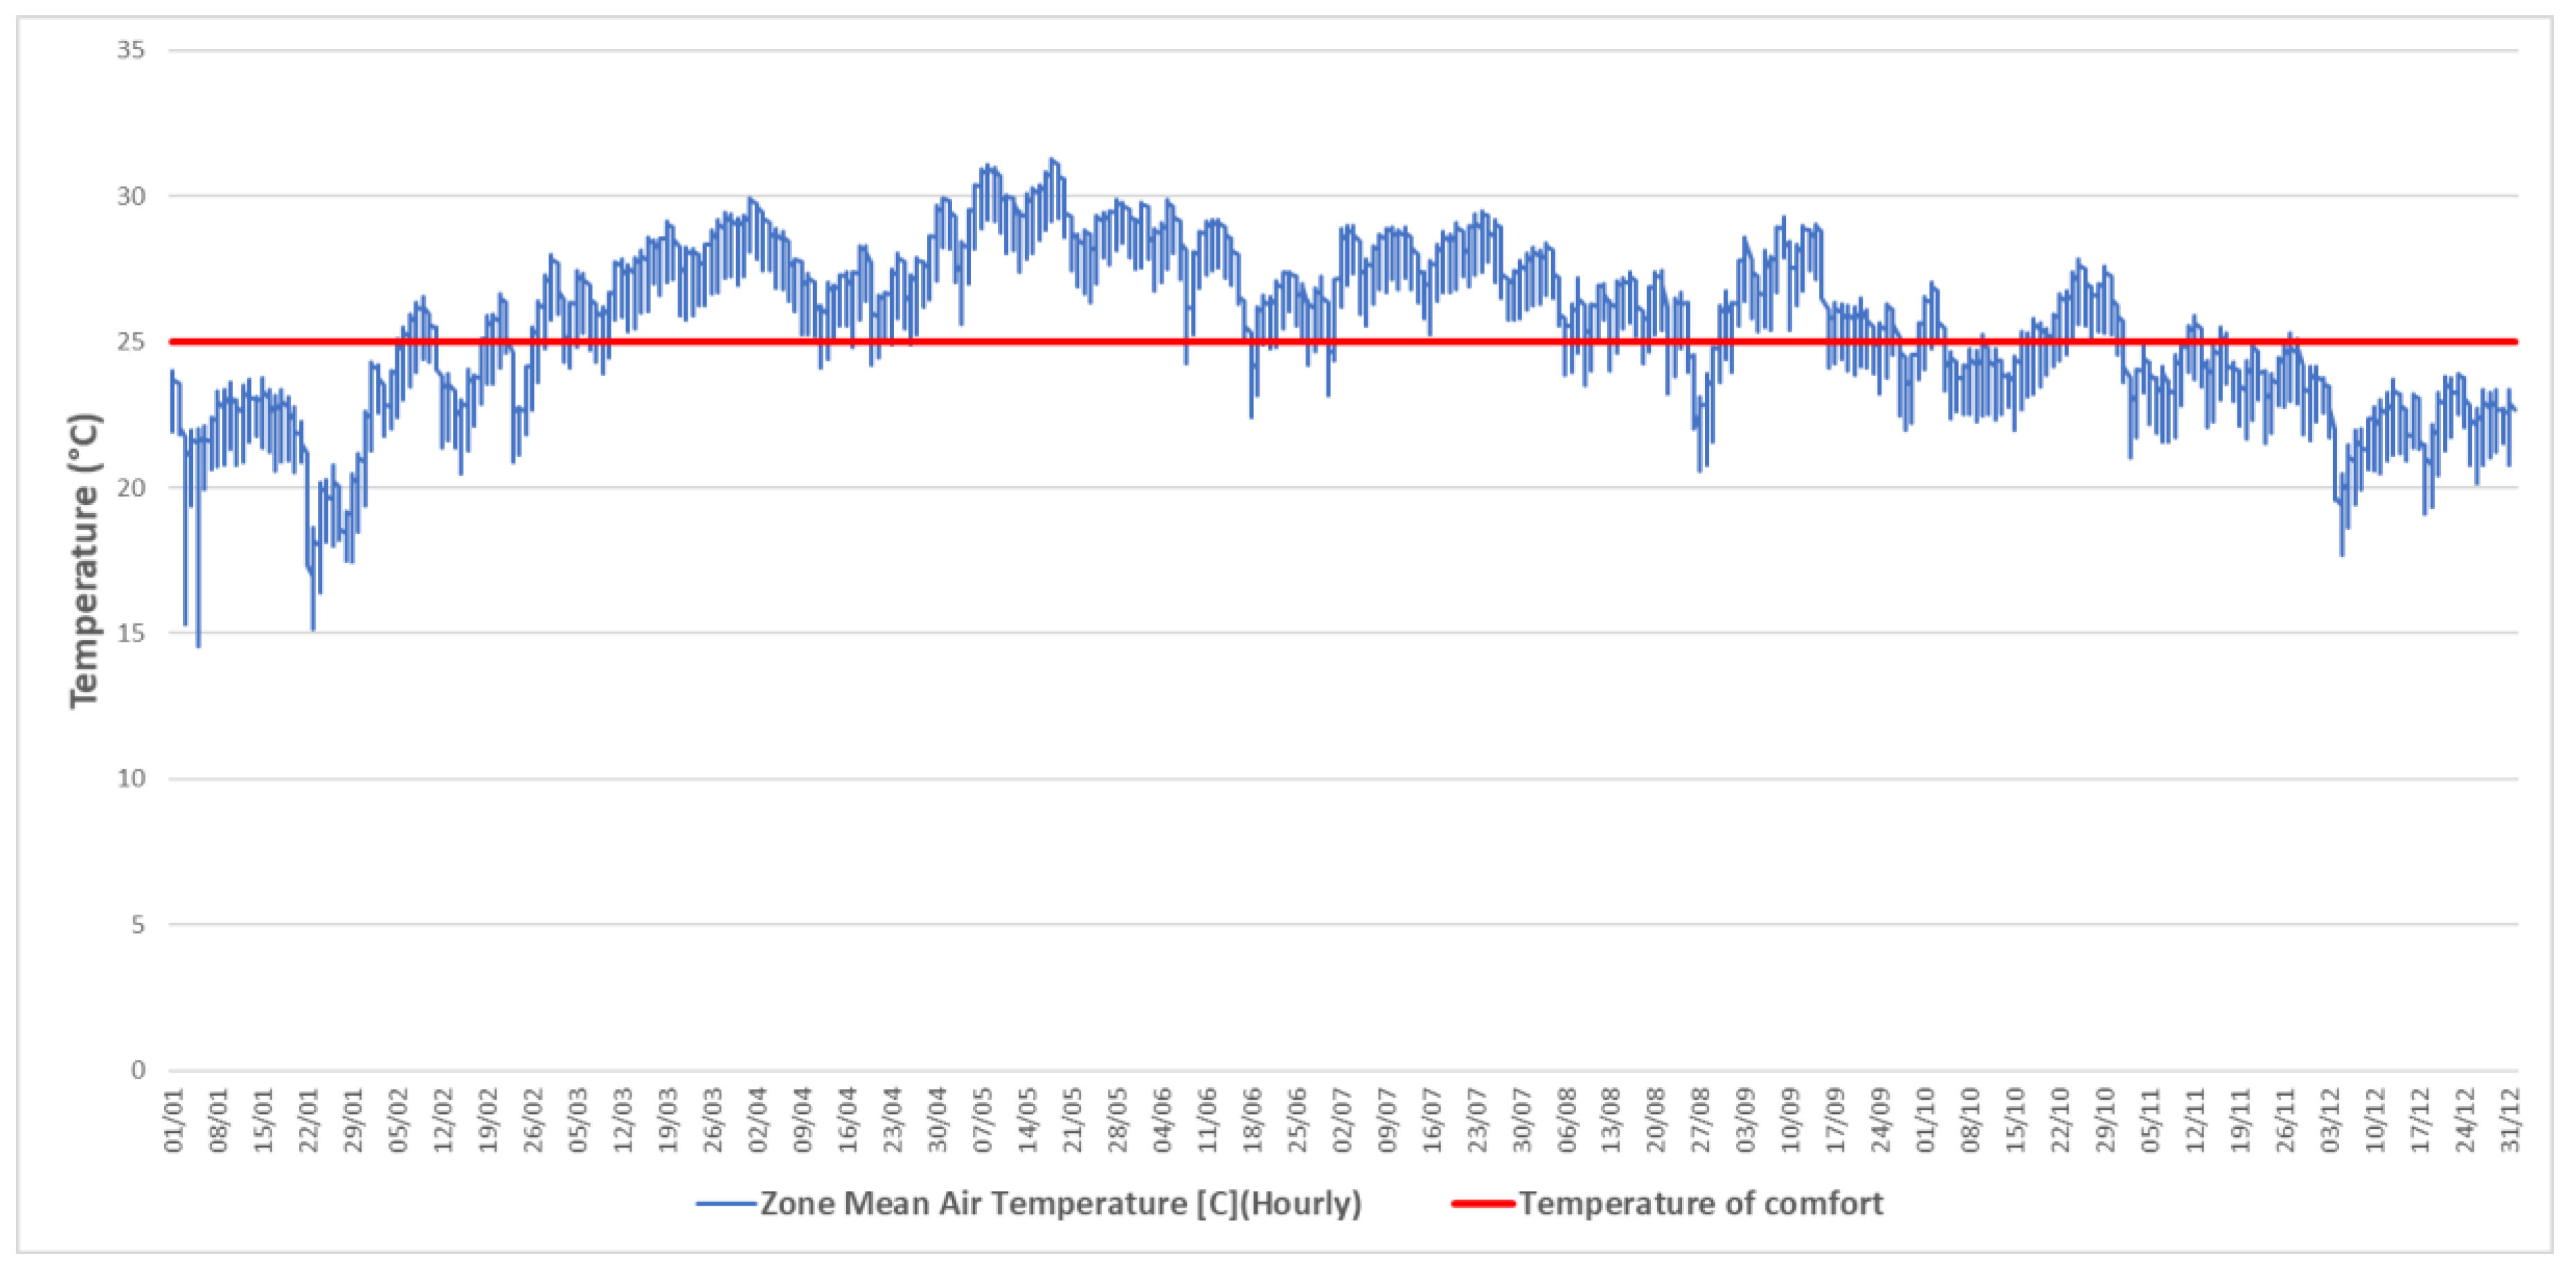
2.6. Thermal Indoor Conditions

Using an already-published simulation model of a single dwelling located in Mexico City and with its proper characteristics of construction and occupant behavior, simulations by using EnergyPlus are run to estimate the hourly indoor air temperature and indoor relative humidity, mainly [38]. The general characteristics of construction are 100 m2 of built area, 2.5 m of height, brick walls, concrete roof, 6 mm glazing windows and wooden doors. The occupancy characteristics are set as four users, a home schedule, and 1000 W of internal heat gains.
It is important to mention that the outdoor conditions with the UHI effect have influence on the BEM not only as outdoor boundary conditions, but also as other such as the absorbed heat by the building envelope that increases the indoor temperature, especially during nighttime.
Thereby, in the thermal simulation program, the function SizingPeriod:DesignDay is used with the data of sol-air temperature and relative humidity considering the UHI effect as input. A screenshot of the function in the idf Editor of EnergyPlus can be seen in Figure 12. It is worthy to mention that the idf Editor is where the input data of the model are set therefore it is in here where the temperature sol-air is set as a boundary condition.
Thereby, Figure 13 shows the results of the simulation for the year. In addition, an indoor temperature of comfort of 25 °C is set.
In Figure 13, one can see that during the year, only in the winter season is the indoor temperature below the temperature of comfort. Thereby, if an already-published tool to calculate the annual cooling demand on the building is applied [39], considering the use of a high-efficient air-conditioning unit (EER of 8.5) the energy consumption is estimated at 2.53 MWh, which in terms of money, means 228 USD, taking the current rate of electricity for Mexico City [39]. In terms of thermal discomfort hours, considering a metabolic rate of the occupants of 1 met, clothing at 0.6, and a constant wind speed of 1 m/s, and using the predicted mean vote (PMV) suitable for Mexico [40], these ones are calculated at 3880 (44.3% of the year).

3. Results and Analysis

3.1. UHI Mitigation Approaches

In order to counter the effects of urban island upon the buildings, three different approaches are proposed. All the proposals are in concordance to the solutions given by different authors. The first one consists in placing reflective materials in the street as well as in the building surfaces. These reflective materials can be porous materials, green surfaces, or low-absorption materials. Therefore, if the general absorption is decreased at 0.35 considering a white-painted building and green surfaces at its surroundings [9], Figure 14 can be displayed.
From Figure 14 one can notice that in some days of fall season the indoors conditions can reach thermal comfort. In this case, the annual cooling demand on the building is estimated at 1.80 MWh, with an expenditure of 104.5 USD at year. Also, for this case, it is estimated that 785 h are in discomfort (8.9% of the year). This low figure is explained with the fact that the occupants are able to wear less clothing therefore the thermal comfort is achieved better even if the indoor temperature is considered as high.
As a second approach, it is stated that the placement of shading vegetation blocks the solar radiation. With this, it is expected to decrease the value of solar transmittance onto the modeled building. If the general transmittance is decreased at 0.40, as it was found by [41] with zelkova serrata trees, results are shown in Figure 15. It is important to mention that the height of this vegetation is considered as sufficient to cover the low-rise building analyzed in this document.
For this case, it is noticed that the general indoor temperature is increased during almost all the year. The annual cooling demand on the building is estimated at 2.21 MWh, with an annual expenditure of 167 USD. Regarding the hours of discomfort, these are calculated at 3053 h (34.8% of the year).
The third approach of cooling is the increase of the urban convection and radiation coefficient through an urban canyon, which means an increase of this coefficient up to 52.80 W/m2K [42]. This approach is seen as the most difficult to implement, because of the deep reforms that have to be carried out upon the urban layout, placing medium- and high-rise buildings in a continuing manner on both sides of the street. Figure 16 shows the results of the indoor thermal conditions.
In Figure 16, it is found that almost all year long, the indoor temperatures are above the temperature of comfort. Thereby, the annual cooling demand on the building is estimated at 2.34 MWh, with an expenditure of 190 USD at year. Regarding the hours of discomfort, these are calculated at 3743 h (42.7% of the year).
Finally, when the three approaches are considered together (cf. Table 2), the simplified model calculates the results shown in Figure 17.
When the approaches of reducing the urban absorption and transmittance are combined, and with the increase of the convective heat transfer coefficient, an average indoor temperature decrease of 5.1 K is calculated. Also, a cooling demand for the year is estimated at 1.59 MWh. In this case, only 63 h of thermal discomfort were calculated, representing 0.72% of the year.
In Figure 14, Figure 15, Figure 16 and Figure 17, it is clearly seen that reflective materials have a more influence upon the indoor air temperature. This can be explained with the fact that the surfaces covered by reflected materials are not only placed at the urban area, but also in the building envelope, where the roof is an important element. On the other hand, the transmittance drop only has an influence upon the windows and other transparent surfaces, while an urban canyon arrangement does not remove a great amount of excess heat.
In economic terms, it is found that an average annual saving of 69 USD is estimated if the three urban approaches are applied onto Mexico City for a single building. Therefore, if it is considered that the metropolitan area of Mexico City had approximately 6.3 million dwellings in 2015 [43], without counting non-residential buildings, the initial investment on these three approaches applied on the urban scenario seems a feasible and reliable solution to the thermal discomfort upon the approximately 25 million inhabitants caused by the UHI.
Furthermore, the hours of discomfort were calculated using the PMV index and setting conditions of the building occupants as closest to reality as possible. In this sense, a usage of clothing equal to 0.6 clo was set in order to simulate the use of light clothing among the users especially when the indoor temperature is above the temperature of comfort.

3.2. Sensitivity Analysis

If a sensitivity analysis is carried out, Figure 18 can be displayed. The daily cooling demand is estimated for Mexico City at May 18th upon the modeled building used for the prior cases. When the value of the thermal absorption is varied, a transmittance of 0.9 and a convective heat transfer coefficient of 45.7 W/m2K are considered. When the value of thermal transmittance changes, an absorption of 0.7 and a convective heat transfer coefficient of 45.7 W/m2K are set up. When the convective coefficient is varied, transmittance and absorption are 0.9 and 0.7, respectively. In the case of the variation of the convective and radiative coefficient, 52.8 W/m2K is considered as 0, and 45.7 W/m2K is considered as 1. This is in accordance of the fact that the higher is the value of the coefficient, the more potential of cooling is applied.
In accordance with the results shown in Figure 14, Figure 15, Figure 16 and Figure 17, Figure 18 shows that the albedo (absorption) has a higher influence than the thermal transmittance and natural ventilation onto the indoor thermal comfort of the modeled building. Moreover, an absorption lower than 0.25 could entail an overcooling.

4. Conclusions

A simplified numerical model along with EPW files and EnergyPlus is used to calculate the thermal comfort and cooling demand within a building taking account of the UHI effect. With the numerical model developed here, a second outdoor air temperature is calculated considering the physical parameters proper of an urban area (absorption, transmittance, and convective and radiation heat). This new outdoor temperature is set as a direct input in EnergyPlus (a free-license thermal simulation program) with a commercial software (Microsoft Excel) where the hourly indoor temperature, hourly relative humidity, hourly PMV index, and annual cooling demand of a building are calculated.
The numerical model was compared with other models, i.e., UWG and ENVI-Met, and using three different cities located at three different continents, i.e., Mexico City, Barcelona, and New Delhi, finding good agreement with them in terms of outdoor temperature taking account of the UHI effect.
Thereby, for Mexico City, it is found that the effect of high albedo of the materials placed both at the urban layout and the buildings has more influence than the effect of thermal transmittance presented here as trees and urban natural ventilation through urban canyons. Nonetheless, a combination of the three approaches even further reduces the effect of UHI being reflected at thermal comfort and zero cooling demand for this day in specific, and with a considerable energy demand reduction if all year is considered. In this sense, it is highly recommended to apply at least two approaches in order to achieve indoor thermal comfort of the surrounding buildings.
Therefore, the placement of reflective materials in the streets and the buildings is highly recommended, as well as leafy trees, vegetation, and other shading methods that will help to achieve indoor thermal comfort while saving energy for not using AC systems. The use of urban canyons and other type of urban natural ventilation is recommended as well.
As a final comment, it is important to establish the limitations of the numerical model developed here compared to already-existing urban building energy modeling (UBEM) such as ENVI-met and UWG. Nonetheless, it is considered that this model would help to understand in an easier, faster, and cheaper manner the phenomenon of the UHI, and, with this analysis, to propose simple solutions according to the specific urban context that is assessed.

Funding

This research received no external funding.

Conflicts of Interest

The author declares no conflict of interest.

Nomenclature

AThermal absorption [dimensionless]
ΡAir density [kg/m3]
φRelative humidity [%]
τThermal transmittance [dimensionless]
ΔQirAdditional infrared radiation due to the difference between the outdoor temperature and the temperature of the apparent sky [W/m2]
ΔToutdoor-skyDifference between outside dry-bulb air temperature and sky mean radiant temperature [K]
CpSpecific heat of air [kJ/kgK]
FrForm factor between the element and the sky [dimensionless]
hoCoefficient of heat transfer by radiation and convection [W/m2K]
hrExternal radiative heat transfer coefficient [W/m2K]
ICIncident solar radiation [W/m2]
IGGlobal solar radiation [W/m2]
PvActual vapor density [g/m3]
PvsSaturation vapor density [g/m3]
TdTemperature of dew point [°C]
ToOutdoor air temperature [°C]
Tsol-airTemperature sol-air [°C]
TUHWTemperature due to urban heat waste [°C]
VVolume of the space of motor traffic [m3]
WHWaste heat [W]

References

  1. Li, X.; Zhou, Y.; Yu, S.; Jia, G.; Li, H.; Li, W. Urban heat island impacts on building energy consumption: A review of approaches and findings. Energy 2019, 174, 407–419. [Google Scholar] [CrossRef]
  2. Mirzae, P.A. Recent challenges in modeling of urban heat island. Sustain. Cities Soc. 2015, 19, 200–206. [Google Scholar] [CrossRef] [Green Version]
  3. Hirano, Y.; Fujita, T. Simulating the CO2 reduction caused by decreasing the airconditioning load in an urban area. Energy Build. 2016, 114, 87–95. [Google Scholar] [CrossRef]
  4. Morini, E.; Touchaei, A.G.; Rossi, F.; Cotana, F.; Akbari, H. Evaluation of albedo enhancement to mitigate impacts of urban heat island in Rome (Italy) using WRF meteorological model. Urban Clim. 2018, 24, 551–566. [Google Scholar] [CrossRef]
  5. Yuan, J.; Emura, K.; Farnham, C.; Sakai, H. Application of glass beads as retro-reflective facades for urban heat island mitigation: Experimental investigation and simulation analysis. Build. Environ. 2016, 105, 140–152. [Google Scholar] [CrossRef]
  6. Fabiani, C.; Pisello, A.L.; Bou-Zeid, E.; Yang, J.; Cotana, F. Adaptive measures for mitigating urban heat islands: The potential of thermochromic materials to control roofing energy balance. Appl. Energy 2019, 247, 155–170. [Google Scholar] [CrossRef]
  7. Li, X.; Zhou, W. Optimizing urban greenspace spatial pattern to mitigate urban heat island effects: Extending understanding from local to the city scale. Urban For. Urban Green. 2019, 41, 255–263. [Google Scholar] [CrossRef]
  8. Targino, A.C.; Coraiola, G.C.; Krecl, P. Green or blue spaces? Assessment of the effectiveness and costs to mitigate the urban heat island in a Latin American city. Theor. Appl. Climatol. 2019, 136, 971–984. [Google Scholar] [CrossRef]
  9. Hirano, Y.; Ihara, T.; Gomi, K.; Fujita, T. Simulation-Based evaluation of the effect of green roofs in office building districts on mitigating the urban heat island effect and reducing CO2 emissions. Sustainability 2019, 11, 2055. [Google Scholar] [CrossRef] [Green Version]
  10. Manni, M.; Lobaccaro, G.; Goia, F.; Nicolini, A. An inverse approach to identify selective angular properties of retro-reflective materials for urban heat island mitigation. Sol. Energy 2018, 176, 194–210. [Google Scholar] [CrossRef]
  11. Shen, L.; Sun, J.; Yuan, R. Idealized large-eddy simulation study of interaction between urban heat island and sea breeze circulations. Atmos. Res. 2018, 214, 338–347. [Google Scholar] [CrossRef]
  12. Chen, F.; Yang, X.; Zhu, W. WRF simulations of urban heat island under hot-weather synoptic conditions: The case study of Hangzhou City, China. Atmos. Res. 2014, 138, 364–377. [Google Scholar] [CrossRef]
  13. Giannaros, C.; Nenes, A.; Giannaros, T.M.; Kourtidis, K. A comprehensive approach for the simulation of the Urban Heat Island Effect with the WRF/SLUCM modeling system: The case of Athens (Greece). Atmos. Res. 2018, 201, 86–101. [Google Scholar] [CrossRef]
  14. Jandaghian, Z.; Touchaei, A.G.; Akbari, H. Sensitivity analysis of physical parameterizations in WRF for urban climate simulations and heat island mitigation in Montreal. Urban Clim. 2018, 24, 577–599. [Google Scholar] [CrossRef]
  15. Li, H.; Zhou, Y.; Wang, X.; Zhou, X.; Zhang, H.; Sodoudi, S. Quantifying urban heat island intensity and its physical mechanism using WRF/UCM. Sci. Total Environ. 2019, 650, 3110–3119. [Google Scholar] [CrossRef] [PubMed]
  16. Naboni, E.; Meloni, M.; Coccolo, S.; Kaempf, J.; Scartezzini, J.-L. An overview of simulation tools for predicting the mean radiant temperature in an outdoor space. Energy Procedia 2017, 122, 1111–1116. [Google Scholar] [CrossRef]
  17. Crank, P.J.; Sailor, D.J.; Ban-Weiss, G.; Mohammad, T. Evaluating the ENVI-met microscale model for suitability in analysis of targeted urban heat mitigation strategies. Urban Clim. 2018, 26, 188–197. [Google Scholar] [CrossRef]
  18. Fisher, D.E.; Liesen, R.J.; Buhl, W.F.; Huang, Y.J.; Pedersen, C.O.; Glazer, J.; Crawley, D.B.; Winkelmann, F.C.; Witte, M.J.; Strand, R.K.; et al. EnergyPlus: Creating a new-generation building energy simulation program. Energy Build. 2002, 33, 319–331. [Google Scholar]
  19. Jentsch, M.F.; Bahaj, A.S.; James, P.A. Climate change future proofing of buildings—Generation and assessment of building simulation weather files. Energy Build. 2008, 40, 2148–2168. [Google Scholar] [CrossRef]
  20. Liu, C. Future weather data set for fourteen UK sites. Data Brief 2016, 8, 1308–1310. [Google Scholar] [CrossRef] [Green Version]
  21. Jentsch, M.F.; James, P.A.; Bourikas, L.; Bahaj, A.S. Transforming existing weather data for worldwide locations to enable energy and building performance simulation under future climates. Renew. Energy 2012, 55, 514–524. [Google Scholar] [CrossRef]
  22. Roudsari, M.S.; Pak, M. Ladybug: A parametric environmental plugin for grasshopper to help designers create an environmentally-conscious design. In Proceedings of the BS 2013: 13th Conference of the International Building Performance Simulation Association, Chambéry, France, 26–28 August 2013; pp. 3128–3135. [Google Scholar]
  23. Zhu, M.; Pan, Y.; Huang, Z.; Xu, P.; Sha, H. Future hourly weather files generation for studying the impact of climate change on building energy demand in China. In Proceedings of the BS 2013: 13th Conference of the International Building Performance Simulation Association, Chambéry, France, 26–28 August 2013; pp. 967–974. [Google Scholar]
  24. Candanedo, J.A.; Paradis, É.; Stylianou, M. Building simulation weather forecast files for predictive control strategies. Simul. Ser. 2013, 45, 22–27. [Google Scholar]
  25. Yang, X.; Tao, J.; Lingye, Y.; Zhu, C.; Penga, L.L. Assessing the impact of urban heat island effect on building cooling load based on the local climate zone scheme. Procedia Eng. 2017, 205, 2839–2846. [Google Scholar] [CrossRef]
  26. Resende Santosa, L.G.; Afsharia, A.; Norfordb, L.K.; Maob, J. Evaluating approaches for district-wide energy model calibration considering the Urban Heat Island effect. Appl. Energy 2015, 215, 31–40. [Google Scholar] [CrossRef]
  27. Evangelisti, L.; Guattari, C.; Gori, P.; Bianchi, F. Heat transfer study of external convective and radiative coefficients for building applications. Energy Build. 2017, 151, 429–438. [Google Scholar] [CrossRef]
  28. Wanielista, M.; Kersten, R.; Eaglin, R. Hydrology Water Quantity and Quality Control; John Wiley & Sons: London, UK, 1997. [Google Scholar]
  29. Bueno, B.; Norford, L.; Hidalgo, J.; Pigeon, G. The urban weather generator. J. Build. Perform. Simul. 2013, 6, 269–281. [Google Scholar] [CrossRef]
  30. Nakano, A.; Bueno, B.; Norford, L.; Reinhart, C.F. Urban weather generator—A novel workflow for integrating urban heat island effect within urban design process. In Proceedings of the BS2015: 14th Conference of International Building Performance Simulation Association, Hyderabad, India, 7–9 December 2015. [Google Scholar]
  31. Matsumoto, Y.; Valdes, M.; Urbano, J.A.; Kobayashi, T.; Lopez, G.; Peña, R. Global solar irradiation in north Mexico City and some comparisons with the south. Energy Procedia 2014, 57, 1179–1188. [Google Scholar] [CrossRef] [Green Version]
  32. Wang, K.; Li, Y.; Li, Y.; Lin, B. Stone forest as a small-scale field model for the study of urban climate. Int. J. Climatol. 2018, 38, 3723–3731. [Google Scholar] [CrossRef]
  33. Li, Y.; Luo, Z.; Yin, S.; Chan, P.W. Harmonic analysis of 130-year hourly air temperature in Hong Kong: Detecting urban warming from the perspective of annual and daily cycles. Clim. Dyn. 2018, 51, 613–625. [Google Scholar]
  34. Rosso, F.; Golasi, I.; Castaldo, V.L.; Piselli, C.; Pisello, A.L.; Salata, F.; Ferrero, M.; Cotana, F.; Vollaro, A.L. On the impact of innovative materials on outdoor thermal comfort of pedestrians in historical urban canyons. Renew. Energy 2018, 118, 825–839. [Google Scholar] [CrossRef]
  35. Jauregui, E. Heat island development in Mexico City. Atmos. Environ. 1997, 31, 3821–3831. [Google Scholar] [CrossRef]
  36. Ballinas, M.; Barradas, V. The actual urban heat island in Mexico City. In Proceedings of the 8th International Conference on Urban Climate, Dublin, UK, 6–l0 August 2012; pp. 173–183. [Google Scholar]
  37. Barradas, V.L.; Tejeda-Martinez, A.; Jauregui, E. Energy balance measurements in a suburban vegetated area in Mexico City. In Proceedings of the International Conference on Urban Climatology, Essen, Germany, 11–14 June 1999; pp. 4109–4113. [Google Scholar]
  38. Oropeza-Perez, I.; Ostergaard, P.A.; Remmen, A. Model of natural ventilation by using a coupled thermal-airflow simulation program. Energy Build. 2012, 49, 388–393. [Google Scholar] [CrossRef]
  39. Oropeza-Perez, I. Development of a cooling-load calculator for the Mexican conditions of climate, construction and occupancy. Procedia Eng. 2017, 205, 1115–1122. [Google Scholar] [CrossRef]
  40. Oropeza-Perez, I.; Petzold-Rodriguez, A.H.; Bonilla-Lopez, C. Adaptive thermal comfort in the main Mexican climate conditions with and without passive cooling. Energy Build. 2017, 145, 251–258. [Google Scholar] [CrossRef]
  41. Oshio, H.; Asawa, T. Estimating the solar transmittance of urban trees using airborne LiDAR and radiative transfer simulation. IEEE Trans. Geosci. Remote Sens. 2016, 54, 5483–5492. [Google Scholar] [CrossRef]
  42. Battista, G. Analysis of convective heat transfer at building facades in street canyons. Energy Procedia 2017, 113, 166–173. [Google Scholar] [CrossRef]
  43. Mexican National Institute of Statistics and Geography (INEGI, initials in Spanish). Available online: https://www.inegi.org.mx/temas/vivienda/ (accessed on 26 March 2020).
Figure 1. Main heat flows (white font) and parameter that influence the heat flows (orange font) of an urban heat island.
Urbansci 04 00030 g001
Figure 2. Top-down calculation method of indoor thermal comfort considering an urban heat island by using a simplified numerical model.
Urbansci 04 00030 g002
Figure 3. Hourly outdoor air temperature and average outdoor temperature of the typical meteorological year (TMY) of Mexico City based on its EnergyPlus weather (EPW) files.
Urbansci 04 00030 g003
Figure 4. Hourly relative humidity and average relative humidity of the TMY of Mexico City based on its EPW files.
Urbansci 04 00030 g004
Figure 5. Hourly global solar irradiance of the TMY of Mexico City based on its EPW files.
Urbansci 04 00030 g005
Figure 6. General overview of the Mexico City urban layout (source: gettyimages.com).
Urbansci 04 00030 g006
Figure 7. Geometry and boundary conditions of the urban layout for the comparison analysis.
Urbansci 04 00030 g007
Figure 8. Geometry and boundary conditions (red square) of the urban layout using ENVI-Met.
Urbansci 04 00030 g008
Figure 9. Hourly outdoor temperatures for May on Mexico City comparing the numerical model developed here, urban weather generator (UWG), and ENVI-Met.
Urbansci 04 00030 g009
Figure 10. Hourly outdoor temperatures for May on Barcelona comparing the numerical model developed here, UWG, and ENVI-Met.
Urbansci 04 00030 g010
Figure 11. Hourly outdoor temperatures for May on New Delhi comparing the numerical model developed here, UWG, and ENVI-Met.
Urbansci 04 00030 g011
Figure 12. Function of EnergyPlus to overwrite the daily outdoor conditions considering the urban heat island (UHI) effect and its variations.
Urbansci 04 00030 g012
Figure 13. Annual indoor temperatures considering the UHI effect.
Urbansci 04 00030 g013
Figure 14. Annual indoor temperatures considering an urban absorption of 0.35.
Urbansci 04 00030 g014
Figure 15. Annual indoor temperatures considering an urban transmittance of 0.40.
Urbansci 04 00030 g015
Figure 16. Annual indoor temperatures considering an urban convective coefficient of 52.80 W/m2K.
Urbansci 04 00030 g016
Figure 17. Annual indoor temperatures considering three urban approaches to decrease the UHI effect.
Urbansci 04 00030 g017
Figure 18. Sensitivity analysis of cooling demand varying thermal absorption, thermal transmittance, and convective heat transfer coefficient.
Urbansci 04 00030 g018
Table 1. Comparison of maximum difference of temperature with and without heat island of four studies.
DocumentMaximum Temperature Difference—Daytime [°C]Maximum Temperature Difference—Nighttime [°C]
Jauregui8.77.8
Ballinas et al.10.06.0
Barradas et al.10.5N/A
This document10.37.3
Table 2. Parameters of calculation to decrease the UHI effect.
ParameterOriginal ValueMitigation Value
Absorption [dimensionless]0.70.35
Transmittance [dimensionless]0.90.40
Convective coefficient [W/m2K]45.752.8

