Radiosity from Individual Urban Landscape Elements Measured Using a Modified Low-Cost Temperature Sensor

 ,
, 

Abstract
1. Introduction
2. Materials and Methods
2.1. Study Design Phase 1 (Small LEs)
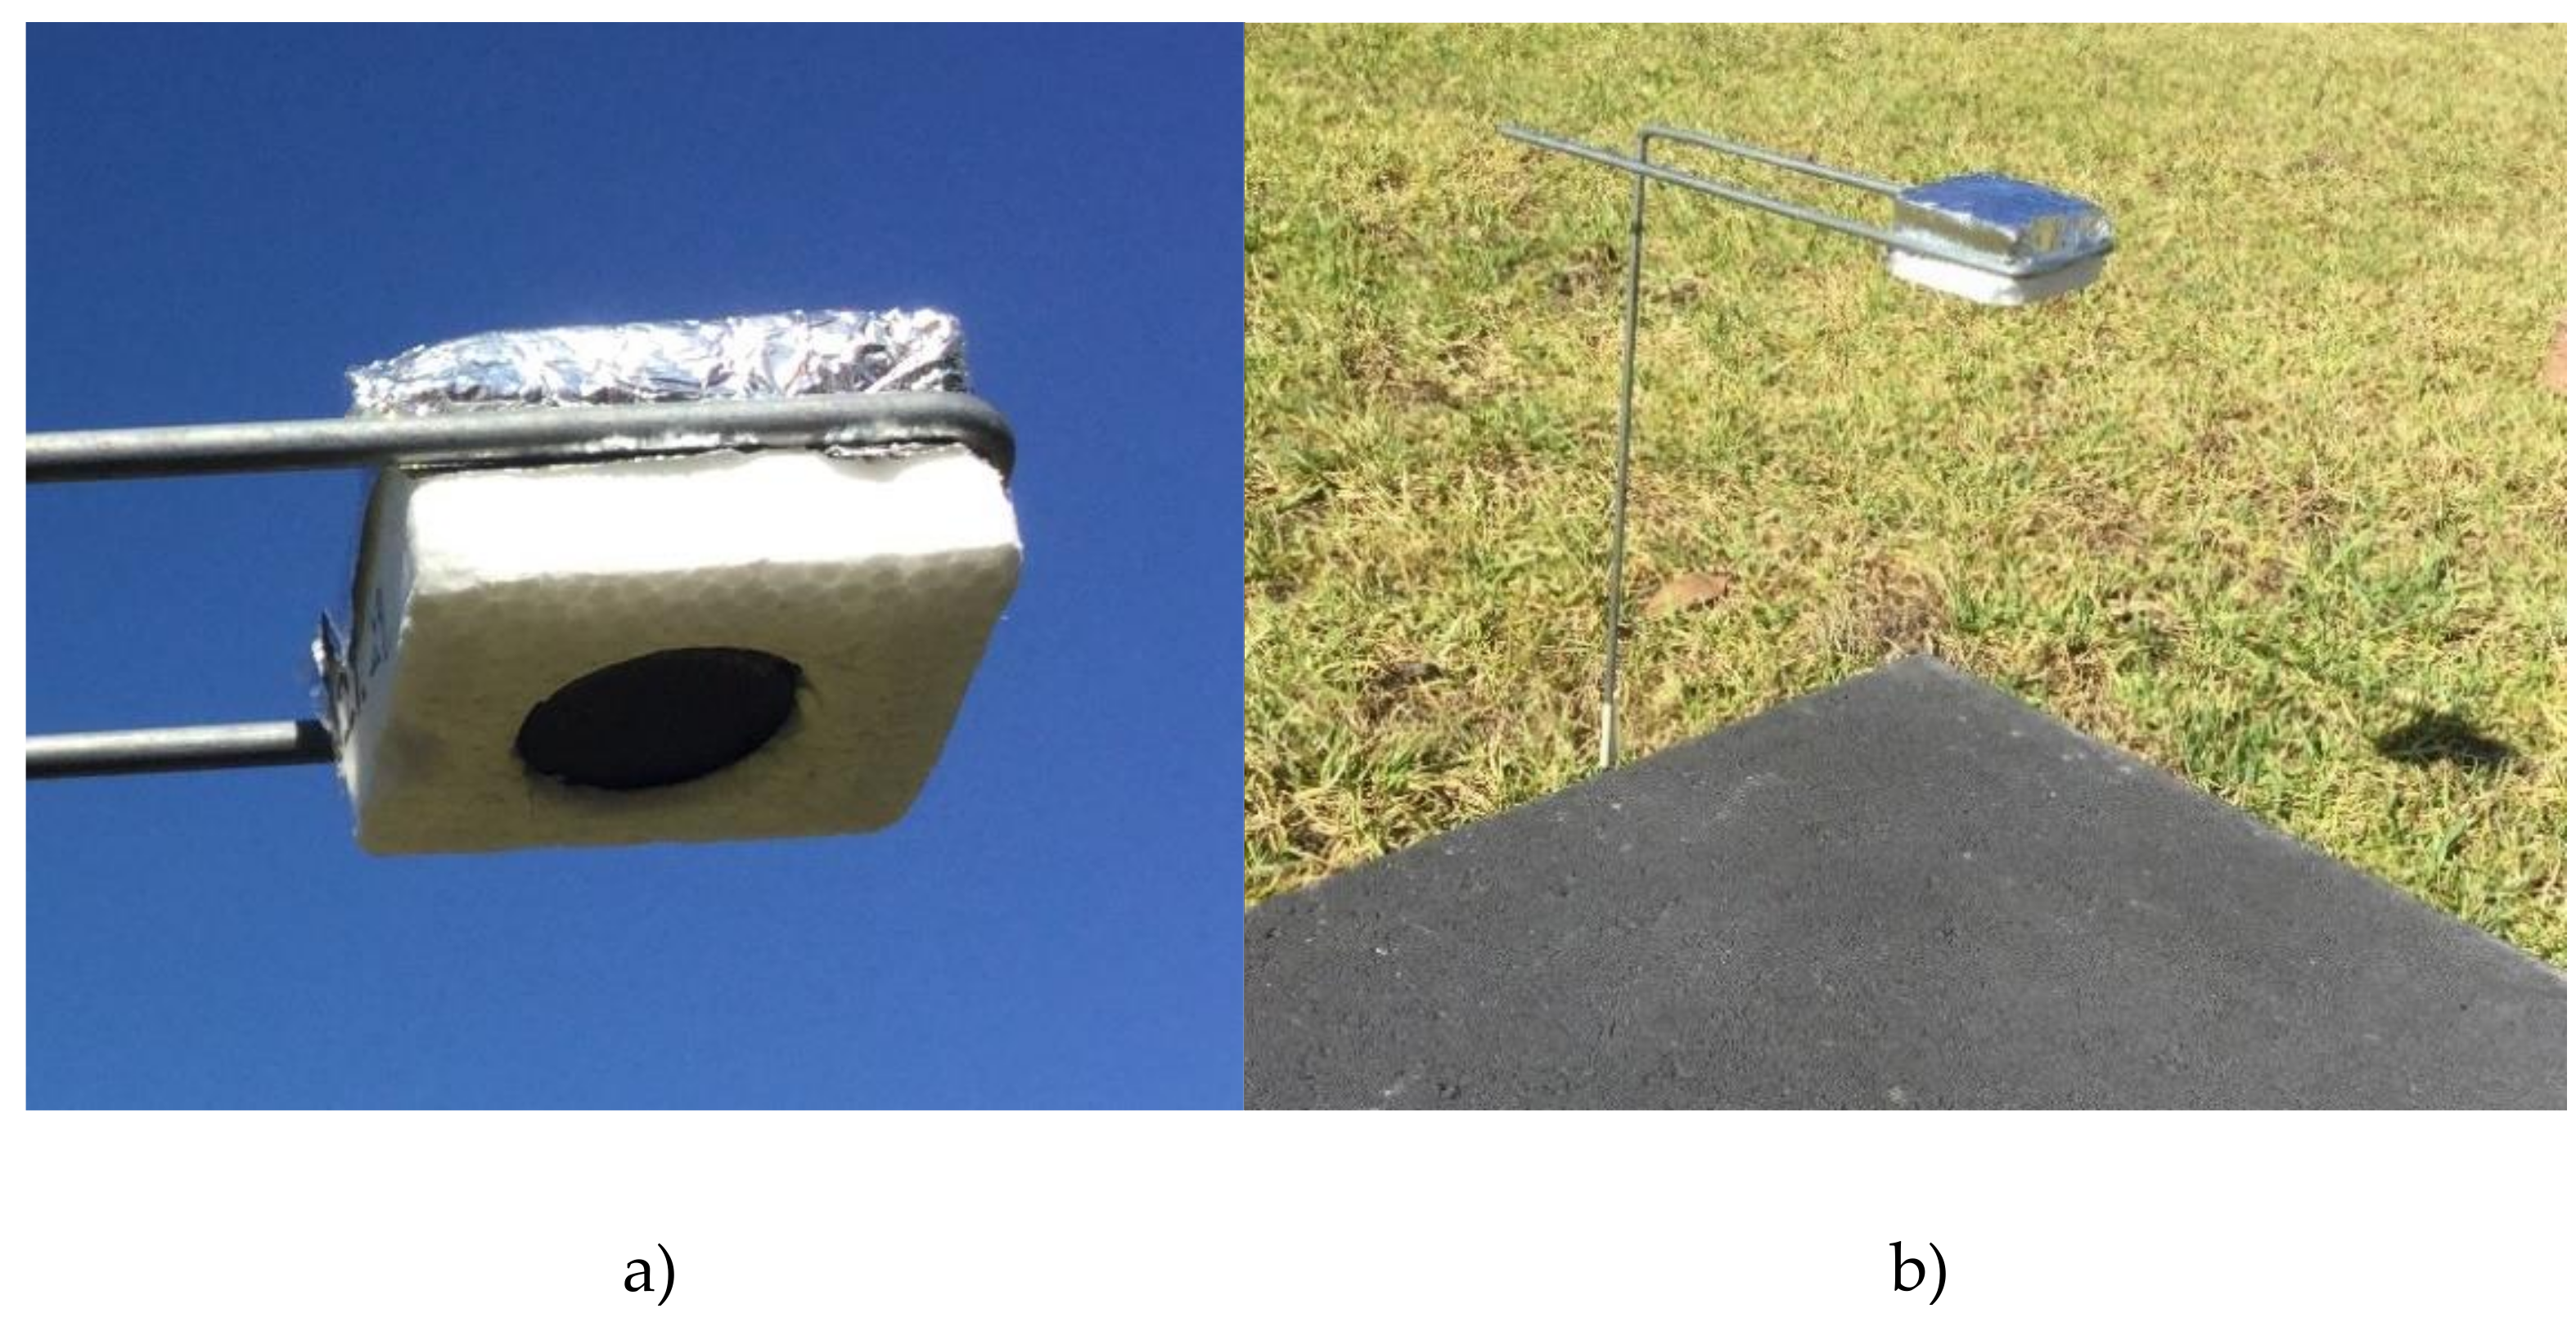
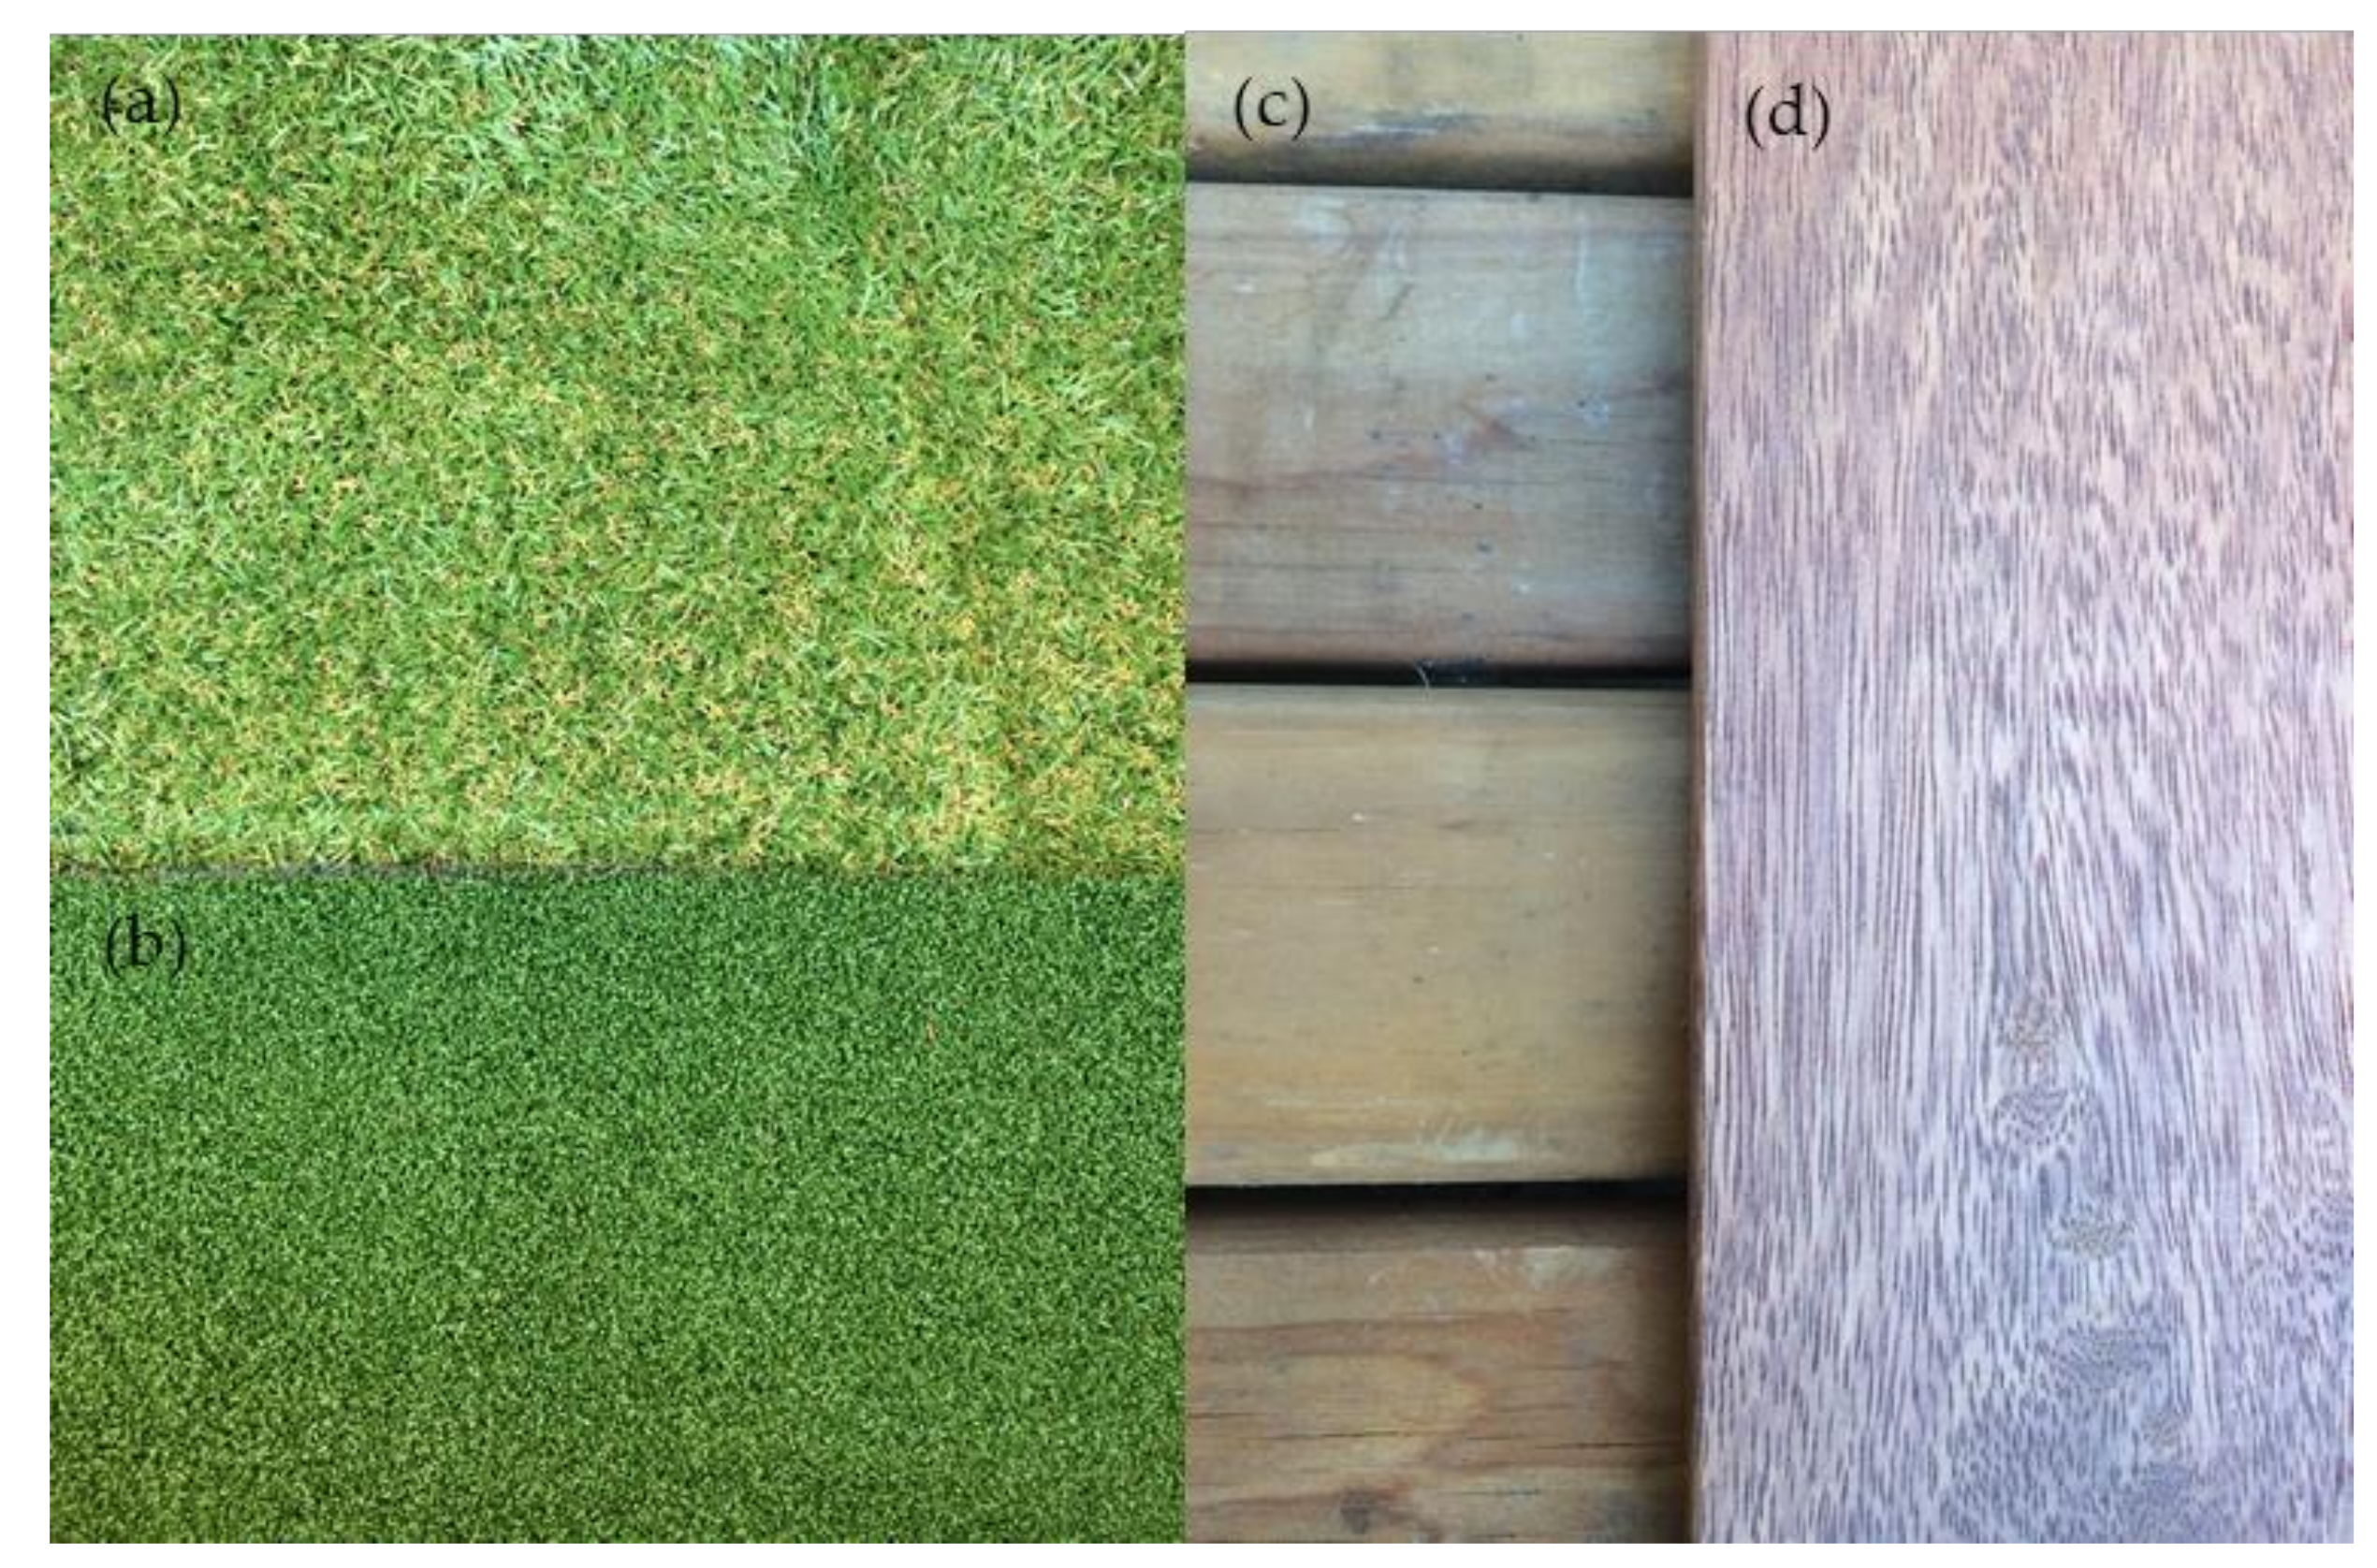
2.1.1. Materials
2.1.2. Field Measurement Conditions
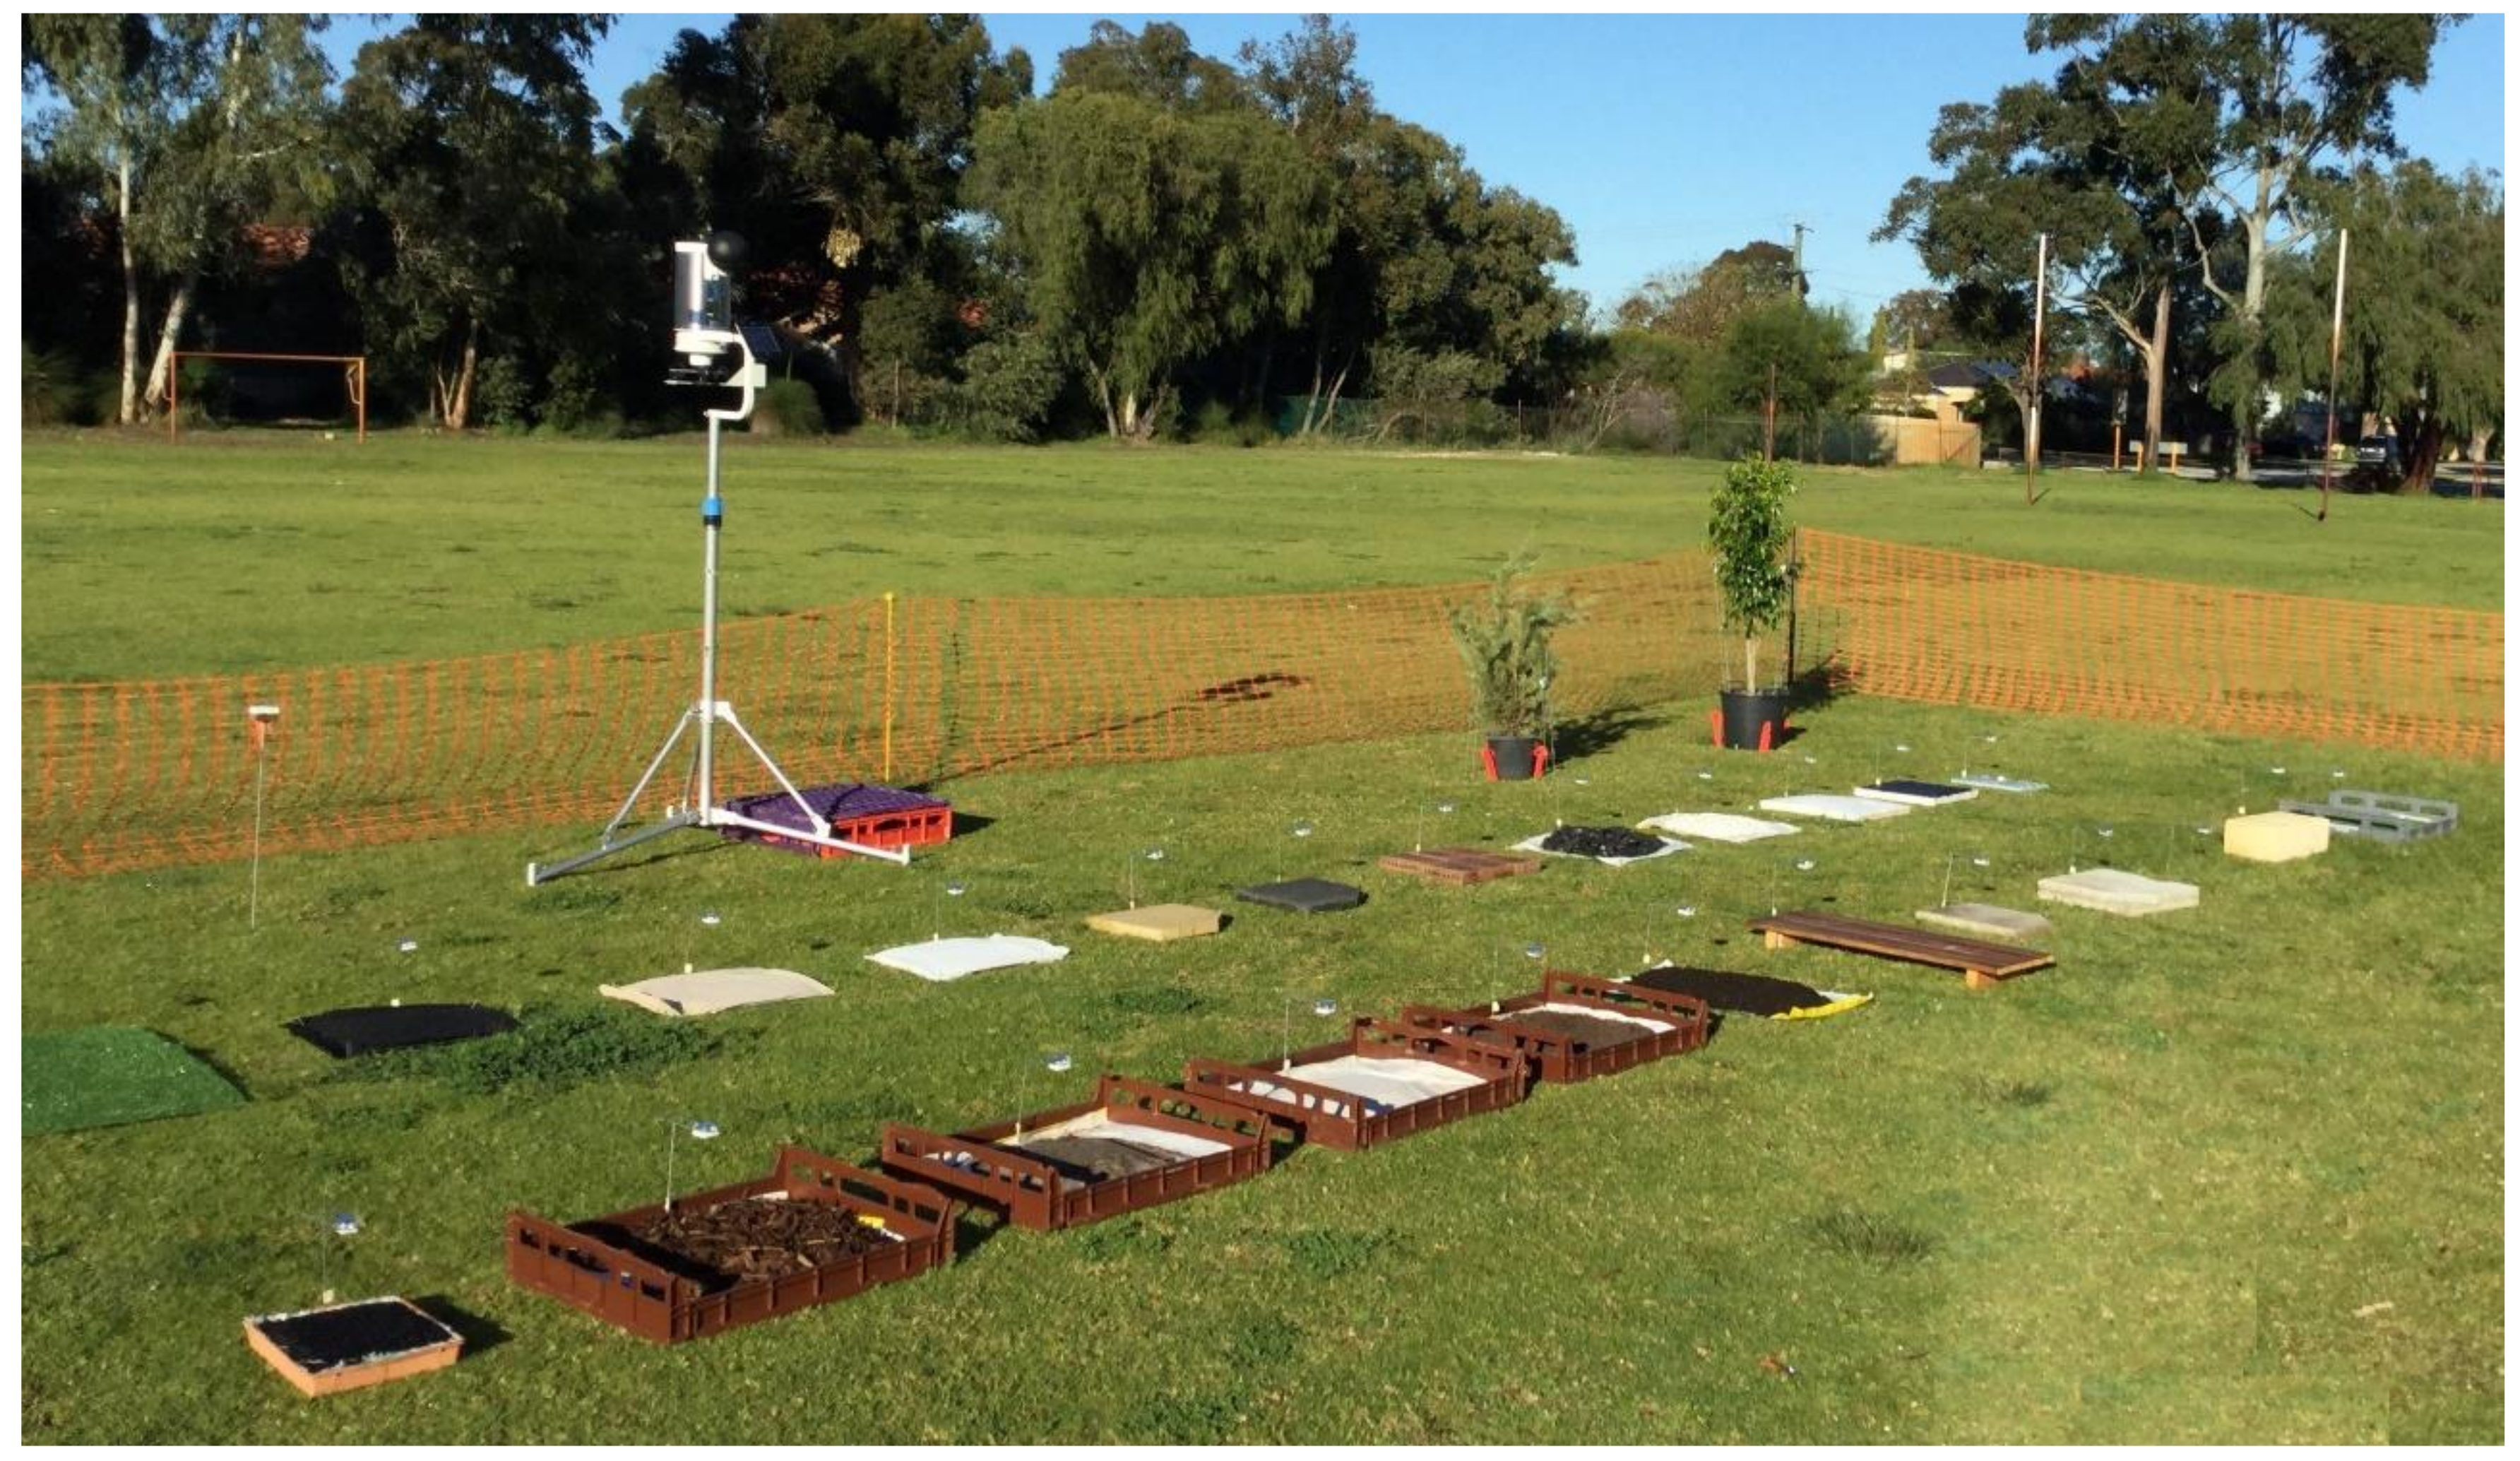
2.2. Study Design Phase 2 (Larger, Ground-Coupled LEs)
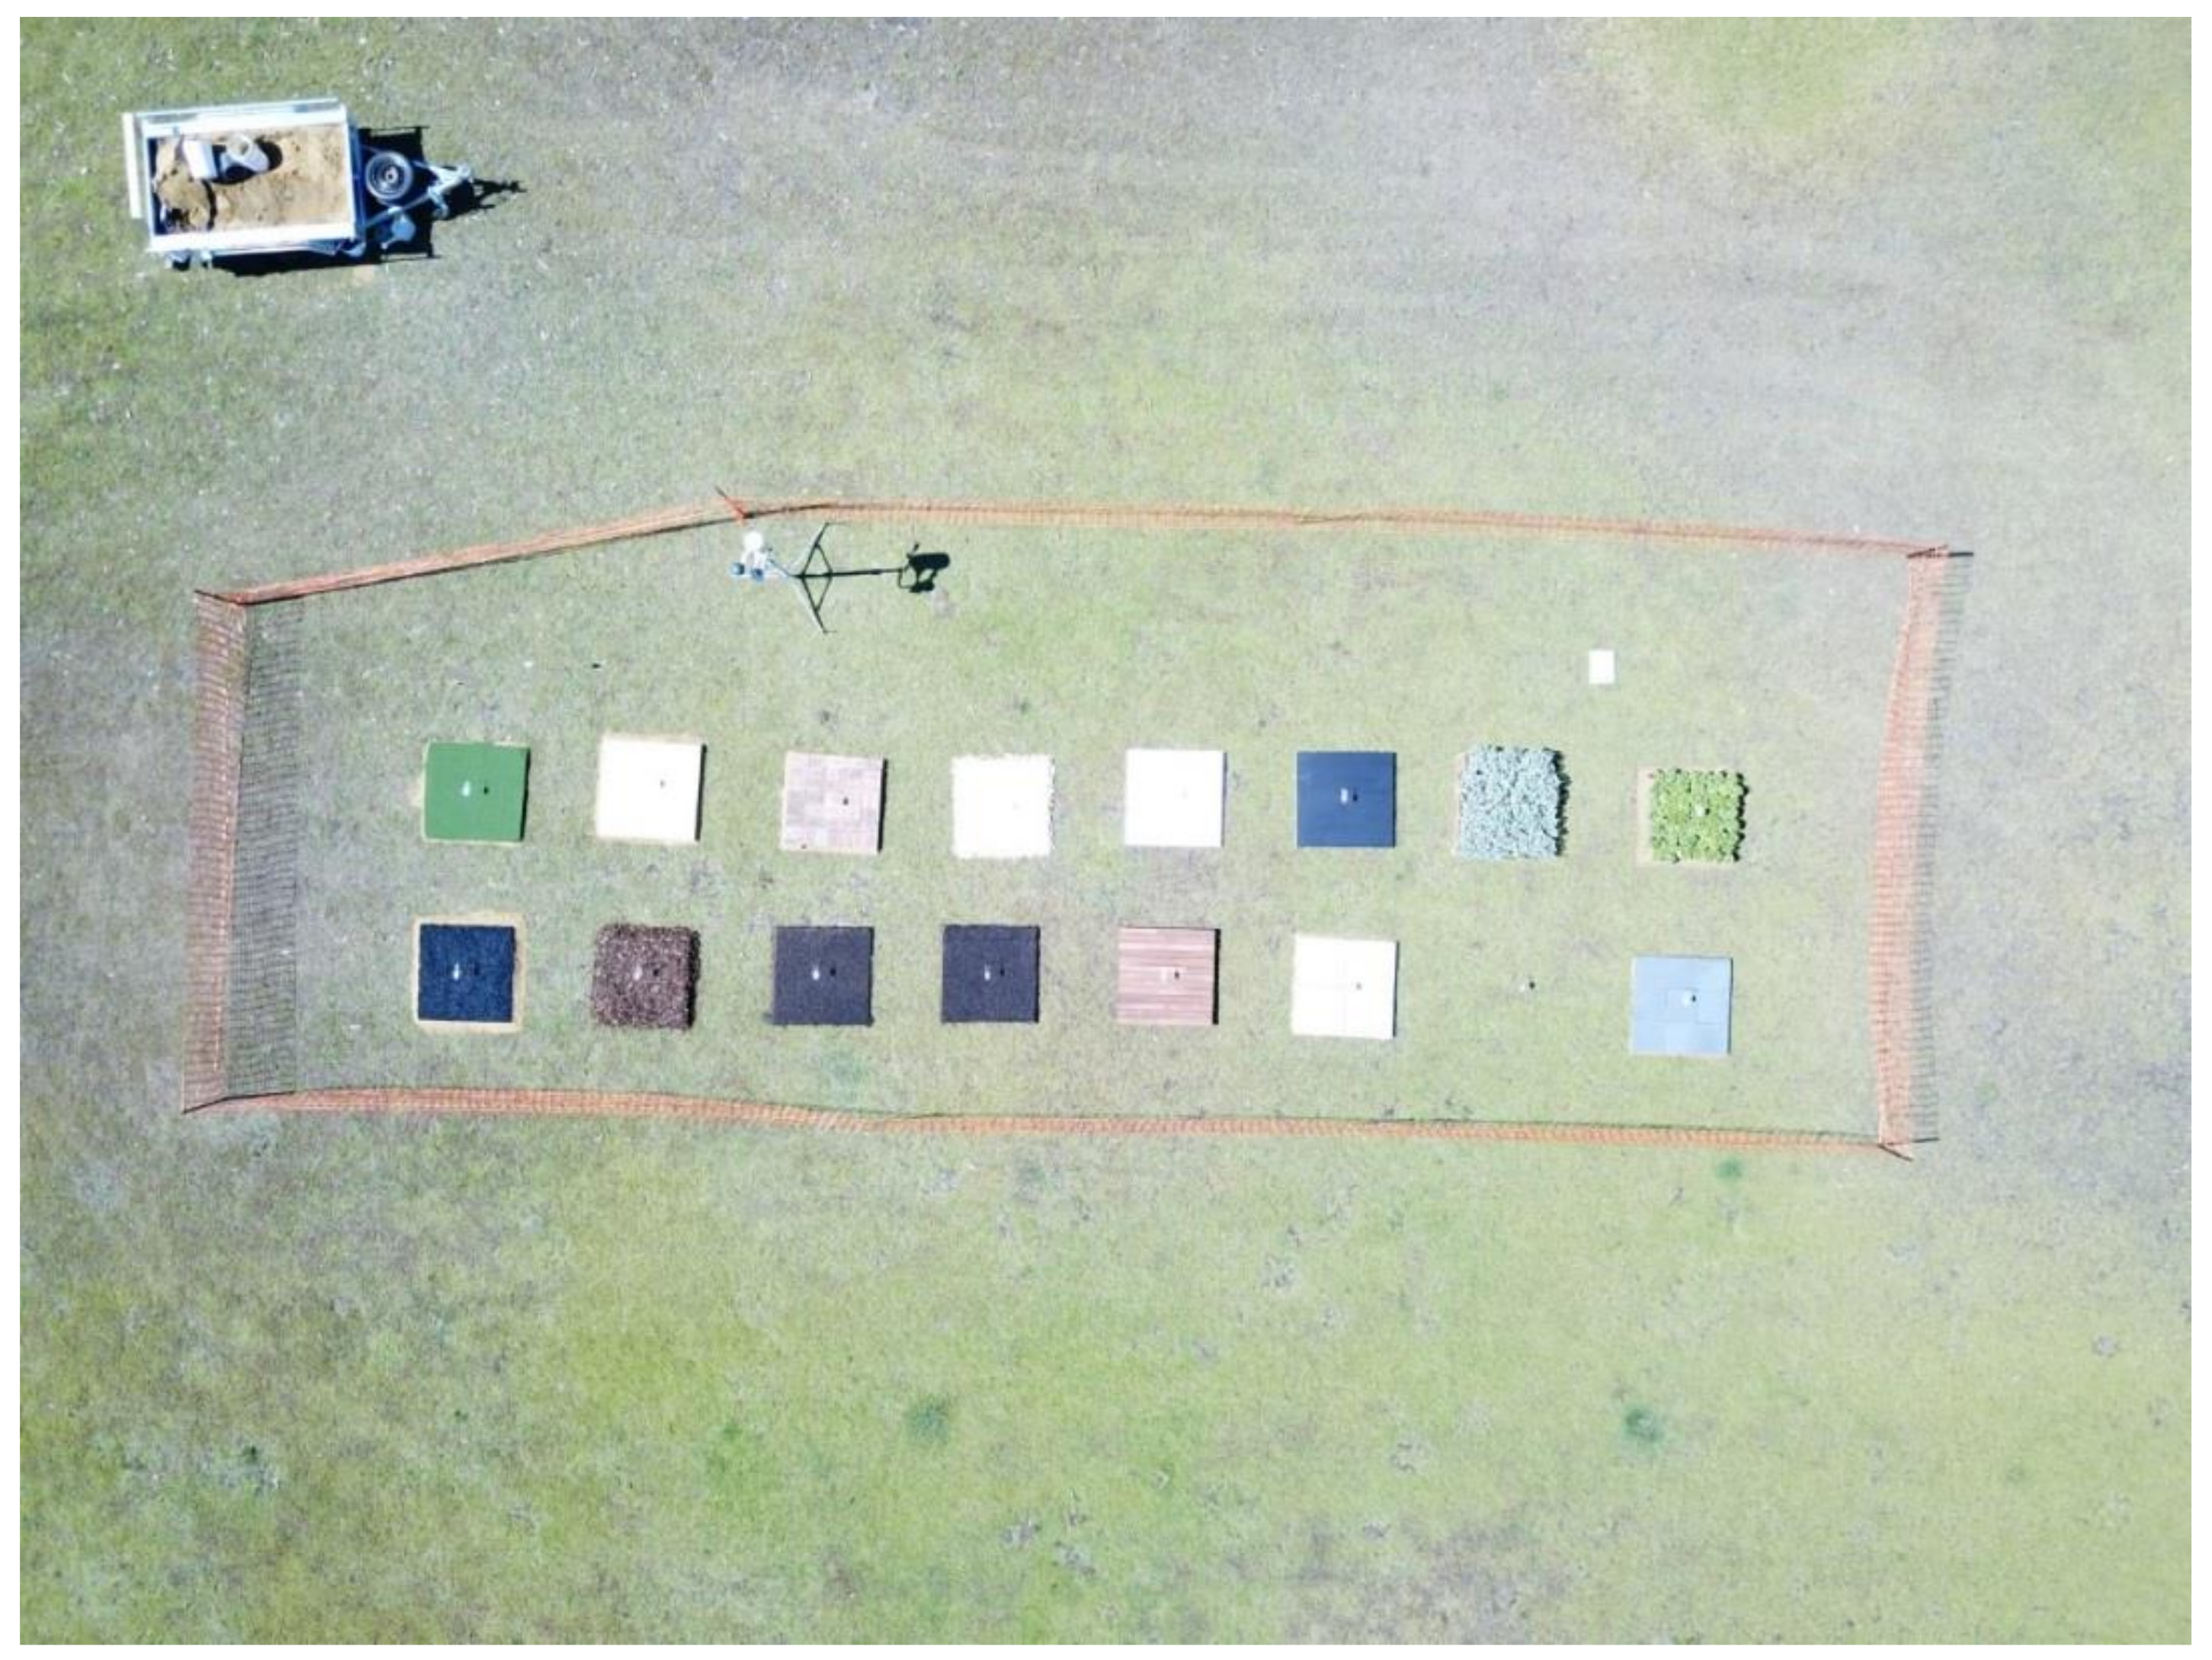
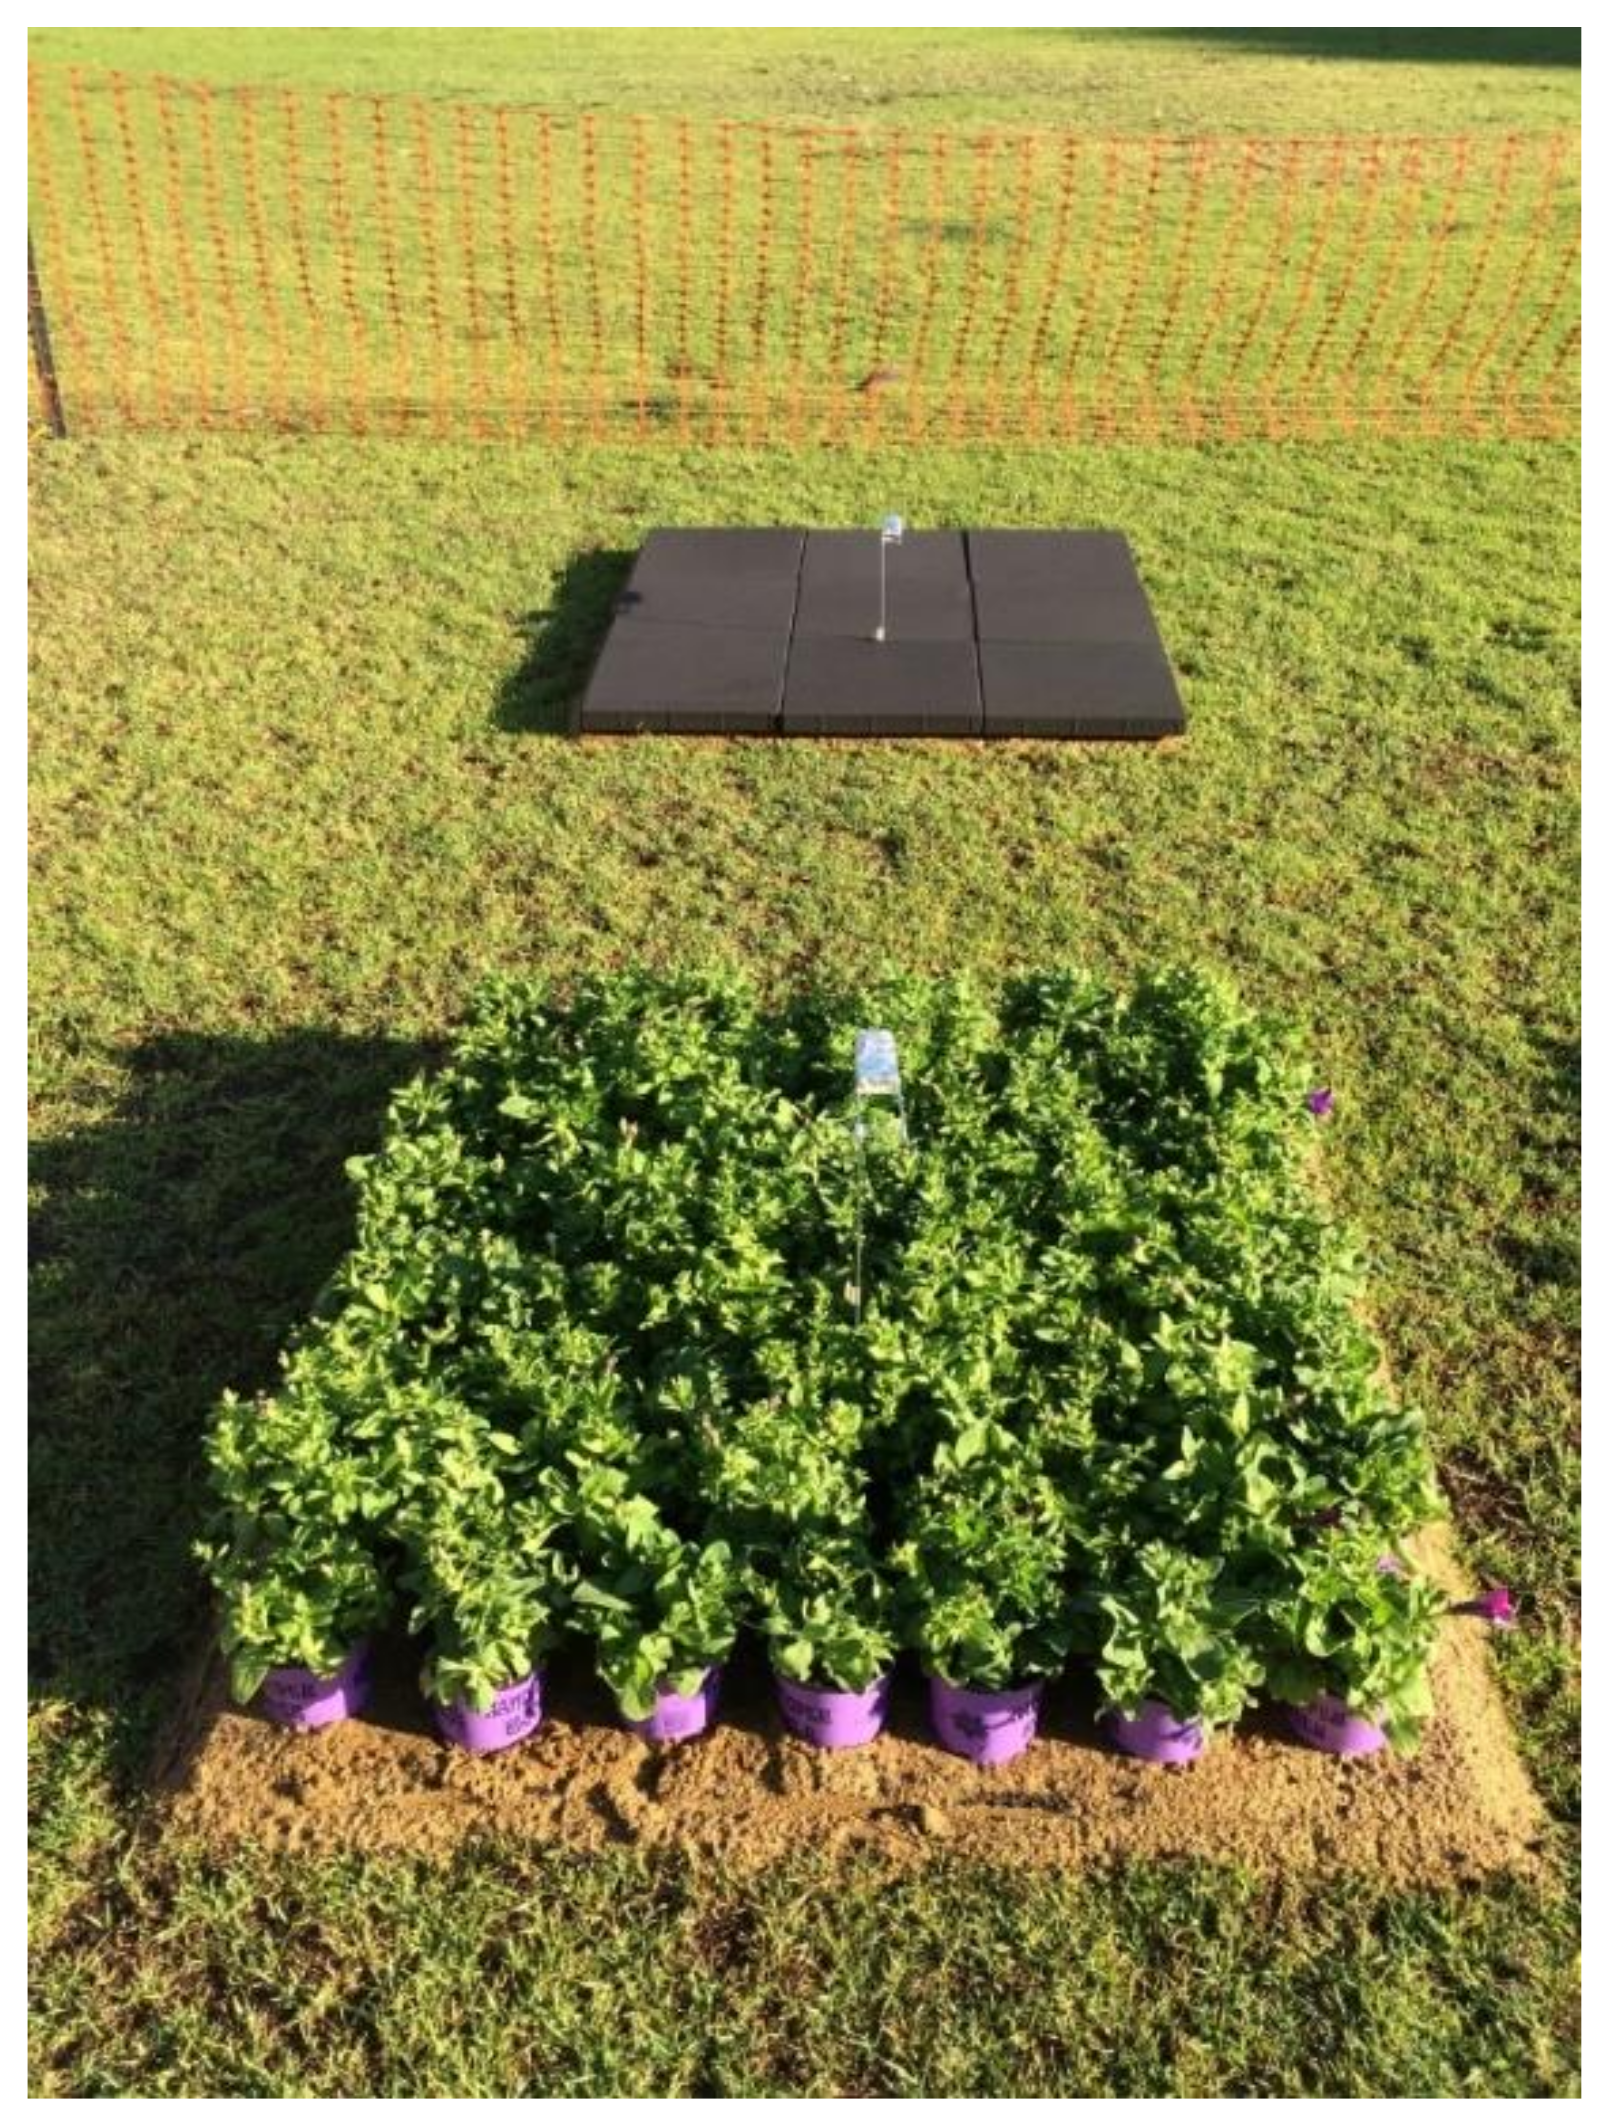
2.2.1. Materials
2.2.2. Field Measurement Conditions
2.3. Data Analysis
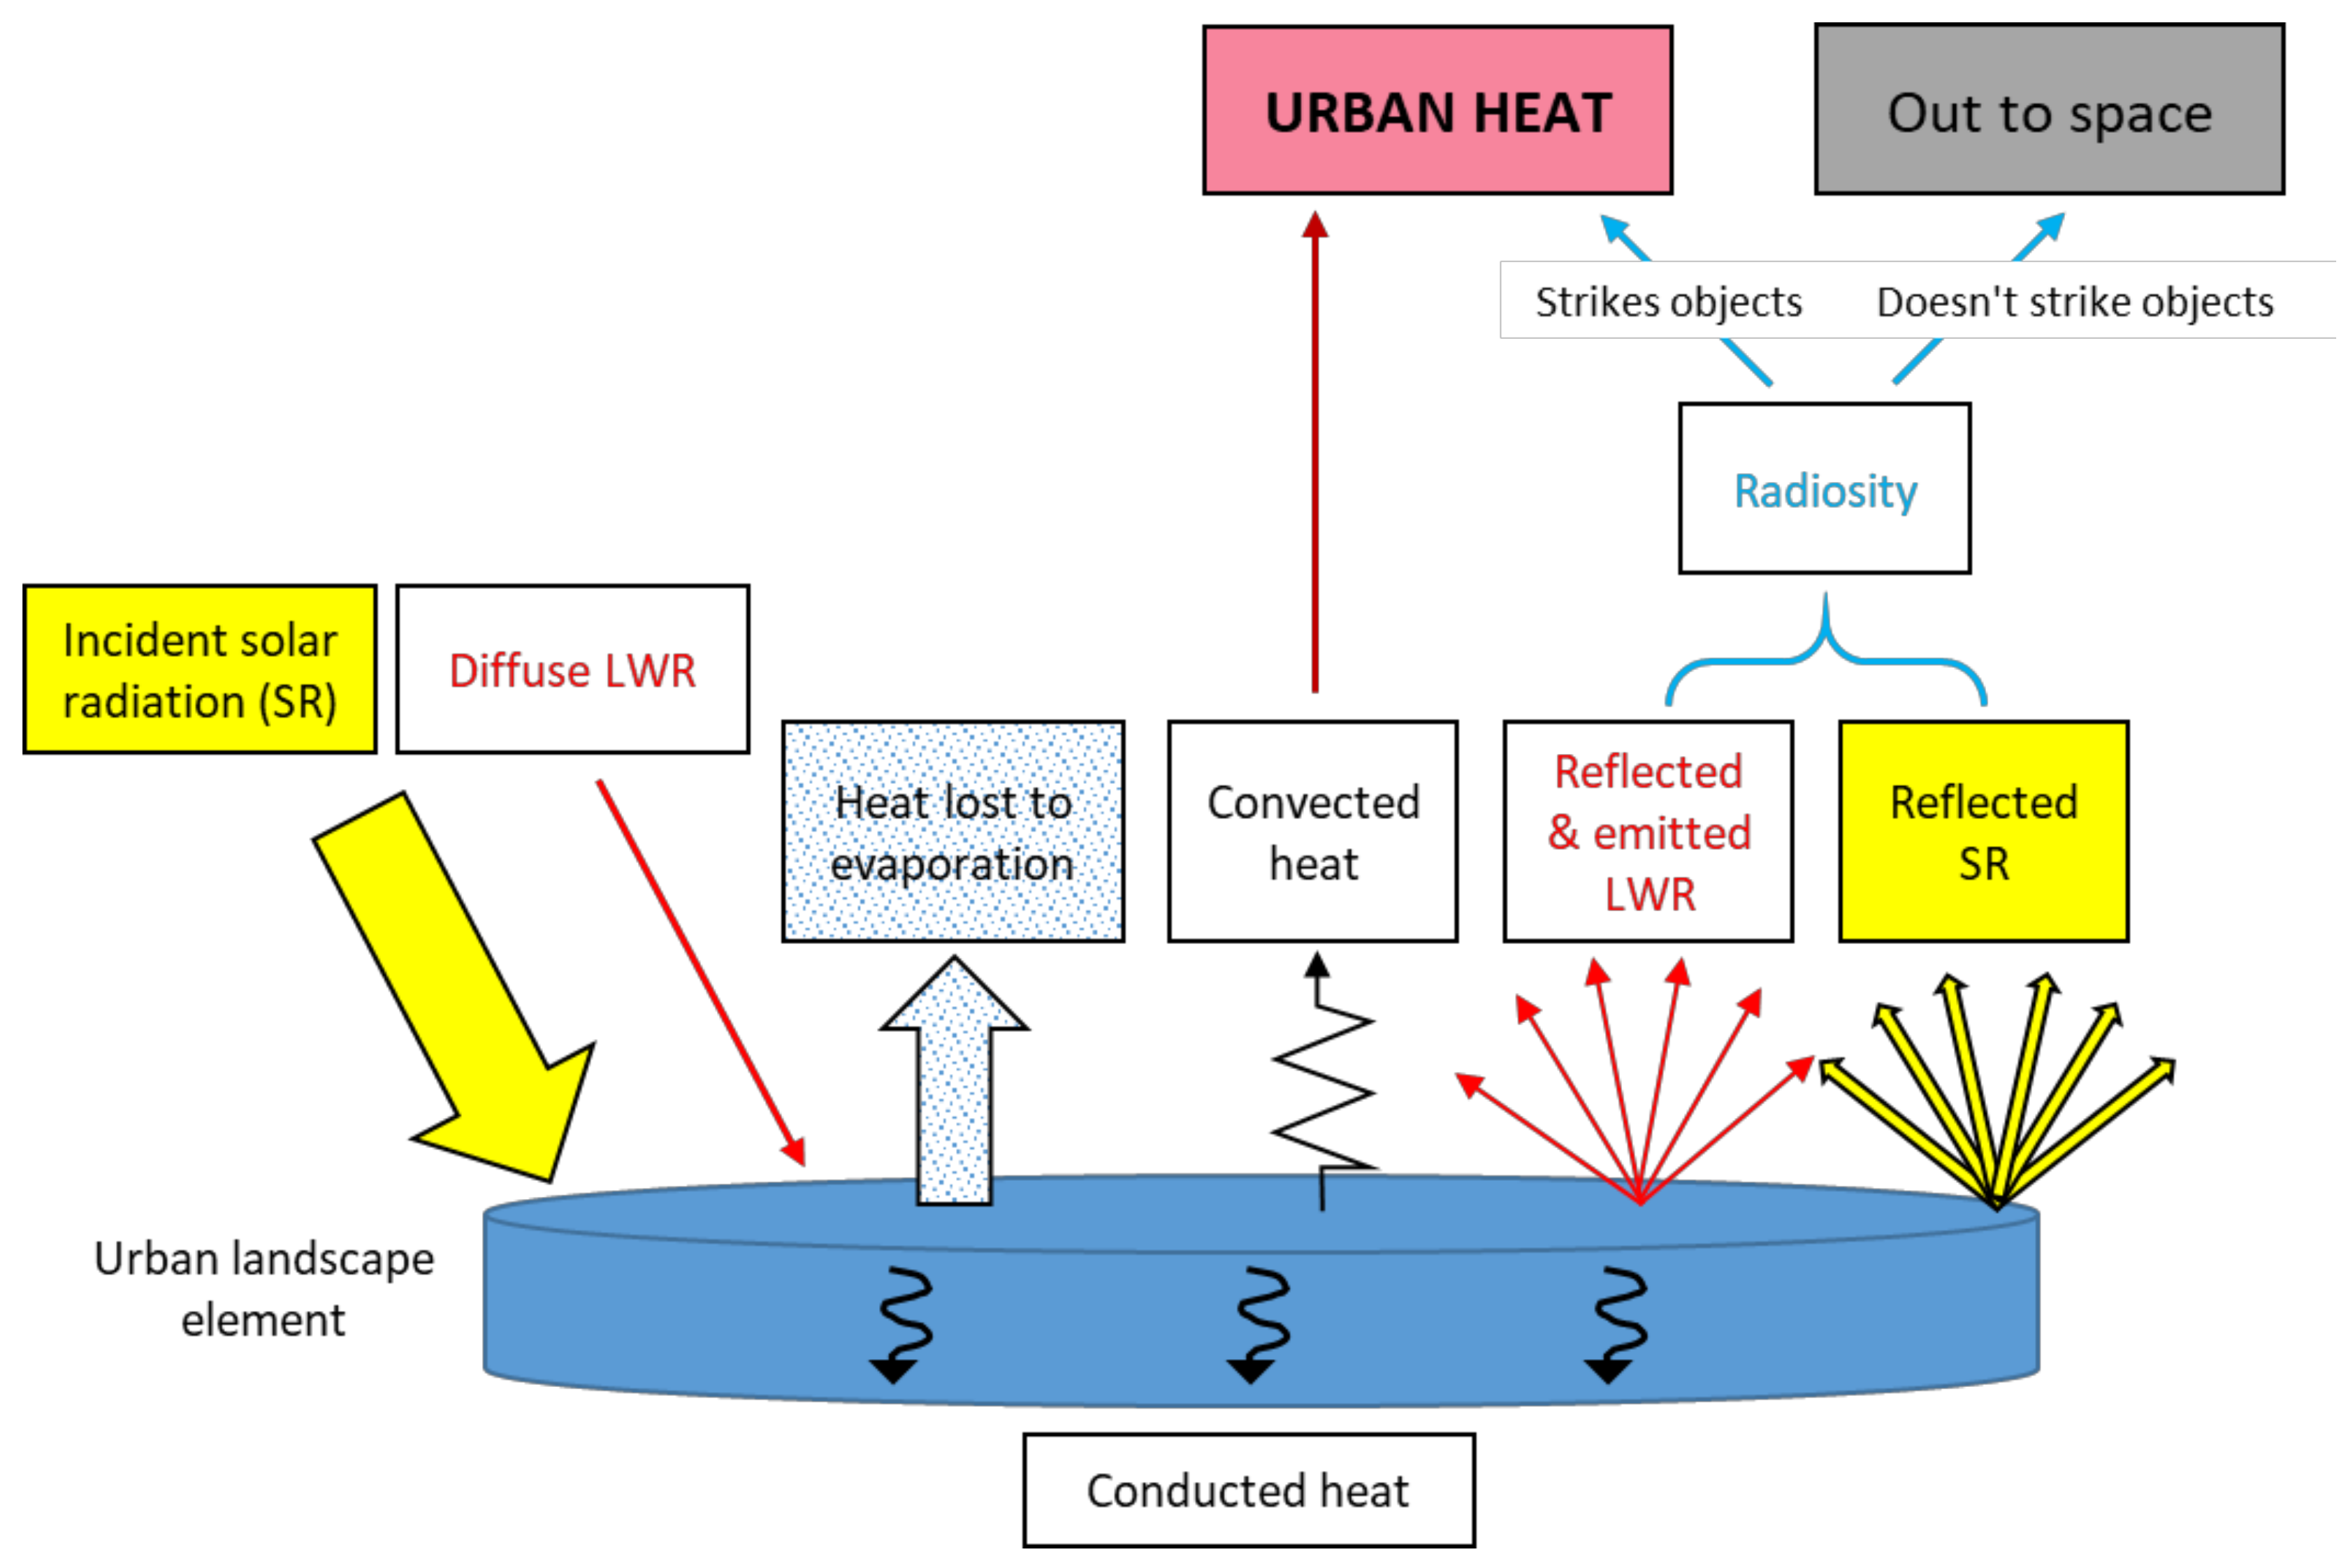
2.3.1. Energy Balance
2.3.2. iButton Temperatures and Emissivity
2.3.3. iButton Temperatures and Convection
2.3.4. View Factors
2.3.5. Material Properties Affecting iButton Temperatures
2.3.6. Relative Radiosity Ranking
2.4. Delimitations
3. Results and Discussion
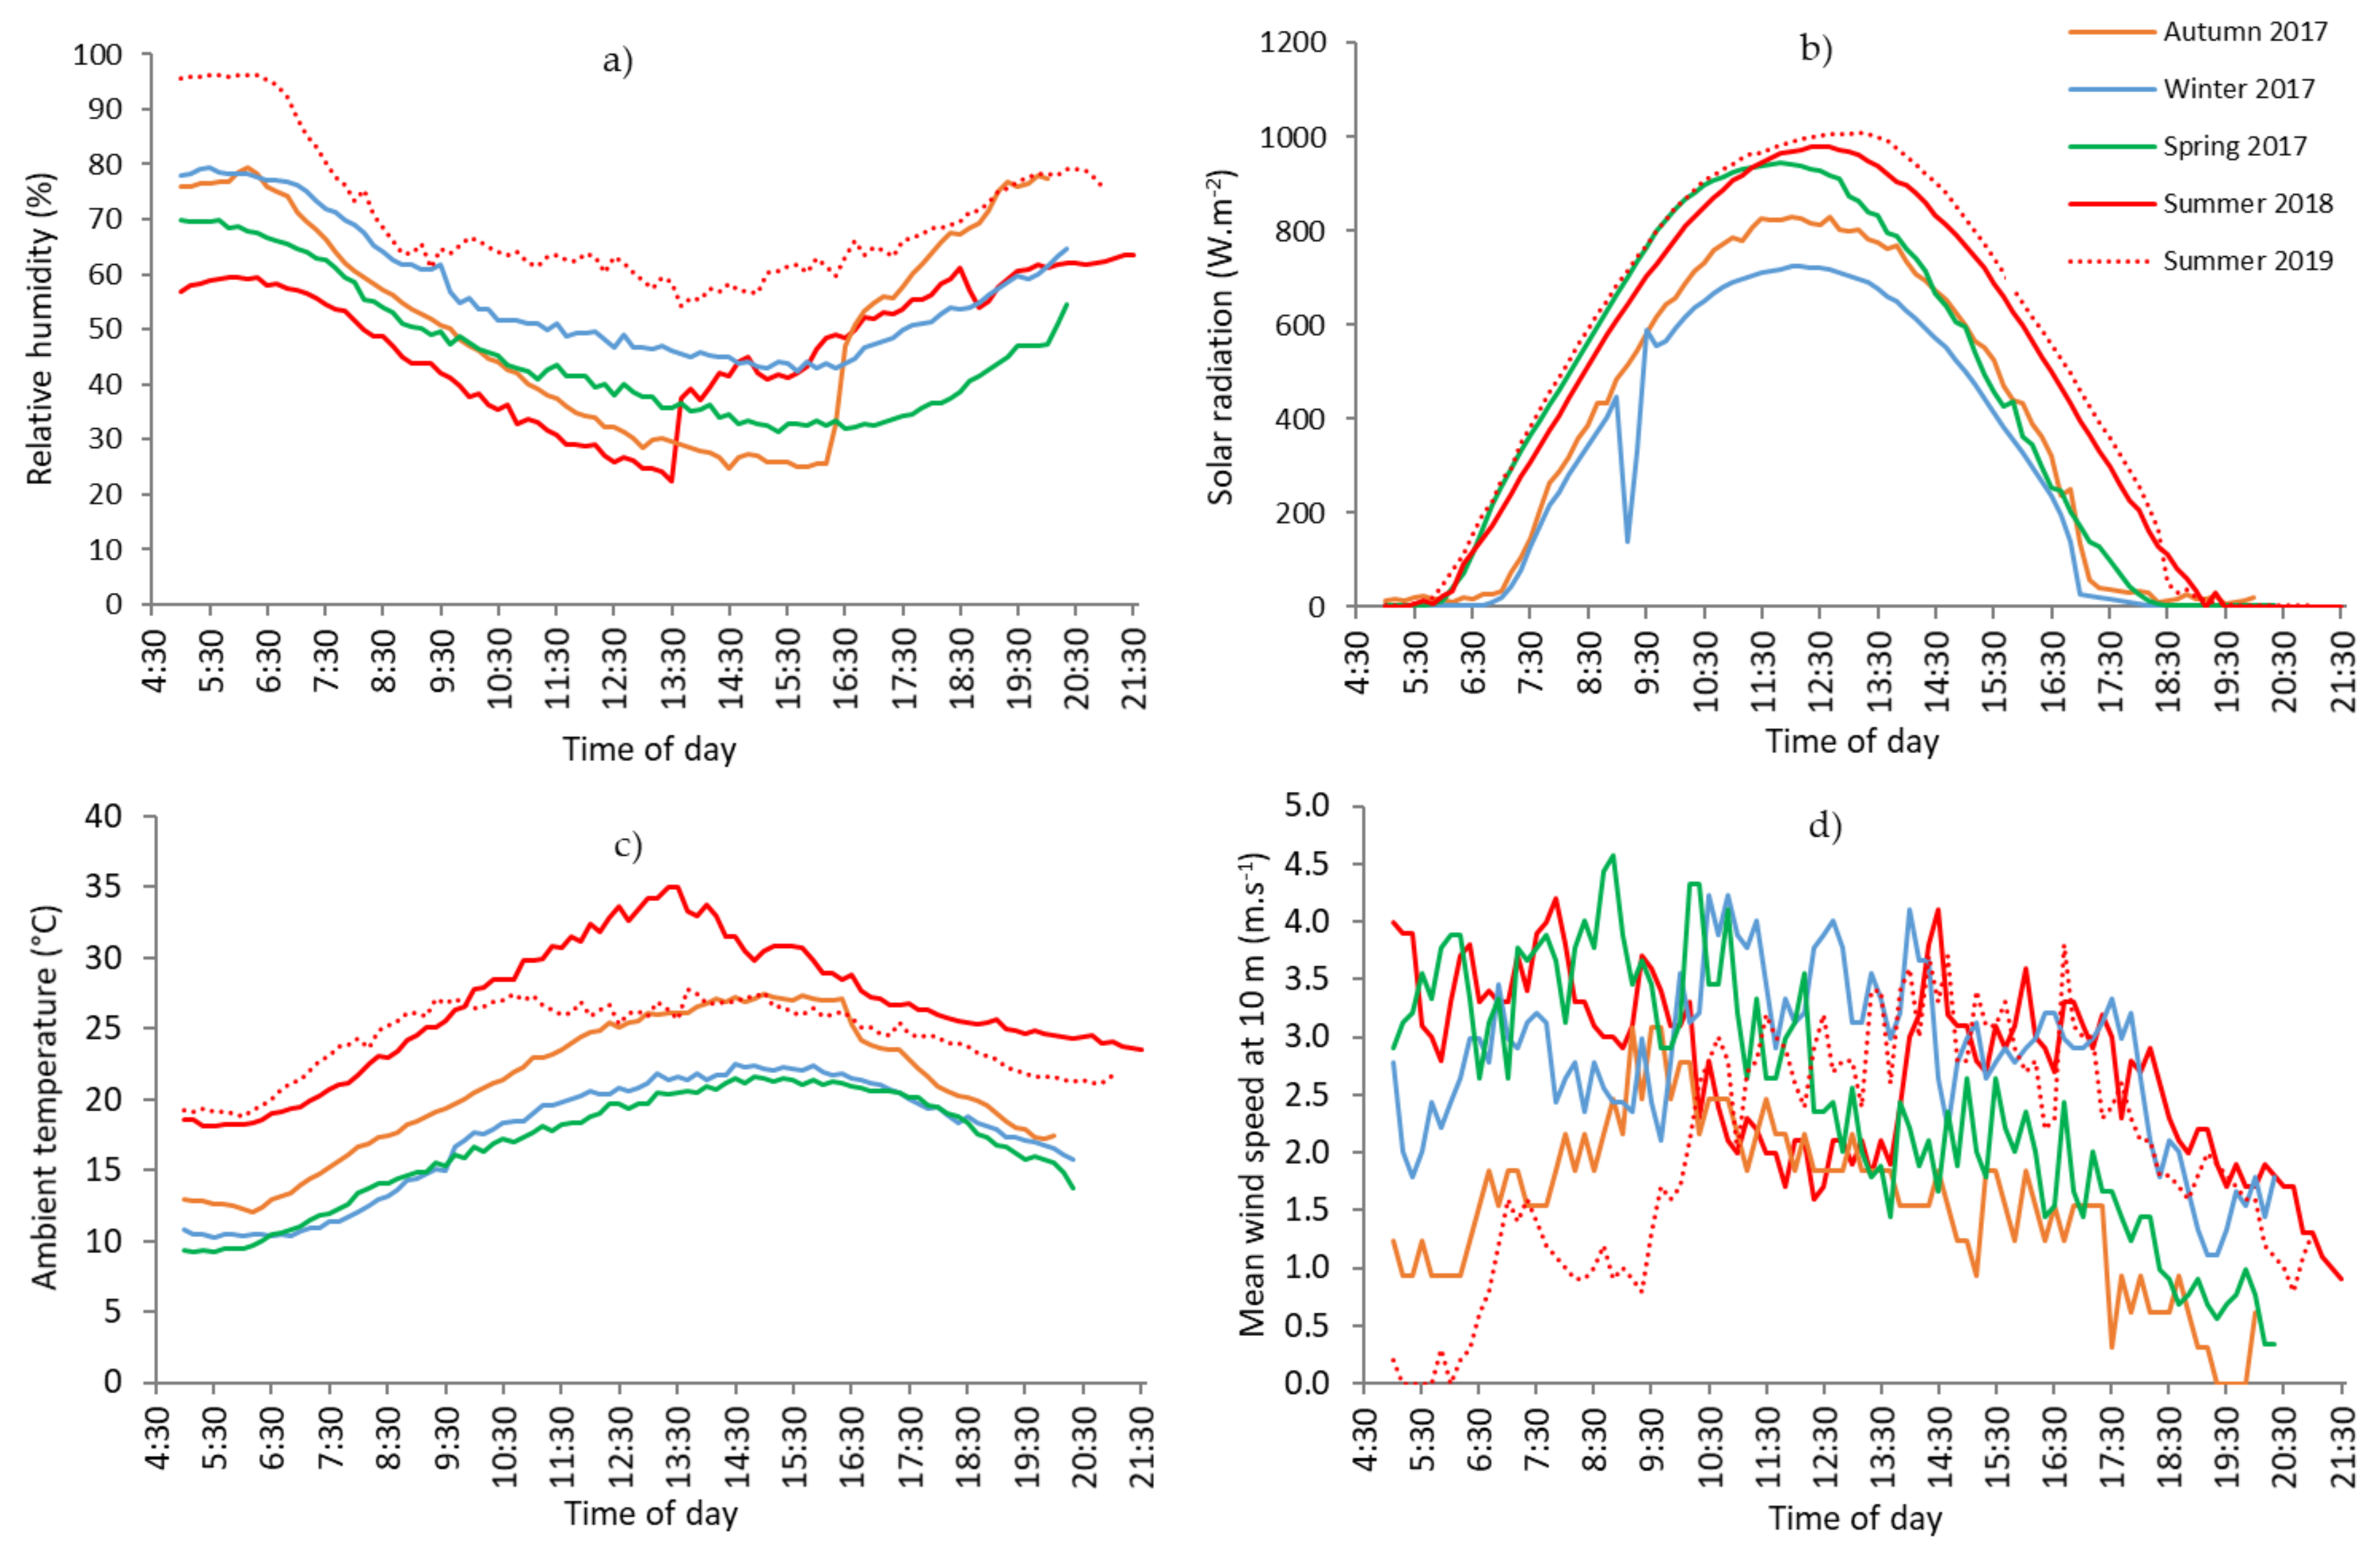
3.1. Weather Conditions
3.2. View Factors
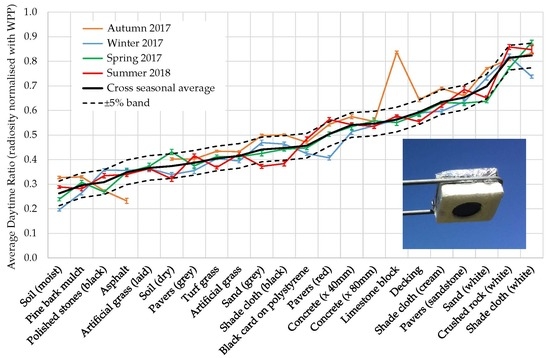
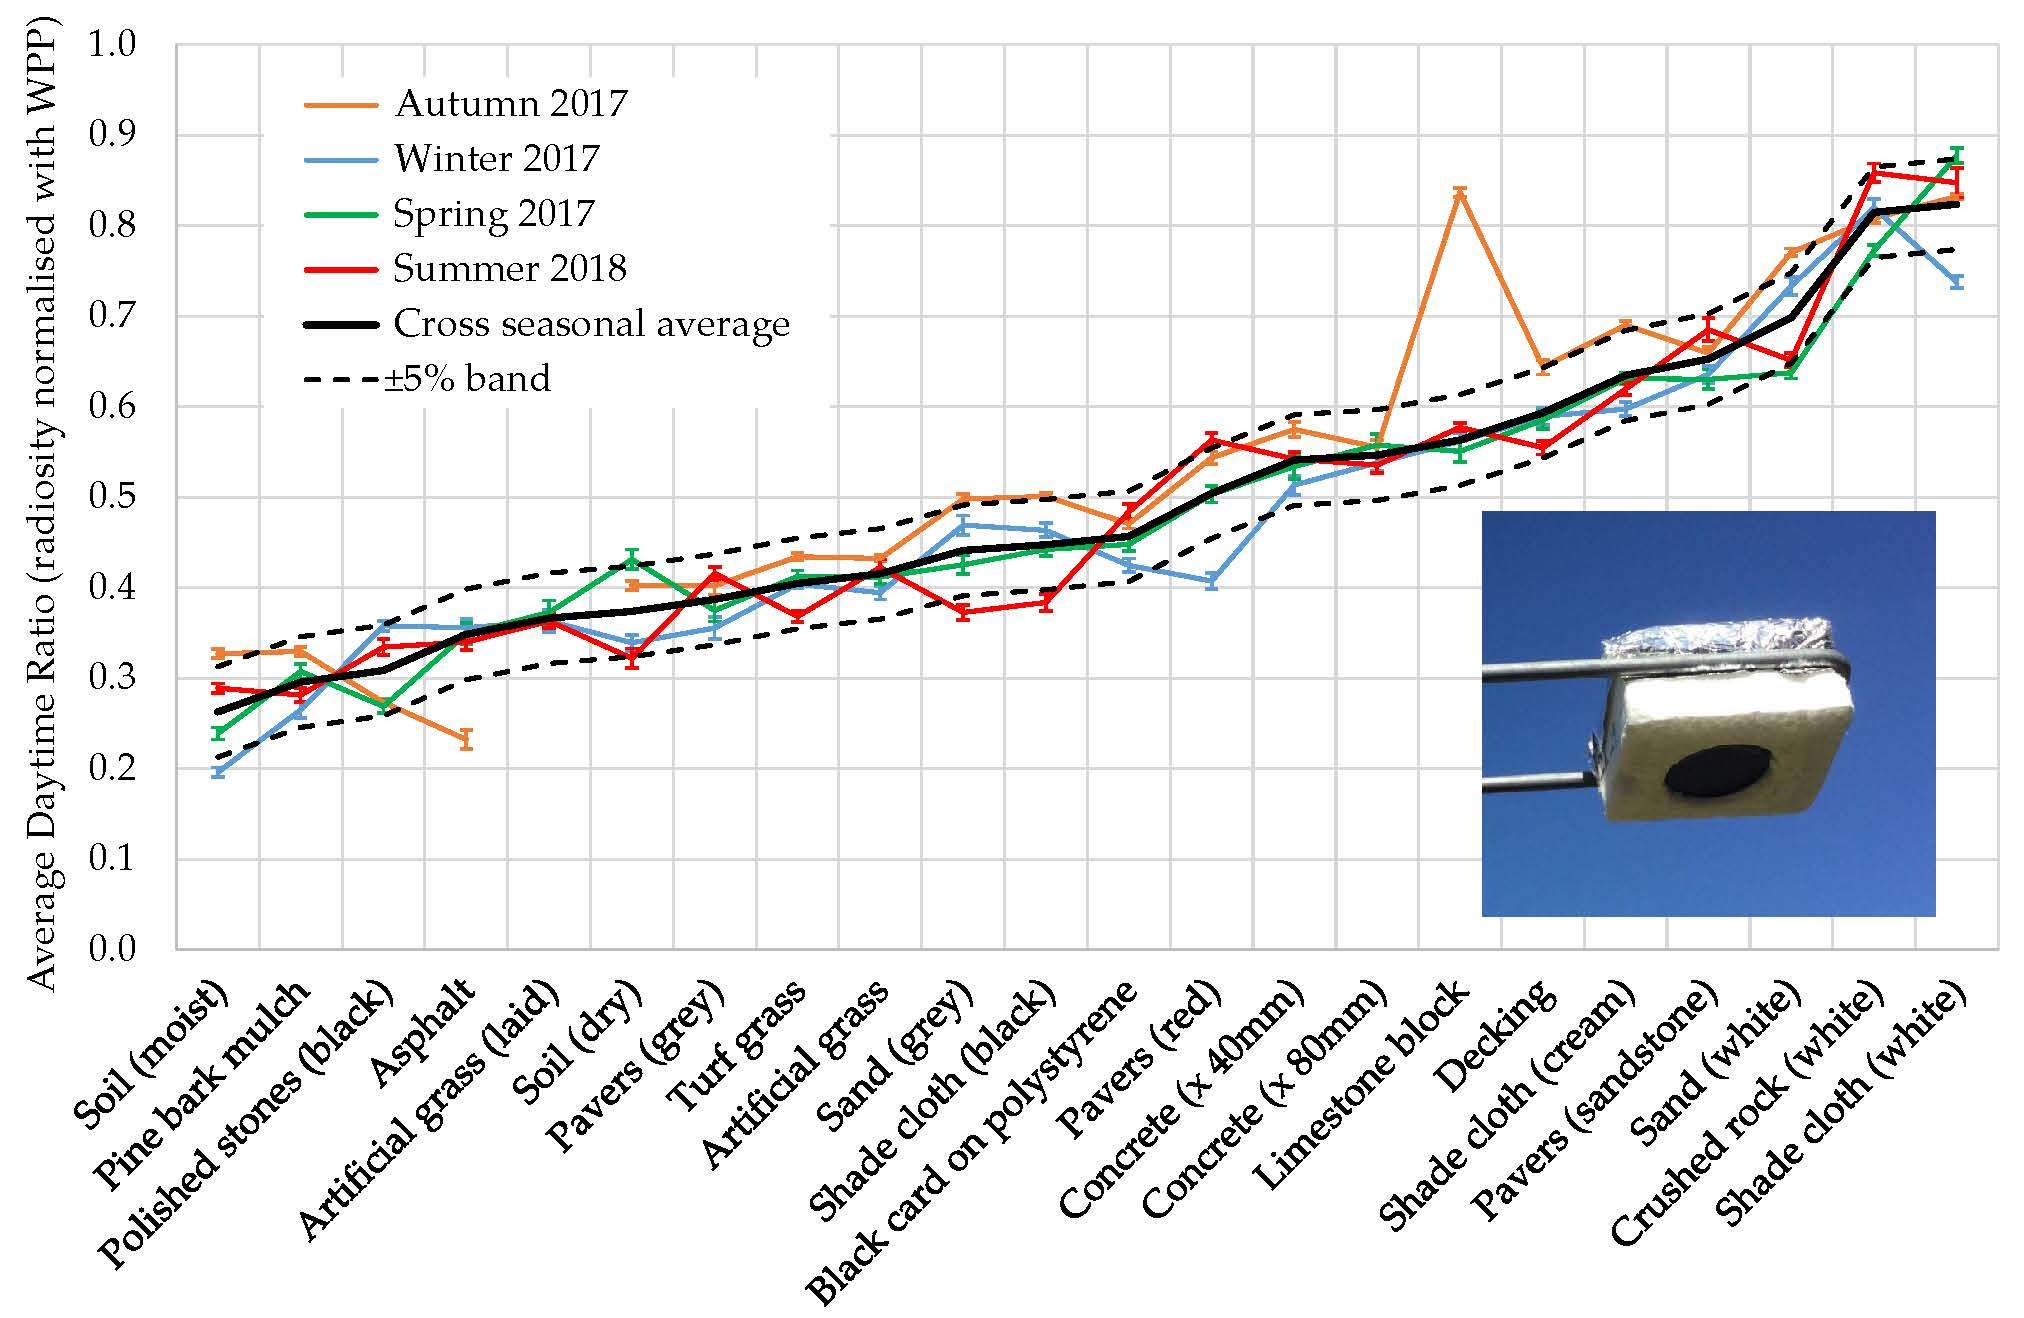
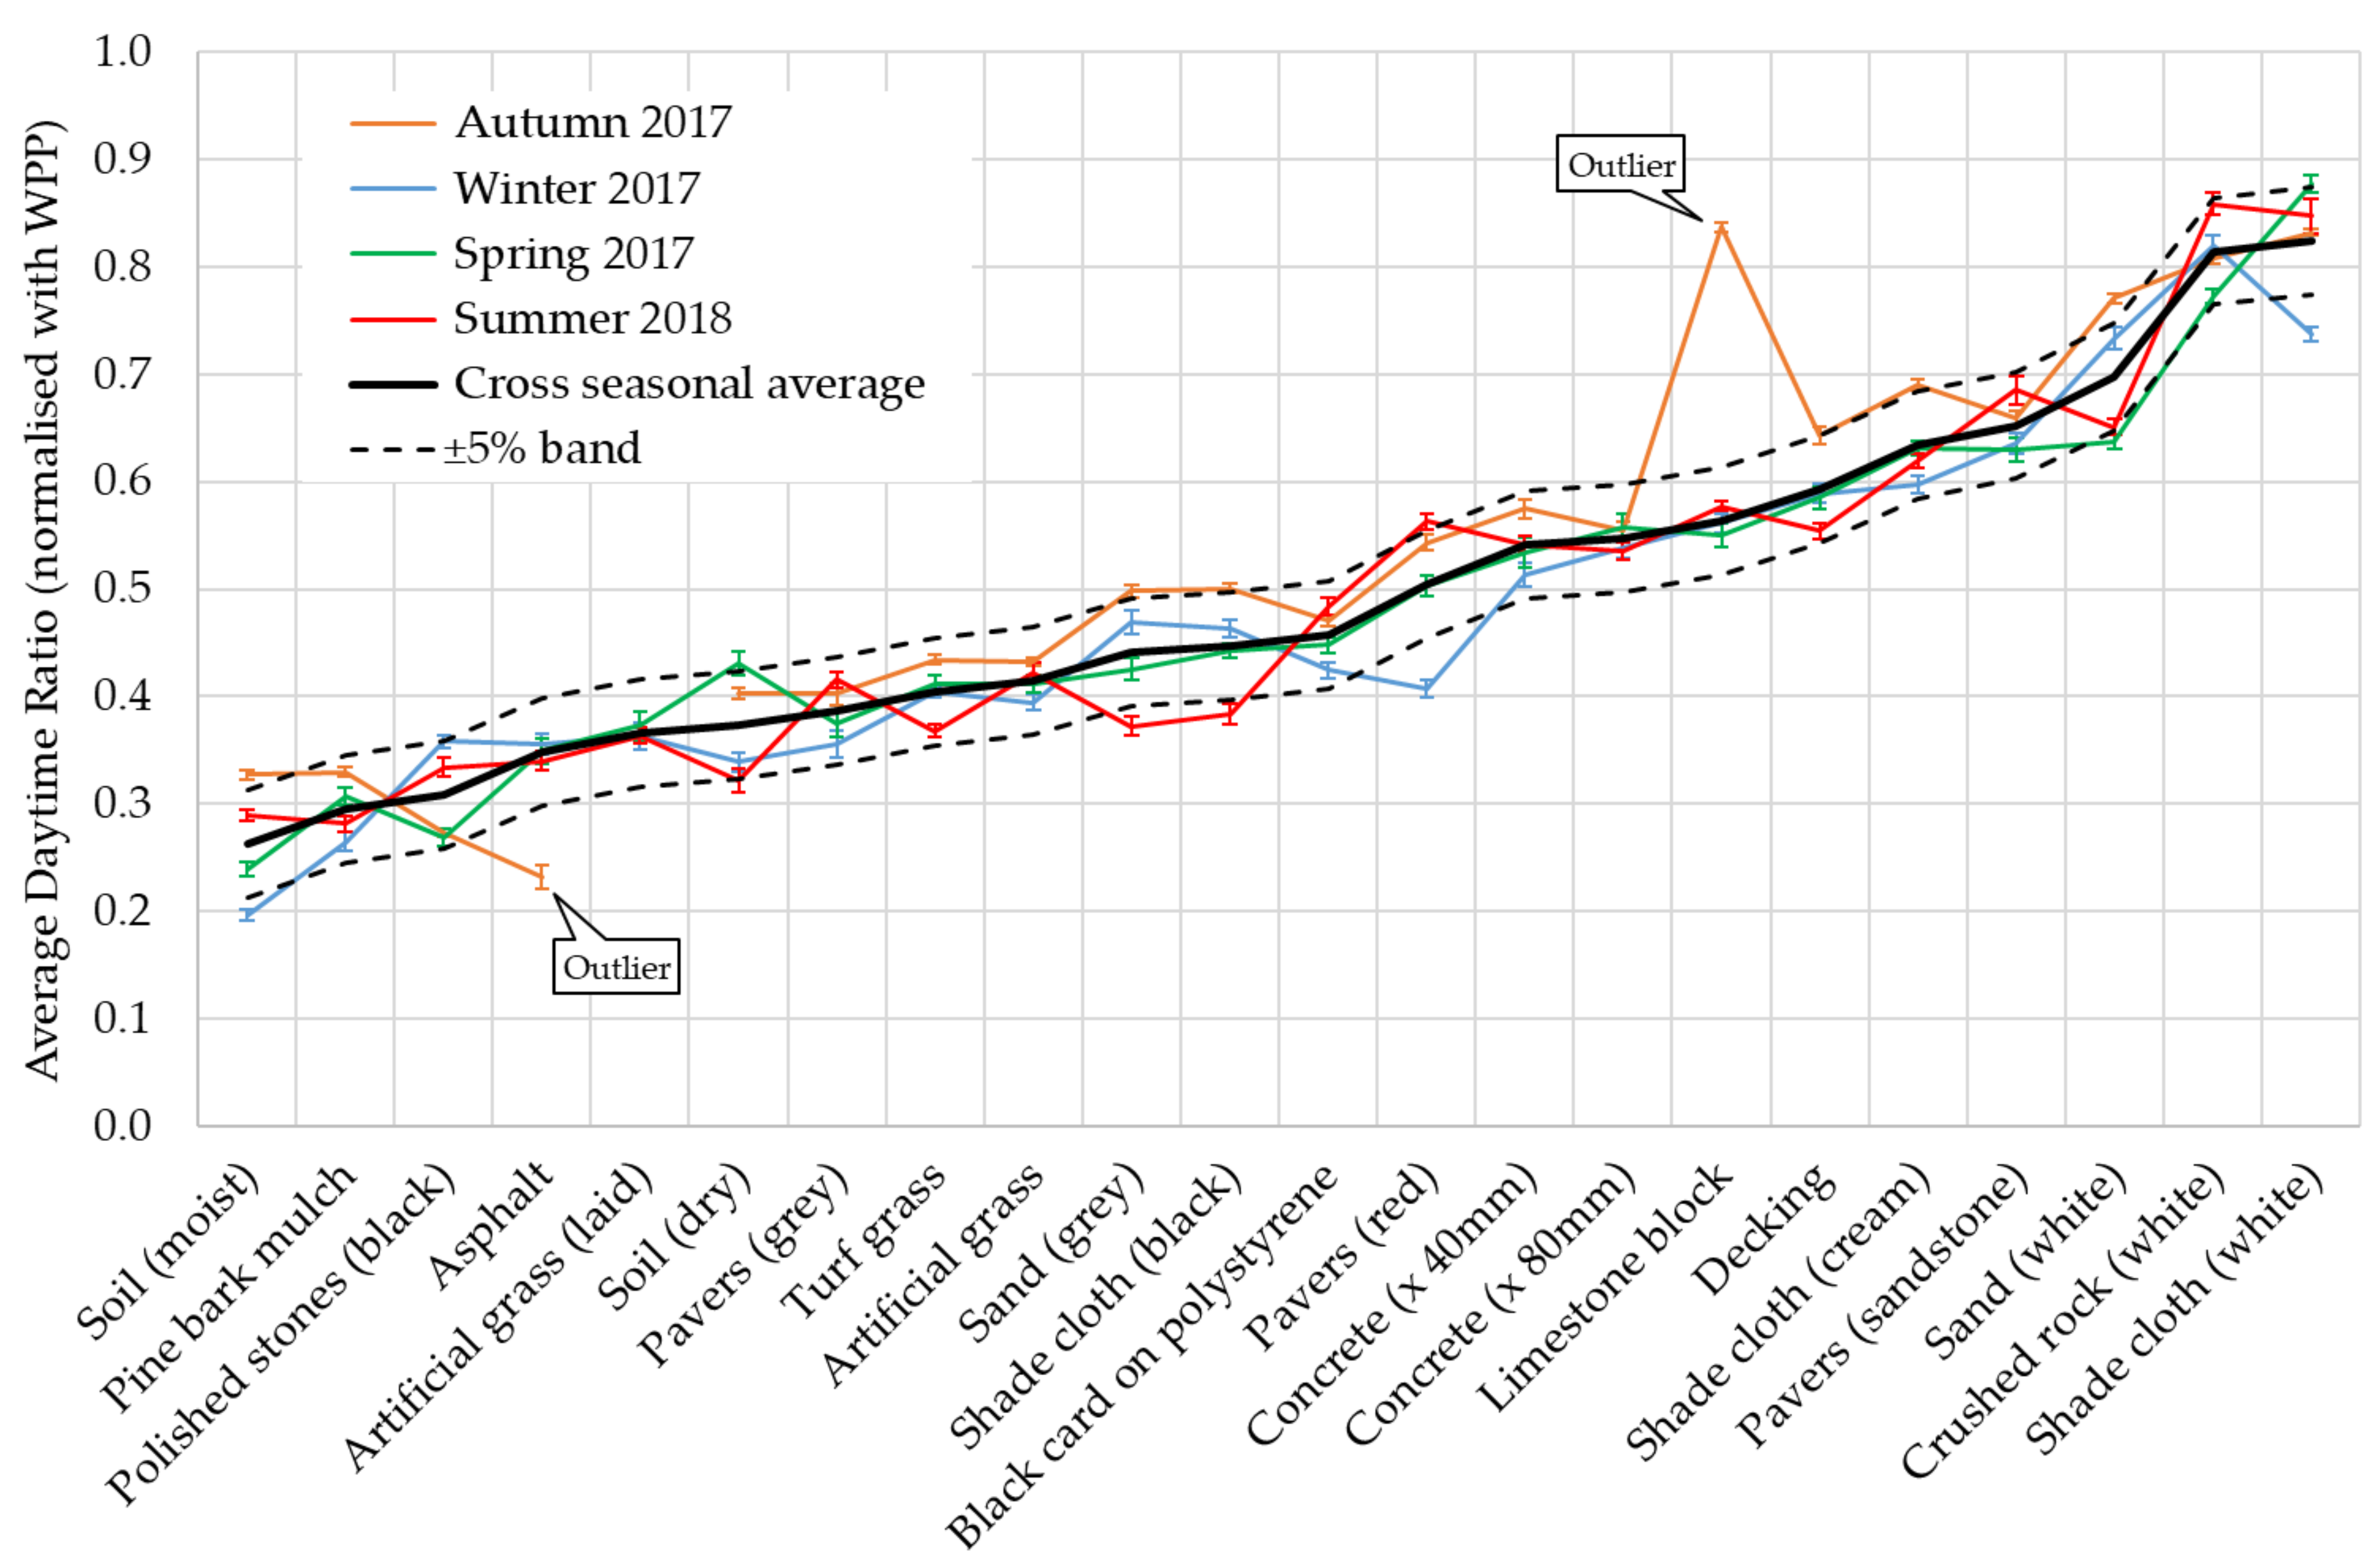
3.3. Seasonal Comparison—Phase 1
Relative Average Radiosity
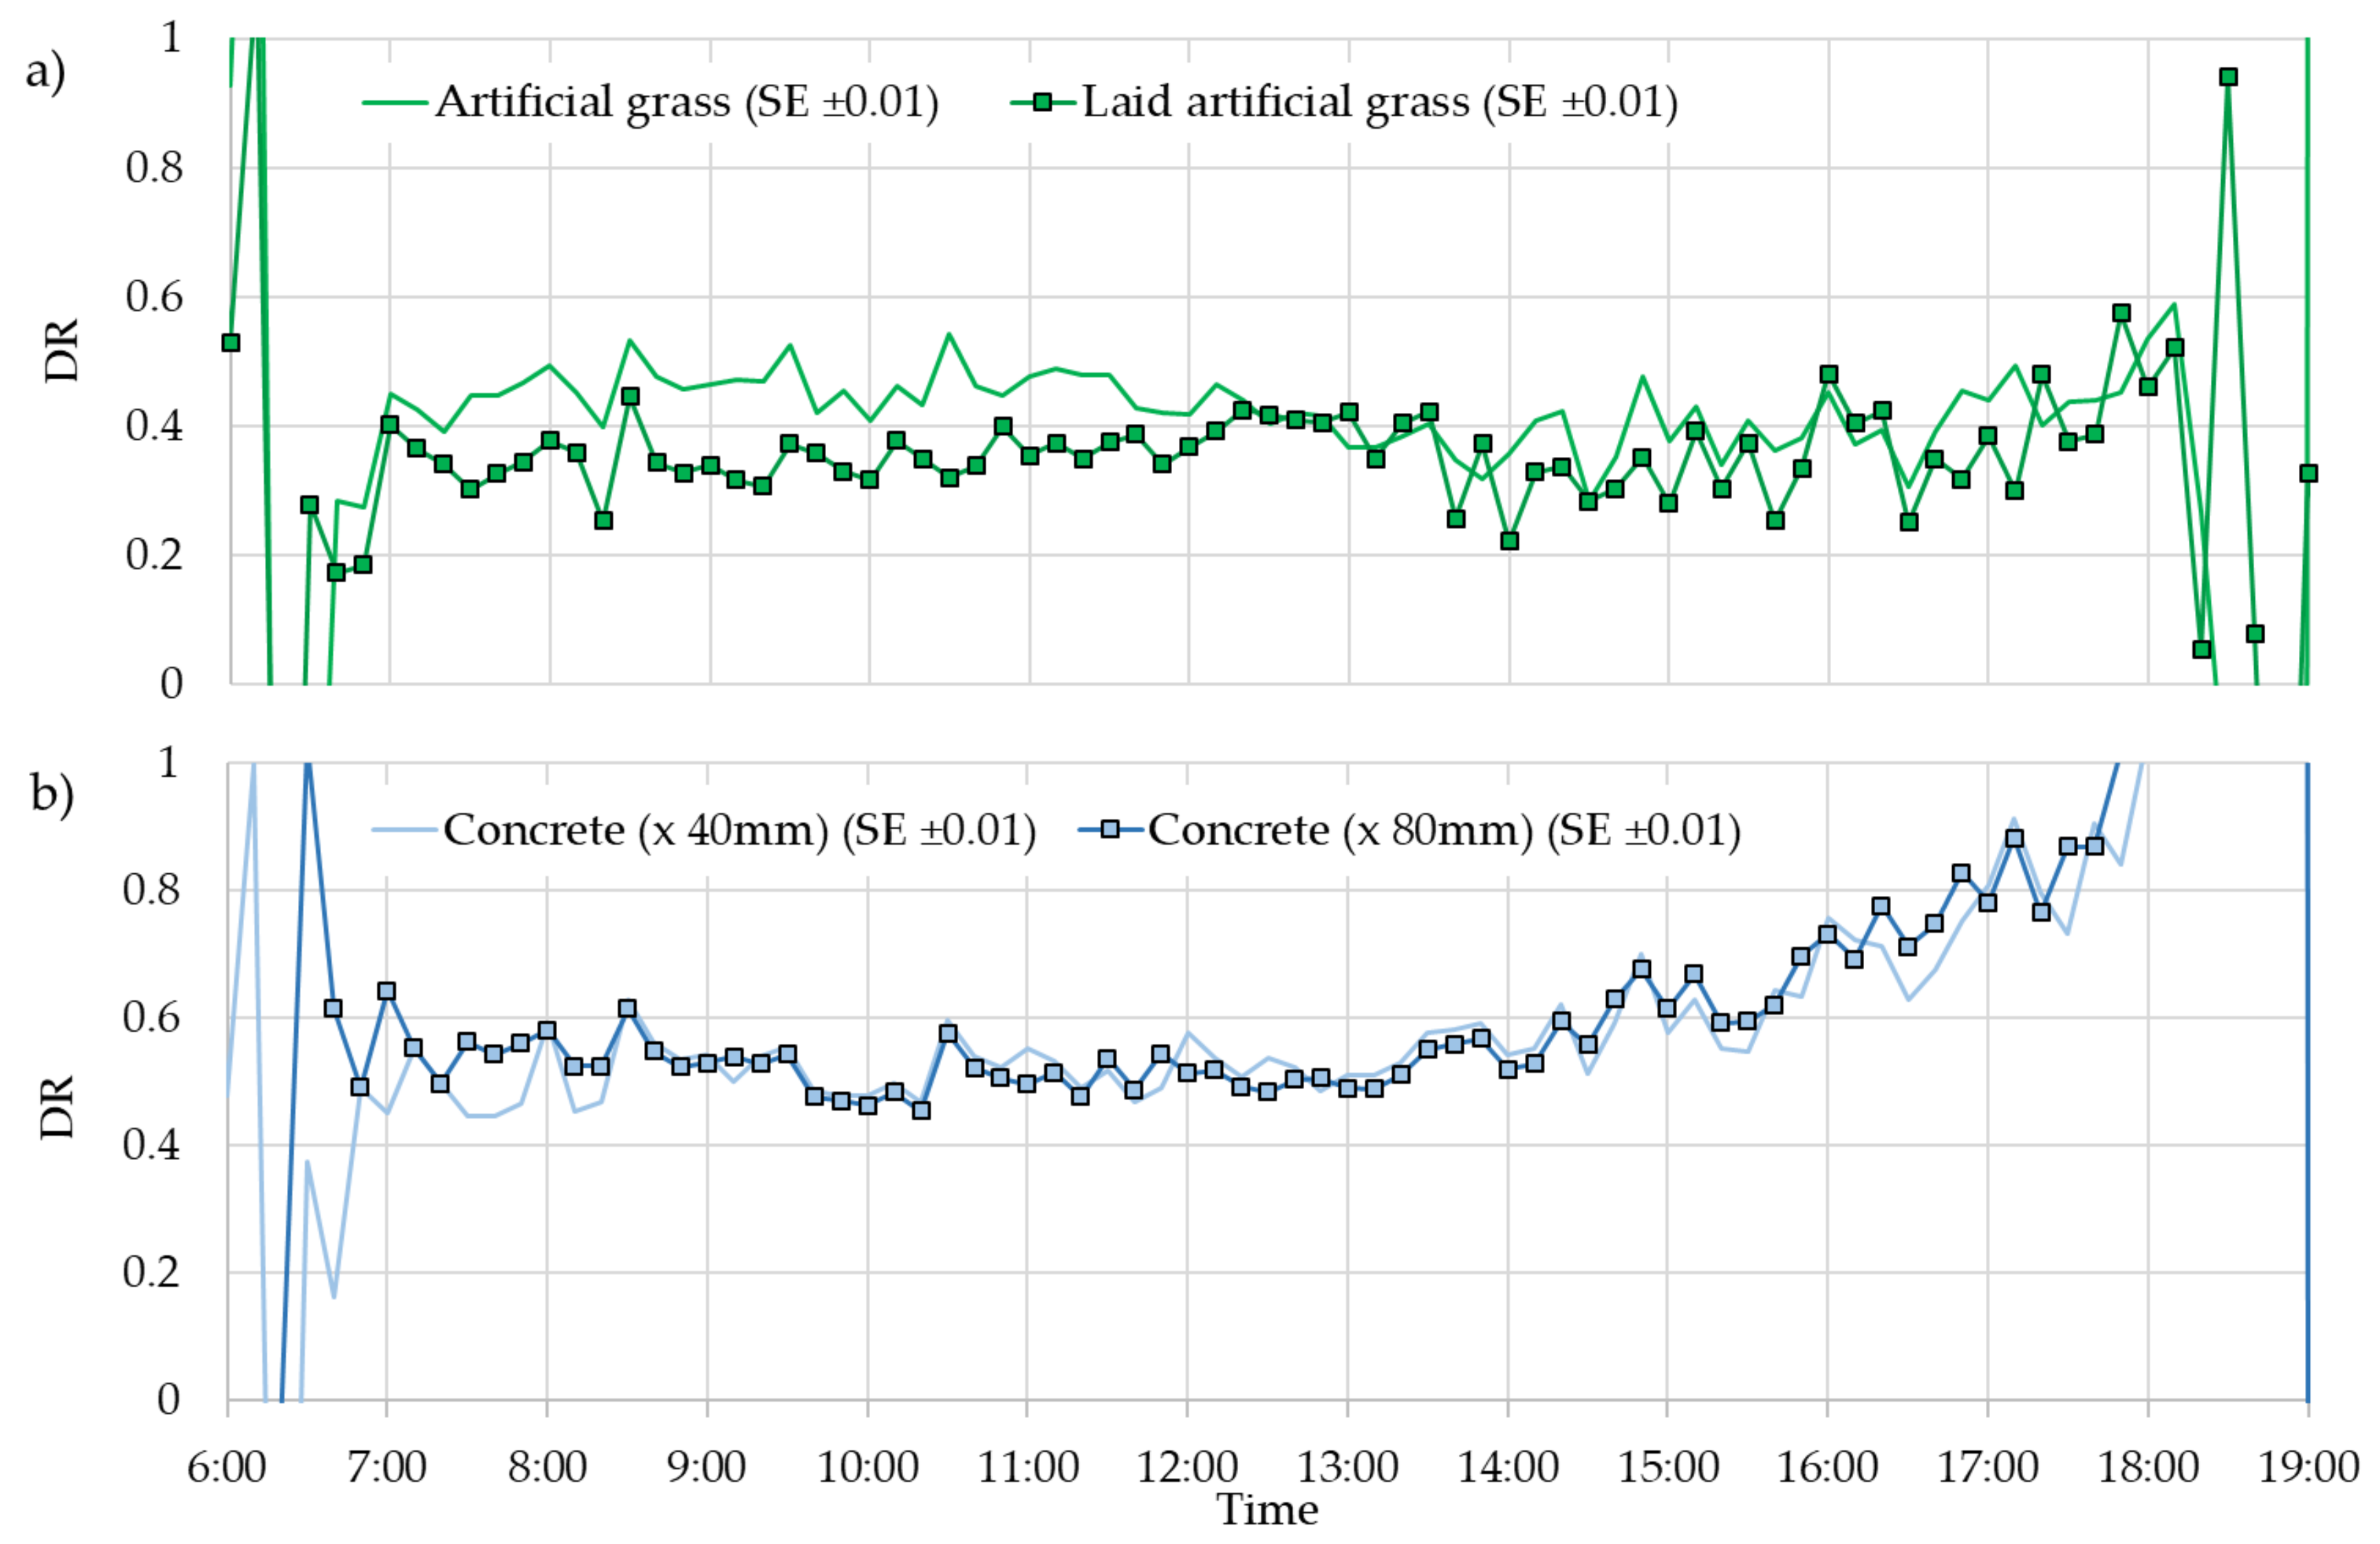
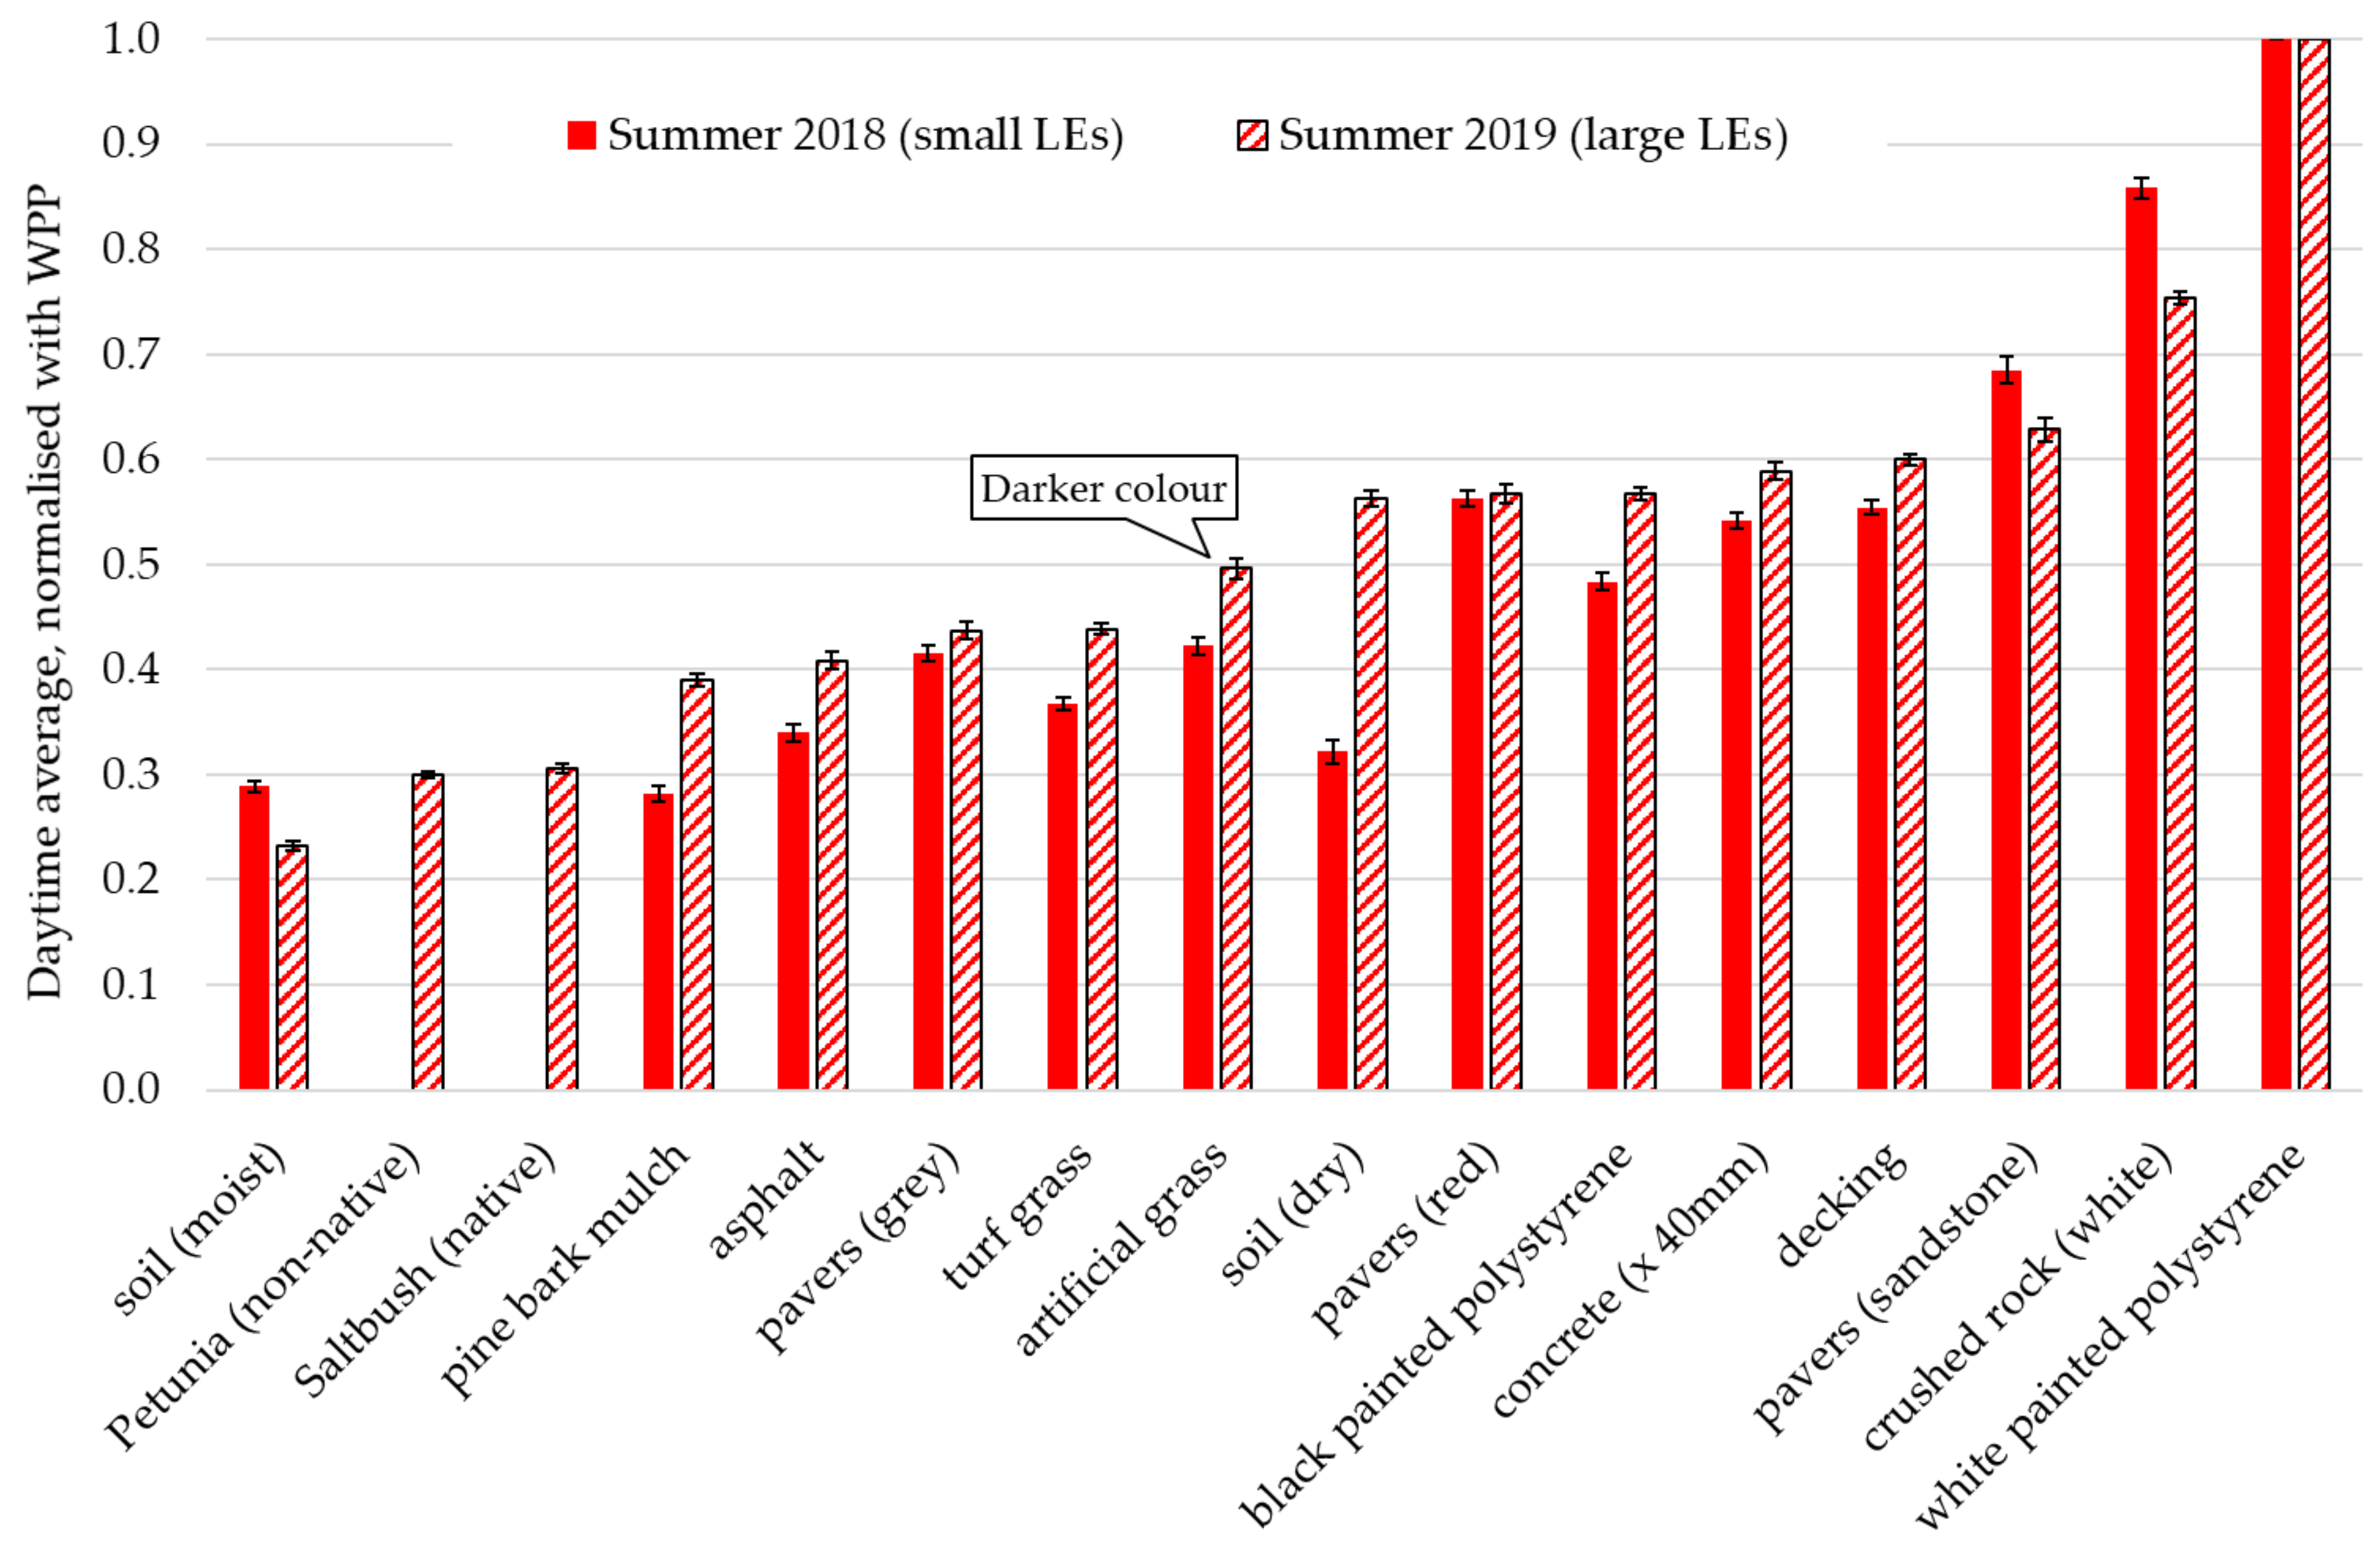
3.4. Summer Comparison of LE Size and Ground coupling—Phase 2
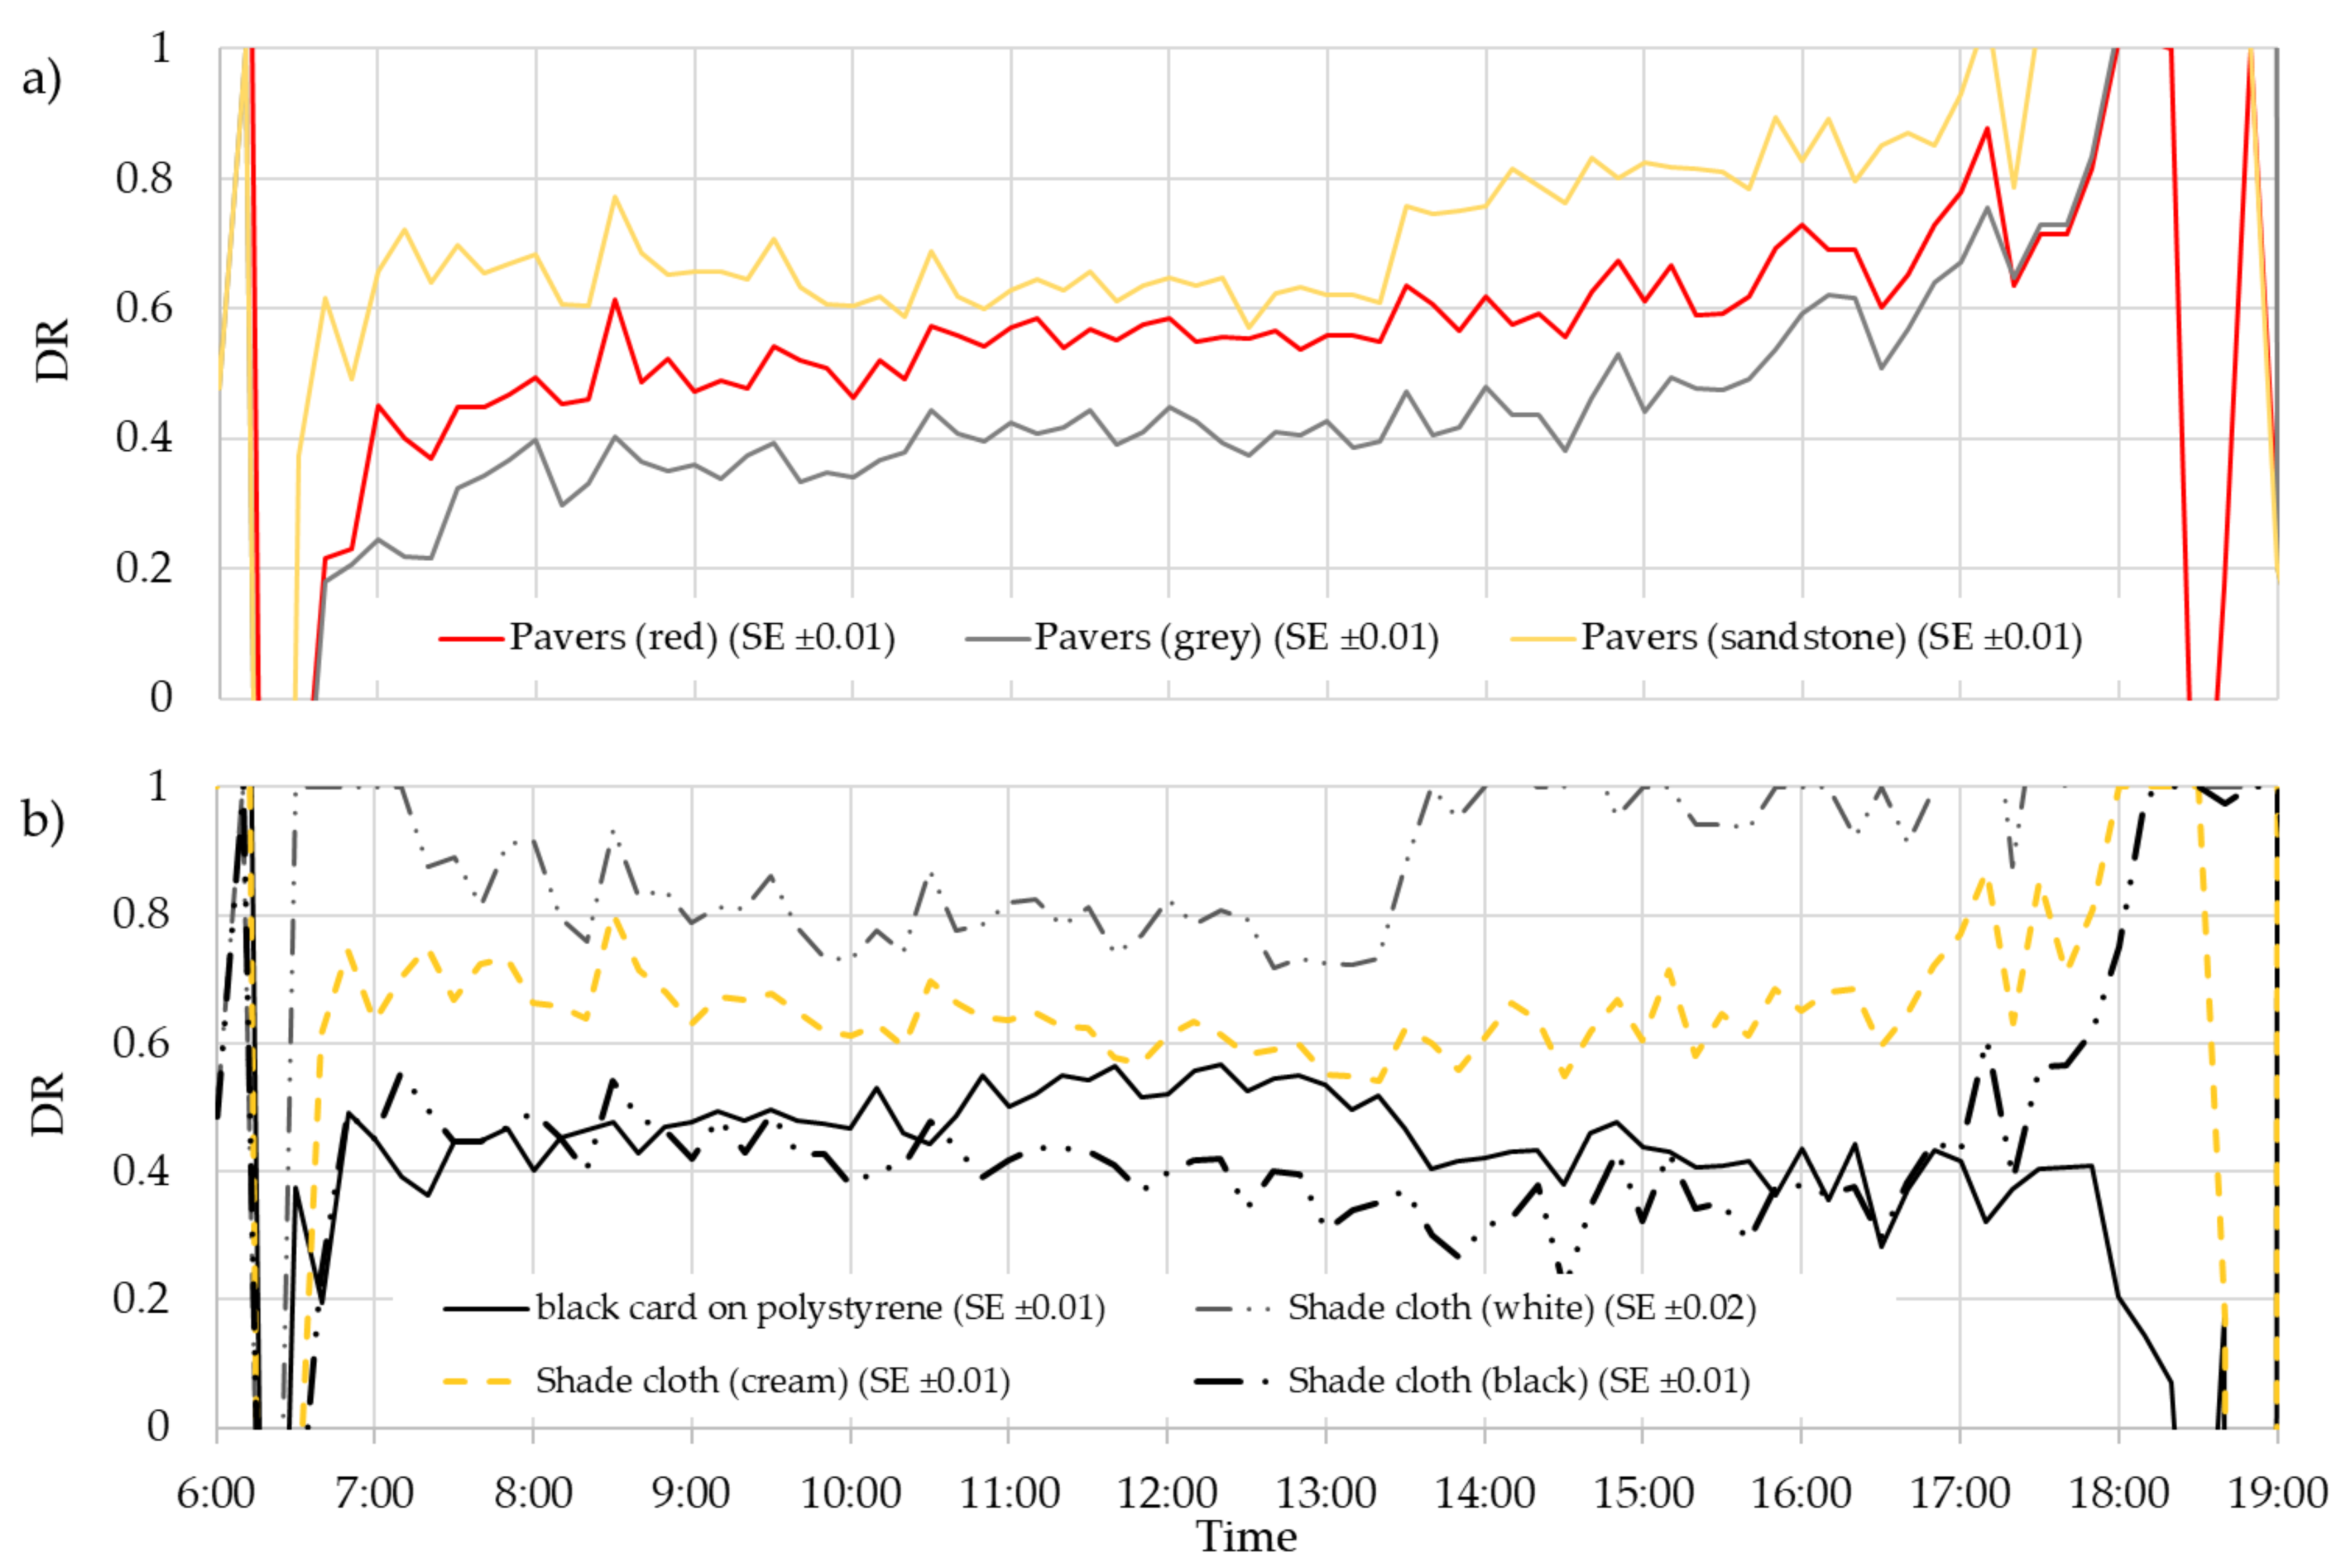
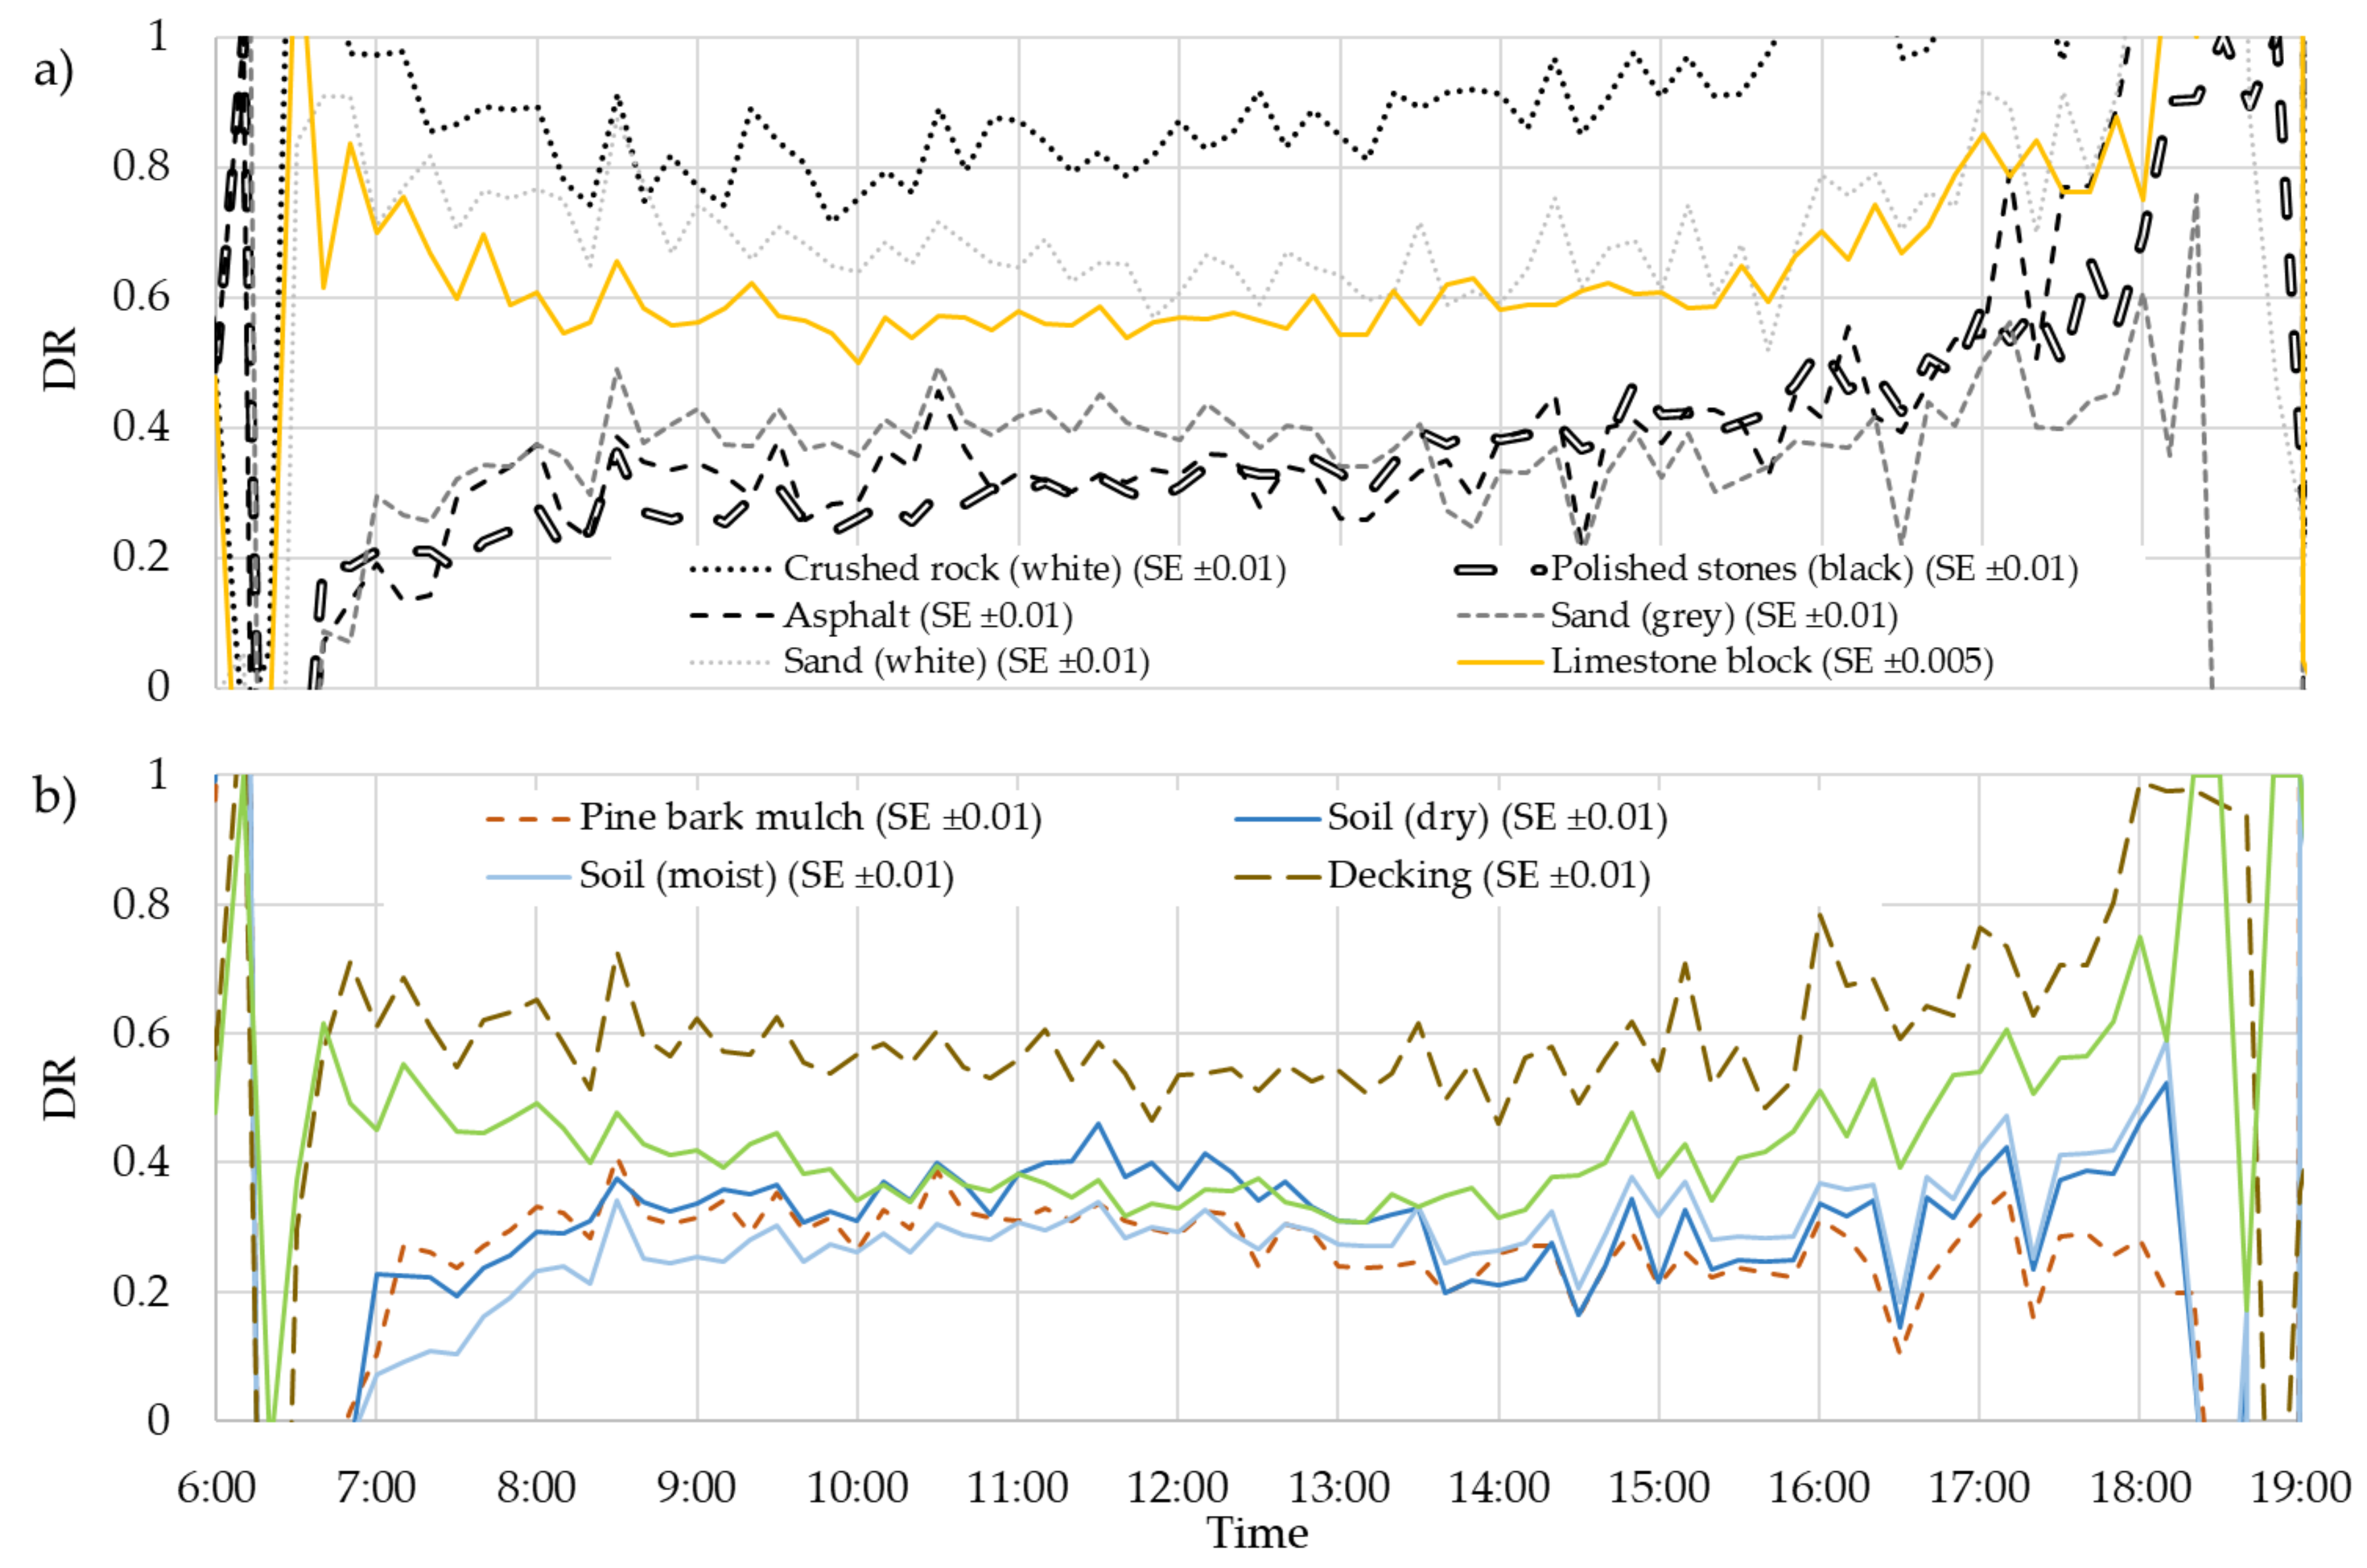
3.5. Ranking LEs
3.6. Limitations
4. Conclusions
Author Contributions
Funding
Acknowledgments
Conflicts of Interest
Nomenclature
| DRav | Average daytime ratio of the LE’s iButton temperature minus Tamb over the WPP’s iButton temperature minus Tamb during the hours where SR > 70% of that occurring at solar noon on that day |
| εiB | Emissivity of the painted iButton |
| FOV | Field of view |
| LE | Landscape element; a surface treatment found in a domestic garden or urban landscape |
| LWR | Long-wave radiation; electromagnetic radiation from 2.5 μm–100 μm (W·m−2) |
| NIR | Near infra-red radiation, electromagnetic radiation from 0.7 μm – 2.5 μm (W·m−2) |
| PP | Polypropylene (white Polypropylene bags) |
| Radiosity | total radiant energy from a LE, comprising reflected SR and emitted LWR (W·m−2) |
| SE | Standard error |
| SR | Solar radiation (W·m−2) |
| SVF | Sky view factor; a measure of the degree of site sky visibility |
| SWR | Short-wave radiation, electromagnetic radiation consisting of ultraviolet, visible and near infra-red radiation ranging from 0.3 μm–2.5 μm (W·m−2) |
| Tamb | Temperature of ambient air (°C) |
| TiB,Other | Temperature of the iButton due to objects other than the LE, surrounding turf grass and PP bag (°C) |
| TiB,grass | Temperature of the iButton due to the surrounding turf grass (°C) |
| TiB,LE | Temperature of the iButton due to the landscape element (°C) |
| TiB,PP | Temperature of the iButton due to the white polypropylene (°C) |
| TiB,WPP | Temperature of the iButton due to the white painted polystyrene (°C) |
| VF | View factor (subscripts are as for TiB) |
| WPP | White painted polystyrene |
Appendix A

| 09/04/2017, autumn | TiB,LE has been corrected for View Factors over turf grass and PP | |||||||||||||||||||||||
| TiB,LE (°C) | VF of LE | 0.75 | 0.43 | 0.56 | 0.54 | 0.58 | 0.58 | 0.60 | 0.45 | 0.54 | 0.58 | 0.54 | 0.66 | 0.62 | 0.56 | 0.56 | 0.63 | 0.61 | 0.61 | 0.62 | 0.59 | 0.95 | 0.61 | |
| Time | Murdoch Tambient | A | B | C | D | E | F | G | H | I | J | K | L | M | N | O | P | Q | R | S | T | U | V | W |
| 6:00 | 12.3 | 12.3 | 14.5 | 12.8 | 11.9 | 11.9 | 13.4 | 12.5 | 13.2 | 12.9 | 12.7 | 12.9 | 11.7 | 13.2 | 11.4 | 12.2 | 12.6 | 11.8 | 12.6 | 11.7 | 11.7 | 11.0 | 12.6 | |
| 6:10 | 12.0 | 12.0 | 13.2 | 12.0 | 12.0 | 12.9 | 12.9 | 12.6 | 13.1 | 12.0 | 12.0 | 12.0 | 12.0 | 12.8 | 11.1 | 12.7 | 12.8 | 11.2 | 12.0 | 12.0 | 12.0 | 12.0 | 12.0 | |
| 6:20 | 12.4 | 11.5 | 12.7 | 11.5 | 11.5 | 12.4 | 12.4 | 12.1 | 12.6 | 11.5 | 11.5 | 11.5 | 11.5 | 12.3 | 10.6 | 12.2 | 11.5 | 10.7 | 11.5 | 10.7 | 11.5 | 11.5 | 10.7 | |
| 6:30 | 13.0 | 11.0 | 12.2 | 11.0 | 11.0 | 11.9 | 11.9 | 11.6 | 13.2 | 11.0 | 11.0 | 11.0 | 11.0 | 11.8 | 11.0 | 11.6 | 11.8 | 10.2 | 11.0 | 11.0 | 11.0 | 11.0 | 11.0 | |
| 6:40 | 13.2 | 10.3 | 12.2 | 10.1 | 11.0 | 11.9 | 11.9 | 11.6 | 12.1 | 11.0 | 11.0 | 11.0 | 11.0 | 11.8 | 10.1 | 11.6 | 11.0 | 10.2 | 11.0 | 10.2 | 11.0 | 11.0 | 10.2 | |
| 6:50 | 13.4 | 11.0 | 12.2 | 11.0 | 11.0 | 11.9 | 11.9 | 11.6 | 12.1 | 11.0 | 11.0 | 11.0 | 11.0 | 11.8 | 11.0 | 11.6 | 11.8 | 11.0 | 11.0 | 11.0 | 11.0 | 11.0 | 11.0 | |
| 7:00 | 14.0 | 11.5 | 12.7 | 11.5 | 11.5 | 12.4 | 12.4 | 12.1 | 12.6 | 11.5 | 11.5 | 11.5 | 11.5 | 11.5 | 10.6 | 12.2 | 12.3 | 11.5 | 11.5 | 11.5 | 11.5 | 11.5 | 11.5 | |
| 7:10 | 14.4 | 11.5 | 13.8 | 11.5 | 11.5 | 12.4 | 13.1 | 12.1 | 13.7 | 11.5 | 11.5 | 11.5 | 12.2 | 12.2 | 11.3 | 12.0 | 12.3 | 11.5 | 12.3 | 11.4 | 11.4 | 11.5 | 12.3 | |
| 7:20 | 14.8 | 12.7 | 13.2 | 12.0 | 12.0 | 12.9 | 13.6 | 12.6 | 14.2 | 12.0 | 12.0 | 12.0 | 12.0 | 12.7 | 11.8 | 13.4 | 12.8 | 12.0 | 12.8 | 11.9 | 11.9 | 12.0 | 12.8 | |
| 7:30 | 15.3 | 12.2 | 12.3 | 11.7 | 12.6 | 13.5 | 12.7 | 12.5 | 14.6 | 11.6 | 11.8 | 11.6 | 12.0 | 12.0 | 11.1 | 12.6 | 12.7 | 11.9 | 12.7 | 12.0 | 11.9 | 13.5 | 11.9 | |
| 7:40 | 15.7 | 13.0 | 13.0 | 13.0 | 13.0 | 13.9 | 13.8 | 13.6 | 15.2 | 13.0 | 13.0 | 13.0 | 13.0 | 12.9 | 11.9 | 13.5 | 13.8 | 13.0 | 13.8 | 12.1 | 12.9 | 13.0 | 13.8 | |
| 7:50 | 16.1 | 12.5 | 9.5 | 15.6 | 13.7 | 15.6 | 18.6 | 15.5 | 19.8 | 10.9 | 13.1 | 10.9 | 12.0 | 14.5 | 12.3 | 13.7 | 11.7 | 11.6 | 12.4 | 12.8 | 13.5 | 16.5 | 18.1 | |
| 8:00 | 16.6 | 15.2 | 13.8 | 17.6 | 16.6 | 17.6 | 21.9 | 18.4 | 21.8 | 12.9 | 15.9 | 16.6 | 15.5 | 16.0 | 15.6 | 18.2 | 14.5 | 16.9 | 19.3 | 16.0 | 15.9 | 18.5 | 21.8 | |
| 8:10 | 16.9 | 17.3 | 15.3 | 18.2 | 18.1 | 19.1 | 23.2 | 21.6 | 23.3 | 16.3 | 17.4 | 19.1 | 16.9 | 16.5 | 17.5 | 21.1 | 16.8 | 20.0 | 22.5 | 17.4 | 17.2 | 20.0 | 23.3 | |
| 8:20 | 17.3 | 19.0 | 16.3 | 20.1 | 19.1 | 21.0 | 24.9 | 23.4 | 25.4 | 17.3 | 19.3 | 21.0 | 18.7 | 18.1 | 18.9 | 22.7 | 18.6 | 21.8 | 25.1 | 19.1 | 18.1 | 21.0 | 25.1 | |
| 8:30 | 17.5 | 19.8 | 16.7 | 21.6 | 20.6 | 21.6 | 26.4 | 25.0 | 25.8 | 18.8 | 20.8 | 21.6 | 19.4 | 18.8 | 20.4 | 24.2 | 19.3 | 23.3 | 26.6 | 19.8 | 18.8 | 22.5 | 26.6 | |
| 8:40 | 17.6 | 20.8 | 17.7 | 22.6 | 21.6 | 22.6 | 27.4 | 26.0 | 27.9 | 19.8 | 21.8 | 23.5 | 20.4 | 19.8 | 21.4 | 26.1 | 20.3 | 24.3 | 27.6 | 20.8 | 19.8 | 23.5 | 28.4 | |
| 8:50 | 18.2 | 22.0 | 19.3 | 24.0 | 24.0 | 24.0 | 29.4 | 28.1 | 29.6 | 21.2 | 23.1 | 25.9 | 21.6 | 20.9 | 23.3 | 27.1 | 22.4 | 26.5 | 29.7 | 21.9 | 21.0 | 24.0 | 30.6 | |
| 9:00 | 18.5 | 23.0 | 20.3 | 25.0 | 25.0 | 25.0 | 30.4 | 29.2 | 30.6 | 22.2 | 24.1 | 26.9 | 22.6 | 21.9 | 24.3 | 28.1 | 23.4 | 26.6 | 30.7 | 22.9 | 22.0 | 25.0 | 32.4 | |
| 9:10 | 18.8 | 24.7 | 20.2 | 26.0 | 26.0 | 26.0 | 31.4 | 30.2 | 31.6 | 23.2 | 25.1 | 27.9 | 23.6 | 22.9 | 25.3 | 30.1 | 26.0 | 27.6 | 31.7 | 23.9 | 22.1 | 26.0 | 33.4 | |
| 9:20 | 19.1 | 24.5 | 20.7 | 25.6 | 26.5 | 26.5 | 32.0 | 30.7 | 32.1 | 23.7 | 25.6 | 28.4 | 23.4 | 22.7 | 26.0 | 30.8 | 25.7 | 28.1 | 31.4 | 24.5 | 23.5 | 26.5 | 33.9 | |
| 9:30 | 19.4 | 26.2 | 21.7 | 27.5 | 27.5 | 27.5 | 33.8 | 31.7 | 33.1 | 24.7 | 27.5 | 29.4 | 24.4 | 23.6 | 26.8 | 31.6 | 27.5 | 30.0 | 33.2 | 25.4 | 23.6 | 27.5 | 35.7 | |
| 9:40 | 19.8 | 27.3 | 23.3 | 28.0 | 28.9 | 28.9 | 35.1 | 33.0 | 34.7 | 26.1 | 28.9 | 30.8 | 25.6 | 24.8 | 27.9 | 33.7 | 29.6 | 32.1 | 34.6 | 26.7 | 24.9 | 28.0 | 37.8 | |
| 9:50 | 20.1 | 28.3 | 23.2 | 29.0 | 29.9 | 29.9 | 36.1 | 34.0 | 35.7 | 26.2 | 29.0 | 31.8 | 25.9 | 25.0 | 28.9 | 34.7 | 30.6 | 33.1 | 35.6 | 27.7 | 25.9 | 29.0 | 38.8 | |
| 10:00 | 20.5 | 29.5 | 23.7 | 29.5 | 30.4 | 30.4 | 37.4 | 34.5 | 36.2 | 26.7 | 30.4 | 33.2 | 27.1 | 25.4 | 30.1 | 35.0 | 31.1 | 34.4 | 36.9 | 28.1 | 26.3 | 29.5 | 40.2 | |
| 10:10 | 20.9 | 29.8 | 25.8 | 30.5 | 31.4 | 31.4 | 38.4 | 35.5 | 38.3 | 27.7 | 31.4 | 33.3 | 28.1 | 26.4 | 31.1 | 36.9 | 31.3 | 36.2 | 37.9 | 29.1 | 27.3 | 30.5 | 41.2 | |
| 10:20 | 21.2 | 29.8 | 24.7 | 30.5 | 32.4 | 31.4 | 38.4 | 35.5 | 38.3 | 28.6 | 31.4 | 34.2 | 27.4 | 26.4 | 31.1 | 36.9 | 31.3 | 36.2 | 37.9 | 29.1 | 27.3 | 30.5 | 42.0 | |
| 10:30 | 21.3 | 31.5 | 25.7 | 31.5 | 33.4 | 33.2 | 39.3 | 36.6 | 39.3 | 29.6 | 32.4 | 35.2 | 29.1 | 27.3 | 32.7 | 38.6 | 33.1 | 37.2 | 39.7 | 30.0 | 28.3 | 31.5 | 43.0 | |
| 10:40 | 22.0 | 30.2 | 25.7 | 30.6 | 33.4 | 33.2 | 39.4 | 35.7 | 39.3 | 29.6 | 32.4 | 35.2 | 28.4 | 27.4 | 32.1 | 37.9 | 32.3 | 36.4 | 38.9 | 29.3 | 28.3 | 31.5 | 43.0 | |
| 10:50 | 22.3 | 31.3 | 25.0 | 31.1 | 33.9 | 33.7 | 39.8 | 36.2 | 39.8 | 30.1 | 32.9 | 35.7 | 28.8 | 27.8 | 32.3 | 38.2 | 32.8 | 37.7 | 40.2 | 29.7 | 28.8 | 32.0 | 43.5 | |
| 11:00 | 23.0 | 31.8 | 26.7 | 32.5 | 34.4 | 34.2 | 41.1 | 37.6 | 41.4 | 30.6 | 34.2 | 37.1 | 29.3 | 28.3 | 33.5 | 39.5 | 33.3 | 38.2 | 41.5 | 31.0 | 29.2 | 32.5 | 44.8 | |
| 11:10 | 23.0 | 32.8 | 26.5 | 33.5 | 35.4 | 35.2 | 41.2 | 37.7 | 42.4 | 31.6 | 34.4 | 37.2 | 29.6 | 29.3 | 33.6 | 40.5 | 34.3 | 39.2 | 42.5 | 31.2 | 30.2 | 33.5 | 45.8 | |
| 11:20 | 23.2 | 32.8 | 27.7 | 33.5 | 36.3 | 35.2 | 42.0 | 38.6 | 42.4 | 31.6 | 35.2 | 38.1 | 30.3 | 29.2 | 34.3 | 41.2 | 34.3 | 40.1 | 43.3 | 31.9 | 31.0 | 33.5 | 46.6 | |
| 11:30 | 23.6 | 33.5 | 27.7 | 33.5 | 36.3 | 35.2 | 42.0 | 37.7 | 42.4 | 32.6 | 36.1 | 38.1 | 30.3 | 29.2 | 34.3 | 41.2 | 35.1 | 40.1 | 43.3 | 31.9 | 31.0 | 33.5 | 46.6 | |
| 11:40 | 24.0 | 34.7 | 29.3 | 35.8 | 37.7 | 36.6 | 44.1 | 39.1 | 44.0 | 33.1 | 37.4 | 39.6 | 31.6 | 30.4 | 35.4 | 42.4 | 36.4 | 40.6 | 44.7 | 33.1 | 31.4 | 34.0 | 48.8 | |
| 11:50 | 24.5 | 35.2 | 29.8 | 36.3 | 38.2 | 37.1 | 43.7 | 39.6 | 44.5 | 33.6 | 37.1 | 40.1 | 32.1 | 30.9 | 35.9 | 42.9 | 36.9 | 41.9 | 45.2 | 34.4 | 32.7 | 34.5 | 49.3 | |
| 12:00 | 24.8 | 35.7 | 30.3 | 36.8 | 38.7 | 37.6 | 44.2 | 40.1 | 45.0 | 34.1 | 38.4 | 40.6 | 32.6 | 31.4 | 36.4 | 43.4 | 37.4 | 41.6 | 45.7 | 34.9 | 32.4 | 35.0 | 49.8 | |
| 12:10 | 24.9 | 35.0 | 29.2 | 35.0 | 37.8 | 37.6 | 43.5 | 39.2 | 43.9 | 34.1 | 37.6 | 40.6 | 32.6 | 30.7 | 35.8 | 42.7 | 35.8 | 41.6 | 44.8 | 34.2 | 32.5 | 35.0 | 48.9 | |
| 12:20 | 25.4 | 36.2 | 30.8 | 37.3 | 39.2 | 38.9 | 44.7 | 40.6 | 45.5 | 34.6 | 38.9 | 41.1 | 33.8 | 31.9 | 37.8 | 44.8 | 37.1 | 42.1 | 46.2 | 35.4 | 32.9 | 35.5 | 50.3 | |
| 12:30 | 25.1 | 36.2 | 30.8 | 36.4 | 39.2 | 38.9 | 44.8 | 40.6 | 45.5 | 34.6 | 38.1 | 41.1 | 33.1 | 32.0 | 37.2 | 44.1 | 37.9 | 42.1 | 45.3 | 35.5 | 33.8 | 35.5 | 49.4 | |
| 12:40 | 25.4 | 35.7 | 31.5 | 36.8 | 39.6 | 38.4 | 44.2 | 40.1 | 45.0 | 36.9 | 38.4 | 41.5 | 33.3 | 32.2 | 37.3 | 44.3 | 37.4 | 42.4 | 45.7 | 34.9 | 33.2 | 35.0 | 49.8 | |
| 12:50 | 25.5 | 36.7 | 31.3 | 37.8 | 39.7 | 39.4 | 45.3 | 41.1 | 46.0 | 37.9 | 39.4 | 41.6 | 34.3 | 32.5 | 38.5 | 45.5 | 38.4 | 42.6 | 45.8 | 36.0 | 34.3 | 36.0 | 49.9 | |
| 13:00 | 26.1 | 36.7 | 31.3 | 37.8 | 39.7 | 39.4 | 44.5 | 40.3 | 46.0 | 37.9 | 39.4 | 41.6 | 33.6 | 32.5 | 37.7 | 43.7 | 37.6 | 42.6 | 45.8 | 36.0 | 34.3 | 36.0 | 49.9 | |
| 13:10 | 26.0 | 36.8 | 33.2 | 38.2 | 40.1 | 39.8 | 45.6 | 40.6 | 46.6 | 37.4 | 39.8 | 42.0 | 33.8 | 32.7 | 37.8 | 43.9 | 38.7 | 42.9 | 46.2 | 36.3 | 34.6 | 35.5 | 50.3 | |
| 13:20 | 26.2 | 36.7 | 32.5 | 37.8 | 40.6 | 39.4 | 44.5 | 41.1 | 46.0 | 38.8 | 40.3 | 42.5 | 34.3 | 33.3 | 38.5 | 44.6 | 38.4 | 41.7 | 45.8 | 36.8 | 34.3 | 36.0 | 49.9 | |
| 13:30 | 26.1 | 36.0 | 32.5 | 36.9 | 39.7 | 39.4 | 44.6 | 40.3 | 44.9 | 37.9 | 39.4 | 41.6 | 34.3 | 32.6 | 37.9 | 43.9 | 37.6 | 41.7 | 45.0 | 36.1 | 33.5 | 36.0 | 49.1 | |
| 13:40 | 26.2 | 36.0 | 32.5 | 37.8 | 40.6 | 40.3 | 44.5 | 40.3 | 46.0 | 36.0 | 39.4 | 42.5 | 34.3 | 33.3 | 38.5 | 43.7 | 37.6 | 42.6 | 45.8 | 35.2 | 34.3 | 36.0 | 49.1 | |
| 13:50 | 26.6 | 35.3 | 31.3 | 36.0 | 39.7 | 39.4 | 43.8 | 39.4 | 44.9 | 35.1 | 38.6 | 41.6 | 33.6 | 32.7 | 37.2 | 43.2 | 36.8 | 40.9 | 44.2 | 35.3 | 34.5 | 36.0 | 48.3 | |
| 14:00 | 26.8 | 36.7 | 33.7 | 37.8 | 40.6 | 40.3 | 43.7 | 40.3 | 46.0 | 36.0 | 39.4 | 41.6 | 35.1 | 33.4 | 38.8 | 43.9 | 37.6 | 41.7 | 45.0 | 36.9 | 35.2 | 36.0 | 48.3 | |
| 14:10 | 27.1 | 36.0 | 33.7 | 36.9 | 39.7 | 39.4 | 43.8 | 40.3 | 44.9 | 35.1 | 38.6 | 41.6 | 35.1 | 32.7 | 38.1 | 43.2 | 37.6 | 40.9 | 44.2 | 36.1 | 34.5 | 36.0 | 48.3 | |
| 14:20 | 26.9 | 35.5 | 33.2 | 36.4 | 40.1 | 39.8 | 43.3 | 39.7 | 44.4 | 35.5 | 38.9 | 41.1 | 33.9 | 33.0 | 37.6 | 42.7 | 36.3 | 40.4 | 43.7 | 35.6 | 34.0 | 35.5 | 47.0 | |
| 14:30 | 27.2 | 36.2 | 34.3 | 37.3 | 40.1 | 39.8 | 42.5 | 39.7 | 44.4 | 35.5 | 38.9 | 41.1 | 34.6 | 33.1 | 37.9 | 42.9 | 37.1 | 40.4 | 42.9 | 35.7 | 34.0 | 35.5 | 46.2 | |
| 14:40 | 26.9 | 34.5 | 32.2 | 35.4 | 39.1 | 37.9 | 41.5 | 37.9 | 42.3 | 34.5 | 37.9 | 40.1 | 32.9 | 32.1 | 36.9 | 41.9 | 35.3 | 38.6 | 41.9 | 34.7 | 33.0 | 34.5 | 45.2 | |
| 14:50 | 27.2 | 34.3 | 32.7 | 35.9 | 38.7 | 38.4 | 41.2 | 37.6 | 42.8 | 35.0 | 37.6 | 40.6 | 32.6 | 32.6 | 36.7 | 40.8 | 35.8 | 38.3 | 41.6 | 34.5 | 33.6 | 35.0 | 44.8 | |
| 15:00 | 27.4 | 35.2 | 33.3 | 36.3 | 38.2 | 37.9 | 40.7 | 37.9 | 42.3 | 35.4 | 37.9 | 40.1 | 33.6 | 32.1 | 37.1 | 41.1 | 36.1 | 38.6 | 41.1 | 34.8 | 33.1 | 34.5 | 44.3 | |
| 15:10 | 27.3 | 34.0 | 32.8 | 34.9 | 37.7 | 37.4 | 39.4 | 36.6 | 40.7 | 34.0 | 36.6 | 38.6 | 32.4 | 31.7 | 35.9 | 39.0 | 34.8 | 37.3 | 39.7 | 33.5 | 32.7 | 34.0 | 42.2 | |
| 15:20 | 27.1 | 33.5 | 32.3 | 33.5 | 37.2 | 36.9 | 38.9 | 36.1 | 40.2 | 33.5 | 36.1 | 38.1 | 31.9 | 31.2 | 35.4 | 38.5 | 34.3 | 36.8 | 39.2 | 32.2 | 32.2 | 33.5 | 41.7 | |
| 15:30 | 27.0 | 31.8 | 31.3 | 32.5 | 35.3 | 35.9 | 37.2 | 34.2 | 38.1 | 32.5 | 35.1 | 37.1 | 30.9 | 30.3 | 33.8 | 36.8 | 32.5 | 34.1 | 37.4 | 30.5 | 30.4 | 32.5 | 39.9 | |
| 15:40 | 27.4 | 30.8 | 30.3 | 30.6 | 34.3 | 34.9 | 35.4 | 33.2 | 37.1 | 31.5 | 33.2 | 35.2 | 29.9 | 29.4 | 33.0 | 36.0 | 30.7 | 32.3 | 35.6 | 30.4 | 29.5 | 31.5 | 38.1 | |
| 15:50 | 27.2 | 29.2 | 29.3 | 29.6 | 33.3 | 33.1 | 34.4 | 31.4 | 34.9 | 31.4 | 32.2 | 34.2 | 28.9 | 29.2 | 31.1 | 34.1 | 29.7 | 31.3 | 34.6 | 28.6 | 28.5 | 30.5 | 36.2 | |
| 16:00 | 27.0 | 28.2 | 28.3 | 28.6 | 32.3 | 32.9 | 33.5 | 30.3 | 35.1 | 30.4 | 31.2 | 33.2 | 27.9 | 28.3 | 30.3 | 33.3 | 28.7 | 30.3 | 32.8 | 27.6 | 27.5 | 29.5 | 35.2 | |
| 16:10 | 27.0 | 27.2 | 27.3 | 27.6 | 30.4 | 31.1 | 31.6 | 29.3 | 31.8 | 29.4 | 30.2 | 32.2 | 26.9 | 27.3 | 29.3 | 31.4 | 26.9 | 28.5 | 31.8 | 26.6 | 26.5 | 28.5 | 32.6 | |
| 16:20 | 27.1 | 26.2 | 26.3 | 25.7 | 29.4 | 30.1 | 29.8 | 27.5 | 30.8 | 27.5 | 28.4 | 30.3 | 25.2 | 26.4 | 27.7 | 29.6 | 25.9 | 26.7 | 30.0 | 25.7 | 25.6 | 27.5 | 30.8 | |
| 16:30 | 25.3 | 25.2 | 25.3 | 25.6 | 28.4 | 29.1 | 28.9 | 26.5 | 29.8 | 27.4 | 27.4 | 29.3 | 25.0 | 25.5 | 26.9 | 28.8 | 25.7 | 26.5 | 28.1 | 24.8 | 24.7 | 26.5 | 29.8 | |
| 16:40 | 24.2 | 24.8 | 25.5 | 24.6 | 27.4 | 28.1 | 27.9 | 26.3 | 28.8 | 26.4 | 27.2 | 28.3 | 24.7 | 25.3 | 25.9 | 27.8 | 24.7 | 25.5 | 27.1 | 24.6 | 24.5 | 25.5 | 28.0 | |
| 16:50 | 23.8 | 23.8 | 24.5 | 23.6 | 26.4 | 27.1 | 26.9 | 25.3 | 27.8 | 26.4 | 26.2 | 27.3 | 23.7 | 24.3 | 24.9 | 26.8 | 24.5 | 24.5 | 26.1 | 23.6 | 23.5 | 24.5 | 27.0 | |
| 17:00 | 23.6 | 23.3 | 25.2 | 23.1 | 25.9 | 26.6 | 25.6 | 24.0 | 26.2 | 24.9 | 24.9 | 26.8 | 23.2 | 23.9 | 24.7 | 25.6 | 24.0 | 23.2 | 24.8 | 23.1 | 23.1 | 24.0 | 25.6 | |
| 17:10 | 23.5 | 22.3 | 24.2 | 22.1 | 24.9 | 25.6 | 24.6 | 22.9 | 25.2 | 24.9 | 23.9 | 25.8 | 22.2 | 22.9 | 23.7 | 24.6 | 23.0 | 22.2 | 23.8 | 22.1 | 22.1 | 23.0 | 23.8 | |
| 17:20 | 23.5 | 20.7 | 24.3 | 20.2 | 24.8 | 25.4 | 22.1 | 22.8 | 24.2 | 22.9 | 22.0 | 23.9 | 22.0 | 22.1 | 23.1 | 23.9 | 21.2 | 20.4 | 21.2 | 22.1 | 22.1 | 22.0 | 20.4 | |
| 17:30 | 22.8 | 19.0 | 23.3 | 19.2 | 23.8 | 24.4 | 21.2 | 21.8 | 23.2 | 21.9 | 21.9 | 22.9 | 21.0 | 22.0 | 22.4 | 23.1 | 20.2 | 18.5 | 19.4 | 21.1 | 21.1 | 21.0 | 19.4 | |
| 17:40 | 22.1 | 19.2 | 22.8 | 19.6 | 22.4 | 23.1 | 21.4 | 21.2 | 22.7 | 22.4 | 21.4 | 22.4 | 20.5 | 21.4 | 20.7 | 21.5 | 19.7 | 18.9 | 19.7 | 20.6 | 20.6 | 20.5 | 19.7 | |
| 17:50 | 21.6 | 18.2 | 21.8 | 18.6 | 21.4 | 22.9 | 20.4 | 20.2 | 21.7 | 21.4 | 20.4 | 21.4 | 19.5 | 21.2 | 19.7 | 20.5 | 18.7 | 17.9 | 18.7 | 19.6 | 19.6 | 19.5 | 17.9 | |
| 18:00 | 21.0 | 17.2 | 20.8 | 17.6 | 20.4 | 21.9 | 19.4 | 19.2 | 21.8 | 20.4 | 19.4 | 20.4 | 18.5 | 20.2 | 18.7 | 19.5 | 17.7 | 16.9 | 17.7 | 18.6 | 18.6 | 18.5 | 16.9 | |
| 18:10 | 20.6 | 16.8 | 21.0 | 17.5 | 20.3 | 21.8 | 18.4 | 18.2 | 20.8 | 20.3 | 19.2 | 20.3 | 18.3 | 19.1 | 18.4 | 19.2 | 17.5 | 16.7 | 17.5 | 18.3 | 18.3 | 17.5 | 16.7 | |
| 18:20 | 20.3 | 16.2 | 19.8 | 16.6 | 19.4 | 20.9 | 18.5 | 18.2 | 20.8 | 19.4 | 18.4 | 19.4 | 16.8 | 19.3 | 17.1 | 18.6 | 16.7 | 15.0 | 15.9 | 17.6 | 17.6 | 17.5 | 15.9 | |
| 18:30 | 20.2 | 14.7 | 19.5 | 16.0 | 19.7 | 21.2 | 17.8 | 17.5 | 20.4 | 18.8 | 17.7 | 18.8 | 16.0 | 18.5 | 17.1 | 17.8 | 16.0 | 14.4 | 15.2 | 16.9 | 16.9 | 16.0 | 15.2 | |
| 18:40 | 20.0 | 14.7 | 19.5 | 15.1 | 18.8 | 20.3 | 16.9 | 16.7 | 19.3 | 17.9 | 17.7 | 17.9 | 16.0 | 17.7 | 16.2 | 16.9 | 15.2 | 14.4 | 15.2 | 16.1 | 16.9 | 16.0 | 15.2 | |
| 18:50 | 19.6 | 15.0 | 19.7 | 15.0 | 17.8 | 19.3 | 16.7 | 16.5 | 19.4 | 17.8 | 17.6 | 17.8 | 15.8 | 17.4 | 15.9 | 16.6 | 15.8 | 14.2 | 15.0 | 15.8 | 15.8 | 15.0 | 15.0 | |
| 19:00 | 19.0 | 13.8 | 18.0 | 13.6 | 17.3 | 18.8 | 15.4 | 15.2 | 17.8 | 16.4 | 16.2 | 16.4 | 14.5 | 16.2 | 14.7 | 15.4 | 13.7 | 12.9 | 13.7 | 14.6 | 14.6 | 14.5 | 13.7 | |
| 19:10 | 18.5 | 12.8 | 17.0 | 13.5 | 16.3 | 17.8 | 15.3 | 15.0 | 17.9 | 16.3 | 15.2 | 16.3 | 13.5 | 16.0 | 14.6 | 15.3 | 12.7 | 11.9 | 12.7 | 14.4 | 14.4 | 13.5 | 12.7 | |
| 19:20 | 18.0 | 12.3 | 16.5 | 12.1 | 15.8 | 17.3 | 14.8 | 13.6 | 17.4 | 14.9 | 14.7 | 14.9 | 13.0 | 15.5 | 14.1 | 14.8 | 12.2 | 11.4 | 12.2 | 13.1 | 13.9 | 13.0 | 12.2 | |
| 19:30 | 17.9 | 11.7 | 15.3 | 12.1 | 14.9 | 17.3 | 14.8 | 13.6 | 17.4 | 14.9 | 14.7 | 14.9 | 13.0 | 14.7 | 13.2 | 13.9 | 12.2 | 11.4 | 12.2 | 13.1 | 13.1 | 13.0 | 12.2 | |
| 19:40 | 17.3 | 11.8 | 17.2 | 11.6 | 15.3 | 16.8 | 14.3 | 14.0 | 16.9 | 14.4 | 14.2 | 14.4 | 13.3 | 15.0 | 13.6 | 14.3 | 12.5 | 11.7 | 11.7 | 13.4 | 14.3 | 12.5 | 11.7 | |
| 19:50 | 17.2 | 12.5 | 17.2 | 12.5 | 15.3 | 17.7 | 14.2 | 14.0 | 18.1 | 15.3 | 15.1 | 15.3 | 13.3 | 14.9 | 13.4 | 14.1 | 12.5 | 12.5 | 12.5 | 13.3 | 14.2 | 12.5 | 12.5 | |
| 20:00 | 17.4 | 12.5 | 16.0 | 12.5 | 15.3 | 16.8 | 14.2 | 14.0 | 16.9 | 14.4 | 14.2 | 15.3 | 13.3 | 14.9 | 13.4 | 14.1 | 12.5 | 12.5 | 12.5 | 13.3 | 14.2 | 12.5 | 12.5 | |
| 20:10 | 17.4 | 12.3 | 15.3 | 12.1 | 14.9 | 16.4 | 13.9 | 13.6 | 16.3 | 14.9 | 14.7 | 14.9 | 13.0 | 14.6 | 13.0 | 14.6 | 12.2 | 11.4 | 13.0 | 13.0 | 13.8 | 13.0 | 12.2 | |
| 20:20 | 17.0 | 11.3 | 15.5 | 12.0 | 14.8 | 16.3 | 13.8 | 12.6 | 16.4 | 13.9 | 13.7 | 13.9 | 12.0 | 13.7 | 13.1 | 13.8 | 11.2 | 10.4 | 11.2 | 12.1 | 12.9 | 12.0 | 12.0 | |
| 20:30 | 16.3 | 10.8 | 15.0 | 12.4 | 14.3 | 15.8 | 13.2 | 13.0 | 17.1 | 13.4 | 13.2 | 13.4 | 11.5 | 13.9 | 12.4 | 13.1 | 11.5 | 10.7 | 11.5 | 12.3 | 13.2 | 11.5 | 11.5 | |
| 20:40 | 16.3 | 10.8 | 13.8 | 11.5 | 13.4 | 14.9 | 13.3 | 12.1 | 15.9 | 13.4 | 12.4 | 13.4 | 11.5 | 13.2 | 11.7 | 13.3 | 10.7 | 9.9 | 10.7 | 11.6 | 12.4 | 11.5 | 11.5 | |
| 20:50 | 15.7 | 11.3 | 14.3 | 11.1 | 13.9 | 15.4 | 12.9 | 12.6 | 15.3 | 12.9 | 12.9 | 12.9 | 12.0 | 13.7 | 12.2 | 12.9 | 11.2 | 10.4 | 11.2 | 12.1 | 12.9 | 12.0 | 11.2 | |
| 21:00 | 15.9 | 12.5 | 14.8 | 11.6 | 14.4 | 15.9 | 13.4 | 13.1 | 15.8 | 13.4 | 13.4 | 13.4 | 13.3 | 13.3 | 13.4 | 14.1 | 12.5 | 11.7 | 12.5 | 12.5 | 13.3 | 12.5 | 11.7 | |
| 24/08/2017, winter | TiB,LE has been corrected for View Factors over turf grass and PP | |||||||||||||||||||||||
| TiB,LE (°C) | VF of LE | 0.71 | 0.58 | 0.43 | 0.56 | 0.52 | 0.58 | 0.58 | 0.56 | 0.45 | 0.54 | 0.59 | 0.54 | 0.65 | 0.62 | 0.56 | 0.56 | 0.63 | 0.61 | 0.61 | 0.62 | 0.59 | 0.95 | 0.61 |
| Time | Murdoch Tambient | A | B | C | D | E | F | G | H | I | J | K | L | M | N | O | P | Q | R | S | T | U | V | W |
| 5:30 | 10.2 | 5.8 | 6.5 | 7.7 | 5.6 | 7.5 | 7.4 | 6.6 | 6.2 | 7.6 | 6.5 | 6.5 | 6.5 | 5.8 | 7.4 | 5.8 | 7.2 | 6.5 | 5.7 | 5.7 | 5.8 | 6.6 | 6.5 | 5.7 |
| 5:40 | 10.5 | 6.0 | 5.8 | 8.3 | 6.0 | 7.0 | 6.9 | 6.9 | 6.6 | 8.2 | 6.9 | 6.8 | 6.9 | 6.8 | 6.8 | 6.9 | 7.4 | 7.6 | 6.0 | 6.0 | 6.0 | 6.8 | 6.0 | 5.2 |
| 5:50 | 10.5 | 5.3 | 5.8 | 7.2 | 6.0 | 7.0 | 6.9 | 6.9 | 6.6 | 8.2 | 6.9 | 6.0 | 6.9 | 5.2 | 6.8 | 5.1 | 6.5 | 6.8 | 5.2 | 6.0 | 5.2 | 6.0 | 6.0 | 5.2 |
| 6:00 | 10.4 | 4.8 | 6.2 | 6.7 | 5.5 | 6.5 | 6.4 | 6.4 | 5.1 | 7.7 | 6.4 | 6.3 | 6.4 | 4.7 | 6.3 | 4.6 | 6.0 | 6.3 | 4.7 | 5.5 | 4.7 | 5.5 | 5.5 | 4.7 |
| 6:10 | 10.5 | 5.5 | 5.3 | 6.7 | 5.5 | 6.5 | 6.4 | 6.4 | 5.1 | 7.7 | 6.4 | 6.3 | 6.4 | 4.7 | 6.3 | 4.6 | 6.0 | 6.3 | 5.5 | 5.5 | 4.7 | 5.5 | 5.5 | 4.7 |
| 6:20 | 10.5 | 6.0 | 5.8 | 7.2 | 6.0 | 7.0 | 6.9 | 6.9 | 5.7 | 7.1 | 6.0 | 6.0 | 6.0 | 5.2 | 6.8 | 6.0 | 6.5 | 6.8 | 6.0 | 6.0 | 5.2 | 6.0 | 6.0 | 5.2 |
| 6:30 | 10.4 | 6.3 | 7.0 | 8.2 | 6.1 | 7.0 | 7.9 | 7.1 | 6.7 | 8.1 | 7.0 | 7.0 | 7.0 | 6.3 | 7.9 | 6.3 | 6.9 | 7.0 | 6.2 | 6.2 | 6.3 | 7.1 | 7.0 | 6.2 |
| 6:40 | 10.5 | 6.1 | 6.6 | 7.5 | 6.6 | 7.5 | 7.5 | 7.6 | 6.3 | 8.6 | 6.6 | 6.7 | 6.6 | 6.0 | 7.6 | 5.9 | 6.5 | 7.5 | 6.7 | 6.7 | 6.0 | 6.7 | 7.5 | 6.7 |
| 6:50 | 10.4 | 7.3 | 8.0 | 8.0 | 7.1 | 7.0 | 8.0 | 8.1 | 6.8 | 8.0 | 7.1 | 7.2 | 7.1 | 6.5 | 8.1 | 6.4 | 7.0 | 8.0 | 7.2 | 7.2 | 7.3 | 7.2 | 8.0 | 7.2 |
| 7:00 | 10.7 | 7.5 | 7.3 | 8.7 | 7.5 | 7.5 | 7.5 | 7.5 | 7.2 | 8.6 | 7.5 | 7.5 | 7.5 | 6.7 | 8.3 | 6.6 | 8.1 | 8.3 | 7.5 | 7.5 | 7.5 | 7.5 | 7.5 | 6.7 |
| 7:10 | 10.9 | 7.3 | 7.0 | 8.0 | 8.0 | 8.0 | 8.0 | 8.0 | 6.8 | 9.1 | 7.1 | 7.2 | 7.1 | 7.2 | 8.0 | 7.1 | 7.7 | 8.0 | 7.2 | 8.0 | 7.2 | 7.2 | 8.0 | 7.2 |
| 7:20 | 11.0 | 7.8 | 8.3 | 8.5 | 9.4 | 8.5 | 8.5 | 9.4 | 8.2 | 9.6 | 7.6 | 8.5 | 8.5 | 7.7 | 8.5 | 7.6 | 8.2 | 8.5 | 7.7 | 8.5 | 7.7 | 8.5 | 8.5 | 9.3 |
| 7:30 | 11.3 | 10.0 | 9.0 | 10.0 | 10.0 | 9.0 | 10.0 | 10.9 | 9.7 | 11.1 | 9.1 | 8.3 | 9.1 | 8.5 | 9.2 | 9.1 | 9.7 | 10.0 | 9.2 | 10.0 | 9.2 | 9.2 | 10.0 | 10.8 |
| 7:40 | 11.4 | 8.7 | 9.9 | 10.3 | 10.6 | 10.5 | 11.5 | 11.7 | 11.3 | 11.5 | 8.7 | 8.1 | 8.7 | 9.3 | 10.1 | 10.1 | 11.6 | 9.1 | 9.0 | 9.9 | 10.1 | 9.9 | 11.5 | 11.5 |
| 7:50 | 11.7 | 9.7 | 10.6 | 11.3 | 11.6 | 11.5 | 12.5 | 14.2 | 12.3 | 12.5 | 10.6 | 10.8 | 11.6 | 10.2 | 11.7 | 10.7 | 12.3 | 10.9 | 10.9 | 12.5 | 10.9 | 10.8 | 12.5 | 13.3 |
| 8:00 | 12.0 | 11.6 | 11.0 | 11.8 | 12.1 | 12.0 | 13.0 | 14.6 | 11.9 | 13.0 | 11.1 | 11.3 | 12.1 | 10.6 | 12.1 | 11.0 | 11.7 | 12.2 | 12.2 | 13.8 | 10.5 | 10.4 | 13.0 | 13.8 |
| 8:10 | 12.5 | 13.8 | 12.4 | 13.3 | 13.6 | 13.5 | 14.5 | 16.1 | 14.3 | 14.5 | 12.6 | 12.8 | 13.6 | 12.1 | 12.7 | 12.3 | 13.9 | 13.7 | 14.5 | 16.1 | 11.9 | 11.8 | 14.5 | 16.1 |
| 8:20 | 13.0 | 14.3 | 12.7 | 13.8 | 14.1 | 14.0 | 15.0 | 17.3 | 14.8 | 16.1 | 13.1 | 13.3 | 15.0 | 12.5 | 13.9 | 13.5 | 15.2 | 14.2 | 15.8 | 17.5 | 13.1 | 12.2 | 15.0 | 17.5 |
| 8:30 | 13.2 | 15.8 | 14.3 | 15.3 | 14.7 | 15.5 | 16.5 | 19.7 | 16.3 | 17.6 | 14.6 | 14.8 | 16.5 | 14.0 | 14.6 | 15.0 | 16.7 | 15.7 | 17.3 | 19.0 | 14.6 | 13.7 | 16.5 | 19.0 |
| 8:40 | 13.7 | 15.1 | 14.4 | 14.2 | 14.7 | 16.5 | 16.5 | 19.8 | 16.3 | 17.6 | 14.6 | 14.8 | 16.5 | 13.3 | 15.5 | 15.2 | 16.9 | 15.7 | 16.5 | 18.1 | 14.7 | 13.8 | 16.5 | 19.8 |
| 8:50 | 14.4 | 14.1 | 14.3 | 14.3 | 14.6 | 15.5 | 15.5 | 17.9 | 15.3 | 16.6 | 14.6 | 14.7 | 15.5 | 13.1 | 14.5 | 14.2 | 15.9 | 14.7 | 15.5 | 17.1 | 13.7 | 13.7 | 15.5 | 18.0 |
| 9:00 | 14.4 | 14.8 | 14.3 | 14.3 | 14.6 | 15.5 | 15.5 | 17.9 | 15.3 | 16.6 | 14.6 | 14.7 | 15.5 | 13.1 | 14.5 | 14.2 | 15.9 | 14.7 | 15.5 | 17.1 | 13.7 | 13.7 | 15.5 | 18.0 |
| 9:10 | 14.7 | 17.8 | 16.1 | 17.3 | 16.7 | 18.5 | 18.5 | 21.6 | 19.3 | 19.6 | 16.6 | 17.7 | 18.5 | 16.0 | 16.5 | 17.7 | 20.3 | 17.7 | 19.3 | 21.8 | 16.5 | 15.7 | 18.5 | 22.6 |
| 9:20 | 15.1 | 19.3 | 17.6 | 18.8 | 19.1 | 20.0 | 20.9 | 24.0 | 21.7 | 21.1 | 18.1 | 19.2 | 20.9 | 17.5 | 18.8 | 19.2 | 22.7 | 19.2 | 21.6 | 23.3 | 18.0 | 17.2 | 20.0 | 26.6 |
| 9:30 | 15.0 | 19.8 | 18.9 | 19.3 | 20.5 | 20.5 | 21.4 | 24.4 | 22.2 | 21.6 | 18.6 | 19.7 | 22.4 | 17.9 | 19.2 | 19.5 | 23.1 | 20.5 | 22.1 | 24.6 | 19.2 | 17.6 | 20.5 | 27.9 |
| 9:40 | 16.7 | 20.8 | 19.9 | 20.3 | 21.5 | 21.5 | 22.4 | 25.4 | 23.2 | 22.6 | 19.6 | 20.7 | 23.4 | 18.9 | 20.2 | 21.4 | 24.1 | 21.5 | 23.1 | 25.6 | 19.4 | 18.6 | 21.5 | 28.1 |
| 9:50 | 17.1 | 20.3 | 19.4 | 19.8 | 21.0 | 22.0 | 21.9 | 24.9 | 22.7 | 22.1 | 19.1 | 20.2 | 22.9 | 19.2 | 20.5 | 20.9 | 24.5 | 21.8 | 22.6 | 25.1 | 19.7 | 19.0 | 21.0 | 27.6 |
| 10:00 | 17.7 | 21.3 | 20.4 | 20.8 | 22.0 | 23.0 | 22.9 | 25.9 | 24.6 | 23.1 | 21.1 | 21.2 | 24.8 | 20.2 | 21.5 | 21.9 | 26.4 | 22.8 | 23.6 | 26.1 | 20.7 | 20.0 | 22.0 | 29.4 |
| 10:10 | 17.6 | 21.1 | 20.3 | 20.2 | 21.6 | 22.5 | 23.4 | 25.7 | 23.3 | 22.5 | 20.6 | 21.7 | 24.4 | 20.0 | 21.4 | 21.9 | 25.5 | 21.7 | 23.3 | 25.0 | 20.6 | 19.7 | 22.5 | 29.1 |
| 10:20 | 17.9 | 21.8 | 20.1 | 21.3 | 21.6 | 22.5 | 23.4 | 26.5 | 23.3 | 23.6 | 20.6 | 21.7 | 24.4 | 20.0 | 21.3 | 22.6 | 26.2 | 22.5 | 24.1 | 25.8 | 21.3 | 19.7 | 22.5 | 29.9 |
| 10:30 | 18.3 | 23.3 | 21.5 | 21.7 | 24.0 | 24.0 | 24.9 | 28.7 | 25.7 | 25.1 | 23.1 | 23.2 | 26.8 | 20.7 | 22.7 | 23.9 | 27.5 | 24.8 | 25.6 | 28.1 | 22.7 | 21.1 | 24.0 | 32.2 |
| 10:40 | 18.5 | 24.0 | 22.2 | 22.8 | 24.0 | 25.0 | 25.7 | 29.5 | 25.7 | 26.2 | 23.1 | 24.0 | 27.7 | 21.4 | 23.4 | 23.8 | 27.3 | 24.8 | 27.3 | 28.9 | 23.4 | 21.0 | 24.0 | 32.2 |
| 10:50 | 18.4 | 25.0 | 23.4 | 23.8 | 25.0 | 26.0 | 25.9 | 30.6 | 27.7 | 27.2 | 23.1 | 24.2 | 26.9 | 22.4 | 23.7 | 25.8 | 29.4 | 25.8 | 27.5 | 29.1 | 23.7 | 21.3 | 25.0 | 33.2 |
| 11:00 | 19.1 | 24.8 | 23.9 | 24.3 | 25.5 | 25.5 | 26.4 | 31.1 | 27.3 | 27.7 | 23.6 | 24.7 | 28.3 | 22.9 | 24.2 | 25.4 | 29.9 | 26.3 | 28.0 | 29.6 | 24.2 | 21.8 | 25.5 | 34.5 |
| 11:10 | 19.5 | 26.2 | 24.6 | 25.5 | 26.4 | 27.4 | 27.2 | 31.9 | 29.1 | 27.7 | 24.6 | 25.5 | 29.2 | 23.7 | 24.9 | 27.0 | 30.6 | 27.1 | 28.8 | 30.4 | 24.9 | 22.5 | 25.5 | 35.3 |
| 11:20 | 19.5 | 26.7 | 25.1 | 24.8 | 26.9 | 27.9 | 27.7 | 32.4 | 28.7 | 28.2 | 24.1 | 26.0 | 29.7 | 23.4 | 24.6 | 27.5 | 31.1 | 26.8 | 29.3 | 30.9 | 25.4 | 23.0 | 26.0 | 35.0 |
| 11:30 | 19.9 | 27.0 | 26.1 | 24.7 | 27.9 | 28.0 | 27.9 | 33.4 | 29.7 | 29.2 | 25.1 | 27.0 | 29.8 | 24.4 | 25.6 | 27.6 | 31.3 | 27.8 | 29.5 | 31.9 | 26.4 | 23.2 | 27.0 | 36.8 |
| 11:40 | 20.0 | 26.0 | 25.0 | 26.0 | 26.0 | 27.9 | 27.7 | 33.2 | 29.6 | 28.2 | 26.0 | 26.0 | 29.7 | 24.1 | 25.4 | 27.3 | 31.0 | 27.6 | 29.3 | 31.7 | 25.4 | 23.0 | 26.0 | 35.0 |
| 11:50 | 20.3 | 28.2 | 27.3 | 27.5 | 29.3 | 29.4 | 30.1 | 34.7 | 31.1 | 30.8 | 25.6 | 28.3 | 31.2 | 26.4 | 26.9 | 29.7 | 34.3 | 29.1 | 31.6 | 33.2 | 27.7 | 24.5 | 27.5 | 38.2 |
| 12:00 | 20.6 | 28.0 | 27.8 | 26.8 | 28.9 | 29.0 | 29.7 | 34.3 | 30.7 | 30.2 | 26.1 | 28.0 | 31.7 | 26.1 | 27.4 | 28.5 | 33.9 | 28.8 | 31.3 | 33.7 | 28.2 | 24.1 | 28.0 | 37.8 |
| 12:10 | 20.4 | 27.0 | 27.0 | 27.0 | 27.0 | 28.9 | 28.7 | 34.2 | 29.7 | 29.2 | 26.1 | 27.0 | 30.7 | 25.2 | 26.4 | 28.5 | 32.2 | 27.8 | 30.3 | 31.9 | 25.6 | 23.2 | 27.0 | 36.0 |
| 12:20 | 20.4 | 27.5 | 27.5 | 26.3 | 27.5 | 29.4 | 29.2 | 33.9 | 30.2 | 29.7 | 26.6 | 27.5 | 31.2 | 25.7 | 26.9 | 29.0 | 32.7 | 28.3 | 30.0 | 32.4 | 26.9 | 23.7 | 27.5 | 36.5 |
| 12:30 | 20.9 | 28.2 | 27.3 | 26.3 | 28.4 | 29.4 | 30.1 | 34.7 | 31.1 | 30.8 | 26.6 | 27.5 | 31.2 | 25.6 | 26.9 | 28.8 | 32.5 | 29.1 | 31.6 | 33.2 | 26.9 | 24.5 | 27.5 | 37.3 |
| 12:40 | 20.6 | 29.2 | 28.2 | 28.5 | 29.4 | 30.4 | 31.1 | 35.6 | 32.1 | 31.8 | 27.6 | 29.3 | 33.1 | 26.6 | 27.8 | 30.5 | 34.2 | 30.9 | 32.6 | 35.1 | 28.6 | 25.4 | 28.5 | 38.3 |
| 12:50 | 20.8 | 27.5 | 27.3 | 27.5 | 27.5 | 29.4 | 30.1 | 33.8 | 31.1 | 29.7 | 27.5 | 27.5 | 31.2 | 26.4 | 26.0 | 28.8 | 34.3 | 28.3 | 30.8 | 33.2 | 26.9 | 24.5 | 27.5 | 36.5 |
| 13:00 | 21.2 | 27.2 | 27.2 | 26.5 | 28.3 | 29.4 | 29.1 | 34.5 | 30.1 | 29.8 | 27.4 | 28.2 | 31.1 | 25.4 | 26.7 | 27.8 | 31.5 | 27.3 | 29.8 | 32.2 | 25.0 | 23.5 | 26.5 | 36.3 |
| 13:10 | 21.8 | 27.0 | 26.1 | 25.8 | 27.0 | 28.9 | 29.6 | 34.2 | 29.7 | 29.2 | 27.0 | 27.0 | 29.8 | 25.2 | 26.4 | 28.5 | 32.2 | 27.8 | 29.5 | 31.9 | 25.6 | 23.2 | 27.0 | 35.2 |
| 13:20 | 21.4 | 27.7 | 26.8 | 27.0 | 27.9 | 29.9 | 29.6 | 34.2 | 29.7 | 30.3 | 27.0 | 27.8 | 30.7 | 25.1 | 26.4 | 28.3 | 32.0 | 28.6 | 30.3 | 32.7 | 26.4 | 24.8 | 27.0 | 36.0 |
| 13:30 | 21.6 | 28.5 | 27.6 | 27.3 | 28.5 | 30.4 | 31.1 | 34.9 | 31.2 | 30.7 | 27.6 | 28.5 | 32.2 | 26.7 | 27.9 | 30.0 | 33.7 | 29.3 | 31.8 | 33.4 | 27.9 | 25.5 | 28.5 | 37.5 |
| 13:40 | 21.4 | 26.8 | 27.6 | 27.5 | 27.5 | 29.4 | 30.1 | 33.1 | 31.1 | 29.7 | 27.5 | 27.5 | 31.2 | 26.5 | 27.0 | 29.2 | 33.8 | 28.3 | 30.0 | 31.6 | 26.2 | 24.6 | 27.5 | 35.7 |
| 13:50 | 21.8 | 27.0 | 27.0 | 27.0 | 27.9 | 29.9 | 29.6 | 33.4 | 30.6 | 30.3 | 27.9 | 27.8 | 30.7 | 25.2 | 26.4 | 28.5 | 32.2 | 27.8 | 30.3 | 31.9 | 26.4 | 24.0 | 27.0 | 35.2 |
| 14:00 | 21.3 | 27.0 | 27.0 | 27.0 | 27.9 | 29.9 | 29.6 | 33.4 | 29.7 | 29.2 | 27.9 | 27.8 | 30.7 | 25.2 | 27.3 | 28.5 | 31.3 | 27.8 | 30.3 | 31.9 | 26.4 | 24.0 | 27.0 | 35.2 |
| 14:10 | 21.7 | 27.0 | 26.1 | 27.0 | 27.0 | 28.9 | 29.6 | 33.4 | 29.7 | 29.2 | 27.9 | 27.8 | 31.6 | 25.9 | 27.3 | 28.5 | 32.2 | 28.6 | 30.3 | 31.9 | 26.4 | 24.0 | 27.0 | 35.2 |
| 14:20 | 21.7 | 26.5 | 25.8 | 26.5 | 26.5 | 28.4 | 29.1 | 32.1 | 28.3 | 28.7 | 26.5 | 27.3 | 30.2 | 24.7 | 26.8 | 28.2 | 30.9 | 27.3 | 29.0 | 30.6 | 26.0 | 24.5 | 26.5 | 34.7 |
| 14:30 | 22.5 | 26.5 | 26.5 | 26.5 | 27.4 | 29.4 | 29.1 | 32.9 | 30.1 | 29.8 | 27.4 | 27.3 | 30.2 | 25.4 | 26.8 | 28.0 | 31.7 | 28.1 | 29.8 | 31.4 | 25.9 | 24.4 | 26.5 | 33.9 |
| 14:40 | 22.3 | 27.0 | 27.1 | 27.0 | 27.9 | 29.9 | 29.6 | 32.6 | 30.6 | 30.3 | 27.9 | 27.8 | 30.7 | 26.0 | 26.5 | 28.7 | 32.4 | 27.8 | 30.3 | 31.1 | 26.5 | 25.0 | 27.0 | 34.4 |
| 14:50 | 22.4 | 26.5 | 25.8 | 26.5 | 27.4 | 28.4 | 29.1 | 32.1 | 28.3 | 29.8 | 26.5 | 27.3 | 30.2 | 24.7 | 26.8 | 27.3 | 30.0 | 27.3 | 29.0 | 30.6 | 26.0 | 24.5 | 26.5 | 33.9 |
| 15:00 | 22.1 | 26.5 | 26.6 | 27.7 | 26.5 | 28.4 | 29.1 | 32.1 | 29.2 | 28.7 | 27.4 | 27.3 | 30.2 | 25.5 | 26.0 | 28.2 | 30.9 | 28.1 | 29.0 | 30.6 | 26.0 | 24.5 | 26.5 | 33.1 |
| 15:10 | 22.1 | 26.5 | 26.8 | 26.5 | 26.5 | 28.4 | 28.2 | 31.3 | 29.2 | 28.7 | 27.4 | 26.5 | 30.2 | 25.5 | 26.1 | 27.5 | 31.1 | 27.3 | 29.0 | 29.8 | 25.3 | 24.5 | 26.5 | 32.2 |
| 15:20 | 22.3 | 25.8 | 26.0 | 26.5 | 25.6 | 27.5 | 28.2 | 30.6 | 28.3 | 28.7 | 26.5 | 26.5 | 29.3 | 24.8 | 26.2 | 27.7 | 30.4 | 27.3 | 28.1 | 29.0 | 25.4 | 23.7 | 26.5 | 32.2 |
| 15:30 | 22.1 | 25.5 | 24.9 | 25.5 | 24.6 | 27.4 | 27.2 | 29.5 | 27.3 | 27.7 | 26.4 | 25.5 | 28.3 | 24.5 | 25.1 | 26.5 | 29.2 | 26.3 | 27.1 | 28.8 | 25.1 | 23.5 | 25.5 | 29.6 |
| 15:40 | 22.1 | 25.5 | 25.8 | 26.7 | 25.5 | 27.4 | 28.1 | 29.5 | 27.3 | 27.7 | 26.4 | 26.3 | 29.2 | 24.5 | 25.9 | 26.5 | 29.2 | 26.3 | 28.0 | 28.8 | 25.1 | 23.5 | 25.5 | 31.2 |
| 15:50 | 22.4 | 25.0 | 25.4 | 26.2 | 25.0 | 26.9 | 27.6 | 28.2 | 26.8 | 27.2 | 25.9 | 25.8 | 28.7 | 24.1 | 25.5 | 26.2 | 28.0 | 25.8 | 26.6 | 27.5 | 24.7 | 23.9 | 25.0 | 29.9 |
| 16:00 | 22.0 | 25.0 | 24.5 | 25.0 | 25.0 | 26.9 | 27.6 | 28.2 | 26.8 | 27.2 | 25.9 | 25.8 | 27.8 | 23.3 | 25.5 | 25.3 | 27.1 | 25.8 | 26.6 | 27.5 | 24.7 | 23.1 | 25.0 | 29.1 |
| 16:10 | 21.7 | 23.3 | 24.4 | 25.2 | 24.0 | 25.9 | 25.7 | 27.2 | 25.7 | 26.2 | 25.9 | 24.8 | 26.8 | 23.1 | 24.5 | 24.3 | 27.0 | 24.8 | 25.6 | 26.5 | 23.7 | 22.9 | 24.0 | 28.1 |
| 16:20 | 21.8 | 23.5 | 23.9 | 24.7 | 23.5 | 25.4 | 26.1 | 26.7 | 25.2 | 25.7 | 24.4 | 24.3 | 26.3 | 22.6 | 24.0 | 23.8 | 25.6 | 24.3 | 25.1 | 26.0 | 23.2 | 22.4 | 23.5 | 26.8 |
| 16:30 | 21.5 | 22.8 | 21.4 | 23.5 | 19.9 | 25.4 | 25.2 | 22.5 | 25.2 | 23.5 | 24.4 | 22.7 | 26.3 | 22.6 | 22.5 | 24.0 | 24.9 | 24.3 | 24.3 | 25.1 | 23.3 | 22.5 | 23.5 | 21.0 |
| 16:40 | 21.4 | 21.9 | 21.2 | 26.3 | 20.5 | 23.4 | 23.1 | 21.3 | 22.2 | 21.6 | 23.3 | 21.3 | 23.3 | 22.8 | 21.2 | 23.9 | 25.6 | 22.9 | 21.3 | 21.3 | 22.8 | 21.3 | 20.5 | 20.5 |
| 16:50 | 21.1 | 19.3 | 20.8 | 23.5 | 20.0 | 21.9 | 21.7 | 20.9 | 20.8 | 21.1 | 21.9 | 20.8 | 21.9 | 20.8 | 20.8 | 20.9 | 21.7 | 20.8 | 19.2 | 20.0 | 20.8 | 20.0 | 20.0 | 20.0 |
| 17:00 | 21.0 | 18.8 | 19.4 | 21.8 | 18.6 | 20.5 | 21.2 | 20.4 | 19.4 | 20.6 | 21.4 | 19.5 | 20.4 | 19.5 | 20.3 | 19.5 | 20.3 | 19.5 | 18.7 | 19.5 | 19.5 | 18.7 | 19.5 | 18.7 |
| 17:10 | 20.8 | 18.8 | 19.6 | 20.7 | 18.6 | 20.5 | 21.2 | 20.4 | 19.4 | 20.6 | 20.4 | 19.5 | 19.5 | 18.8 | 19.6 | 18.8 | 19.6 | 19.5 | 17.9 | 18.7 | 18.8 | 18.7 | 19.5 | 18.7 |
| 17:20 | 20.5 | 18.3 | 19.8 | 20.2 | 19.0 | 20.0 | 20.7 | 19.9 | 18.9 | 20.1 | 19.9 | 19.8 | 19.9 | 18.2 | 19.8 | 18.1 | 19.8 | 19.8 | 19.0 | 19.0 | 19.0 | 18.2 | 19.0 | 19.0 |
| 17:30 | 20.0 | 17.8 | 18.6 | 19.7 | 18.5 | 19.5 | 20.2 | 19.4 | 18.4 | 19.6 | 19.4 | 18.5 | 19.4 | 17.8 | 19.4 | 17.8 | 19.5 | 18.5 | 17.7 | 17.7 | 18.6 | 17.7 | 18.5 | 17.7 |
| 17:40 | 19.7 | 16.8 | 18.3 | 19.8 | 17.5 | 18.5 | 19.2 | 18.4 | 17.4 | 18.6 | 18.4 | 17.5 | 18.4 | 17.5 | 18.3 | 17.5 | 18.3 | 18.3 | 16.7 | 17.5 | 17.5 | 17.5 | 17.5 | 16.7 |
| 17:50 | 19.4 | 16.8 | 18.4 | 18.7 | 17.5 | 18.5 | 19.2 | 18.4 | 17.4 | 18.6 | 18.4 | 17.5 | 18.4 | 17.6 | 18.4 | 16.8 | 18.5 | 17.5 | 16.7 | 16.7 | 17.6 | 16.7 | 17.5 | 16.7 |
| 18:00 | 19.5 | 16.3 | 17.1 | 18.2 | 16.1 | 18.0 | 18.7 | 17.1 | 15.9 | 18.1 | 17.0 | 17.0 | 17.0 | 16.3 | 17.9 | 16.3 | 17.0 | 17.0 | 16.2 | 16.2 | 16.3 | 16.2 | 17.0 | 15.4 |
| 18:10 | 19.0 | 15.3 | 16.0 | 17.2 | 15.1 | 17.0 | 17.7 | 16.1 | 15.8 | 17.1 | 16.9 | 16.0 | 16.9 | 16.1 | 16.9 | 15.3 | 16.0 | 16.0 | 15.2 | 15.2 | 16.1 | 16.1 | 16.0 | 14.4 |
| 18:20 | 18.4 | 15.3 | 16.0 | 17.2 | 15.1 | 17.0 | 17.7 | 16.1 | 15.8 | 18.2 | 16.9 | 16.0 | 16.0 | 15.3 | 16.9 | 15.3 | 16.0 | 16.0 | 14.4 | 15.2 | 15.3 | 15.2 | 16.0 | 14.4 |
| 18:30 | 18.8 | 14.8 | 15.5 | 17.8 | 15.5 | 16.5 | 17.2 | 15.6 | 15.3 | 17.7 | 16.4 | 15.5 | 16.4 | 15.6 | 16.4 | 15.7 | 16.4 | 15.5 | 14.7 | 14.7 | 15.6 | 15.6 | 15.5 | 14.7 |
| 18:40 | 18.3 | 14.8 | 15.5 | 16.7 | 14.6 | 16.5 | 17.2 | 15.6 | 15.3 | 16.6 | 15.5 | 15.5 | 15.5 | 14.8 | 15.6 | 14.8 | 15.5 | 15.5 | 14.7 | 14.7 | 15.6 | 15.6 | 15.5 | 13.9 |
| 18:50 | 18.1 | 14.3 | 15.9 | 16.2 | 15.0 | 16.0 | 16.7 | 15.1 | 14.8 | 17.2 | 15.9 | 15.0 | 15.9 | 14.3 | 15.9 | 14.3 | 15.0 | 15.0 | 14.2 | 14.2 | 15.1 | 15.1 | 15.0 | 14.2 |
| 19:00 | 17.9 | 14.3 | 15.9 | 16.2 | 15.0 | 16.0 | 16.7 | 15.9 | 14.8 | 17.2 | 15.9 | 15.0 | 15.9 | 15.1 | 15.9 | 14.3 | 15.0 | 15.0 | 14.2 | 14.2 | 15.1 | 15.1 | 15.0 | 14.2 |
| 19:10 | 17.4 | 14.3 | 15.9 | 16.2 | 15.0 | 15.0 | 15.9 | 15.1 | 14.8 | 16.1 | 15.0 | 15.0 | 15.0 | 14.3 | 15.9 | 14.3 | 15.0 | 15.0 | 14.2 | 14.2 | 14.3 | 15.1 | 15.0 | 14.2 |
| 19:20 | 17.3 | 13.8 | 14.5 | 15.7 | 13.6 | 14.5 | 16.2 | 14.6 | 14.3 | 16.7 | 15.4 | 14.5 | 14.5 | 14.6 | 15.4 | 13.8 | 15.4 | 14.5 | 13.7 | 13.7 | 14.6 | 14.6 | 14.5 | 13.7 |
| 19:30 | 17.1 | 14.0 | 14.8 | 15.2 | 14.0 | 15.0 | 15.7 | 14.9 | 14.7 | 16.2 | 14.9 | 14.8 | 14.9 | 14.0 | 15.6 | 14.0 | 14.7 | 14.8 | 14.0 | 14.0 | 14.0 | 14.0 | 14.0 | 13.2 |
| 19:40 | 17.0 | 13.8 | 15.4 | 14.5 | 14.5 | 15.5 | 16.2 | 14.6 | 14.3 | 16.7 | 14.5 | 14.5 | 14.5 | 13.8 | 15.4 | 13.8 | 14.5 | 14.5 | 13.7 | 13.7 | 13.8 | 14.6 | 14.5 | 13.7 |
| 19:50 | 16.8 | 13.8 | 14.5 | 15.7 | 13.6 | 14.5 | 15.4 | 14.6 | 14.3 | 15.6 | 14.5 | 14.5 | 14.5 | 13.8 | 14.6 | 13.8 | 14.5 | 14.5 | 13.7 | 13.7 | 13.8 | 14.6 | 14.5 | 13.7 |
| 20:00 | 16.6 | 14.0 | 13.9 | 15.2 | 14.0 | 15.0 | 15.7 | 14.0 | 13.8 | 16.2 | 14.0 | 14.0 | 14.9 | 14.0 | 14.8 | 14.0 | 14.7 | 14.8 | 13.2 | 14.0 | 14.0 | 14.0 | 14.0 | 13.2 |
| 20:10 | 16.1 | 13.8 | 14.5 | 15.7 | 13.6 | 14.5 | 15.4 | 14.6 | 14.3 | 15.6 | 14.5 | 13.7 | 14.5 | 13.8 | 14.6 | 13.8 | 14.5 | 14.5 | 13.7 | 13.7 | 13.8 | 13.7 | 14.5 | 13.7 |
| 20:20 | 15.8 | 13.8 | 14.5 | 14.5 | 13.6 | 14.5 | 15.4 | 14.6 | 13.4 | 15.6 | 13.6 | 13.7 | 14.5 | 13.8 | 14.6 | 13.8 | 14.5 | 14.5 | 13.7 | 13.7 | 13.8 | 13.7 | 14.5 | 13.7 |
| 20:30 | 15.6 | 13.3 | 14.0 | 15.2 | 14.0 | 14.0 | 14.9 | 14.1 | 13.8 | 15.1 | 14.0 | 14.0 | 14.0 | 14.1 | 14.9 | 13.3 | 14.9 | 14.8 | 13.2 | 13.2 | 14.1 | 14.1 | 14.0 | 13.2 |
| 05/10/2017, spring | TiB,LE has been corrected for View Factors over turf grass and PP | |||||||||||||||||||||||
| TiB,LE (°C) | VF of LE | 0.71 | 0.61 | 0.43 | 0.56 | 0.52 | 0.58 | 0.58 | 0.56 | 0.45 | 0.54 | 0.59 | 0.54 | 0.66 | 0.62 | 0.56 | 0.56 | 0.63 | 0.61 | 0.61 | 0.62 | 0.59 | 0.92 | 0.61 |
| Time | Murdoch Tambient | A | B | C | D | E | F | G | H | I | J | K | L | M | N | O | P | Q | R | S | T | U | V | W |
| 5:30 | 9.3 | 7.8 | 8.4 | 8.5 | 7.6 | 7.5 | 8.5 | 8.6 | 8.2 | 8.5 | 7.6 | 7.7 | 7.6 | 7.8 | 8.6 | 6.9 | 8.4 | 8.5 | 6.9 | 7.7 | 7.8 | 7.7 | 8.5 | 7.7 |
| 5:40 | 9.5 | 7.3 | 7.9 | 8.0 | 8.0 | 8.0 | 8.9 | 8.9 | 7.7 | 9.1 | 8.0 | 8.0 | 8.0 | 7.2 | 8.0 | 7.1 | 7.7 | 8.0 | 7.2 | 8.0 | 7.2 | 8.0 | 8.0 | 7.2 |
| 5:50 | 9.5 | 7.3 | 7.9 | 8.0 | 7.1 | 8.0 | 8.0 | 8.1 | 7.7 | 9.1 | 7.1 | 7.2 | 8.0 | 7.3 | 8.1 | 7.3 | 7.9 | 8.0 | 7.2 | 7.2 | 7.3 | 7.2 | 8.0 | 7.2 |
| 6:00 | 9.5 | 7.5 | 8.2 | 8.7 | 7.5 | 7.5 | 8.4 | 8.4 | 8.1 | 8.6 | 7.5 | 7.5 | 7.5 | 7.5 | 7.5 | 6.6 | 8.1 | 8.3 | 7.5 | 7.5 | 7.5 | 7.5 | 7.5 | 7.5 |
| 6:10 | 9.7 | 7.8 | 8.4 | 8.5 | 7.6 | 7.5 | 8.5 | 8.6 | 8.2 | 8.5 | 7.6 | 7.7 | 7.6 | 7.8 | 8.6 | 6.9 | 8.4 | 8.5 | 7.7 | 7.7 | 7.8 | 7.7 | 8.5 | 7.7 |
| 6:20 | 10.0 | 8.3 | 8.9 | 9.0 | 8.1 | 9.0 | 9.0 | 9.1 | 8.7 | 10.1 | 8.1 | 8.2 | 8.1 | 8.3 | 9.1 | 8.3 | 8.9 | 9.0 | 8.2 | 8.2 | 8.3 | 8.2 | 9.0 | 8.2 |
| 6:30 | 10.5 | 9.0 | 8.9 | 10.2 | 9.0 | 9.0 | 9.9 | 9.9 | 8.7 | 10.1 | 9.0 | 9.0 | 9.0 | 9.0 | 9.0 | 8.1 | 9.6 | 9.8 | 9.0 | 9.0 | 9.0 | 9.0 | 9.0 | 9.0 |
| 6:40 | 10.6 | 9.0 | 8.9 | 10.2 | 9.0 | 9.0 | 9.9 | 9.9 | 9.6 | 10.1 | 9.0 | 9.0 | 9.0 | 9.0 | 9.0 | 8.1 | 9.6 | 9.8 | 9.0 | 9.0 | 9.0 | 9.0 | 9.0 | 9.0 |
| 6:50 | 10.8 | 8.6 | 9.1 | 8.8 | 9.1 | 9.0 | 10.0 | 10.1 | 8.8 | 10.0 | 8.1 | 8.3 | 9.1 | 8.5 | 9.3 | 8.4 | 9.0 | 9.2 | 8.4 | 9.2 | 8.5 | 8.4 | 10.0 | 9.2 |
| 7:00 | 11.1 | 9.3 | 9.9 | 10.0 | 10.0 | 10.0 | 10.0 | 10.9 | 9.7 | 10.0 | 9.1 | 10.0 | 10.0 | 9.2 | 10.0 | 9.1 | 9.7 | 10.0 | 9.2 | 10.0 | 9.2 | 9.2 | 10.0 | 10.0 |
| 7:10 | 11.5 | 9.8 | 10.4 | 9.3 | 9.6 | 10.5 | 10.5 | 10.5 | 11.1 | 10.5 | 9.6 | 9.7 | 9.6 | 9.0 | 9.7 | 9.6 | 11.1 | 10.5 | 9.7 | 10.5 | 9.7 | 9.7 | 10.5 | 9.7 |
| 7:20 | 11.8 | 9.8 | 10.4 | 11.7 | 10.5 | 10.5 | 10.5 | 11.4 | 10.2 | 11.6 | 9.6 | 10.5 | 10.5 | 9.7 | 10.5 | 9.6 | 11.1 | 10.5 | 9.7 | 10.5 | 10.5 | 10.5 | 10.5 | 10.5 |
| 7:30 | 11.9 | 9.9 | 12.0 | 8.5 | 10.2 | 9.1 | 11.1 | 10.4 | 9.1 | 14.2 | 9.2 | 9.5 | 9.2 | 9.8 | 9.8 | 8.9 | 10.3 | 10.4 | 9.5 | 10.4 | 9.7 | 9.6 | 12.0 | 10.4 |
| 7:40 | 12.3 | 8.7 | 13.6 | 5.7 | 13.2 | 13.1 | 15.0 | 17.3 | 14.8 | 16.1 | 8.5 | 10.8 | 8.5 | 8.3 | 12.4 | 9.5 | 13.4 | 8.7 | 8.4 | 9.3 | 12.2 | 12.1 | 15.0 | 18.3 |
| 7:50 | 12.6 | 12.5 | 15.0 | 10.2 | 15.1 | 15.0 | 16.0 | 19.3 | 16.7 | 17.1 | 12.3 | 15.2 | 15.1 | 12.2 | 13.4 | 12.9 | 17.3 | 12.8 | 15.2 | 17.6 | 13.4 | 13.3 | 16.0 | 20.9 |
| 8:00 | 13.4 | 14.4 | 14.6 | 13.0 | 15.6 | 15.5 | 16.5 | 19.7 | 16.3 | 16.5 | 13.7 | 15.7 | 16.5 | 13.4 | 13.8 | 14.0 | 17.6 | 14.1 | 16.5 | 19.0 | 14.7 | 13.7 | 16.5 | 20.6 |
| 8:10 | 13.8 | 15.9 | 15.2 | 14.5 | 17.1 | 17.0 | 18.0 | 21.1 | 19.7 | 19.1 | 15.2 | 17.2 | 18.0 | 14.9 | 15.2 | 16.2 | 20.7 | 16.4 | 18.8 | 21.3 | 16.9 | 15.2 | 18.0 | 22.9 |
| 8:20 | 14.1 | 16.6 | 16.0 | 15.7 | 17.1 | 17.0 | 18.0 | 21.8 | 18.8 | 19.1 | 15.2 | 18.0 | 18.9 | 15.7 | 15.0 | 16.6 | 20.3 | 17.2 | 19.6 | 22.9 | 16.0 | 15.0 | 18.0 | 23.7 |
| 8:30 | 14.0 | 16.9 | 17.0 | 15.5 | 17.2 | 18.0 | 19.0 | 22.0 | 19.8 | 19.0 | 15.3 | 18.2 | 19.0 | 15.9 | 16.1 | 16.9 | 20.6 | 17.4 | 19.8 | 23.1 | 17.1 | 16.1 | 19.0 | 24.7 |
| 8:40 | 14.4 | 18.3 | 17.8 | 17.8 | 18.1 | 19.0 | 19.9 | 22.8 | 20.7 | 20.1 | 17.1 | 19.0 | 20.9 | 16.7 | 16.8 | 18.5 | 22.3 | 19.0 | 21.5 | 23.9 | 17.8 | 16.0 | 19.0 | 25.6 |
| 8:50 | 14.7 | 19.3 | 17.9 | 17.7 | 19.1 | 20.0 | 20.9 | 24.6 | 21.7 | 21.1 | 18.1 | 20.0 | 21.9 | 17.6 | 16.9 | 19.3 | 23.1 | 20.0 | 23.3 | 25.7 | 18.7 | 17.8 | 20.0 | 28.2 |
| 9:00 | 14.9 | 20.3 | 18.9 | 18.7 | 20.1 | 21.0 | 21.9 | 25.5 | 23.6 | 22.1 | 18.2 | 21.0 | 22.9 | 18.6 | 17.8 | 20.0 | 23.9 | 20.2 | 23.5 | 27.6 | 19.7 | 17.9 | 21.0 | 29.2 |
| 9:10 | 14.9 | 20.8 | 20.2 | 19.2 | 20.6 | 22.5 | 22.4 | 26.0 | 24.1 | 23.7 | 19.6 | 22.3 | 24.3 | 19.1 | 18.3 | 20.5 | 24.4 | 21.5 | 24.8 | 28.1 | 20.2 | 18.4 | 21.5 | 28.9 |
| 9:20 | 15.6 | 21.1 | 20.4 | 19.0 | 21.6 | 22.5 | 23.4 | 27.9 | 24.2 | 22.5 | 19.7 | 22.5 | 24.4 | 19.4 | 18.5 | 21.5 | 25.4 | 21.7 | 25.0 | 29.1 | 21.2 | 18.6 | 22.5 | 31.5 |
| 9:30 | 15.4 | 22.3 | 20.0 | 19.5 | 23.0 | 23.0 | 24.7 | 29.1 | 25.6 | 24.1 | 21.1 | 23.8 | 24.9 | 19.9 | 19.7 | 21.8 | 26.6 | 22.2 | 26.3 | 30.4 | 22.4 | 19.0 | 23.0 | 32.8 |
| 9:40 | 16.1 | 22.8 | 20.5 | 20.0 | 23.5 | 23.5 | 24.4 | 29.6 | 26.1 | 24.6 | 21.6 | 24.3 | 26.3 | 20.4 | 20.2 | 22.3 | 27.1 | 23.5 | 26.8 | 30.9 | 22.1 | 19.5 | 23.5 | 34.2 |
| 9:50 | 15.8 | 22.8 | 21.3 | 21.2 | 22.6 | 24.5 | 24.4 | 27.9 | 26.1 | 24.6 | 20.7 | 24.3 | 26.3 | 20.4 | 20.2 | 22.3 | 27.1 | 22.7 | 26.8 | 30.9 | 22.9 | 19.5 | 23.5 | 31.7 |
| 10:00 | 16.7 | 22.8 | 22.1 | 21.2 | 23.5 | 24.5 | 25.2 | 29.5 | 26.1 | 25.7 | 22.6 | 25.2 | 27.2 | 21.1 | 21.0 | 22.1 | 27.0 | 24.3 | 27.6 | 31.7 | 22.8 | 19.4 | 23.5 | 33.3 |
| 10:10 | 16.4 | 23.3 | 21.8 | 22.8 | 25.8 | 25.9 | 26.6 | 31.8 | 27.5 | 26.2 | 22.1 | 24.8 | 27.7 | 22.4 | 20.7 | 23.4 | 28.4 | 25.6 | 29.7 | 32.2 | 25.0 | 21.6 | 24.0 | 36.3 |
| 10:20 | 16.9 | 22.3 | 20.8 | 21.8 | 23.0 | 24.9 | 24.7 | 29.1 | 25.6 | 25.2 | 21.1 | 23.8 | 25.8 | 20.6 | 19.7 | 22.7 | 26.6 | 23.0 | 26.3 | 30.4 | 23.2 | 19.8 | 23.0 | 33.7 |
| 10:30 | 17.3 | 24.0 | 23.4 | 22.8 | 25.8 | 25.9 | 26.6 | 31.8 | 27.5 | 27.3 | 23.1 | 25.7 | 27.7 | 21.6 | 21.5 | 23.4 | 28.4 | 24.8 | 28.9 | 32.2 | 23.3 | 20.8 | 24.0 | 37.1 |
| 10:40 | 17.0 | 23.3 | 21.7 | 22.8 | 24.9 | 25.9 | 26.6 | 30.8 | 26.6 | 26.2 | 23.1 | 25.7 | 27.7 | 21.6 | 21.4 | 23.2 | 28.2 | 24.8 | 28.9 | 33.0 | 23.3 | 21.5 | 24.0 | 36.3 |
| 10:50 | 17.4 | 25.0 | 23.5 | 23.8 | 25.9 | 26.9 | 27.6 | 32.6 | 28.6 | 27.2 | 24.1 | 26.7 | 28.7 | 22.6 | 22.3 | 25.8 | 29.0 | 25.8 | 29.9 | 34.8 | 25.0 | 21.6 | 25.0 | 37.3 |
| 11:00 | 17.7 | 25.7 | 23.5 | 25.0 | 25.9 | 27.9 | 27.6 | 32.6 | 29.5 | 28.3 | 24.1 | 26.7 | 29.6 | 24.1 | 22.3 | 25.8 | 30.8 | 26.6 | 30.7 | 34.8 | 25.8 | 22.5 | 25.0 | 38.1 |
| 11:10 | 18.1 | 28.3 | 24.7 | 26.7 | 26.4 | 27.4 | 28.1 | 33.7 | 29.1 | 27.7 | 26.4 | 28.9 | 32.0 | 25.3 | 24.1 | 27.3 | 31.6 | 27.1 | 31.2 | 37.8 | 25.3 | 21.9 | 25.5 | 38.6 |
| 11:20 | 17.8 | 27.0 | 26.3 | 25.8 | 27.9 | 28.9 | 29.6 | 35.5 | 30.6 | 30.3 | 25.1 | 28.7 | 30.7 | 25.3 | 23.5 | 26.9 | 31.9 | 28.6 | 32.7 | 36.8 | 27.8 | 23.6 | 27.0 | 40.9 |
| 11:30 | 18.3 | 27.2 | 26.6 | 25.3 | 28.3 | 28.4 | 29.1 | 35.0 | 29.2 | 28.7 | 25.6 | 28.2 | 31.1 | 24.8 | 23.8 | 27.3 | 31.4 | 28.1 | 32.2 | 36.3 | 27.3 | 23.1 | 26.5 | 40.4 |
| 11:40 | 18.4 | 27.7 | 26.3 | 25.8 | 27.0 | 29.9 | 30.4 | 34.5 | 30.6 | 30.3 | 26.1 | 29.5 | 31.6 | 25.3 | 24.2 | 27.5 | 32.6 | 27.8 | 31.9 | 37.7 | 26.9 | 22.7 | 27.0 | 39.3 |
| 11:50 | 18.3 | 27.5 | 26.8 | 25.2 | 29.3 | 29.4 | 30.1 | 35.1 | 30.2 | 30.8 | 26.6 | 28.3 | 31.2 | 25.1 | 24.0 | 27.4 | 32.4 | 29.1 | 33.2 | 37.3 | 29.1 | 23.3 | 27.5 | 39.8 |
| 12:00 | 18.8 | 27.7 | 25.4 | 25.8 | 29.7 | 28.9 | 29.6 | 36.2 | 29.7 | 29.2 | 27.0 | 29.5 | 31.6 | 24.6 | 24.2 | 27.5 | 31.7 | 28.6 | 32.7 | 37.7 | 27.8 | 24.4 | 27.0 | 41.8 |
| 12:10 | 19.0 | 29.1 | 27.1 | 27.0 | 27.9 | 29.9 | 30.4 | 34.5 | 30.6 | 30.3 | 27.0 | 29.5 | 32.6 | 25.3 | 24.2 | 28.4 | 32.6 | 29.4 | 33.6 | 37.7 | 28.6 | 24.4 | 27.0 | 40.9 |
| 12:20 | 19.7 | 27.5 | 26.1 | 26.3 | 28.4 | 29.4 | 30.1 | 35.2 | 29.3 | 29.7 | 26.6 | 28.3 | 31.2 | 25.1 | 24.1 | 27.6 | 31.7 | 28.3 | 31.6 | 36.5 | 28.4 | 23.3 | 27.5 | 39.8 |
| 12:30 | 19.8 | 28.2 | 26.8 | 27.5 | 29.3 | 31.3 | 30.9 | 35.0 | 31.1 | 30.8 | 27.5 | 30.0 | 33.1 | 26.6 | 25.5 | 28.0 | 32.2 | 28.3 | 31.6 | 38.2 | 29.1 | 24.1 | 27.5 | 39.0 |
| 12:40 | 19.4 | 29.2 | 28.6 | 27.3 | 29.4 | 32.3 | 31.9 | 36.9 | 33.0 | 32.9 | 28.5 | 31.0 | 34.1 | 26.8 | 25.7 | 29.9 | 34.1 | 29.3 | 33.4 | 39.2 | 30.1 | 25.1 | 28.5 | 40.8 |
| 12:50 | 19.7 | 28.0 | 27.3 | 26.8 | 28.0 | 30.9 | 31.4 | 35.5 | 30.7 | 30.2 | 28.0 | 30.5 | 32.6 | 26.3 | 25.2 | 29.4 | 32.7 | 28.8 | 32.9 | 38.7 | 27.9 | 25.4 | 28.0 | 40.3 |
| 13:00 | 19.7 | 26.5 | 29.2 | 26.5 | 27.4 | 30.3 | 29.1 | 33.4 | 30.1 | 29.8 | 26.5 | 28.2 | 31.1 | 24.9 | 24.8 | 26.8 | 30.9 | 27.3 | 30.6 | 34.7 | 27.5 | 24.1 | 26.5 | 38.0 |
| 13:10 | 20.5 | 29.5 | 30.5 | 27.2 | 29.5 | 33.3 | 32.9 | 35.4 | 34.0 | 33.9 | 28.6 | 31.2 | 35.1 | 27.8 | 26.8 | 30.3 | 35.3 | 28.7 | 32.0 | 39.3 | 30.3 | 24.4 | 29.5 | 41.0 |
| 13:20 | 20.4 | 28.0 | 26.5 | 28.0 | 28.9 | 30.9 | 31.4 | 34.7 | 31.6 | 30.2 | 28.9 | 31.4 | 33.6 | 26.3 | 26.0 | 28.5 | 32.7 | 28.0 | 32.1 | 38.7 | 28.8 | 25.4 | 28.0 | 40.3 |
| 13:30 | 20.5 | 31.1 | 27.5 | 30.2 | 31.7 | 31.9 | 33.3 | 38.2 | 34.4 | 33.4 | 29.0 | 32.4 | 35.5 | 28.8 | 27.8 | 31.3 | 34.6 | 33.0 | 35.6 | 39.7 | 32.2 | 27.2 | 29.0 | 42.1 |
| 13:40 | 20.6 | 29.2 | 28.7 | 28.5 | 29.4 | 31.4 | 31.9 | 35.3 | 32.1 | 30.7 | 28.5 | 30.2 | 33.1 | 27.6 | 25.9 | 29.5 | 32.7 | 29.3 | 32.6 | 37.5 | 29.4 | 26.0 | 28.5 | 39.2 |
| 13:50 | 20.5 | 27.4 | 29.1 | 26.0 | 29.5 | 32.4 | 32.9 | 35.7 | 32.2 | 32.8 | 27.6 | 29.5 | 32.3 | 26.4 | 26.3 | 29.4 | 32.5 | 28.7 | 32.0 | 36.1 | 29.8 | 25.6 | 29.5 | 38.5 |
| 14:00 | 21.0 | 30.2 | 28.1 | 29.5 | 30.4 | 32.4 | 32.9 | 35.5 | 33.1 | 32.8 | 29.5 | 32.0 | 34.1 | 28.6 | 26.9 | 30.5 | 33.7 | 30.3 | 33.6 | 38.5 | 31.2 | 26.2 | 29.5 | 40.2 |
| 14:10 | 20.7 | 28.5 | 29.6 | 27.3 | 29.4 | 31.4 | 31.9 | 34.5 | 31.2 | 30.7 | 28.5 | 30.2 | 32.2 | 26.9 | 26.0 | 29.7 | 32.0 | 28.5 | 31.8 | 36.7 | 28.6 | 25.3 | 28.5 | 38.3 |
| 14:20 | 21.1 | 29.0 | 27.6 | 27.8 | 30.8 | 31.9 | 32.4 | 35.9 | 32.6 | 32.3 | 29.9 | 31.5 | 33.6 | 27.4 | 27.3 | 29.3 | 32.5 | 29.8 | 32.3 | 37.2 | 30.0 | 26.6 | 29.0 | 38.8 |
| 14:30 | 21.5 | 28.5 | 27.1 | 28.5 | 29.4 | 31.4 | 31.9 | 33.7 | 32.1 | 30.7 | 29.4 | 31.0 | 33.1 | 26.9 | 26.8 | 29.7 | 32.0 | 29.3 | 31.8 | 36.7 | 28.6 | 26.1 | 28.5 | 37.5 |
| 14:40 | 21.2 | 27.8 | 27.3 | 27.3 | 28.5 | 31.4 | 31.9 | 33.9 | 31.2 | 29.6 | 28.5 | 30.2 | 31.3 | 26.1 | 26.2 | 28.6 | 30.8 | 28.5 | 31.0 | 34.2 | 28.8 | 25.5 | 28.5 | 35.9 |
| 14:50 | 21.6 | 27.5 | 28.7 | 28.7 | 28.4 | 31.3 | 30.9 | 32.9 | 31.1 | 30.8 | 28.4 | 29.2 | 32.1 | 26.7 | 26.0 | 28.5 | 30.7 | 27.5 | 30.0 | 33.2 | 28.7 | 25.3 | 27.5 | 34.9 |
| 15:00 | 21.5 | 27.5 | 27.9 | 27.5 | 28.4 | 30.4 | 30.9 | 32.1 | 30.2 | 30.8 | 28.4 | 29.2 | 31.2 | 25.9 | 26.0 | 28.5 | 30.7 | 27.5 | 29.1 | 33.2 | 28.7 | 25.3 | 27.5 | 34.9 |
| 15:10 | 21.3 | 27.0 | 27.4 | 28.2 | 27.9 | 29.9 | 30.4 | 31.6 | 29.7 | 29.2 | 27.9 | 28.7 | 30.7 | 26.2 | 25.5 | 28.0 | 30.2 | 27.0 | 29.5 | 32.7 | 27.3 | 24.8 | 27.0 | 34.4 |
| 15:20 | 21.5 | 28.2 | 26.2 | 27.5 | 28.4 | 30.4 | 30.9 | 32.8 | 30.2 | 29.7 | 28.4 | 30.0 | 31.2 | 26.6 | 25.9 | 29.0 | 30.3 | 28.3 | 30.0 | 34.9 | 27.7 | 26.0 | 27.5 | 34.9 |
| 15:30 | 21.4 | 27.0 | 26.6 | 28.2 | 27.0 | 29.9 | 29.6 | 31.6 | 28.8 | 28.1 | 27.0 | 28.7 | 29.8 | 26.2 | 26.4 | 28.0 | 29.3 | 27.0 | 28.6 | 32.7 | 26.5 | 24.8 | 27.0 | 33.6 |
| 15:40 | 21.1 | 26.5 | 26.2 | 27.7 | 26.5 | 28.4 | 29.1 | 30.4 | 28.3 | 27.6 | 26.5 | 27.3 | 29.3 | 25.7 | 25.2 | 28.0 | 29.1 | 27.3 | 28.1 | 30.6 | 27.0 | 24.5 | 26.5 | 31.4 |
| 15:50 | 21.4 | 25.5 | 25.1 | 26.7 | 25.5 | 28.4 | 28.9 | 28.4 | 27.3 | 26.6 | 26.4 | 27.2 | 28.3 | 24.7 | 24.9 | 26.8 | 27.9 | 26.3 | 27.1 | 30.4 | 25.9 | 23.4 | 25.5 | 30.4 |
| 16:00 | 21.0 | 25.3 | 26.5 | 26.0 | 26.0 | 28.9 | 28.6 | 29.0 | 27.8 | 28.2 | 26.9 | 26.8 | 29.7 | 24.4 | 25.5 | 25.7 | 27.7 | 26.0 | 26.8 | 30.1 | 26.5 | 24.0 | 26.0 | 30.1 |
| 16:10 | 21.3 | 24.3 | 24.8 | 25.0 | 24.1 | 26.9 | 27.6 | 27.3 | 25.9 | 26.1 | 25.9 | 25.8 | 26.9 | 23.4 | 24.7 | 25.2 | 26.2 | 24.2 | 25.0 | 27.5 | 24.8 | 23.1 | 25.0 | 27.5 |
| 16:20 | 21.2 | 22.8 | 23.3 | 24.7 | 23.5 | 26.4 | 26.1 | 25.8 | 25.2 | 24.6 | 25.4 | 25.2 | 26.3 | 22.7 | 23.2 | 24.6 | 25.6 | 24.3 | 24.3 | 26.0 | 24.1 | 22.4 | 23.5 | 26.0 |
| 16:30 | 20.9 | 22.8 | 23.3 | 24.7 | 22.6 | 25.4 | 26.1 | 25.1 | 24.3 | 24.6 | 24.4 | 24.3 | 25.4 | 22.7 | 23.3 | 23.9 | 24.9 | 23.5 | 23.5 | 25.1 | 24.2 | 21.7 | 23.5 | 25.1 |
| 16:40 | 20.9 | 22.3 | 22.8 | 24.2 | 22.1 | 24.9 | 25.6 | 24.6 | 23.8 | 24.1 | 23.9 | 23.8 | 24.9 | 22.2 | 22.8 | 23.4 | 24.4 | 23.0 | 23.0 | 24.6 | 22.9 | 21.2 | 23.0 | 24.6 |
| 16:50 | 20.6 | 22.3 | 22.9 | 24.2 | 22.1 | 24.9 | 25.6 | 23.8 | 23.8 | 24.1 | 23.9 | 23.0 | 24.9 | 22.2 | 22.9 | 22.8 | 23.7 | 22.2 | 22.2 | 23.8 | 22.9 | 21.2 | 23.0 | 23.8 |
| 17:00 | 20.6 | 21.3 | 21.9 | 23.2 | 21.1 | 23.9 | 23.7 | 22.8 | 22.8 | 23.1 | 22.9 | 22.0 | 23.9 | 21.2 | 21.9 | 22.7 | 22.6 | 22.0 | 22.0 | 22.8 | 21.9 | 20.2 | 22.0 | 22.0 |
| 17:10 | 20.6 | 20.8 | 21.4 | 22.7 | 20.6 | 23.4 | 23.2 | 22.3 | 22.3 | 22.6 | 22.4 | 21.5 | 23.4 | 20.7 | 21.4 | 21.3 | 22.1 | 21.5 | 20.7 | 22.3 | 21.4 | 19.7 | 21.5 | 21.5 |
| 17:20 | 20.5 | 19.8 | 21.3 | 21.7 | 19.6 | 22.4 | 23.1 | 20.5 | 21.3 | 21.6 | 21.4 | 20.5 | 22.4 | 19.7 | 21.3 | 21.4 | 21.3 | 20.5 | 19.7 | 20.5 | 20.5 | 19.7 | 20.5 | 19.7 |
| 17:30 | 20.2 | 18.8 | 20.3 | 21.8 | 19.5 | 21.4 | 22.1 | 20.4 | 20.3 | 21.7 | 21.4 | 20.3 | 21.4 | 19.5 | 20.3 | 19.5 | 20.3 | 19.5 | 18.7 | 19.5 | 19.5 | 18.7 | 19.5 | 19.5 |
| 17:40 | 20.1 | 18.5 | 20.0 | 22.0 | 19.4 | 21.4 | 21.9 | 20.1 | 20.2 | 21.8 | 21.3 | 20.2 | 21.3 | 19.2 | 20.8 | 19.2 | 20.0 | 19.3 | 18.5 | 19.3 | 19.2 | 19.3 | 18.5 | 19.3 |
| 17:50 | 19.6 | 18.0 | 18.7 | 20.3 | 18.0 | 19.9 | 20.6 | 19.7 | 18.8 | 20.2 | 19.9 | 18.8 | 19.9 | 18.0 | 19.6 | 18.9 | 18.8 | 18.0 | 17.2 | 18.0 | 18.0 | 18.0 | 18.0 | 18.0 |
| 18:00 | 19.5 | 17.0 | 17.7 | 19.3 | 17.0 | 18.9 | 19.6 | 18.7 | 16.9 | 19.2 | 19.8 | 18.7 | 18.9 | 17.0 | 19.4 | 17.0 | 17.8 | 17.0 | 16.2 | 17.0 | 17.0 | 17.0 | 17.0 | 17.0 |
| 18:10 | 19.0 | 16.0 | 17.6 | 18.3 | 16.0 | 17.9 | 19.4 | 17.7 | 16.7 | 19.3 | 18.8 | 17.7 | 18.8 | 16.0 | 18.4 | 16.0 | 17.6 | 16.8 | 16.0 | 16.0 | 16.8 | 16.8 | 16.0 | 16.0 |
| 18:20 | 18.8 | 14.3 | 16.5 | 18.5 | 15.0 | 16.9 | 18.4 | 16.7 | 15.7 | 18.3 | 17.8 | 16.7 | 16.9 | 15.0 | 17.4 | 15.0 | 15.7 | 15.0 | 14.2 | 15.0 | 15.0 | 15.0 | 15.0 | 14.2 |
| 18:30 | 18.3 | 13.8 | 15.3 | 18.0 | 14.5 | 16.4 | 17.1 | 16.3 | 15.2 | 17.8 | 17.3 | 16.2 | 16.4 | 14.5 | 17.0 | 14.7 | 15.4 | 14.5 | 13.7 | 13.7 | 14.6 | 14.6 | 14.5 | 13.7 |
| 18:40 | 17.6 | 13.5 | 15.0 | 18.2 | 12.6 | 16.4 | 16.9 | 14.4 | 14.2 | 16.8 | 16.3 | 15.2 | 16.3 | 14.3 | 15.9 | 14.4 | 15.1 | 14.3 | 12.7 | 13.5 | 14.3 | 14.3 | 13.5 | 12.7 |
| 18:50 | 17.3 | 11.1 | 14.1 | 14.8 | 11.6 | 15.4 | 16.8 | 13.5 | 13.2 | 16.9 | 15.3 | 14.2 | 14.4 | 12.5 | 15.1 | 13.0 | 13.6 | 11.7 | 10.0 | 10.9 | 12.6 | 13.5 | 12.5 | 10.9 |
| 19:00 | 16.8 | 11.3 | 13.6 | 14.3 | 11.1 | 14.9 | 16.3 | 12.9 | 12.7 | 15.3 | 14.8 | 13.7 | 13.9 | 11.3 | 14.5 | 12.2 | 12.9 | 12.0 | 10.4 | 11.2 | 12.1 | 12.9 | 12.0 | 11.2 |
| 19:10 | 16.7 | 10.1 | 12.3 | 13.8 | 10.6 | 13.4 | 14.9 | 11.7 | 11.3 | 14.8 | 13.4 | 12.3 | 12.4 | 10.0 | 13.3 | 11.1 | 12.5 | 10.7 | 9.0 | 9.9 | 10.8 | 11.6 | 11.5 | 9.9 |
| 19:20 | 16.2 | 9.6 | 11.8 | 12.2 | 10.1 | 12.9 | 14.4 | 11.2 | 10.8 | 14.3 | 12.9 | 11.8 | 11.9 | 9.5 | 12.8 | 10.6 | 11.1 | 10.2 | 8.5 | 9.4 | 9.5 | 11.1 | 11.0 | 9.4 |
| 19:30 | 15.8 | 9.1 | 11.3 | 12.8 | 9.6 | 12.4 | 13.9 | 11.5 | 10.2 | 13.8 | 12.4 | 11.3 | 11.4 | 9.0 | 12.3 | 10.1 | 10.6 | 9.7 | 8.9 | 8.9 | 9.8 | 10.6 | 10.5 | 8.9 |
| 19:40 | 16.0 | 9.1 | 11.3 | 11.7 | 9.6 | 12.4 | 13.1 | 10.7 | 10.2 | 13.8 | 11.4 | 11.3 | 11.4 | 9.0 | 12.3 | 9.2 | 10.6 | 9.7 | 8.0 | 8.9 | 9.0 | 10.6 | 10.5 | 8.9 |
| 19:50 | 15.8 | 8.6 | 10.7 | 11.2 | 9.1 | 11.9 | 13.4 | 10.9 | 9.7 | 13.3 | 11.9 | 10.8 | 10.9 | 8.5 | 11.7 | 9.3 | 9.9 | 9.2 | 8.4 | 9.2 | 9.3 | 10.1 | 10.0 | 9.2 |
| 20:00 | 15.6 | 8.6 | 10.8 | 11.2 | 9.1 | 11.0 | 12.6 | 10.2 | 9.7 | 12.2 | 10.9 | 10.8 | 10.9 | 8.5 | 11.8 | 8.7 | 10.1 | 9.2 | 8.4 | 8.4 | 8.5 | 10.1 | 10.0 | 8.4 |
| 20:10 | 14.9 | 8.8 | 10.2 | 10.7 | 8.6 | 11.4 | 12.9 | 10.4 | 9.2 | 12.8 | 11.4 | 10.3 | 10.4 | 8.8 | 11.2 | 8.8 | 10.3 | 9.5 | 7.9 | 8.7 | 8.8 | 9.6 | 9.5 | 8.7 |
| 20:20 | 13.7 | 8.8 | 10.2 | 10.7 | 8.6 | 11.4 | 12.9 | 9.6 | 9.2 | 12.8 | 11.4 | 10.3 | 10.4 | 8.8 | 11.2 | 8.8 | 10.3 | 9.5 | 7.9 | 8.7 | 8.8 | 9.6 | 9.5 | 7.9 |
| 20:30 | 13.4 | 8.3 | 9.7 | 10.2 | 8.1 | 10.9 | 11.6 | 9.9 | 8.7 | 12.3 | 9.9 | 9.8 | 9.9 | 8.3 | 10.7 | 8.3 | 9.8 | 9.0 | 7.4 | 8.2 | 8.3 | 9.1 | 9.0 | 8.2 |
| 09/01/2018, summer | TiB,LE has been corrected for View Factors over turf grass and PP | |||||||||||||||||||||||
| TiB,LE (°C) | VF of LE | 0.71 | 0.61 | 0.43 | 0.56 | 0.52 | 0.58 | 0.58 | 0.56 | 0.45 | 0.54 | 0.59 | 0.54 | 0.66 | 0.62 | 0.56 | 0.56 | 0.63 | 0.61 | 0.61 | 0.62 | 0.59 | 0.98 | 0.61 |
| Time | Murdoch Tambient | A | B | C | D | E | F | G | H | I | J | K | L | M | N | O | P | Q | R | S | T | U | V | W |
| 5:00 | 18.6 | 16.3 | 17.0 | 17.0 | 17.0 | 17.0 | 17.9 | 17.1 | 16.9 | 18.1 | 17.0 | 17.0 | 17.0 | 16.3 | 17.1 | 16.3 | 17.9 | 17.8 | 16.2 | 16.2 | 17.1 | 17.0 | 17.0 | 16.2 |
| 5:10 | 18.6 | 16.3 | 17.0 | 17.0 | 16.1 | 17.0 | 17.0 | 17.1 | 16.9 | 18.1 | 17.0 | 16.2 | 17.0 | 16.3 | 17.1 | 16.3 | 17.0 | 17.0 | 16.2 | 16.2 | 16.3 | 16.2 | 17.0 | 16.2 |
| 5:20 | 18.1 | 16.3 | 17.0 | 17.0 | 16.1 | 17.0 | 17.0 | 17.1 | 16.9 | 17.0 | 17.0 | 16.2 | 16.1 | 16.3 | 17.1 | 16.3 | 17.0 | 17.0 | 16.2 | 16.2 | 16.3 | 16.2 | 17.0 | 16.2 |
| 5:30 | 18.1 | 16.3 | 17.0 | 17.0 | 16.1 | 17.0 | 17.0 | 17.1 | 16.9 | 17.0 | 17.0 | 16.2 | 16.1 | 16.3 | 17.1 | 16.3 | 17.0 | 17.0 | 16.2 | 16.2 | 16.3 | 16.2 | 17.0 | 16.2 |
| 5:40 | 18.2 | 16.3 | 17.0 | 17.0 | 16.1 | 17.0 | 17.0 | 17.1 | 16.9 | 17.0 | 17.0 | 16.2 | 16.1 | 16.3 | 17.1 | 16.3 | 17.0 | 17.0 | 16.2 | 16.2 | 16.3 | 16.2 | 17.0 | 16.2 |
| 5:50 | 18.2 | 16.1 | 16.6 | 16.3 | 16.6 | 16.5 | 17.5 | 17.6 | 16.6 | 17.5 | 16.6 | 16.7 | 16.6 | 16.0 | 16.8 | 15.9 | 17.6 | 17.5 | 16.7 | 16.7 | 16.8 | 16.7 | 17.5 | 16.7 |
| 6:00 | 18.3 | 16.8 | 17.4 | 17.5 | 16.6 | 17.5 | 18.4 | 17.5 | 17.4 | 17.5 | 17.5 | 16.7 | 17.5 | 16.7 | 17.5 | 16.6 | 18.3 | 17.5 | 16.7 | 17.5 | 16.7 | 16.7 | 17.5 | 16.7 |
| 6:10 | 18.3 | 16.8 | 17.4 | 17.5 | 16.6 | 17.5 | 18.4 | 18.4 | 17.4 | 18.6 | 17.5 | 16.7 | 17.5 | 16.7 | 17.5 | 16.6 | 18.3 | 17.5 | 16.7 | 17.5 | 16.7 | 16.7 | 17.5 | 17.5 |
| 6:20 | 18.5 | 17.1 | 17.7 | 16.2 | 17.6 | 17.5 | 18.5 | 18.6 | 17.6 | 18.5 | 16.6 | 16.8 | 16.6 | 17.0 | 17.8 | 16.9 | 17.7 | 17.7 | 16.9 | 17.7 | 17.0 | 16.8 | 18.5 | 19.3 |
| 6:30 | 19.0 | 18.1 | 19.4 | 18.3 | 19.5 | 19.5 | 20.4 | 21.1 | 19.4 | 20.6 | 18.6 | 18.7 | 19.5 | 18.0 | 18.6 | 18.4 | 20.1 | 18.7 | 18.7 | 20.3 | 18.6 | 17.8 | 19.5 | 20.3 |
| 6:40 | 19.2 | 19.8 | 19.6 | 19.3 | 19.6 | 19.5 | 20.5 | 22.1 | 20.4 | 20.5 | 19.6 | 19.7 | 20.5 | 19.0 | 19.6 | 19.4 | 21.1 | 19.7 | 20.5 | 21.3 | 18.8 | 18.8 | 20.5 | 21.3 |
| 6:50 | 19.4 | 20.3 | 20.0 | 19.8 | 21.0 | 21.0 | 21.0 | 22.6 | 21.7 | 22.1 | 20.1 | 20.2 | 21.0 | 19.5 | 20.0 | 19.6 | 22.3 | 21.0 | 21.8 | 22.6 | 19.3 | 19.3 | 21.0 | 22.6 |
| 7:00 | 19.5 | 21.5 | 21.3 | 20.3 | 21.5 | 21.5 | 22.4 | 23.8 | 22.2 | 22.6 | 20.6 | 21.5 | 22.4 | 19.9 | 20.4 | 20.8 | 22.7 | 21.5 | 22.3 | 24.0 | 20.5 | 19.8 | 21.5 | 24.0 |
| 7:10 | 20.0 | 22.3 | 22.0 | 20.7 | 22.1 | 23.0 | 23.0 | 25.3 | 23.7 | 24.1 | 21.1 | 22.2 | 23.9 | 21.4 | 21.1 | 21.4 | 24.2 | 23.0 | 23.8 | 25.5 | 21.2 | 20.5 | 23.0 | 25.5 |
| 7:20 | 20.2 | 22.8 | 22.5 | 21.2 | 22.6 | 23.5 | 23.5 | 25.8 | 24.2 | 24.6 | 21.6 | 22.7 | 24.4 | 21.9 | 21.6 | 21.9 | 25.6 | 23.5 | 25.1 | 26.0 | 21.7 | 21.0 | 23.5 | 26.8 |
| 7:30 | 20.7 | 24.0 | 22.9 | 22.8 | 24.0 | 24.0 | 24.9 | 27.1 | 24.7 | 25.1 | 23.1 | 24.0 | 25.9 | 22.4 | 22.0 | 23.1 | 25.9 | 24.0 | 25.6 | 27.3 | 22.1 | 21.5 | 24.0 | 28.1 |
| 7:40 | 21.0 | 25.0 | 23.9 | 23.8 | 25.0 | 25.0 | 25.9 | 29.0 | 26.5 | 27.2 | 24.1 | 25.0 | 26.9 | 23.4 | 23.0 | 24.1 | 27.8 | 25.0 | 27.5 | 28.3 | 23.1 | 22.5 | 25.0 | 29.9 |
| 7:50 | 21.2 | 25.5 | 24.4 | 24.3 | 25.5 | 25.5 | 26.4 | 29.4 | 27.0 | 26.6 | 24.6 | 25.5 | 27.4 | 23.9 | 23.4 | 24.3 | 28.1 | 25.5 | 28.0 | 29.6 | 23.6 | 23.0 | 25.5 | 30.4 |
| 8:00 | 21.7 | 26.5 | 25.4 | 25.3 | 25.6 | 27.5 | 27.4 | 30.4 | 28.1 | 27.6 | 25.6 | 26.5 | 28.4 | 24.9 | 24.4 | 25.3 | 29.1 | 26.5 | 28.1 | 30.6 | 24.6 | 24.0 | 26.5 | 31.4 |
| 8:10 | 22.6 | 28.0 | 26.9 | 25.7 | 28.0 | 28.0 | 28.9 | 31.9 | 29.6 | 29.1 | 26.1 | 28.0 | 29.9 | 26.4 | 25.1 | 26.8 | 31.6 | 28.0 | 30.5 | 32.1 | 26.1 | 25.5 | 28.0 | 34.6 |
| 8:20 | 23.1 | 28.5 | 26.5 | 26.2 | 29.4 | 29.5 | 30.2 | 33.2 | 30.1 | 30.7 | 27.6 | 29.3 | 31.3 | 26.9 | 26.3 | 27.1 | 31.9 | 28.5 | 31.8 | 33.4 | 27.3 | 26.0 | 28.5 | 36.7 |
| 8:30 | 23.0 | 29.7 | 28.6 | 27.8 | 29.0 | 30.9 | 30.7 | 34.4 | 32.1 | 31.2 | 28.1 | 30.7 | 32.7 | 28.2 | 27.5 | 29.1 | 34.0 | 29.8 | 33.1 | 34.7 | 27.7 | 27.3 | 29.0 | 35.6 |
| 8:40 | 23.4 | 30.2 | 28.3 | 28.3 | 29.5 | 31.4 | 31.2 | 34.1 | 31.9 | 31.7 | 28.6 | 30.3 | 33.2 | 27.9 | 27.2 | 28.8 | 34.5 | 30.3 | 33.6 | 35.2 | 28.2 | 27.0 | 29.5 | 37.7 |
| 8:50 | 24.2 | 31.2 | 29.2 | 29.3 | 31.4 | 32.4 | 32.2 | 36.7 | 32.9 | 32.7 | 29.6 | 32.2 | 34.2 | 28.9 | 28.1 | 30.4 | 34.4 | 31.3 | 34.6 | 37.1 | 29.2 | 28.0 | 30.5 | 39.5 |
| 9:00 | 24.5 | 31.7 | 29.8 | 29.8 | 31.9 | 32.9 | 32.7 | 36.4 | 34.2 | 33.2 | 30.1 | 31.8 | 34.7 | 29.4 | 28.7 | 31.1 | 36.0 | 31.0 | 34.3 | 36.7 | 29.7 | 28.5 | 31.0 | 40.0 |
| 9:10 | 25.1 | 33.4 | 30.7 | 30.8 | 33.8 | 33.9 | 34.6 | 38.1 | 35.2 | 35.3 | 31.1 | 33.7 | 36.6 | 31.1 | 29.6 | 31.7 | 37.5 | 33.6 | 36.9 | 39.4 | 31.4 | 29.5 | 32.0 | 42.7 |
| 9:20 | 25.1 | 33.2 | 30.4 | 30.2 | 33.4 | 34.4 | 34.2 | 40.4 | 34.9 | 35.8 | 31.6 | 33.3 | 36.2 | 30.1 | 30.1 | 31.5 | 36.4 | 32.5 | 36.6 | 39.1 | 31.2 | 30.0 | 32.5 | 42.3 |
| 9:30 | 25.6 | 34.9 | 32.2 | 32.3 | 34.4 | 35.4 | 35.2 | 40.5 | 36.7 | 35.7 | 32.6 | 35.2 | 38.1 | 31.9 | 31.1 | 33.2 | 38.2 | 34.3 | 37.6 | 40.9 | 32.1 | 31.0 | 33.5 | 43.3 |
| 9:40 | 26.4 | 34.2 | 33.0 | 31.2 | 35.3 | 35.4 | 35.2 | 41.4 | 36.7 | 36.8 | 32.6 | 36.0 | 38.1 | 31.9 | 31.1 | 33.2 | 39.1 | 34.3 | 38.4 | 40.9 | 32.1 | 31.0 | 33.5 | 45.0 |
| 9:50 | 26.6 | 36.4 | 33.7 | 32.7 | 36.8 | 36.9 | 36.7 | 42.0 | 38.2 | 38.3 | 34.1 | 37.5 | 39.6 | 33.4 | 31.7 | 34.7 | 40.6 | 35.8 | 39.9 | 42.4 | 33.6 | 32.5 | 35.0 | 48.1 |
| 10:00 | 27.8 | 36.4 | 34.5 | 33.8 | 37.7 | 37.9 | 37.6 | 43.6 | 39.8 | 38.3 | 35.0 | 37.5 | 40.6 | 33.4 | 33.3 | 35.3 | 41.3 | 35.8 | 40.7 | 43.2 | 34.3 | 33.3 | 35.0 | 48.9 |
| 10:10 | 27.9 | 38.1 | 36.2 | 36.0 | 39.6 | 38.9 | 38.6 | 45.4 | 40.8 | 40.4 | 36.0 | 39.4 | 41.6 | 35.1 | 34.2 | 37.0 | 43.0 | 36.8 | 41.7 | 45.0 | 36.1 | 34.3 | 36.0 | 49.9 |
| 10:20 | 28.5 | 38.1 | 36.2 | 36.0 | 38.7 | 38.9 | 38.6 | 45.4 | 40.8 | 40.4 | 36.9 | 39.4 | 41.6 | 35.1 | 34.2 | 37.0 | 43.0 | 37.6 | 41.7 | 45.0 | 36.1 | 34.3 | 36.0 | 50.8 |
| 10:30 | 28.5 | 38.8 | 34.6 | 37.2 | 36.9 | 39.8 | 39.4 | 45.4 | 40.0 | 39.3 | 36.9 | 39.4 | 41.6 | 35.9 | 34.2 | 37.9 | 42.1 | 37.6 | 41.7 | 45.0 | 36.1 | 34.3 | 36.0 | 47.5 |
| 10:40 | 28.5 | 38.6 | 35.9 | 36.5 | 39.2 | 40.3 | 39.9 | 45.9 | 40.5 | 40.9 | 37.4 | 40.7 | 42.1 | 35.6 | 34.7 | 37.5 | 43.5 | 38.1 | 43.1 | 45.5 | 36.6 | 34.8 | 36.5 | 50.4 |
| 10:50 | 29.9 | 40.1 | 39.0 | 36.8 | 42.5 | 41.8 | 41.4 | 49.9 | 42.0 | 42.4 | 38.9 | 42.2 | 43.6 | 37.1 | 36.9 | 38.8 | 44.8 | 38.8 | 44.6 | 47.8 | 37.2 | 36.3 | 38.0 | 52.8 |
| 11:00 | 29.9 | 40.6 | 37.9 | 37.3 | 41.2 | 42.3 | 41.1 | 49.6 | 42.5 | 42.9 | 39.4 | 42.7 | 44.1 | 36.8 | 36.6 | 39.3 | 44.4 | 39.3 | 44.2 | 48.3 | 38.5 | 36.8 | 38.5 | 52.4 |
| 11:10 | 29.9 | 41.3 | 38.6 | 37.3 | 42.1 | 42.3 | 41.9 | 49.5 | 44.1 | 42.9 | 39.4 | 43.6 | 45.0 | 37.6 | 37.3 | 39.9 | 46.0 | 40.1 | 45.1 | 49.2 | 39.3 | 36.8 | 38.5 | 53.3 |
| 11:20 | 30.9 | 43.5 | 40.1 | 38.8 | 45.4 | 43.8 | 43.4 | 51.7 | 44.8 | 45.6 | 41.9 | 45.1 | 47.4 | 39.1 | 38.7 | 41.2 | 47.3 | 42.4 | 47.4 | 51.5 | 41.5 | 39.2 | 40.0 | 57.2 |
| 11:30 | 30.8 | 43.3 | 40.6 | 39.3 | 45.0 | 44.3 | 44.8 | 52.2 | 46.1 | 46.1 | 42.4 | 45.6 | 47.9 | 39.6 | 39.2 | 42.6 | 47.8 | 42.1 | 47.1 | 52.0 | 42.8 | 39.7 | 40.5 | 56.9 |
| 11:40 | 31.5 | 42.3 | 41.3 | 39.5 | 45.8 | 43.3 | 43.8 | 51.3 | 45.1 | 45.1 | 41.4 | 45.4 | 46.9 | 39.3 | 39.1 | 41.8 | 47.9 | 41.9 | 46.1 | 50.2 | 41.1 | 38.7 | 39.5 | 56.7 |
| 11:50 | 31.2 | 41.6 | 39.6 | 39.5 | 44.0 | 43.3 | 44.7 | 51.3 | 42.7 | 45.1 | 41.4 | 45.4 | 46.9 | 38.6 | 38.3 | 40.9 | 45.2 | 40.3 | 45.2 | 50.2 | 41.1 | 38.7 | 39.5 | 55.9 |
| 12:00 | 32.4 | 42.1 | 40.9 | 40.0 | 44.5 | 45.8 | 44.3 | 52.6 | 44.8 | 45.6 | 42.8 | 45.9 | 47.4 | 39.1 | 39.5 | 41.2 | 46.4 | 41.6 | 46.6 | 51.5 | 40.7 | 39.2 | 40.0 | 55.6 |
| 12:10 | 31.9 | 44.3 | 42.4 | 41.5 | 46.9 | 46.3 | 45.8 | 54.1 | 46.3 | 47.1 | 43.4 | 46.6 | 48.9 | 40.6 | 41.0 | 43.6 | 49.7 | 43.1 | 48.9 | 53.0 | 43.0 | 40.7 | 41.5 | 58.7 |
| 12:20 | 32.9 | 44.1 | 43.7 | 42.0 | 47.4 | 45.8 | 45.4 | 54.6 | 46.8 | 47.6 | 42.9 | 47.1 | 49.4 | 41.1 | 41.5 | 43.2 | 49.3 | 43.6 | 48.6 | 53.5 | 42.7 | 40.3 | 42.0 | 58.4 |
| 12:30 | 33.7 | 43.2 | 43.5 | 40.2 | 46.1 | 46.3 | 45.1 | 55.3 | 45.7 | 46.9 | 42.5 | 46.7 | 47.1 | 39.3 | 41.4 | 42.4 | 47.5 | 41.7 | 47.4 | 52.3 | 41.7 | 40.0 | 42.5 | 57.3 |
| 12:40 | 32.7 | 43.6 | 43.3 | 41.5 | 46.9 | 46.3 | 45.8 | 54.3 | 47.1 | 47.1 | 43.4 | 47.4 | 48.9 | 40.6 | 41.2 | 43.2 | 50.1 | 43.1 | 48.1 | 51.3 | 42.3 | 40.7 | 41.5 | 58.7 |
| 12:50 | 33.4 | 43.6 | 43.3 | 41.5 | 46.9 | 45.3 | 45.8 | 55.1 | 46.3 | 48.2 | 43.4 | 46.6 | 48.9 | 40.6 | 42.0 | 43.2 | 49.2 | 43.1 | 48.1 | 51.3 | 41.5 | 40.7 | 41.5 | 57.9 |
| 13:00 | 34.2 | 42.9 | 44.2 | 40.3 | 46.9 | 46.3 | 45.8 | 54.3 | 47.1 | 47.1 | 44.3 | 47.4 | 48.9 | 39.8 | 42.0 | 42.3 | 49.2 | 41.5 | 47.2 | 51.3 | 41.5 | 40.7 | 41.5 | 57.9 |
| 13:10 | 34.3 | 42.9 | 42.5 | 40.3 | 46.0 | 46.3 | 45.8 | 53.4 | 46.3 | 47.1 | 43.4 | 47.4 | 48.9 | 39.8 | 41.2 | 42.3 | 48.3 | 42.3 | 47.2 | 51.3 | 41.5 | 40.7 | 41.5 | 57.9 |
| 13:20 | 35.0 | 43.2 | 43.6 | 41.3 | 46.1 | 46.3 | 45.9 | 54.6 | 46.5 | 48.1 | 43.4 | 46.7 | 48.1 | 40.1 | 42.4 | 42.8 | 47.9 | 42.5 | 46.6 | 50.7 | 41.8 | 40.8 | 42.5 | 56.4 |
| 13:30 | 35.0 | 42.9 | 43.3 | 41.5 | 44.2 | 46.3 | 45.8 | 52.5 | 47.1 | 45.9 | 44.3 | 47.4 | 49.8 | 39.8 | 42.7 | 42.9 | 49.0 | 42.3 | 47.2 | 52.2 | 41.4 | 41.5 | 41.5 | 54.6 |
| 13:40 | 33.3 | 39.0 | 37.5 | 39.0 | 39.9 | 42.8 | 42.4 | 48.2 | 41.4 | 43.4 | 39.9 | 43.2 | 45.5 | 36.6 | 39.4 | 37.7 | 42.9 | 38.2 | 43.1 | 49.7 | 36.5 | 37.3 | 39.0 | 49.7 |
| 13:50 | 33.0 | 38.3 | 39.2 | 37.8 | 39.9 | 42.8 | 42.4 | 48.3 | 42.2 | 43.4 | 39.9 | 42.4 | 45.5 | 36.6 | 39.5 | 37.1 | 43.1 | 37.4 | 42.3 | 48.8 | 36.6 | 37.3 | 39.0 | 49.7 |
| 14:00 | 33.7 | 39.7 | 37.4 | 40.2 | 40.8 | 42.8 | 42.4 | 49.0 | 41.4 | 43.4 | 41.8 | 44.1 | 46.4 | 38.1 | 40.1 | 39.3 | 43.6 | 39.0 | 43.9 | 50.5 | 37.3 | 38.2 | 39.0 | 50.5 |
| 14:10 | 32.9 | 39.9 | 38.5 | 39.7 | 40.3 | 42.3 | 41.9 | 47.6 | 42.5 | 42.9 | 40.4 | 42.7 | 46.8 | 37.6 | 39.5 | 38.6 | 43.8 | 38.5 | 44.2 | 50.8 | 36.7 | 37.7 | 38.5 | 50.0 |
| 14:20 | 31.5 | 38.2 | 36.9 | 38.7 | 38.4 | 41.3 | 40.9 | 46.8 | 40.7 | 40.8 | 38.4 | 40.9 | 44.0 | 35.8 | 38.0 | 37.4 | 43.4 | 37.5 | 41.6 | 47.3 | 35.9 | 36.7 | 37.5 | 47.3 |
| 14:30 | 31.5 | 35.6 | 35.6 | 34.7 | 37.0 | 38.9 | 39.6 | 43.8 | 38.6 | 40.3 | 37.0 | 39.5 | 42.6 | 33.8 | 36.8 | 34.4 | 40.4 | 34.6 | 39.5 | 46.0 | 33.9 | 34.5 | 37.0 | 46.0 |
| 14:40 | 30.5 | 35.8 | 35.0 | 36.5 | 37.4 | 39.4 | 39.9 | 44.1 | 38.9 | 39.8 | 37.4 | 39.9 | 43.0 | 34.1 | 36.2 | 35.5 | 40.6 | 35.7 | 39.8 | 46.3 | 34.1 | 34.8 | 36.5 | 45.5 |
| 14:50 | 29.8 | 38.0 | 35.8 | 36.8 | 38.0 | 41.8 | 41.4 | 46.6 | 40.4 | 40.2 | 38.9 | 41.4 | 43.6 | 34.8 | 37.9 | 36.6 | 41.6 | 37.2 | 41.3 | 46.2 | 35.7 | 36.3 | 38.0 | 47.0 |
| 15:00 | 30.5 | 36.0 | 34.6 | 36.0 | 36.9 | 38.9 | 39.4 | 43.7 | 38.4 | 39.3 | 36.9 | 39.4 | 42.5 | 33.6 | 36.6 | 35.2 | 39.4 | 35.2 | 39.3 | 45.0 | 33.7 | 35.2 | 36.0 | 45.0 |
| 15:10 | 30.8 | 37.0 | 36.5 | 37.0 | 37.0 | 39.9 | 40.4 | 44.8 | 41.0 | 39.2 | 37.9 | 40.4 | 42.6 | 34.6 | 36.9 | 36.4 | 41.5 | 37.0 | 41.1 | 45.2 | 35.5 | 36.2 | 37.0 | 45.2 |
| 15:20 | 30.8 | 35.5 | 35.0 | 36.7 | 36.4 | 38.4 | 38.9 | 43.3 | 37.9 | 38.8 | 37.4 | 38.9 | 42.0 | 33.9 | 36.2 | 34.9 | 39.1 | 35.5 | 38.8 | 43.7 | 34.0 | 34.7 | 35.5 | 44.5 |
| 15:30 | 30.8 | 36.5 | 36.0 | 36.5 | 36.5 | 38.4 | 39.1 | 43.5 | 38.9 | 39.8 | 37.4 | 39.0 | 42.1 | 34.1 | 36.5 | 35.3 | 40.3 | 35.7 | 39.8 | 43.9 | 34.3 | 34.8 | 36.5 | 44.7 |
| 15:40 | 30.7 | 35.3 | 33.9 | 34.8 | 36.0 | 38.9 | 38.6 | 43.1 | 36.8 | 38.2 | 36.9 | 38.5 | 40.6 | 33.6 | 36.1 | 35.0 | 37.3 | 34.4 | 38.5 | 42.6 | 33.9 | 34.3 | 36.0 | 43.4 |
| 15:50 | 29.8 | 33.8 | 33.3 | 34.5 | 33.6 | 36.4 | 37.1 | 40.8 | 35.3 | 36.7 | 35.4 | 37.0 | 39.1 | 32.1 | 34.7 | 33.8 | 36.9 | 33.7 | 37.0 | 40.2 | 32.4 | 32.8 | 34.5 | 40.2 |
| 16:00 | 29.0 | 34.3 | 34.6 | 33.8 | 34.1 | 37.9 | 37.6 | 41.3 | 38.2 | 37.2 | 35.9 | 37.5 | 38.7 | 32.6 | 35.2 | 33.4 | 38.3 | 33.4 | 36.6 | 40.7 | 32.9 | 33.3 | 35.0 | 40.7 |
| 16:10 | 29.0 | 32.8 | 33.1 | 34.7 | 32.6 | 36.4 | 36.1 | 39.8 | 35.9 | 35.7 | 35.4 | 36.0 | 38.1 | 31.9 | 33.7 | 32.8 | 36.7 | 32.7 | 36.0 | 39.2 | 32.2 | 32.7 | 33.5 | 39.2 |
| 16:20 | 28.5 | 32.6 | 32.9 | 32.8 | 33.1 | 35.9 | 36.6 | 40.5 | 35.6 | 36.2 | 34.9 | 35.7 | 36.8 | 30.9 | 33.5 | 32.8 | 36.7 | 32.4 | 35.6 | 38.1 | 32.1 | 32.3 | 34.0 | 38.9 |
| 16:30 | 28.8 | 31.3 | 30.8 | 32.0 | 31.1 | 33.9 | 34.6 | 36.7 | 33.6 | 34.2 | 32.9 | 33.7 | 35.7 | 29.7 | 32.3 | 30.6 | 34.5 | 31.2 | 33.6 | 36.9 | 30.0 | 30.3 | 32.0 | 36.9 |
| 16:40 | 27.7 | 31.3 | 30.9 | 32.0 | 31.1 | 33.9 | 34.6 | 36.7 | 33.6 | 34.2 | 32.9 | 33.7 | 35.7 | 29.7 | 32.3 | 31.7 | 34.7 | 31.2 | 33.6 | 36.1 | 30.9 | 31.2 | 32.0 | 36.9 |
| 16:50 | 27.3 | 31.3 | 30.1 | 32.0 | 31.1 | 33.9 | 34.6 | 36.7 | 32.8 | 34.2 | 32.9 | 33.7 | 34.8 | 29.7 | 31.5 | 30.8 | 33.8 | 31.2 | 33.6 | 36.1 | 30.1 | 30.3 | 32.0 | 36.1 |
| 17:00 | 27.2 | 30.3 | 29.9 | 31.0 | 30.1 | 32.9 | 32.7 | 34.9 | 32.6 | 33.2 | 31.9 | 32.7 | 33.8 | 29.4 | 31.3 | 30.7 | 33.7 | 30.2 | 32.6 | 35.1 | 29.9 | 30.2 | 31.0 | 34.3 |
| 17:10 | 26.7 | 29.8 | 28.6 | 31.7 | 28.7 | 32.4 | 32.2 | 33.5 | 31.3 | 31.6 | 31.4 | 32.2 | 33.3 | 28.9 | 30.0 | 30.2 | 32.3 | 30.5 | 32.1 | 34.6 | 29.4 | 29.7 | 30.5 | 33.0 |
| 17:20 | 26.6 | 29.3 | 29.8 | 30.0 | 29.1 | 31.9 | 31.7 | 34.1 | 30.8 | 32.2 | 30.9 | 30.8 | 31.9 | 27.7 | 30.5 | 29.3 | 31.3 | 29.2 | 30.8 | 32.5 | 28.2 | 28.3 | 30.0 | 33.3 |
| 17:30 | 26.8 | 29.3 | 28.9 | 31.2 | 29.1 | 31.0 | 31.7 | 32.2 | 30.8 | 31.1 | 30.9 | 30.8 | 32.8 | 28.4 | 29.6 | 29.1 | 32.0 | 30.0 | 31.6 | 33.3 | 28.9 | 29.2 | 30.0 | 32.5 |
| 17:40 | 26.3 | 28.8 | 28.5 | 30.7 | 28.6 | 31.4 | 31.2 | 32.7 | 30.3 | 30.6 | 30.4 | 30.3 | 32.3 | 27.9 | 30.0 | 28.8 | 30.8 | 29.5 | 30.3 | 32.0 | 28.5 | 28.7 | 29.5 | 32.0 |
| 17:50 | 26.4 | 28.3 | 28.8 | 30.2 | 28.1 | 30.0 | 30.7 | 31.3 | 29.8 | 30.1 | 29.9 | 29.8 | 30.9 | 27.4 | 28.7 | 28.3 | 30.3 | 29.0 | 29.8 | 31.5 | 28.0 | 28.2 | 29.0 | 30.6 |
| 18:00 | 26.0 | 27.8 | 27.5 | 29.7 | 26.7 | 29.5 | 30.2 | 30.1 | 29.3 | 28.5 | 29.4 | 29.3 | 30.4 | 27.0 | 28.3 | 28.0 | 29.9 | 28.5 | 29.3 | 30.1 | 27.6 | 27.7 | 28.5 | 29.3 |
| 18:10 | 25.8 | 27.0 | 26.9 | 28.2 | 26.1 | 28.9 | 28.7 | 29.4 | 27.8 | 28.1 | 28.9 | 27.8 | 28.9 | 26.2 | 27.6 | 26.5 | 28.4 | 27.8 | 27.8 | 28.6 | 26.9 | 27.0 | 27.0 | 27.8 |
| 18:20 | 25.5 | 25.8 | 25.6 | 27.7 | 25.6 | 27.5 | 27.4 | 28.1 | 26.5 | 26.5 | 27.4 | 26.5 | 27.4 | 25.7 | 26.4 | 26.3 | 27.2 | 26.5 | 26.5 | 27.3 | 25.6 | 25.7 | 26.5 | 26.5 |
| 18:30 | 25.4 | 25.3 | 26.0 | 27.2 | 25.1 | 27.0 | 27.7 | 27.7 | 26.0 | 27.1 | 26.9 | 25.2 | 26.9 | 25.2 | 26.0 | 25.1 | 26.9 | 26.0 | 26.0 | 26.0 | 25.2 | 25.2 | 26.0 | 26.0 |
| 18:40 | 25.3 | 24.8 | 25.4 | 26.7 | 25.5 | 26.5 | 27.2 | 27.1 | 26.3 | 26.6 | 26.4 | 25.5 | 26.4 | 24.7 | 26.2 | 25.3 | 26.2 | 26.3 | 25.5 | 26.3 | 25.4 | 25.5 | 25.5 | 26.3 |
| 18:50 | 25.5 | 24.8 | 25.5 | 26.7 | 24.6 | 26.5 | 27.2 | 26.4 | 25.5 | 26.6 | 26.4 | 25.5 | 25.5 | 24.7 | 25.5 | 24.6 | 25.5 | 25.5 | 24.7 | 25.5 | 24.7 | 24.7 | 25.5 | 25.5 |
| 19:00 | 25.7 | 23.8 | 25.3 | 25.7 | 24.5 | 25.5 | 26.2 | 25.4 | 25.2 | 25.6 | 25.4 | 25.3 | 25.4 | 23.7 | 25.3 | 24.5 | 25.4 | 24.5 | 23.7 | 24.5 | 24.5 | 24.5 | 24.5 | 24.5 |
| 19:10 | 25.0 | 23.3 | 24.8 | 25.2 | 24.0 | 25.0 | 25.7 | 24.9 | 24.0 | 25.1 | 24.9 | 24.0 | 24.9 | 23.3 | 24.9 | 24.2 | 25.1 | 24.0 | 23.2 | 23.2 | 24.1 | 24.0 | 24.0 | 23.2 |
| 19:20 | 24.9 | 22.8 | 24.3 | 24.7 | 23.5 | 24.5 | 25.2 | 24.4 | 23.4 | 24.6 | 25.4 | 24.3 | 24.4 | 23.5 | 24.3 | 23.5 | 24.4 | 24.3 | 22.7 | 23.5 | 23.5 | 23.5 | 23.5 | 22.7 |
| 19:30 | 24.7 | 22.8 | 23.5 | 24.7 | 22.6 | 23.5 | 24.4 | 23.6 | 23.4 | 24.6 | 24.4 | 23.5 | 23.5 | 22.8 | 23.6 | 22.8 | 23.7 | 23.5 | 22.7 | 22.7 | 23.6 | 22.7 | 23.5 | 22.7 |
| 19:40 | 24.9 | 22.8 | 24.3 | 24.7 | 23.5 | 24.5 | 25.2 | 24.4 | 23.4 | 24.6 | 24.4 | 23.5 | 24.4 | 22.8 | 24.4 | 22.8 | 24.6 | 23.5 | 22.7 | 22.7 | 23.6 | 23.5 | 23.5 | 22.7 |
| 19:50 | 24.7 | 22.8 | 24.3 | 24.7 | 23.5 | 23.5 | 24.4 | 23.6 | 23.4 | 24.6 | 24.4 | 23.5 | 23.5 | 22.8 | 23.6 | 22.8 | 23.7 | 24.3 | 22.7 | 22.7 | 23.6 | 23.5 | 23.5 | 22.7 |
| 20:00 | 24.6 | 23.5 | 24.3 | 24.7 | 23.5 | 24.5 | 25.2 | 23.5 | 23.4 | 24.6 | 24.4 | 23.5 | 24.4 | 23.5 | 24.3 | 23.5 | 24.4 | 24.3 | 23.5 | 23.5 | 23.5 | 23.5 | 23.5 | 22.7 |
| 20:10 | 24.4 | 22.8 | 24.3 | 24.7 | 23.5 | 23.5 | 24.4 | 23.6 | 23.4 | 24.6 | 24.4 | 23.5 | 23.5 | 23.5 | 23.6 | 22.8 | 24.6 | 23.5 | 22.7 | 22.7 | 23.6 | 23.5 | 23.5 | 22.7 |
| 20:20 | 24.3 | 22.3 | 23.8 | 24.2 | 23.0 | 24.0 | 24.7 | 23.9 | 22.9 | 24.1 | 23.9 | 23.0 | 23.0 | 23.0 | 23.9 | 22.3 | 24.0 | 23.8 | 22.2 | 22.2 | 23.1 | 23.0 | 23.0 | 22.2 |
| 20:30 | 24.4 | 22.3 | 23.0 | 24.2 | 22.1 | 23.0 | 23.9 | 23.1 | 22.9 | 24.1 | 23.9 | 23.0 | 23.0 | 23.0 | 23.1 | 22.3 | 23.1 | 23.8 | 22.2 | 22.2 | 23.1 | 23.0 | 23.0 | 22.2 |
| 20:40 | 24.5 | 22.3 | 23.0 | 23.0 | 22.1 | 23.0 | 23.9 | 23.1 | 22.2 | 24.1 | 23.0 | 22.2 | 23.0 | 22.3 | 23.1 | 22.3 | 23.1 | 23.0 | 22.2 | 22.2 | 22.3 | 22.2 | 23.0 | 22.2 |
| 20:50 | 24.0 | 23.0 | 23.0 | 24.2 | 22.1 | 23.0 | 23.9 | 23.0 | 22.9 | 24.1 | 23.9 | 23.0 | 23.0 | 23.0 | 23.0 | 22.1 | 23.9 | 23.8 | 22.2 | 23.0 | 23.0 | 23.0 | 23.0 | 22.2 |
| 21:00 | 24.1 | 22.5 | 23.3 | 24.8 | 22.5 | 23.5 | 24.2 | 23.4 | 23.2 | 23.6 | 23.4 | 23.3 | 23.4 | 23.3 | 23.3 | 22.5 | 23.3 | 24.1 | 22.5 | 22.5 | 23.3 | 23.3 | 22.5 | 21.7 |
| 21:10 | 23.8 | 22.5 | 23.3 | 23.7 | 22.5 | 23.5 | 24.2 | 22.5 | 22.4 | 23.6 | 23.4 | 22.5 | 23.4 | 22.5 | 23.3 | 22.5 | 23.3 | 23.3 | 22.5 | 22.5 | 22.5 | 22.5 | 22.5 | 21.7 |
| 21:20 | 23.7 | 22.3 | 23.0 | 23.0 | 22.1 | 23.0 | 23.9 | 23.1 | 22.9 | 23.0 | 23.0 | 23.0 | 23.0 | 23.0 | 23.1 | 22.3 | 24.0 | 23.8 | 22.2 | 22.2 | 23.1 | 23.0 | 23.0 | 21.4 |
| 21:30 | 23.5 | 22.3 | 23.0 | 23.0 | 22.1 | 23.0 | 23.9 | 23.0 | 22.9 | 23.0 | 23.9 | 23.0 | 23.0 | 22.2 | 23.0 | 22.1 | 23.0 | 23.8 | 22.2 | 23.0 | 23.0 | 23.0 | 23.0 | 22.2 |
| 21/01/2019, summer | TiB,LE has been corrected for View Factor over turf grass | |||||||||||||||||||||||
| TiB,LE (°C) | VF of LE | 0.92 | 0.92 | 0.92 | 0.92 | 0.92 | 0.92 | 0.92 | 0.92 | 0.92 | 0.92 | 0.92 | 0.92 | 1.00 | 0.92 | 0.92 | 0.92 | |||||||
| Time | Murdoch Tambient | A | C | D | E | G | H | J | K | L | M | T | U | V | W | X | Y | |||||||
| 5:00 | 19.3 | 17.5 | 18.6 | 17.0 | 18.0 | 18.0 | 17.4 | 18.6 | 18.0 | 18.0 | 17.5 | 17.5 | 17.5 | 17.5 | 17.0 | 1:02 | 18.6 | |||||||
| 5:10 | 19.2 | 17.5 | 18.5 | 17.5 | 18.5 | 18.5 | 17.9 | 18.5 | 18.5 | 18.5 | 17.5 | 17.5 | 17.5 | 18.0 | 16.9 | 0:00 | 18.5 | |||||||
| 5:20 | 19.3 | 18.0 | 19.1 | 18.0 | 18.5 | 18.5 | 17.9 | 19.1 | 18.5 | 18.5 | 17.5 | 17.5 | 18.0 | 18.0 | 17.5 | 2:05 | 19.6 | |||||||
| 5:30 | 19.1 | 17.5 | 18.6 | 17.5 | 18.0 | 18.0 | 18.0 | 18.6 | 18.0 | 18.0 | 17.0 | 17.5 | 18.6 | 17.5 | 17.0 | 14:05 | 18.6 | |||||||
| 5:40 | 19.1 | 18.0 | 19.1 | 17.5 | 18.5 | 19.1 | 17.9 | 19.1 | 18.5 | 18.5 | 17.5 | 18.0 | 18.5 | 18.0 | 17.5 | 13:02 | 19.1 | |||||||
| 5:50 | 19.0 | 18.0 | 19.0 | 18.0 | 18.5 | 18.5 | 17.9 | 18.5 | 18.5 | 18.5 | 17.4 | 18.0 | 18.5 | 18.5 | 17.4 | 12:00 | 19.0 | |||||||
| 6:00 | 18.8 | 18.5 | 19.0 | 18.5 | 19.0 | 19.0 | 18.4 | 19.0 | 19.0 | 19.0 | 18.0 | 18.0 | 18.5 | 18.5 | 18.0 | 1:02 | 19.6 | |||||||
| 6:10 | 19.2 | 19.0 | 19.5 | 19.0 | 19.5 | 19.5 | 18.9 | 19.5 | 19.0 | 19.5 | 18.5 | 19.0 | 19.0 | 19.0 | 18.5 | 13:02 | 19.5 | |||||||
| 6:20 | 19.6 | 19.0 | 20.0 | 19.0 | 19.5 | 20.0 | 19.4 | 19.5 | 19.5 | 20.0 | 19.0 | 19.0 | 19.0 | 19.5 | 19.0 | 1:02 | 20.0 | |||||||
| 6:30 | 20.1 | 19.4 | 19.9 | 19.9 | 20.5 | 20.5 | 19.3 | 20.5 | 19.9 | 19.9 | 18.8 | 19.4 | 19.4 | 21.0 | 20.5 | 0:00 | 21.5 | |||||||
| 6:40 | 20.7 | 20.4 | 20.9 | 20.9 | 22.5 | 22.0 | 20.9 | 22.0 | 21.5 | 22.0 | 20.4 | 20.9 | 20.9 | 22.0 | 22.0 | 13:02 | 23.1 | |||||||
| 6:50 | 21.1 | 20.9 | 22.5 | 21.4 | 24.1 | 24.1 | 21.9 | 23.0 | 23.6 | 23.6 | 20.9 | 21.4 | 21.4 | 22.5 | 22.5 | 3:07 | 24.1 | |||||||
| 7:00 | 21.4 | 23.5 | 24.0 | 21.9 | 25.1 | 25.7 | 22.4 | 24.0 | 25.1 | 25.1 | 22.4 | 22.4 | 22.4 | 23.5 | 24.0 | 14:05 | 24.6 | |||||||
| 7:10 | 22.1 | 24.0 | 25.0 | 22.3 | 25.6 | 26.1 | 23.9 | 24.5 | 25.6 | 25.6 | 24.0 | 23.4 | 23.4 | 24.5 | 26.1 | 12:00 | 25.0 | |||||||
| 7:20 | 22.7 | 25.5 | 26.0 | 22.8 | 26.6 | 27.7 | 25.5 | 25.0 | 26.6 | 27.1 | 25.0 | 25.0 | 24.4 | 25.5 | 27.7 | 22:57 | 26.0 | |||||||
| 7:30 | 23.1 | 27.5 | 27.0 | 25.9 | 28.6 | 29.7 | 28.1 | 25.9 | 28.1 | 28.6 | 26.5 | 26.5 | 25.4 | 27.0 | 30.8 | 10:57 | 27.5 | |||||||
| 7:40 | 23.7 | 29.0 | 28.5 | 30.1 | 30.1 | 31.7 | 30.6 | 27.9 | 29.5 | 30.6 | 28.5 | 29.0 | 26.8 | 29.0 | 33.9 | 21:54 | 29.0 | |||||||
| 7:50 | 23.9 | 29.0 | 28.4 | 30.6 | 29.5 | 31.7 | 30.1 | 27.3 | 29.5 | 30.6 | 28.4 | 29.0 | 26.8 | 29.5 | 34.4 | 20:52 | 28.4 | |||||||
| 8:00 | 24.3 | 31.0 | 29.4 | 33.2 | 31.5 | 33.7 | 33.2 | 28.8 | 31.5 | 32.1 | 29.9 | 31.5 | 28.3 | 31.0 | 36.4 | 21:54 | 30.5 | |||||||
| 8:10 | 23.7 | 31.5 | 30.4 | 33.7 | 32.0 | 34.8 | 33.7 | 29.3 | 32.0 | 33.1 | 30.4 | 32.0 | 28.2 | 31.5 | 38.0 | 20:52 | 30.4 | |||||||
| 8:20 | 24.9 | 32.5 | 30.9 | 35.2 | 33.6 | 36.3 | 35.3 | 30.3 | 33.0 | 34.1 | 31.4 | 33.6 | 29.8 | 32.5 | 40.1 | 7:49 | 31.4 | |||||||
| 8:30 | 25.2 | 33.5 | 31.9 | 36.3 | 34.1 | 37.3 | 35.8 | 30.8 | 34.1 | 35.2 | 32.5 | 34.6 | 30.3 | 33.0 | 41.2 | 19:49 | 31.4 | |||||||
| 8:40 | 25.6 | 34.0 | 32.4 | 37.3 | 34.6 | 37.8 | 37.4 | 31.9 | 34.6 | 35.7 | 32.4 | 35.1 | 30.2 | 33.5 | 41.7 | 7:49 | 31.9 | |||||||
| 8:50 | 26.1 | 35.0 | 33.4 | 38.3 | 36.1 | 38.8 | 37.2 | 32.3 | 35.5 | 36.6 | 33.4 | 36.1 | 31.2 | 35.0 | 43.7 | 17:44 | 32.8 | |||||||
| 9:00 | 26.1 | 34.5 | 33.4 | 38.3 | 36.6 | 39.9 | 37.8 | 33.4 | 35.5 | 36.6 | 33.9 | 36.6 | 31.2 | 35.0 | 44.8 | 6:46 | 32.8 | |||||||
| 9:10 | 25.9 | 37.1 | 34.4 | 39.8 | 37.7 | 41.5 | 40.5 | 33.9 | 37.1 | 38.2 | 35.5 | 38.2 | 32.2 | 35.5 | 46.9 | 7:49 | 33.9 | |||||||
| 9:20 | 27.2 | 38.1 | 35.4 | 40.8 | 38.7 | 42.5 | 41.5 | 34.3 | 38.1 | 39.8 | 36.0 | 39.8 | 32.7 | 36.5 | 48.5 | 18:46 | 33.8 | |||||||
| 9:30 | 26.8 | 35.0 | 33.4 | 37.7 | 36.6 | 39.9 | 37.8 | 33.4 | 35.5 | 36.6 | 33.9 | 36.6 | 31.2 | 35.0 | 44.8 | 6:46 | 32.8 | |||||||
| 9:40 | 27.1 | 36.0 | 34.3 | 38.7 | 37.6 | 40.8 | 38.2 | 33.8 | 37.0 | 37.6 | 34.3 | 37.6 | 31.6 | 36.5 | 46.3 | 16:41 | 33.2 | |||||||
| 9:50 | 26.8 | 33.9 | 33.4 | 38.3 | 36.6 | 39.9 | 38.3 | 33.4 | 36.1 | 36.6 | 33.4 | 36.1 | 31.2 | 35.0 | 45.3 | 6:46 | 32.8 | |||||||
| 10:00 | 26.5 | 35.0 | 33.9 | 38.2 | 37.7 | 40.9 | 38.3 | 34.4 | 36.6 | 37.7 | 33.9 | 37.1 | 31.7 | 35.5 | 46.4 | 18:46 | 32.8 | |||||||
| 10:10 | 26.5 | 35.0 | 33.3 | 37.7 | 37.1 | 40.4 | 38.3 | 34.4 | 36.6 | 37.1 | 33.3 | 36.6 | 30.6 | 35.5 | 46.4 | 18:46 | 32.2 | |||||||
| 10:20 | 26.9 | 35.0 | 33.3 | 38.2 | 37.7 | 40.9 | 37.7 | 35.0 | 36.6 | 37.7 | 33.9 | 37.1 | 30.6 | 35.5 | 46.9 | 18:46 | 32.8 | |||||||
| 10:30 | 27.0 | 37.0 | 34.8 | 39.7 | 39.2 | 43.0 | 40.3 | 35.9 | 38.6 | 39.2 | 34.8 | 39.2 | 32.1 | 37.0 | 49.0 | 17:44 | 33.7 | |||||||
| 10:40 | 27.5 | 37.0 | 35.4 | 40.3 | 39.2 | 43.0 | 40.4 | 36.0 | 38.7 | 39.8 | 35.4 | 39.2 | 32.7 | 36.5 | 49.0 | 18:46 | 33.8 | |||||||
| 10:50 | 27.0 | 38.1 | 35.9 | 40.3 | 39.2 | 43.5 | 40.3 | 35.9 | 39.2 | 40.8 | 35.9 | 39.7 | 32.1 | 37.0 | 49.0 | 17:44 | 33.7 | |||||||
| 11:00 | 27.4 | 38.2 | 36.0 | 39.3 | 38.8 | 43.7 | 39.4 | 35.5 | 39.3 | 40.4 | 35.5 | 39.8 | 32.2 | 35.5 | 49.1 | 7:49 | 33.3 | |||||||
| 11:10 | 26.7 | 36.1 | 34.5 | 38.3 | 37.8 | 41.6 | 38.9 | 35.0 | 37.8 | 38.8 | 34.0 | 37.8 | 31.2 | 34.5 | 47.5 | 7:49 | 32.3 | |||||||
| 11:20 | 26.4 | 35.5 | 33.9 | 38.2 | 38.2 | 41.5 | 38.8 | 35.5 | 37.1 | 38.2 | 33.9 | 37.1 | 30.6 | 35.5 | 48.0 | 18:46 | 32.8 | |||||||
| 11:30 | 26.0 | 35.5 | 33.9 | 36.6 | 37.7 | 41.0 | 37.8 | 35.0 | 37.2 | 38.3 | 33.4 | 36.1 | 30.7 | 35.0 | 46.4 | 6:46 | 31.7 | |||||||
| 11:40 | 26.1 | 38.1 | 36.0 | 40.3 | 39.8 | 44.1 | 40.4 | 37.0 | 39.8 | 40.8 | 35.4 | 39.8 | 32.2 | 36.5 | 50.1 | 18:46 | 33.8 | |||||||
| 11:50 | 26.9 | 37.6 | 34.9 | 39.3 | 39.3 | 43.1 | 39.9 | 36.0 | 38.7 | 40.3 | 34.9 | 38.7 | 31.7 | 36.0 | 49.0 | 6:46 | 33.3 | |||||||
| 12:00 | 25.9 | 36.0 | 34.4 | 38.7 | 38.7 | 42.5 | 39.3 | 36.0 | 38.2 | 39.3 | 34.4 | 37.6 | 31.1 | 36.0 | 48.0 | 6:46 | 32.7 | |||||||
| 12:10 | 26.3 | 36.6 | 35.5 | 38.8 | 38.8 | 42.6 | 39.4 | 35.0 | 38.8 | 39.8 | 35.0 | 38.2 | 30.6 | 35.5 | 48.0 | 18:46 | 32.8 | |||||||
| 12:20 | 26.7 | 38.8 | 36.0 | 39.8 | 39.8 | 44.7 | 41.5 | 36.6 | 40.4 | 41.5 | 36.0 | 40.4 | 32.2 | 35.5 | 50.2 | 7:49 | 33.3 | |||||||
| 12:30 | 25.4 | 36.6 | 34.4 | 38.2 | 38.8 | 42.6 | 38.3 | 35.5 | 38.2 | 39.8 | 34.4 | 37.7 | 30.6 | 35.5 | 48.5 | 18:46 | 32.2 | |||||||
| 12:40 | 26.1 | 35.6 | 34.0 | 37.2 | 37.8 | 41.6 | 37.8 | 35.0 | 37.2 | 38.3 | 33.4 | 36.7 | 30.7 | 34.5 | 47.5 | 7:49 | 31.8 | |||||||
| 12:50 | 26.2 | 35.5 | 33.9 | 36.6 | 37.7 | 41.0 | 37.2 | 35.0 | 37.2 | 38.3 | 33.4 | 36.6 | 30.1 | 35.0 | 46.4 | 17:44 | 31.7 | |||||||
| 13:00 | 25.9 | 36.1 | 34.5 | 37.2 | 38.3 | 42.1 | 37.8 | 35.0 | 38.3 | 39.9 | 34.5 | 37.2 | 30.7 | 35.0 | 47.5 | 6:46 | 32.3 | |||||||
| 13:10 | 26.9 | 34.9 | 33.8 | 36.5 | 38.7 | 40.9 | 37.7 | 35.5 | 37.1 | 38.2 | 33.3 | 36.5 | 30.6 | 36.0 | 45.8 | 4:41 | 32.2 | |||||||
| 13:20 | 26.3 | 35.1 | 33.5 | 36.2 | 37.8 | 41.1 | 38.4 | 35.1 | 37.3 | 38.4 | 33.0 | 36.8 | 30.2 | 33.5 | 46.0 | 20:52 | 31.3 | |||||||
| 13:30 | 25.7 | 38.6 | 35.9 | 39.7 | 40.8 | 44.1 | 39.8 | 37.0 | 39.7 | 41.3 | 35.4 | 39.7 | 31.6 | 37.0 | 49.5 | 4:41 | 33.7 | |||||||
| 13:40 | 27.8 | 39.8 | 37.0 | 39.8 | 40.8 | 44.1 | 39.8 | 37.6 | 40.8 | 41.9 | 36.0 | 40.8 | 32.2 | 36.5 | 50.1 | 5:44 | 33.2 | |||||||
| 13:50 | 27.4 | 40.2 | 37.5 | 39.7 | 41.3 | 45.1 | 40.8 | 38.0 | 41.8 | 44.0 | 37.0 | 41.8 | 32.6 | 37.5 | 49.5 | 16:41 | 33.7 | |||||||
| 14:00 | 26.8 | 38.2 | 36.0 | 38.7 | 39.8 | 43.1 | 39.9 | 37.1 | 39.3 | 40.9 | 35.5 | 39.3 | 32.2 | 36.0 | 48.0 | 17:44 | 33.3 | |||||||
| 14:10 | 26.8 | 38.6 | 37.0 | 39.7 | 41.3 | 44.1 | 41.4 | 38.1 | 40.8 | 42.4 | 35.9 | 40.8 | 31.6 | 37.0 | 49.0 | 17:44 | 33.7 | |||||||
| 14:20 | 26.9 | 38.2 | 36.5 | 39.3 | 39.8 | 44.2 | 40.4 | 37.1 | 39.8 | 41.4 | 35.5 | 39.3 | 31.7 | 36.0 | 48.0 | 6:46 | 33.8 | |||||||
| 14:30 | 26.9 | 39.8 | 37.6 | 39.8 | 40.8 | 44.1 | 40.9 | 37.6 | 40.3 | 42.5 | 36.0 | 39.8 | 32.2 | 36.5 | 48.5 | 18:46 | 33.8 | |||||||
| 14:40 | 27.3 | 36.0 | 35.0 | 37.7 | 38.8 | 42.0 | 38.8 | 36.0 | 38.2 | 39.3 | 34.4 | 37.7 | 31.2 | 35.5 | 46.4 | 18:46 | 32.8 | |||||||
| 14:50 | 27.3 | 36.0 | 35.0 | 37.1 | 38.8 | 41.5 | 37.7 | 36.0 | 38.2 | 39.3 | 33.9 | 37.1 | 30.6 | 35.5 | 45.8 | 5:44 | 32.8 | |||||||
| 15:00 | 27.5 | 39.3 | 37.1 | 38.7 | 40.3 | 43.6 | 39.9 | 37.6 | 40.3 | 42.0 | 36.0 | 39.8 | 32.2 | 36.0 | 47.4 | 6:46 | 33.8 | |||||||
| 15:10 | 26.5 | 38.6 | 37.0 | 38.6 | 40.8 | 43.0 | 39.8 | 37.5 | 40.3 | 41.9 | 35.9 | 40.3 | 32.1 | 37.0 | 46.8 | 4:41 | 33.7 | |||||||
| 15:20 | 26.6 | 38.3 | 36.1 | 36.1 | 39.3 | 42.1 | 38.3 | 36.1 | 39.3 | 41.0 | 35.0 | 38.8 | 31.7 | 35.0 | 45.3 | 6:46 | 32.8 | |||||||
| 15:30 | 26.2 | 38.3 | 36.2 | 35.6 | 38.9 | 41.1 | 36.2 | 35.6 | 38.9 | 40.5 | 34.5 | 37.8 | 31.3 | 34.0 | 43.8 | 6:46 | 31.8 | |||||||
| 15:40 | 26.0 | 35.6 | 34.5 | 35.0 | 37.8 | 39.9 | 36.2 | 35.0 | 37.8 | 38.8 | 33.4 | 36.7 | 30.7 | 34.5 | 42.7 | 5:44 | 31.8 | |||||||
| 15:50 | 26.5 | 36.2 | 34.6 | 34.0 | 37.3 | 40.0 | 36.3 | 34.6 | 37.8 | 39.5 | 33.5 | 37.3 | 30.8 | 33.5 | 42.2 | 18:46 | 31.3 | |||||||
| 16:00 | 25.9 | 34.5 | 34.0 | 36.1 | 38.3 | 39.9 | 36.7 | 35.6 | 37.2 | 38.3 | 32.3 | 36.7 | 30.7 | 34.5 | 42.7 | 18:46 | 32.3 | |||||||
| 16:10 | 26.0 | 34.6 | 33.5 | 34.6 | 37.3 | 38.9 | 35.7 | 34.6 | 36.8 | 37.8 | 32.4 | 35.7 | 30.2 | 33.5 | 41.1 | 18:46 | 31.3 | |||||||
| 16:20 | 26.2 | 33.0 | 32.5 | 33.0 | 35.8 | 37.4 | 34.2 | 33.0 | 34.7 | 35.8 | 30.9 | 34.1 | 29.2 | 32.5 | 39.6 | 18:46 | 30.3 | |||||||
| 16:30 | 25.8 | 33.0 | 32.5 | 33.0 | 35.8 | 37.4 | 34.7 | 33.6 | 35.2 | 36.3 | 30.9 | 34.1 | 29.2 | 32.5 | 39.0 | 18:46 | 30.3 | |||||||
| 16:40 | 25.1 | 32.1 | 31.6 | 31.6 | 34.3 | 35.9 | 33.8 | 32.7 | 33.8 | 34.3 | 30.0 | 32.7 | 28.9 | 30.5 | 37.0 | 20:52 | 29.4 | |||||||
| 16:50 | 25.1 | 30.5 | 30.0 | 30.0 | 33.2 | 33.8 | 31.6 | 31.6 | 32.1 | 32.7 | 28.3 | 31.0 | 27.2 | 30.5 | 35.4 | 7:49 | 28.9 | |||||||
| 17:00 | 24.6 | 31.6 | 31.0 | 30.0 | 33.2 | 34.3 | 31.6 | 31.0 | 32.7 | 33.8 | 29.4 | 31.6 | 27.8 | 30.5 | 35.4 | 7:49 | 28.9 | |||||||
| 17:10 | 24.6 | 31.0 | 31.0 | 30.5 | 33.2 | 34.3 | 32.2 | 32.1 | 32.7 | 33.2 | 29.4 | 31.6 | 28.3 | 30.5 | 35.4 | 20:52 | 29.4 | |||||||
| 17:20 | 25.4 | 30.5 | 30.5 | 29.4 | 32.7 | 33.8 | 31.1 | 31.0 | 32.7 | 33.2 | 28.9 | 31.0 | 27.8 | 30.5 | 34.3 | 7:49 | 28.9 | |||||||
| 17:30 | 24.7 | 30.6 | 30.6 | 29.5 | 32.2 | 33.3 | 30.6 | 31.1 | 32.2 | 32.8 | 28.4 | 30.6 | 27.3 | 29.5 | 33.3 | 20:52 | 28.4 | |||||||
| 17:40 | 24.4 | 29.0 | 29.6 | 28.5 | 31.2 | 32.3 | 29.6 | 29.6 | 31.2 | 31.8 | 28.0 | 29.6 | 26.9 | 28.5 | 31.8 | 20:52 | 28.0 | |||||||
| 17:50 | 24.5 | 28.6 | 29.1 | 27.5 | 30.2 | 30.8 | 28.6 | 29.1 | 30.2 | 30.8 | 27.0 | 28.6 | 26.4 | 27.5 | 30.2 | 9:54 | 27.0 | |||||||
| 18:00 | 24.4 | 28.0 | 28.6 | 27.0 | 29.7 | 30.2 | 28.0 | 28.6 | 29.7 | 30.2 | 26.4 | 28.0 | 25.9 | 27.5 | 29.1 | 9:54 | 27.0 | |||||||
| 18:10 | 23.9 | 27.5 | 28.1 | 26.5 | 29.2 | 29.7 | 28.1 | 28.1 | 29.2 | 29.7 | 25.9 | 27.5 | 25.9 | 27.0 | 28.1 | 21:54 | 26.5 | |||||||
| 18:20 | 24.0 | 27.1 | 27.7 | 25.5 | 28.2 | 28.8 | 26.6 | 27.1 | 28.2 | 28.8 | 25.5 | 26.6 | 25.0 | 25.5 | 26.6 | 22:57 | 26.0 | |||||||
| 18:30 | 23.7 | 26.0 | 27.1 | 25.0 | 27.7 | 27.7 | 26.0 | 27.7 | 27.7 | 28.2 | 25.0 | 26.0 | 24.4 | 25.5 | 25.5 | 22:57 | 25.5 | |||||||
| 18:40 | 23.3 | 25.6 | 26.7 | 24.0 | 27.2 | 27.2 | 25.6 | 26.7 | 27.2 | 27.2 | 24.5 | 25.6 | 24.5 | 24.5 | 25.0 | 12:00 | 25.0 | |||||||
| 18:50 | 23.0 | 24.5 | 26.2 | 22.9 | 25.6 | 25.6 | 24.5 | 25.6 | 25.6 | 26.2 | 23.5 | 24.5 | 23.5 | 24.0 | 24.0 | 10:57 | 24.0 | |||||||
| 19:00 | 22.9 | 23.6 | 24.7 | 22.0 | 24.1 | 24.1 | 23.0 | 24.7 | 24.7 | 24.7 | 22.5 | 23.0 | 22.5 | 22.5 | 22.5 | 12:00 | 23.0 | |||||||
| 19:10 | 22.3 | 22.5 | 24.2 | 20.9 | 23.6 | 23.1 | 22.0 | 24.2 | 23.6 | 23.6 | 21.5 | 22.0 | 21.5 | 22.0 | 20.9 | 0:00 | 22.5 | |||||||
| 19:20 | 22.1 | 22.0 | 23.7 | 21.0 | 23.1 | 22.6 | 21.4 | 24.2 | 23.1 | 23.1 | 21.5 | 21.5 | 21.5 | 21.5 | 21.0 | 12:00 | 22.0 | |||||||
| 19:30 | 21.8 | 21.5 | 23.2 | 20.5 | 22.6 | 22.1 | 21.5 | 23.7 | 22.6 | 23.2 | 21.0 | 21.0 | 21.0 | 21.0 | 20.5 | 13:02 | 22.1 | |||||||
| 19:40 | 21.7 | 21.5 | 23.2 | 20.5 | 22.6 | 21.5 | 20.9 | 23.2 | 22.1 | 22.6 | 20.5 | 20.5 | 20.5 | 21.0 | 19.9 | 0:00 | 21.5 | |||||||
| 19:50 | 21.6 | 21.0 | 22.7 | 20.0 | 22.7 | 21.6 | 20.4 | 23.2 | 22.1 | 22.7 | 20.5 | 20.5 | 20.5 | 20.5 | 19.4 | 1:02 | 21.6 | |||||||
| 20:00 | 21.7 | 21.0 | 22.7 | 20.0 | 22.1 | 21.6 | 20.4 | 23.2 | 22.1 | 22.1 | 20.5 | 20.5 | 20.5 | 20.5 | 20.0 | 1:02 | 21.6 | |||||||
| 20:10 | 21.4 | 21.0 | 22.7 | 20.0 | 22.1 | 21.0 | 20.4 | 22.7 | 21.6 | 22.1 | 20.5 | 20.5 | 20.5 | 20.5 | 20.0 | 1:02 | 21.6 | |||||||
| 20:20 | 21.3 | 21.0 | 22.1 | 20.0 | 22.1 | 21.0 | 20.4 | 22.7 | 21.6 | 22.1 | 20.5 | 20.0 | 20.0 | 20.5 | 19.4 | 1:02 | 21.6 | |||||||
| 20:30 | 21.4 | 21.0 | 22.1 | 20.0 | 21.6 | 21.0 | 20.4 | 22.7 | 21.6 | 21.6 | 20.5 | 20.0 | 20.0 | 20.5 | 19.4 | 1:02 | 21.0 | |||||||
| 20:40 | 21.2 | 20.5 | 22.1 | 20.0 | 21.6 | 21.0 | 20.4 | 22.7 | 21.6 | 21.6 | 20.0 | 20.0 | 20.0 | 20.5 | 19.4 | 1:02 | 21.0 | |||||||
| 20:50 | 21.2 | 20.5 | 22.1 | 20.0 | 21.6 | 21.0 | 20.4 | 22.1 | 21.6 | 21.6 | 20.0 | 20.0 | 20.0 | 20.5 | 19.4 | 1:02 | 21.0 | |||||||
| 21:00 | 21.8 | 20.5 | 22.1 | 20.0 | 21.6 | 21.0 | 20.4 | 22.1 | 21.0 | 21.6 | 20.0 | 20.0 | 20.0 | 20.5 | 19.4 | 1:02 | 21.0 | |||||||
Appendix B
| Landscape Elements | Autumn 2017Average 09:30 ‒ 15:00, SE 34 data points | Winter 2017Average 09:20 ‒ 15:00, SE 35 data points | Spring 2017Average 09:00 ‒ 15:00, SE 37 data points | Summer 2018Average 09:00 ‒ 15:40, SE 41 data points | Cross-seasonal average, SE 4 data points | |||||
|---|---|---|---|---|---|---|---|---|---|---|
| DRav | SE | DRav | SE | DRav | SE | DRav | SE | DRav | SE | |
| Soil (moist) | 0.33 | 0.00 | 0.20 | 0.01 | 0.24 | 0.04 | 0.29 | 0.01 | 0.26 | 0.03 |
| Pine bark mulch | 0.33 | 0.00 | 0.26 | 0.01 | 0.31 | 0.05 | 0.28 | 0.01 | 0.30 | 0.01 |
| Polished stones (black) | 0.27 | 0.00 | 0.36 | 0.01 | 0.27 | 0.05 | 0.33 | 0.01 | 0.31 | 0.02 |
| Asphalt | 0.23 | 0.01 | 0.36 | 0.01 | 0.35 | 0.07 | 0.34 | 0.01 | 0.35 | 0.03 |
| Artificial grass (laid) | 0.00 | 0.36 | 0.01 | 0.37 | 0.08 | 0.36 | 0.01 | 0.37 | 0.00 | |
| Soil (dry) | 0.40 | 0.01 | 0.34 | 0.01 | 0.43 | 0.07 | 0.32 | 0.01 | 0.37 | 0.03 |
| Pavers (grey) | 0.40 | 0.01 | 0.36 | 0.01 | 0.37 | 0.07 | 0.42 | 0.01 | 0.39 | 0.01 |
| Turf grass | 0.43 | 0.00 | 0.40 | 0.00 | 0.41 | 0.04 | 0.37 | 0.01 | 0.40 | 0.01 |
| Artificial grass | 0.43 | 0.00 | 0.39 | 0.01 | 0.41 | 0.05 | 0.42 | 0.01 | 0.42 | 0.01 |
| Sand (grey) | 0.50 | 0.01 | 0.47 | 0.01 | 0.43 | 0.06 | 0.37 | 0.01 | 0.44 | 0.03 |
| Shade cloth (black) | 0.50 | 0.00 | 0.46 | 0.01 | 0.44 | 0.04 | 0.38 | 0.01 | 0.45 | 0.02 |
| Black card on polystyrene | 0.47 | 0.01 | 0.42 | 0.01 | 0.45 | 0.05 | 0.48 | 0.01 | 0.46 | 0.01 |
| Pavers (red) | 0.54 | 0.01 | 0.41 | 0.01 | 0.50 | 0.06 | 0.56 | 0.01 | 0.50 | 0.03 |
| Concrete (x 40mm) | 0.57 | 0.01 | 0.51 | 0.01 | 0.53 | 0.08 | 0.54 | 0.01 | 0.54 | 0.01 |
| Concrete (x 80mm) | 0.56 | 0.01 | 0.54 | 0.01 | 0.56 | 0.08 | 0.54 | 0.01 | 0.55 | 0.01 |
| Limestone block | 0.84 | 0.00 | 0.56 | 0.01 | 0.55 | 0.07 | 0.58 | 0.00 | 0.56 | 0.07 |
| Decking | 0.64 | 0.01 | 0.59 | 0.01 | 0.59 | 0.06 | 0.55 | 0.01 | 0.59 | 0.02 |
| Shade cloth (cream) | 0.69 | 0.00 | 0.60 | 0.01 | 0.63 | 0.04 | 0.62 | 0.01 | 0.63 | 0.02 |
| Pavers (sandstone) | 0.66 | 0.01 | 0.64 | 0.01 | 0.63 | 0.07 | 0.68 | 0.01 | 0.65 | 0.01 |
| Sand (white) | 0.77 | 0.00 | 0.73 | 0.01 | 0.64 | 0.04 | 0.65 | 0.01 | 0.70 | 0.03 |
| Crushed rock (white) | 0.81 | 0.00 | 0.82 | 0.01 | 0.77 | 0.04 | 0.86 | 0.01 | 0.81 | 0.02 |
| Shade cloth (white) | 0.83 | 0.00 | 0.74 | 0.01 | 0.88 | 0.05 | 0.85 | 0.02 | 0.82 | 0.03 |
| White painted polystyrene | 1.00 | 0.00 | 1.00 | 0.00 | 1.00 | 0.00 | 1.00 | 0.00 | 1.00 | 0.00 |
References
- Oke, T.R. Energetic basis of the urban heat island. R. Meteorol. Soc. Bracknelleng. Q. J. 1982, 108, 1–24. [Google Scholar] [CrossRef]
- Stone, B.; Vargo, J.; Habeeb, D. Managing climate change in cities: Will climate action plans work? Landsc. Urban Plan. 2012, 107, 263–271. [Google Scholar] [CrossRef]
- Santamouris, M. Regulating the damaged thermostat of the cities—Status, impacts and mitigation challenges. Energy Build. 2015, 91, 43–56. [Google Scholar] [CrossRef]
- Chatzidimitriou, A.; Yannas, S. Microclimate development in open urban spaces: The influence of form and materials. Energy Build. 2015, 108, 156–174. [Google Scholar] [CrossRef]
- Mohajerani, A.; Bakaric, J.; Jeffrey-Bailey, T. The urban heat island effect, its causes, and mitigation, with reference to the thermal properties of asphalt concrete. J. Environ. Manag. 2017, 197, 522–538. [Google Scholar] [CrossRef] [PubMed]
- Qin, Y.; Hiller, J.E. Understanding pavement-surface energy balance and its implications on cool pavement development. Energy Build. 2014, 85, 389–399. [Google Scholar] [CrossRef]
- Battista, G.; Pastore, E.M. Using cool pavements to mitigate urban temperatures in a case study of Rome (italy). Energy Procedia 2017, 113, 98–103. [Google Scholar] [CrossRef]
- Qin, Y. Urban canyon albedo and its implication on the use of reflective cool pavements. Energy Build. 2015, 96, 86–94. [Google Scholar] [CrossRef]
- O’Malley, C.; Piroozfar, P.; Farr, E.R.P.; Pomponi, F. Urban Heat Island (UHI) mitigating strategies: A case-based comparative analysis. Sustain. Cities Soc. 2015, 19, 222–235. [Google Scholar] [CrossRef]
- Erell, E.; Pearlmutter, D.; Boneh, D.; Kutiel, P.B. Effect of high-albedo materials on pedestrian heat stress in urban street canyons. Urban Clim. 2014, 10 Pt 2, 367–386. [Google Scholar] [CrossRef]
- El-Bardisy, W.M.; Fahmy, M.; El-Gohary, G.F. Climatic sensitive landscape design: Towards a better microclimate through plantation in public schools, Cairo, Egypt. In Urban Planning and Architectural Design for Sustainable Development; Naselli, F., Pollice, F., Amer, M.S., Eds.; Elsevier: Amsterdam, The Netherlands, 2016; Volume 216, pp. 206–216. [Google Scholar]
- Hardin, A.W.; Vanos, J.K. The influence of surface type on the absorbed radiation by a human under hot, dry conditions. Int. J. Biometeorol. 2018, 62, 43–56. [Google Scholar] [CrossRef] [PubMed]
- Li, H. Evaluation of Cool Pavement Strategies for Heat Island Mitigation. Ph.D. Dissertation, University of California, Davis, Ann Arbor, MI, USA, 2012. [Google Scholar]
- Hong, Y.; Ong, B.L.; Lim, G.T. Vbfred-ivy: The development of a computational tool to model the thermal performance of plants on buildings in the singapore climate. In In Proceedings of the CAADRIA 2001: The Sixth Conference on Computer Aided Architectural Design Research in Asia, Sydney, Australia, 19–21 April 2001; pp. 159–168. [Google Scholar]
- Montague, T.; Kjelgren, R. Energy balance of six common landscape surfaces and the influence of surface properties on gas exchange of four containerized tree species. Sci. Hortic. 2004, 100, 229–249. [Google Scholar] [CrossRef]
- McPherson, E.G.; Simpson, J.R.; Livingston, M. Effects of three landscape treatments on residential energy and water use in Tucson, Arizona. Energy Build. 1989, 13, 127–138. [Google Scholar] [CrossRef]
- Cameron, R.W.F.; Taylor, J.E.; Emmett, M.R. What’s “cool” in the world of green façades? How plant choice influences the cooling properties of green walls. Build. Environ. 2014, 73, 198–207. [Google Scholar] [CrossRef]
- Grant, O.M.; Tronina, Ł.; Jones, H.G.; Chaves, M.M. Exploring thermal imaging variables for the detection of stress responses in grapevine under different irrigation regimes. J. Exp. Bot. 2007, 58, 815–825. [Google Scholar] [CrossRef] [PubMed]
- Guilioni, L.; Jones, H.G.; Leinonen, I.; Lhomme, J.P. On the relationships between stomatal resistance and leaf temperatures in thermography. Agric. For. Meteorol. 2008, 148, 1908–1912. [Google Scholar] [CrossRef]
- Tipler, P.A. Physics; Worth Publishers, Inc.: New York, NY, USA, 1982; p. 1078. [Google Scholar]
- Doulos, L.; Santamouris, M.; Livada, I. Passive cooling of outdoor urban spaces. The role of materials. Sol. Energy 2004, 77, 231–249. [Google Scholar] [CrossRef]
- Radhi, H.; Assem, E.; Sharples, S. On the colours and properties of building surface materials to mitigate urban heat islands in highly productive solar regions. Build. Environ. 2014, 72, 162–172. [Google Scholar] [CrossRef]
- Kuang, W.H.; Liu, Y.; Dou, Y.Y.; Chi, W.F.; Chen, G.S.; Gao, C.F.; Yang, T.R.; Liu, J.Y.; Zhang, R.H. What are hot and what are not in an urban landscape: Quantifying and explaining the land surface temperature pattern in Beijing, China. Landsc. Ecol. 2015, 30, 357–373. [Google Scholar] [CrossRef]
- Brandani, G.; Napoli, M.; Massetti, L.; Petralli, M.; Orlandini, S. Urban Soil: Assessing Ground Cover Impact on Surface Temperature and Thermal Comfort. J. Environ. Qual. 2016, 45, 90–97. [Google Scholar] [CrossRef]
- Lin, B.B.; Meyers, J.; Beaty, R.M.; Barnett, G.B. Urban green infrastructure impacts on climate regulation services in Sydney, Australia. Sustainability 2016, 8, 788. [Google Scholar] [CrossRef]
- Hamstead, Z.A.; Kremer, P.; Larondelle, N.; McPhearson, T.; Haase, D. Classification of the heterogeneous structure of urban landscapes (STURLA) as an indicator of landscape function applied to surface temperature in New York City. Ecol. Indic. 2016, 70, 574–585. [Google Scholar] [CrossRef]
- Wu, H.; Sun, B.; Li, Z.; Yu, J. Characterizing thermal behaviors of various pavement materials and their thermal impacts on ambient environment. J. Clean. Prod. 2017, 172, 1358–1367. [Google Scholar] [CrossRef]
- Loveday, J.; Loveday, G.K.; Byrne, J.J.; Ong, B.-l.; Morrison, G.M. Seasonal and diurnal surface temperatures of urban landscape elements. Sustainability 2019, 11, 5280. [Google Scholar] [CrossRef]
- Palyvos, J.A. A survey of wind convection coefficient correlations for building envelope energy systems’ modeling. Appl. Therm. Eng. 2008, 28, 801–808. [Google Scholar] [CrossRef]
- Taha, H.; Sailor, D.; Akbari, H. High-Albedo Materials for Reducing Building Cooling Energy Use; DE-AC0376SF00098; Lawrence Berkeley Laboratory University of California: Berkeley, CA, USA, 1992. [Google Scholar]
- Wang, F.; Cheng, L.; Mei, H.; Zhang, Q.; Zhang, L. Effect of surface microstructures on the infrared emissivity of graphite. Int. J. Thermophys. 2014, 35, 62–75. [Google Scholar] [CrossRef]
- Jim, C.Y. Intense summer heat fluxes in artificial turf harm people and environment. Landsc. Urban Plan. 2017, 157, 561–576. [Google Scholar] [CrossRef]
- Cueto, R.G.; Soto, N.S.; Rincón, Z.H.; Benítez, S.O.; Morales, G.B. Parameterization of net radiation in an arid city of northwestern Mexico. Atmósfera 2015, 28, 71–82. [Google Scholar] [CrossRef]
- Li, H. 4—A comparison of thermal performance of different pavement materials A2—Pacheco-Torgal, F. In Eco-Efficient Materials for Mitigating Building Cooling Needs; Labrincha, J.A., Cabeza, L.F., Granqvist, C.G., Eds.; Woodhead Publishing: Oxford, UK, 2015; pp. 63–124. [Google Scholar] [CrossRef]
- Xie, N.; Li, H.; Abdelhady, A.; Harvey, J. Laboratorial investigation on optical and thermal properties of cool pavement nano-coatings for urban heat island mitigation. Build. Environ. 2019, 147, 231–240. [Google Scholar] [CrossRef]
- Kyriakodis, G.E.; Santamouris, M. Using reflective pavements to mitigate urban heat island in warm climates—Results from a large scale urban mitigation project. Urban Clim. 2018, 24, 326–339. [Google Scholar] [CrossRef]
- Akbari, H.; Levinson, R.; Berdahl, P. ASTM Standards for Measuring Solar Reflectance and Infrared Emittance of Construction Materials and Comparing Their Steady-State Surface Temperatures; Lawrence Berkeley National Lab: Berkeley, CA, USA, 1996. [Google Scholar]
- ASTM-E1918-16. Standard Test Method for Measuring Solar Reflectance of Horizontal and Low-Sloped Surfaces in the Field; ASTM International: West Conshohocken, PA, USA, 2016. [Google Scholar] [CrossRef]
- ASTM-C1371-15. Standard Test Method for Determination of Emittance of Materials Near Room Temperature Using Portable Emissometers; ASTM International: West Conshohocken, PA, USA, 2015. [Google Scholar] [CrossRef]
- Aoki, T.; Mizutani, A. Measurement of the vertical distribution of reflected solar radiation. J. Eng. Technol. Sci. 2015, 47, 160–169. [Google Scholar] [CrossRef][Green Version]
- Maxim Integrated. What Is an iButton Device? Available online: https://www.maximintegrated.com/en/app-notes/index.mvp/id/3808 (accessed on 19 August 2019).
- Chapman, L.; Thornes, J.E. Real-time sky-view factor calculation and approximation. J. Atmos. Ocean. Technol. 2004, 21, 730–741. [Google Scholar] [CrossRef]
- Peel, M.C.; Finlayson, B.L.; Mcmahon, T.A. Updated world map of the Köppen-Geiger climate classification. Hydrol. Earth Syst. Sci. Discuss. 2007, 11, 1633–1644. [Google Scholar] [CrossRef]
- ASTM-E1862. Standard Test Methods for Measuring and Compensating for Reflected Temperature Using Infrared Imaging Radiometers; American Society for Testing and Materials: West Conshohocken, PA, USA, 1998. [Google Scholar] [CrossRef]
- Loveday, J.; Loveday, G.K.; Byrne, J.J.; Ong, B.-l.; Newman, P. A technique for quantifying the reduction of solar radiation due to cloud and tree cover. Procedia Eng. 2017, 180, 403–412. [Google Scholar] [CrossRef]
- van Marken Lichtenbelt, W.D.; Daanen, H.A.M.; Wouters, L.; Fronczek, R.; Raymann, R.J.E.M.; Severens, N.M.W.; Van Someren, E.J.W. Evaluation of wireless determination of skin temperature using iButtons. Physiol. Behav. 2006, 88, 489–497. [Google Scholar] [CrossRef]
- Hu, M.; Zhao, B.; Ao, X.; Feng, J.; Cao, J.; Su, Y.; Pei, G. Experimental study on a hybrid photo-thermal and radiative cooling collector using black acrylic paint as the panel coating. Renew. Energy 2019, 139, 1217–1226. [Google Scholar] [CrossRef]
- Murdoch University. Murdoch University Weather Station. Available online: http://134.115.224.172/ (accessed on 23 March 2020).
- Jaffer, A. Convection from a Rectangular Plate. Available online: http://people.csail.mit.edu/jaffer/SimRoof/Convection/ (accessed on 25 January 2016).
- Howell, J.R. A Catalog of Radiation Heat Transfer Configuration Factors. Available online: http://www.thermalradiation.net/calc/sectionc/C-13.html (accessed on 20 March 2018).
- University of Pennsylvania. Averaging, Errors and Uncertainty. Available online: http://avntraining.hartrao.ac.za/images/Error_Analysis.pdf (accessed on 22 June 2019).
- BoM. Bureau of Meteorology Monthly Climate Statistics for Australian Locations. Available online: http://www.bom.gov.au/climate/averages/tables/cw_009225_All.shtml (accessed on 7 October 2019).
- Loveday, J.; Loveday, G.K.; Byrne, J.J.; Ong, B.-l.; Morrison, G.M. Modified ibuttons: A low-cost instrument to measure the albedo of landscape elements. Sustainability 2019, 11, 6896. [Google Scholar] [CrossRef]
- Taleghani, M. The impact of increasing urban surface albedo on outdoor summer thermal comfort within a university campus. Urban Clim. 2018, 24, 175–184. [Google Scholar] [CrossRef]
- Lindberg, F.; Onomura, S.; Grimmond, C.S.B. Influence of ground surface characteristics on the mean radiant temperature in urban areas. Int. J. Biometeorol. 2016, 60, 1439–1452. [Google Scholar] [CrossRef]
- Yaghoobian, N.; Kleissl, J. Effect of reflective pavements on building energy use. Urban Clim. 2012, 2, 25–42. [Google Scholar] [CrossRef]
- Santamouris, M.; Haddad, S.; Saliari, M.; Vasilakopoulou, K.; Synnefa, A.; Paolini, R.; Ulpiani, G.; Garshasbi, S.; Fiorito, F. On the energy impact of urban heat island in Sydney: Climate and energy potential of mitigation technologies. Energy Build. 2018, 166, 154–164. [Google Scholar] [CrossRef]
- Wang, Y.; Berardi, U.; Akbari, H. Comparing the effects of urban heat island mitigation strategies for Toronto, Canada. Energy Build. 2016, 114, 2–19. [Google Scholar] [CrossRef]
- Santamouris, M.; Ding, L.; Fiorito, F.; Oldfield, P.; Osmond, P.; Paolini, R.; Prasad, D.; Synnefa, A. Passive and active cooling for the outdoor built environment—Analysis and assessment of the cooling potential of mitigation technologies using performance data from 220 large scale projects. Sol. Energy 2017, 154, 14–33. [Google Scholar] [CrossRef]


| LE Name | Description | Overall Dimensions of LE (mm) |
|---|---|---|
| Artificial turf grass | Tuff Turf Grass Mat 20 mm pile, green/natural brown curl | 1000 × 1000, height 20 |
| Artificial turf grass (laid) | As above but laid on crushed rock ~50 mm thick. Top surface was then sprinkled with white sand. | 410 × 560 × 50 |
| Asphalt | Westbuild asphalt pack (half a 20 kg bag,) | 290 × 340 × 50 |
| Concrete slab (×40 mm) | Grey concrete slab | 460 × 350 × 38 |
| Concrete slab (×80 mm) | 2 × Grey concrete slab 38 mm thick | 450 × 550 × 76 |
| Crushed rock (white) | Tuscan path 20 mm–25 mm snow white quartz pebbles 20 kg | 440 × 440 × 60 |
| Decking | Timberlink Australia 70 mm × 19 mm treated pine, no finish, (5 lengths mounted on 2 pine joists, height 70 mm) | 360 × 1070 × 19 |
| Limestone block | Flat edge | 500 × 250 × 150 |
| Pine bark mulch | Richgro pinebark (half a 40 L bag) | 580 × 550 × 80 |
| Pavers (grey) | Tuscan Path bluestone paver | 400 × 400 × 40 |
| Pavers (red) | 6 × Ezi-Pave Burnished Red (Midland Brick) 232 mm × 153 mm × 50 mm | 450 × 460 × 50 |
| Pavers (sandstone) | Tuscan Path sandstone paver | 400 × 400 × 40 |
| Polished stones (black) | Tuscan path polished black pebbles stone (half a 15 kg bag) | 550 × 500 × 75 |
| Sand (grey) | Residential garden bed sample | 450 diameter, depth 50 |
| Sand (white) | Westbuild white, washed sand, (half of a 20 kg bag) | 450 diameter, depth 50 |
| Shade cloth (black) | Coolaroo black 70%, folded into four layers | 500 × 560 |
| Shade cloth (cream) | Coolaroo sandstone 70%, folded into four layers | 470 × 530 |
| Shade cloth (white) | Hortshade white 50%, folded into four layers | 470 × 530 |
| Soil (dry) | Hortico garden soil (half a 25 L bag) | 500 × 500 × 50 |
| Soil (moist) | Hortico garden soil (half a 25 L bag) | 410 × 780 × 50 |
| Turf grass (kikuyu) | Pennisetum clandestinum, managed and irrigated | ~1000 × ~2500 |
| White painted polystyrene | Gloss white, exterior water based, 4 seasons, (British Paints) on a polystyrene base | 560 × 460 × 35 |
| Black painted card on polystyrene | Flat black, exterior water based, 4 seasons, (British Paints) painted black cardboard on polystyrene | 460 × 410 × 35 |
| Landscape Elements | Test Date 21st January 2019, Total LE Surface Area 1200 mm × 1200 mm | ||
|---|---|---|---|
| Surface Area of Individual LE Components (mm) | Thickness (mm) | Sub-Layer * | |
| Artificial turf grass (Tuff Turf Multi) | 1200 × 1200 | 12 | sand |
| Asphalt | 1200 × 1200 | 50 | sand |
| Concrete slab (x40mm) | 600 × 600 | 38 | sand |
| Crushed rock (white) | 20–25 | 50 | sand |
| Decking (hardwood, Merbau) | 1200 × 90 | 19 | turf grass |
| Pine bark mulch | ~10–50 | 50 | sand |
| Pavers (grey) | 400 × 400 | 40 | sand |
| Pavers (red) | 232 × 153 | 50 | sand |
| Pavers (sandstone) | 400 × 400 | 40 | sand |
| Seedlings (native, Old man saltbush) (Atriplex nummularia) | ~50 diameter within seedling tray (plant density 711 plants/m2) | 100–150 (plant height) | sand |
| Ground cover (annual) (non-native, petunias) (Petunia × hybrid) | ~150 diameter pots (plant density 34 plants/m2) | 100–150 (plant height) | sand |
| Soil (dry) | 1200 × 1200 | 50 | turf grass |
| Soil (moist) | 1200 × 1200 | 50 | turf grass |
| Turf grass (kikuyu) | 1200 × 1200 | ||
| White painted polystyrene (two coats of gloss white, exterior water based, 4 Seasons, British Paints) | 1200 × 1200 | ~0 | 40 mm polystyrene |
| Black painted polystyrene (undercoat was exterior low sheen black, 4 Seasons, British Paints; top coat was flat black enamel spray paint, Rust guard, White Knight) | 1200 × 1200 | ~0 | 40 mm polystyrene |
| Date & Season | Time Range | Air Temp. Range (°C) | Relative Humidity Range (%) | Max Solar Radiation (W·m−2) | Wind Speed (m·s−1) Average (Standard Deviation) |
|---|---|---|---|---|---|
| 9th April 2017 Autumn 2017 | 09:30–15:00 | 19.4–27.4 | 25–51 | 831 | 2.05 (0.47) |
| 24th August 2017 Winter 2017 | 09:20–15:00 | 15.0–22.5 | 43–62 | 724 | 3.34 (0.55) |
| 5th October 2017 Spring 2017 | 09:00–15:00 | 14.9–21.6 | 33–51 | 945 | 2.79 (0.76) |
| 9th January 2018 Summer 2018 | 09:00–15:40 | 24.5–35.0 | 23–45 | 1049 | 2.61 (0.66) |
| 21st January 2019 Summer 2019 | 09:00–15:40 | 25.4–27.8 | 54–67 | 1009 | 2.67 (0.75) |
| Landscape Element | View Factors | |||||||||||
|---|---|---|---|---|---|---|---|---|---|---|---|---|
| Autumn | Winter | Spring | Summer 2018 | |||||||||
| LE | PP | Grass | LE | PP | Grass | LE | PP | Grass | LE | PP | Grass | |
| Artificial grass | 0.75 | 0 | 0.25 | 0.71 | 0 | 0.29 | 0.71 | 0 | 0.29 | 0.71 | 0 | 0.29 |
| Artificial grass (laid) | 0.00 | 0 | 0 | 0.58 | 0.1 | 0.32 | 0.61 | 0.04 | 0.35 | 0.61 | 0.04 | 0.35 |
| Asphalt | 0.43 | 0 | 0.57 | 0.43 | 0 | 0.57 | 0.43 | 0 | 0.57 | 0.43 | 0 | 0.57 |
| Black painted polystyrene | 0.56 | 0 | 0.44 | 0.56 | 0 | 0.44 | 0.56 | 0 | 0.44 | 0.56 | 0 | 0.44 |
| Concrete (× 40 mm) | 0.54 | 0 | 0.46 | 0.52 | 0 | 0.48 | 0.52 | 0 | 0.48 | 0.52 | 0 | 0.48 |
| Concrete (× 80 mm) | 0.58 | 0 | 0.42 | 0.58 | 0 | 0.42 | 0.58 | 0 | 0.42 | 0.58 | 0 | 0.42 |
| Crushed rock (white) | 0.58 | 0.06 | 0.36 | 0.58 | 0.06 | 0.36 | 0.58 | 0.06 | 0.36 | 0.58 | 0.06 | 0.36 |
| Decking | 0.60 | 0 | 0.40 | 0.56 | 0 | 0.44 | 0.56 | 0 | 0.44 | 0.64 | 0 | 0.36 |
| Limestone block | 0.45 | 0 | 0.55 | 0.45 | 0 | 0.55 | 0.45 | 0 | 0.55 | 0.45 | 0 | 0.55 |
| Pavers (grey) | 0.54 | 0 | 0.46 | 0.54 | 0 | 0.46 | 0.54 | 0 | 0.46 | 0.54 | 0 | 0.46 |
| Pavers (red) | 0.59 | 0 | 0.41 | 0.59 | 0 | 0.41 | 0.59 | 0 | 0.41 | 0.59 | 0 | 0.41 |
| Pavers (sandstone) | 0.54 | 0 | 0.46 | 0.54 | 0 | 0.46 | 0.54 | 0 | 0.46 | 0.54 | 0 | 0.46 |
| Pine bark mulch | 0.66 | 0.01 | 0.33 | 0.65 | 0.04 | 0.31 | 0.66 | 0.01 | 0.33 | 0.66 | 0.01 | 0.33 |
| Polished stones (black) | 0.62 | 0.07 | 0.31 | 0.62 | 0.07 | 0.31 | 0.62 | 0.07 | 0.31 | 0.62 | 0.07 | 0.31 |
| Sand (grey) | 0.56 | 0.16 | 0.28 | 0.56 | 0.13 | 0.31 | 0.56 | 0.16 | 0.28 | 0.56 | 0.16 | 0.28 |
| Sand (white) | 0.56 | 0.13 | 0.31 | 0.56 | 0.13 | 0.31 | 0.56 | 0.13 | 0.31 | 0.56 | 0.13 | 0.31 |
| Shade cloth (black) | 0.63 | 0 | 0.37 | 0.63 | 0 | 0.37 | 0.63 | 0 | 0.37 | 0.63 | 0 | 0.37 |
| Shade cloth (cream) | 0.61 | 0 | 0.39 | 0.61 | 0 | 0.39 | 0.61 | 0 | 0.39 | 0.61 | 0 | 0.39 |
| Shade cloth (white) | 0.61 | 0 | 0.39 | 0.61 | 0 | 0.39 | 0.61 | 0 | 0.39 | 0.61 | 0 | 0.39 |
| Soil (dry) | 0.62 | 0.05 | 0.33 | 0.62 | 0.07 | 0.31 | 0.62 | 0.05 | 0.33 | 0.62 | 0.05 | 0.33 |
| Soil (moist) | 0.59 | 0.05 | 0.36 | 0.59 | 0.05 | 0.36 | 0.59 | 0.05 | 0.36 | 0.59 | 0 | 0.41 |
| Turf grass | 0.95 | 0 | 0.05 | 0.95 | 0 | 0.05 | 0.92 | 0 | 0.08 | 0.98 | 0 | 0.02 |
| White painted polystyrene | 0.61 | 0 | 0.39 | 0.61 | 0 | 0.39 | 0.61 | 0 | 0.39 | 0.61 | 0 | 0.39 |
| Phase 1 LEs | DRav (Mean) | Variance | Number of observations | t-Stat | p-value (two-tail) |
|---|---|---|---|---|---|
| Soil (moist) | 0.26 | 0.00 | 147 | −5.00 | <0.001 |
| Pine bark mulch | 0.30 | 0.00 | 147 | −2.27 | 0.02 |
| Polished stones (black) | 0.31 | 0.00 | 147 | −5.26 | <0.001 |
| Asphalt | 0.35 | 0.00 | 113 | −0.36 | 0.72 |
| Artificial grass (laid) | 0.35 | 0.00 | 113 | −2.40 | 0.02 |
| Soil (dry) | 0.37 | 0.01 | 147 | −1.93 | 0.05 |
| Pavers (grey) | 0.39 | 0.00 | 147 | −2.34 | 0.02 |
| Turf grass | 0.40 | 0.00 | 147 | −2.42 | 0.02 |
| Artificial grass | 0.42 | 0.00 | 147 | −3.17 | <0.01 |
| Sand (grey) | 0.44 | 0.01 | 147 | −0.85 | 0.39 |
| Shade cloth (black) | 0.44 | 0.00 | 147 | −1.99 | 0.05 |
| Black card on polystyrene | 0.46 | 0.00 | 147 | −6.46 | <0.001 |
| Pavers (red) | 0.51 | 0.01 | 147 | −4.11 | <0.001 |
| Concrete (x 40mm) | 0.54 | 0.00 | 147 | −0.75 | 0.45 |
| Concrete (x 80mm) | 0.55 | 0.00 | 147 | −2.44 | 0.02 |
| Limestone block | 0.56 | 0.00 | 113 | −3.81 | <0.001 |
| Decking | 0.59 | 0.00 | 147 | −6.45 | <0.001 |
| Shade cloth (cream) | 0.63 | 0.00 | 147 | −2.91 | <0.01 |
| Pavers (sandstone) | 0.65 | 0.00 | 147 | −5.14 | <0.001 |
| Sand (white) | 0.69 | 0.01 | 147 | −15.75 | <0.001 |
| Crushed rock (white) | 0.82 | 0.00 | 147 | −1.13 | 0.26 |
| Shade cloth (white) | 0.83 | 0.01 | 147 | −25.82 | <0.001 |
| White painted polystyrene | 1.00 | 0.00 | 147 |
| LE | t-Stat | p-value (two-tail) |
|---|---|---|
| Soil (moist) | 8.15 | <0.001 |
| Pine bark mulch | −11.48 | <0.001 |
| Asphalt | −5.68 | <0.001 |
| Pavers (grey) | −1.94 | 0.06 |
| Turf grass | −8.75 | <0.001 |
| Artificial grass | −5.50 | <0.001 |
| Soil (dry) | −18.23 | <0.001 |
| Pavers (red) | −0.39 | 0.70 |
| black card on polystyrene | −8.32 | <0.001 |
| Concrete (× 40 mm) | −4.13 | <0.001 |
| Decking | −4.87 | <0.001 |
| Pavers (sandstone) | 3.30 | <0.01 |
| Crushed rock (white) | 8.71 | <0.001 |
| Relative Average Radiosity | Daytime (09:00–15:40) | ||||
|---|---|---|---|---|---|
| Landscape Element | DRav | SE | t Stat | p-value (two-tail) | |
| least | Soil (moist) | 0.23 | 0.00 | −11.79 | <0.001 |
| Petunia (non−native) | 0.30 | 0.00 | −1.04 | 0.30 | |
| Saltbush (native) | 0.31 | 0.00 | −11.46 | <0.001 | |
| Pine bark mulch | 0.39 | 0.01 | −1.85 | 0.07 | |
| Asphalt | 0.41 | 0.01 | −2.39 | 0.02 | |
| Pavers (grey) | 0.44 | 0.01 | −0.18 | 0.86 | |
| Turf grass | 0.44 | 0.01 | −4.95 | <0.001 | |
| Artificial grass | 0.50 | 0.01 | −5.24 | <0.001 | |
| Soil (dry) | 0.56 | 0.01 | −0.36 | 0.72 | |
| Pavers (red) | 0.57 | 0.01 | −0.02 | 0.98 | |
| Black painted polystyrene | 0.57 | 0.01 | −2.05 | 0.04 | |
| Concrete (x 40mm) | 0.59 | 0.01 | −1.12 | 0.27 | |
| Decking | 0.60 | 0.01 | −2.23 | 0.03 | |
| Pavers (sandstone) | 0.63 | 0.01 | −9.65 | <0.001 | |
| Crushed rock (white) | 0.75 | 0.01 | −40.77 | <0.001 | |
| most | White painted polystyrene | 1.00 | 0.00 | ||
| Note: For all LEs: t Critical two-tail = 1.99, Observations = 41, Variance ≤ 0.01 | |||||
© 2020 by the authors. Licensee MDPI, Basel, Switzerland. This article is an open access article distributed under the terms and conditions of the Creative Commons Attribution (CC BY) license (http://creativecommons.org/licenses/by/4.0/).
Share and Cite
Loveday, J.; Loveday, G.K.; Byrne, J.J.; Ong, B.-l.; Morrison, G.M. Radiosity from Individual Urban Landscape Elements Measured Using a Modified Low-Cost Temperature Sensor. Urban Sci. 2020, 4, 14. https://doi.org/10.3390/urbansci4010014
Loveday J, Loveday GK, Byrne JJ, Ong B-l, Morrison GM. Radiosity from Individual Urban Landscape Elements Measured Using a Modified Low-Cost Temperature Sensor. Urban Science. 2020; 4(1):14. https://doi.org/10.3390/urbansci4010014
Chicago/Turabian StyleLoveday, Jane, Grant K. Loveday, Joshua J. Byrne, Boon-lay Ong, and Gregory M. Morrison. 2020. "Radiosity from Individual Urban Landscape Elements Measured Using a Modified Low-Cost Temperature Sensor" Urban Science 4, no. 1: 14. https://doi.org/10.3390/urbansci4010014
APA StyleLoveday, J., Loveday, G. K., Byrne, J. J., Ong, B.-l., & Morrison, G. M. (2020). Radiosity from Individual Urban Landscape Elements Measured Using a Modified Low-Cost Temperature Sensor. Urban Science, 4(1), 14. https://doi.org/10.3390/urbansci4010014