Article

Impact of Urban Morphology on Energy Consumption of Vertical Mobility in Asian Cities—A Comparative Analysis with 3D City Models

1
European Institute for Energy Research, 76131 Karlsruhe, Germany
2
CentraleSupélec, 91190 Gif-sur-Yvette, France
3
London School of Economics and Political Sciences, WC2A 2AE London, UK
*
Author to whom correspondence should be addressed.
Urban Sci. 2019, 3(1), 4; https://doi.org/10.3390/urbansci3010004
Submission received: 29 November 2018 / Revised: 19 December 2018 / Accepted: 20 December 2018 / Published: 28 December 2018

Abstract

:
Sustainable development of cities and the overall efficiency of urban infrastructure have emerged as central issues in policy consideration. Consequently, investigating the influence of urban physical form on resource use is critical. This paper investigates energy use due to vertical mobility in the context of Asia’s diverging cities. Micro mobility of citizens’ movement in the vertical direction has a distinct impact on the total energy consumption of a city or urban block. The objective of this research is to analyse the impact of different urban morphologies on vertical mobility—from buildings to urban blocks. A methodology is proposed to calculate energy consumption of lifts, based on a detailed review of literature, codes of practice, the International Organisation for Standardisation (ISO)/DIS 25745-1 standard and 3D city models. Furthermore, a tool is developed and applied in 20 typical urban blocks in four cities: Kuwait, Abu Dhabi, Hong Kong and Singapore. The average annual specific energy consumption of lifts varies significantly across the samples. A comparative analysis of all the morphologies across these cities help to understand the impact of building forms, usage, and a number of further parameters on the energy consumption for vertical mobility.

1. Introduction

Cities are expanding around the world both in size and in number, due to immense population pressure and economic conditions. In 2016, an estimated 54.5% of the world’s population lived in urban settlements. By 2030, urban areas are projected to house 60% of people globally and one in every three people will live in cities that have at least half a million inhabitants [1]. Therefore, cities’ efficiency and sustainability have emerged as central issues in policy consideration. Consequently, the investigation of the urban physical form and its impact on resource efficiency can deliver relevant insights for future urban development. A number of studies suggest that compact urban development is highly beneficial for fast growing cities to achieve high efficiency of energy use and sustainable development [2]. Urban form influences the energy demands for heating, cooling, and mobility. The analysis of accessibility of people’s movement has a significant impact on the total energy need of a city. Energy demand due to horizontal mobility was studied in detail, yet the micro accessibility of people’s movement, especially in the vertical direction has a significant impact on the total energy consumption of a neighbourhood or a city. This aspect has not yet been investigated in relation to the urban form.
This paper performs literature review on (a) the impact of urban form on energy consumption for heating, cooling and transport and (b) the methods to calculate energy consumption due to vertical mobility. A generic modelling approach and a tool are developed to calculate energy use of lifts in buildings as part of different urban patterns—at the scales from individual buildings to several urban blocks in four different Asian cities namely Kuwait, Abu Dhabi, Hong Kong and Singapore. In this regard, an extensive literature review on different datasets regarding building and lift characteristics as well as methods on analysing lift traffic are carried out. The 3D city models of the morphologies were built to perform a comparative evaluation of the impact of different urban forms on vertical mobility and energy consumption in these cities. Finally, the reliability of different input model parameters and the validation of the results are performed.
The goal of this study is to sharpen our understanding of the influencing factors in energy consumption due to vertical mobility. It can help to assess the complete energy balance in rapidly growing urban areas, in which all components of energy use such as heating, cooling, lighting, horizontal mobility, etc. should be included. Therefore, this study will help to support planning, with direct relevance to the built environment and form a basis for policy recommendations towards sustainable urban development e.g., strategies to reduce carbon emissions and energy consumption through energy efficient lift installation from the building to urban scales.

1.1. Literature on Urban form and Energy Use

Ko [3] performed an extensive literature review on how urban form affects residential energy use, particularly energy for space conditioning (heating and cooling). Recently, Bian et al. [4] carried out a review on theoretical model of urban form and on relationship between urban form and energy consumption. They have represented urban form by the compact ratio index and the fractal dimension index and employed a Geographical Weighted Regression (GWR) model to reveal the relationship between urban form and energy consumption. Zhao [2] employed panel data analysis to estimate whether and to what extent the spatial patterns of urban form are correlated with energy consumption across regions in China, at the national level and the regional level. Earlier, the research performed by Rode et al. [5] as well as Rode et al. [6] suggested that urban morphology induced heating energy efficiency is significant and can lead to a difference in heat-energy demand of up to a factor of six. Compact and tall building types were found to have the greatest efficiency at the neighbourhood scale while detached housing was found to have the lowest one.
In arguing the popular concept of strong negative correlation between urban density and energy consumption due to transportation system, Mindali et al. [7] crystallised some of the relationships between density and energy consumption with 26 variables in 31 cities in North America, Australia and Europe. He found out that increasing density results in a reduction of energy consumption in some cities, but the total urban density shows no direct impact on the energy consumption. Maharjan et al. [8] studied the relationship between urban form, travel mode choice and energy consumption via mode-wise (non-motorised, motorcycle, car, bus and rail) stratified models and travel energy consumption model by applying the multiple linear regression model based on 108 zones of Fukuoka city in Japan. This study suggested that urban form has a major impact on travel induced energy use in cities. Liu et al. [9] also performed a detailed literature review on urban form, travel, energy consumption, and CO2. They stated that urban form does not have a direct effect on vehicle energy consumption; rather it affects household travel and energy consumption through other channels e.g., households’ socio-economic characteristics (i.e., gender and number of vehicles, and vehicle characteristics). Later, Liu [10] gave insights into the linkages of different aspects of the built environments, travel behaviour, and energy consumption using Structural Equation Modelling (SEM) that provides a powerful analytic framework for a better understanding of the complex relationships of urban form, travel and energy consumption. He found out that urban form does have direct effects on travel distance for all tour types modelled.
Osorio et al. [11] investigated the relationship between selected urban form characteristics and energy consumption in England, in order to understand how one influences the other. This analysis suggested that better energy efficiency is achieved by areas with higher population density, which provides new insights to urban policy-makers and planners seeking to design strategies to cut carbon emissions and energy consumption. Yin et al. [12] studied the influence of urban form on energy consumption through an energy estimation model from a microeconomic perspective. A spatial regression was performed to analyse the relationship between energy efficiency and urban form characteristics in terms of density, diversity, and accessibility.

1.2. Literature on Vertical Mobility and Energy Consumption

Different modelling approaches were applied to calculate energy consumption for vertical mobility. The choice of particular method depends on the overall objective of the research, availability of data as well as scale of analyses.
Some studies collected very detailed information about lift and traffic characteristics on specific buildings to calculate energy consumption of lift during the runtime, without considering the energy consumption during the standby mode e.g., for hospital [13], office building [14], university [15] or any building type [16]. Nipkow et al. [17] performed a calculation based on Swiss standards (SIA 380/4), but did not consider standby energy consumption. Tukia [18] applied two norms e.g., VDI 4707-1 and ISO 25745-2 to categorise lifts according to energy consumption of a lift during its ISO reference cycle, its nominal load, its nominal speed and its power demand during the standby mode.
The study performed by de Almeida et al. [19] was based on European cities. They analysed 81 lift installations (in Italy, Germany, Poland and Portugal), and their energy consumption according to the type of the building (residential, offices, hospitals, industrial, commercial, and hotel) to calculate annual energy consumption. Tukia et al. [20] collected energy consumption data of a lift in an office building for few days and developed a method to extrapolate the data to annual energy consumption of that lift. Bannister [21] established a simple formula to calculate the energy consumption of office buildings in Australia using characteristics of such buildings. Thyssenkrupp [22] developed a web-based tool to calculate energy consumption with inputs such as building and lift characteristics, but with no indication on how the energy is calculated. Some other studies carried out specific or partial calculation e.g., EMSD [23] calculated the handling capacity of a lift.

1.3. Research Gaps

The conducted literature review revealed multiple research gaps:
  • The studies were specific to particular building types and countries. They did not perform at the urban blocks or city scales, rather on a building-by-building basis.
  • Investigation on the relationship between urban form and vertical mobility was not performed.
  • The 3D city models illustrate detailed building geometry and form, which help to develop a more realistic model. None of the studies performed analyses based on the 3D city models.
  • The methods were mostly based on real consumption, so generic model-based calculation was not possible.
  • Some studies were carried out without any reference to national or international standards.
  • In most cases, the validation of the modelling results was not performed.
  • Some studies did not calculate energy consumption during the standby mode. Earlier research revealed that the standby model consumes a significant percentage of the total energy consumption. For example, Hui et al. [24] collected lift energy consumption data of 21 lift units and found out that the standby consumption represented around 10.4% to 98.5% of the total lift electricity consumption.
This study aims to overcome the research gaps and propose a generic method to calculate the energy consumption of lifts in selected urban morphologies in different Asian cities. A tool is implemented in a spreadsheet programme, which is easy to use and can be adaptable to other urban blocks and cities.

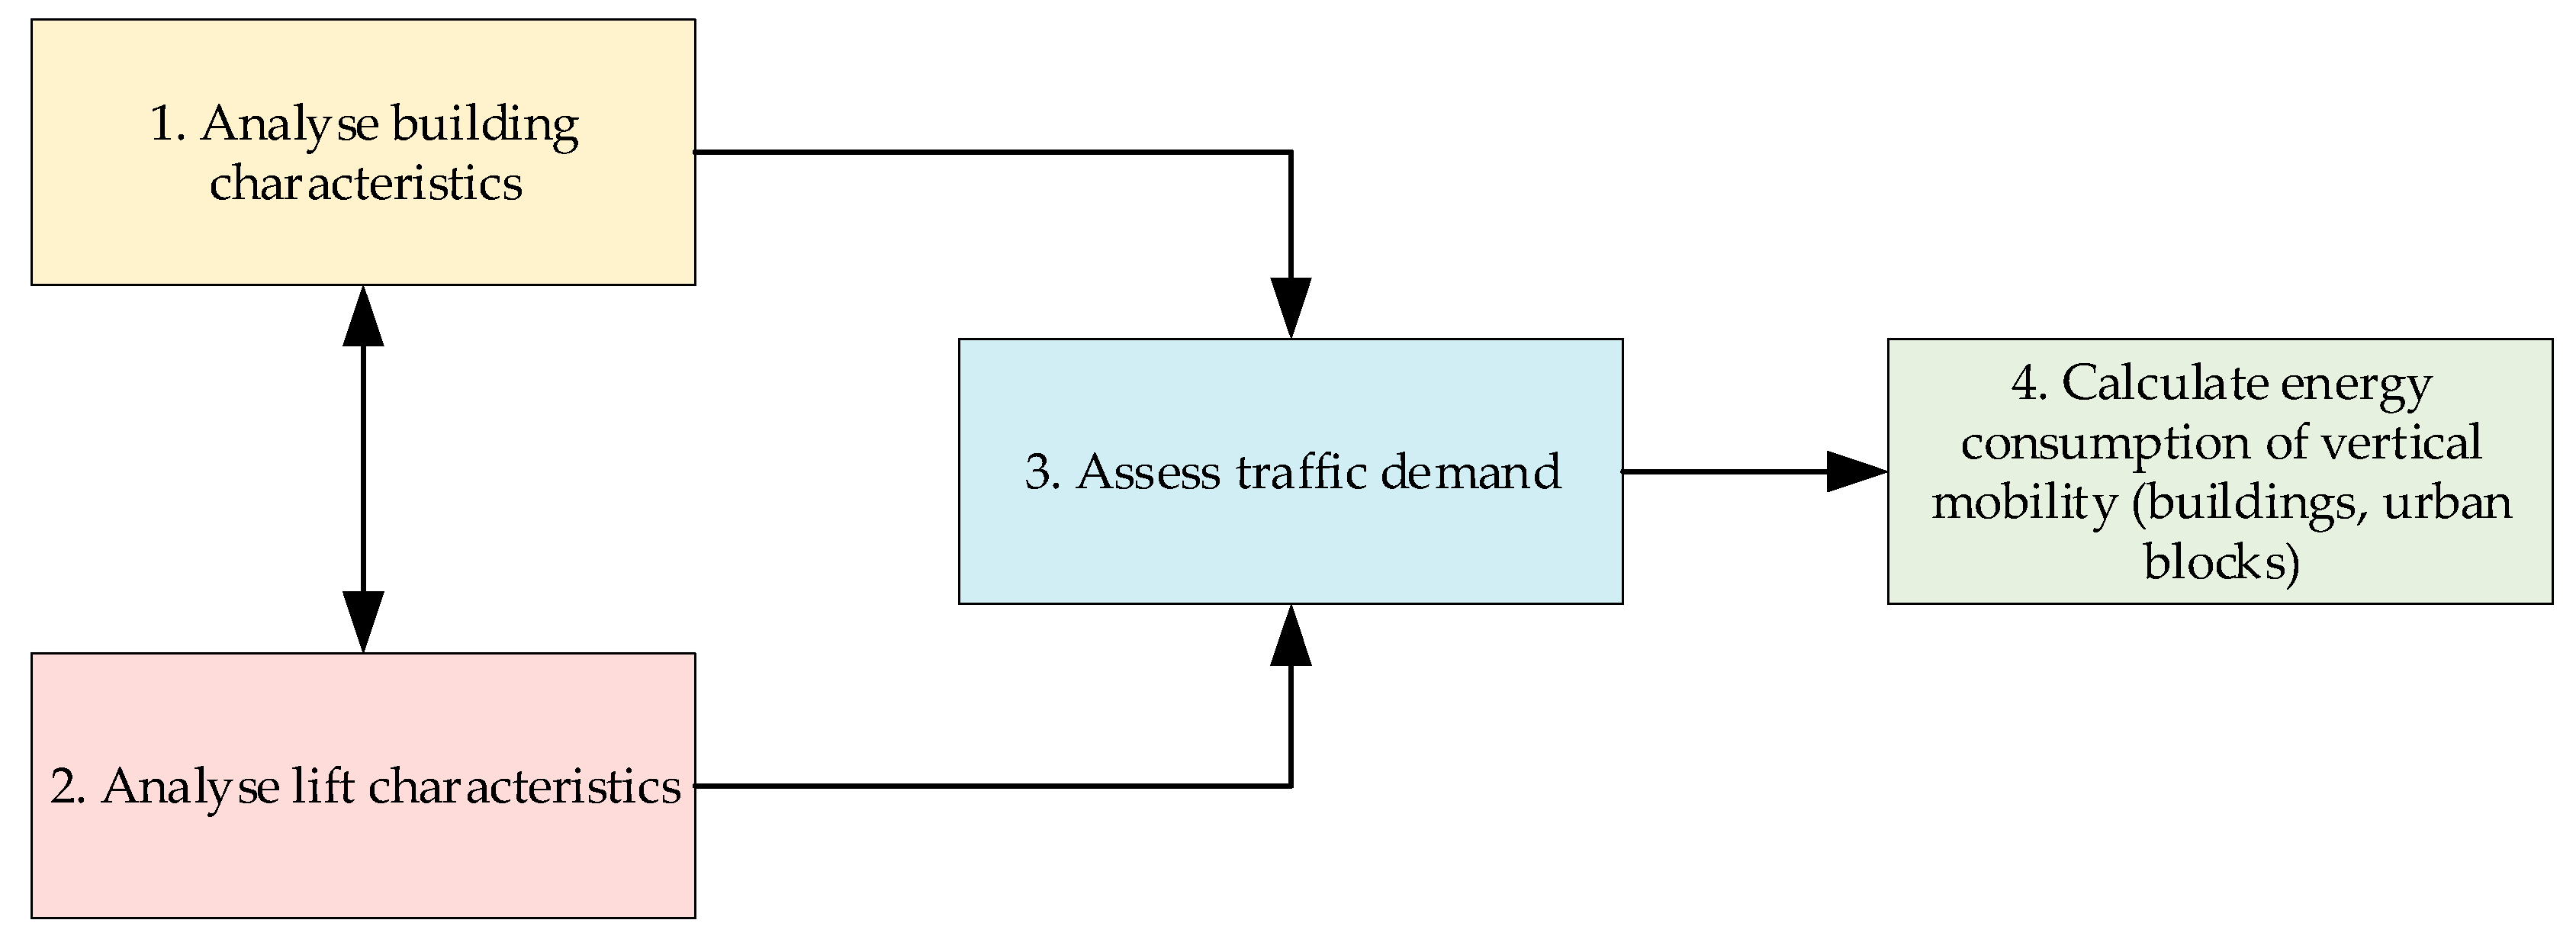
2. Description of Methodology

The proposed method is based on the extensive literature review e.g., [19,25], codes of practice, ISO/DIS 25745-1 standards [26] and 3D city models. It can be divided into four main components (Figure 1).

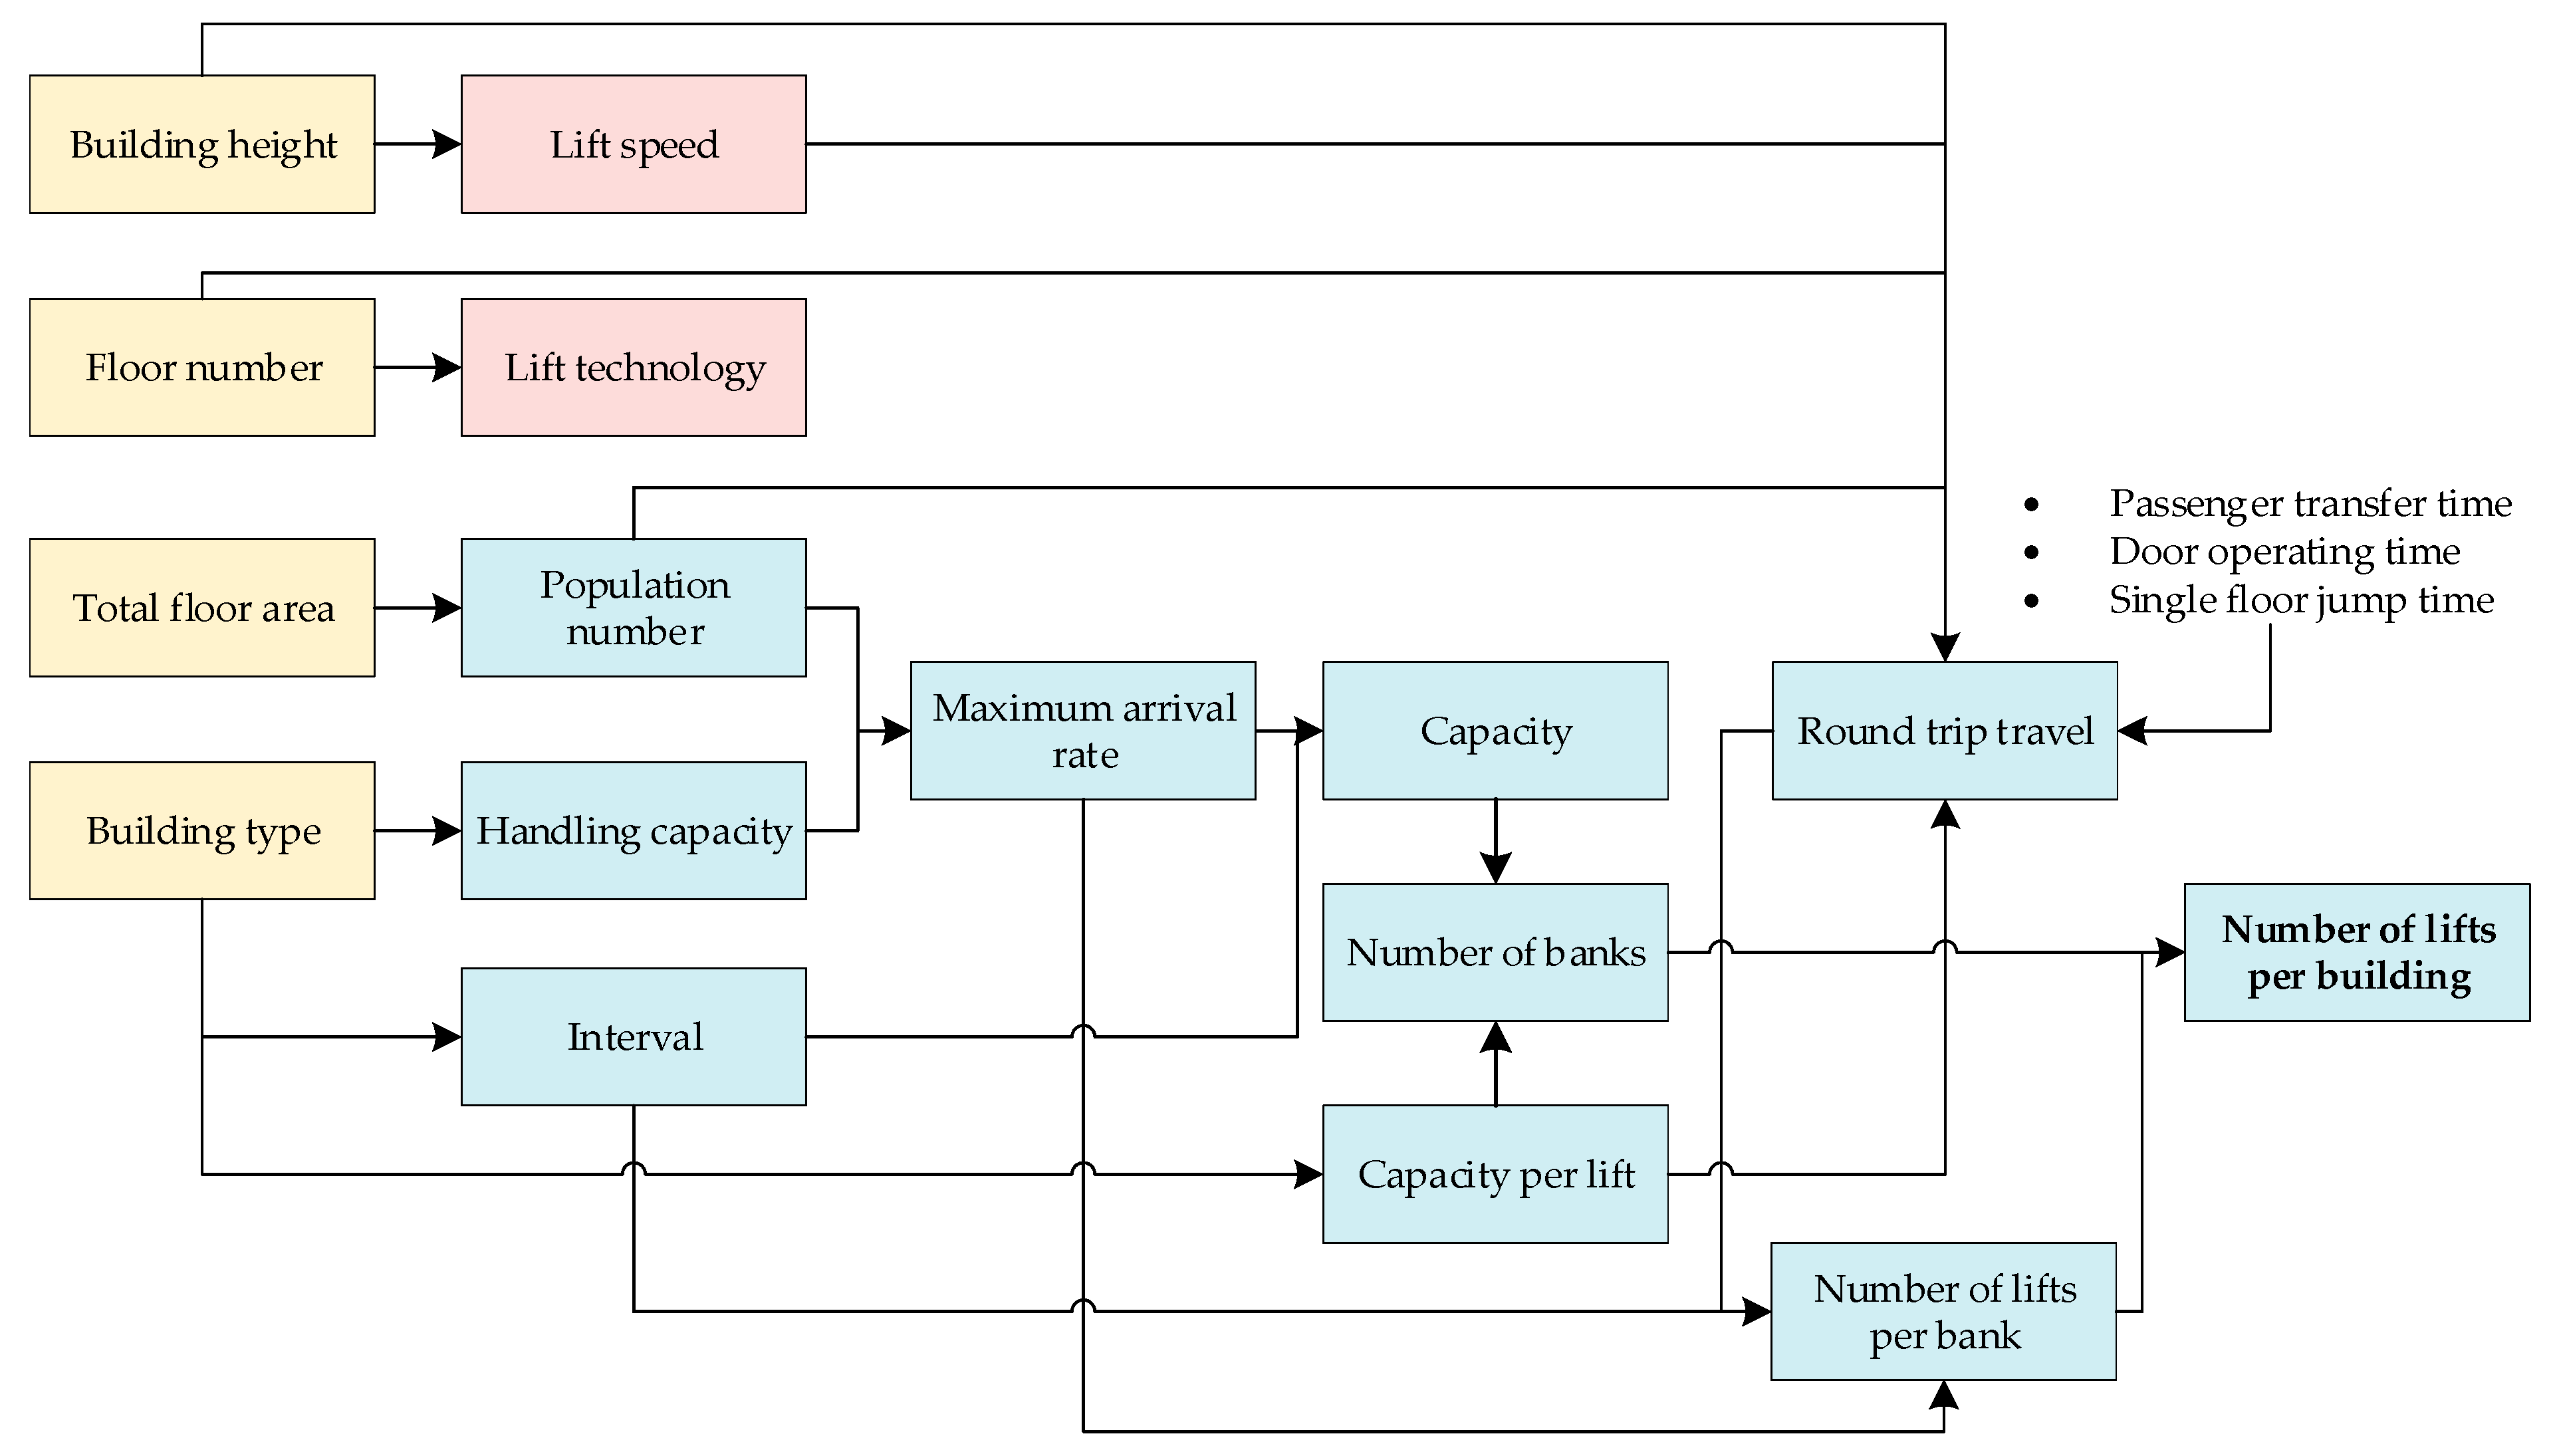
2.1. Building Characteristics

Energy consumption of lifts due to vertical mobility depends on the type, height, number of floors and floor area of the buildings. In this study, we consider five building types e.g., offices, residential buildings, hotels, hospitals, and commercial buildings. The height information is required to calculate the duration of a lift trip, from the bottom to the top, whereas the number of floors in each building is required to estimate the type of lift technology used. The floor area is calculated by multiplying the number of floors with the surface area of the ground floor.

2.2. Lift Characteristics

Certain lift characteristics e.g., technology and speed (including building characteristics) influence the total number of trips made by a lift. The lift technology installed in a building is determined according to the number of floors. Three types of lifts are primarily installed in buildings: hydraulic, traction geared and traction gearless. Possible applications, advantages and disadvantages of these technologies are explained in de Almeida, Patrão [19], (pp. 9–15). Choices between the use of hydraulic and geared traction technology cannot be clearly defined at urban scale without the detailed data. For the calculation, it is assumed that the buildings having less than 5 floors use hydraulic lifts, between 6 and 24 use traction geared and above 25 use traction gearless lifts. The Speed of the lift is determined according to the height of the building [23], (p. 16). Finally, the number of trips per year is considered as the same as the average number of trips per year, which is determined considering the building category and lift technology used [19], (p. 57).

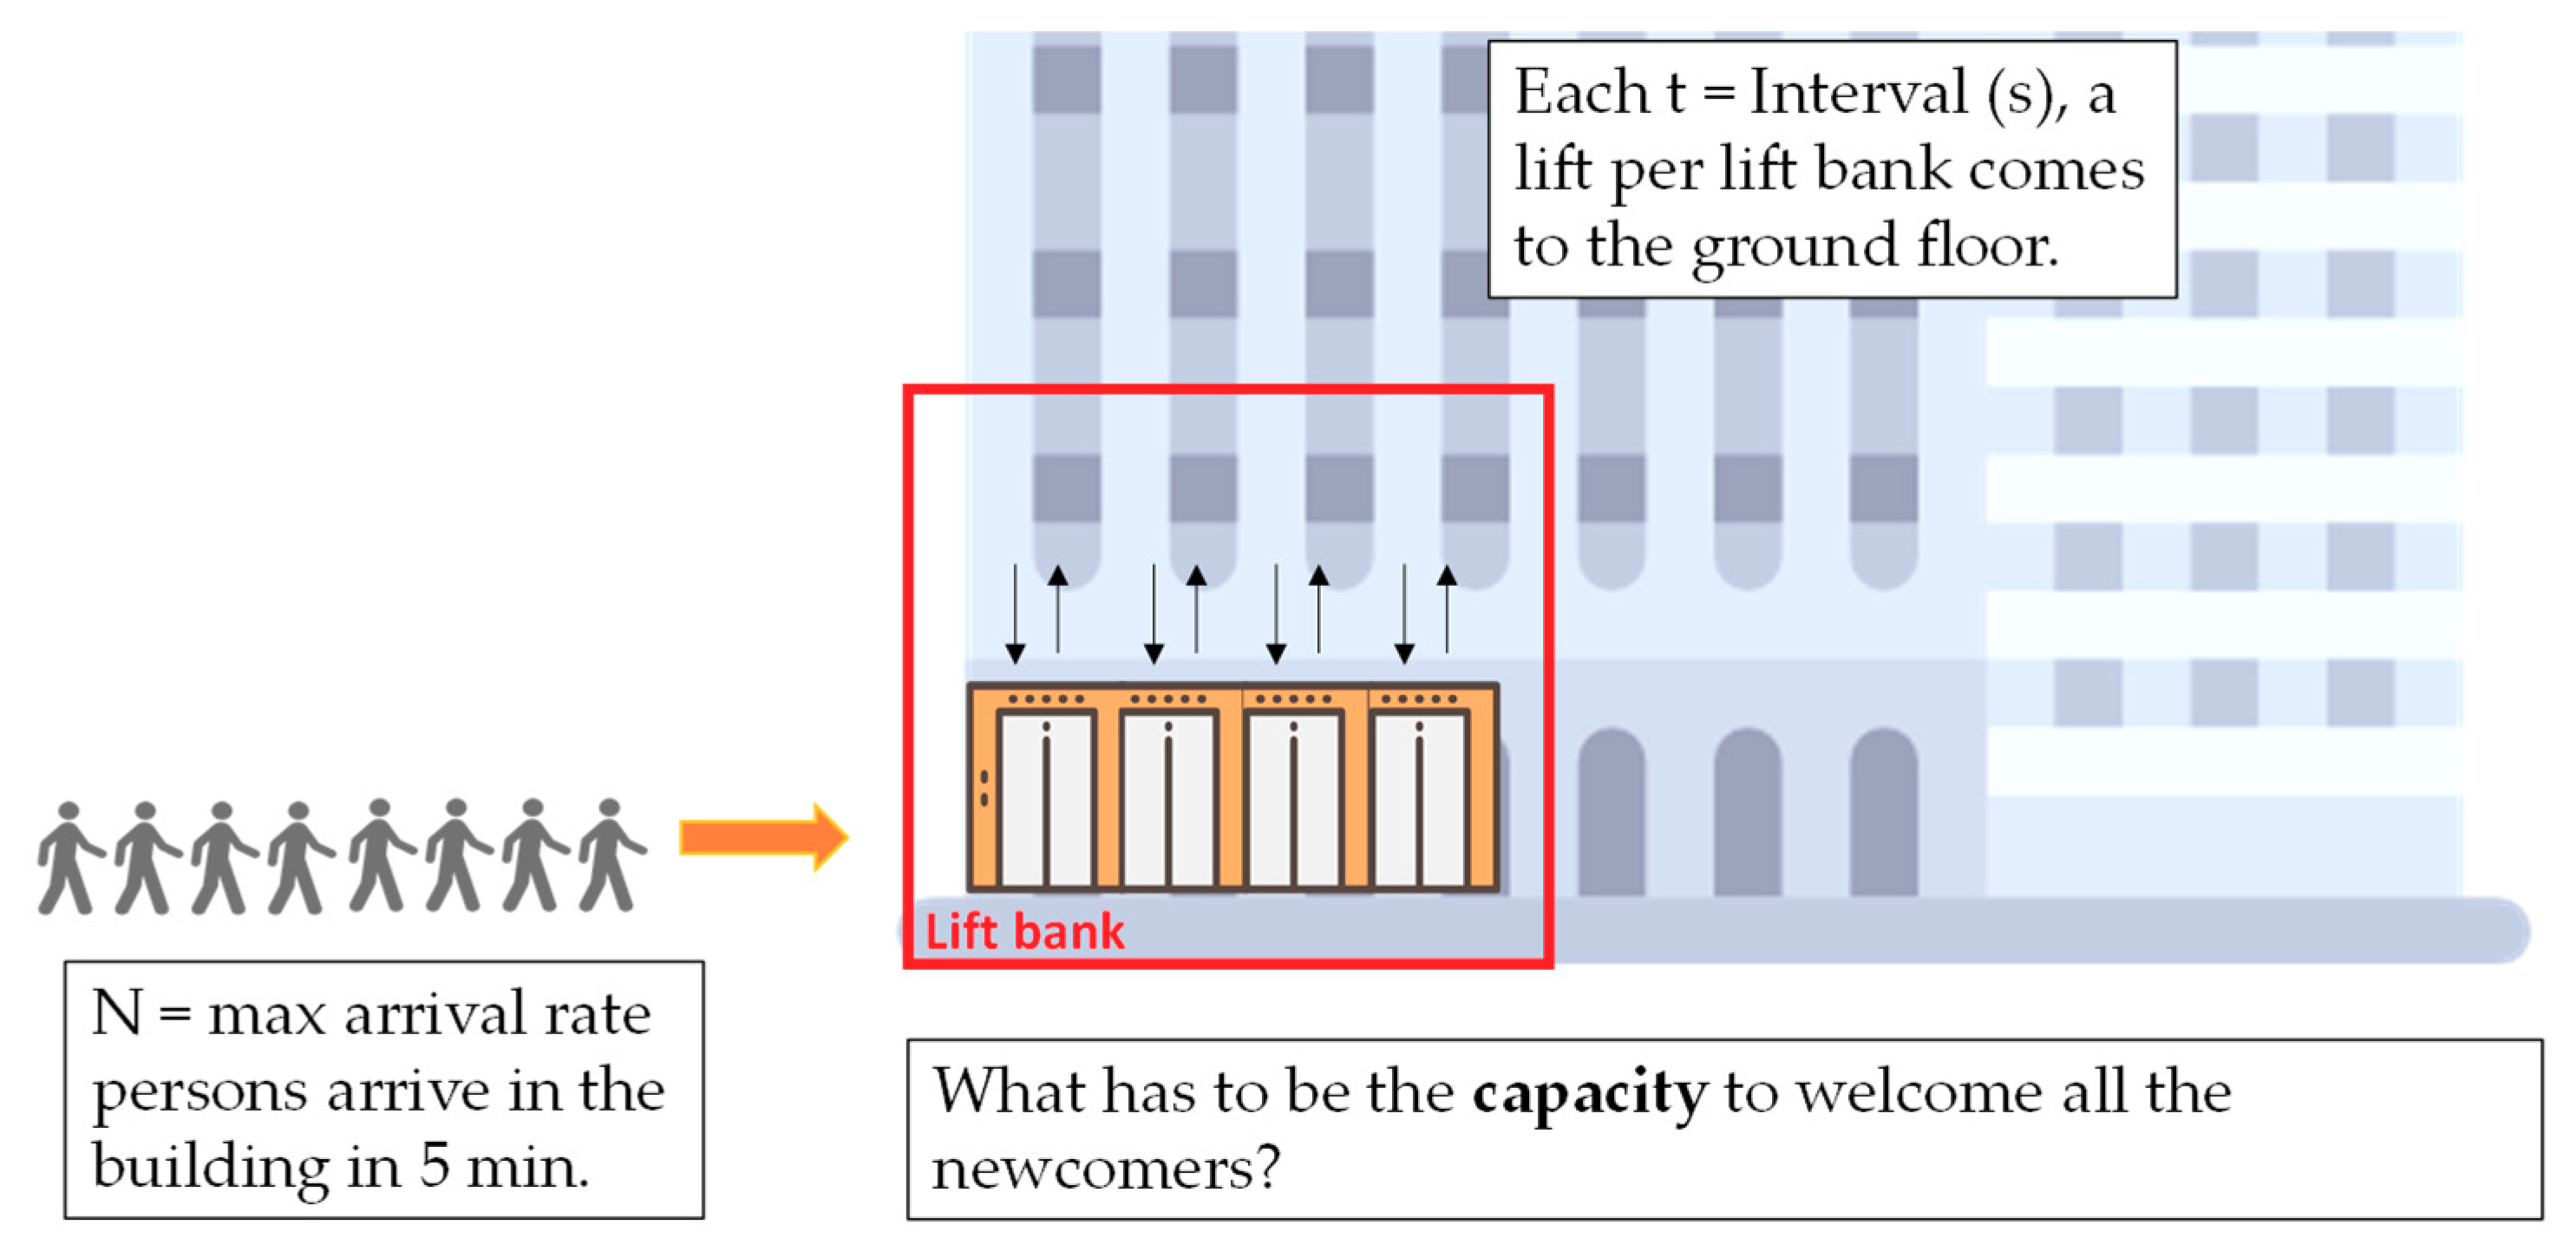
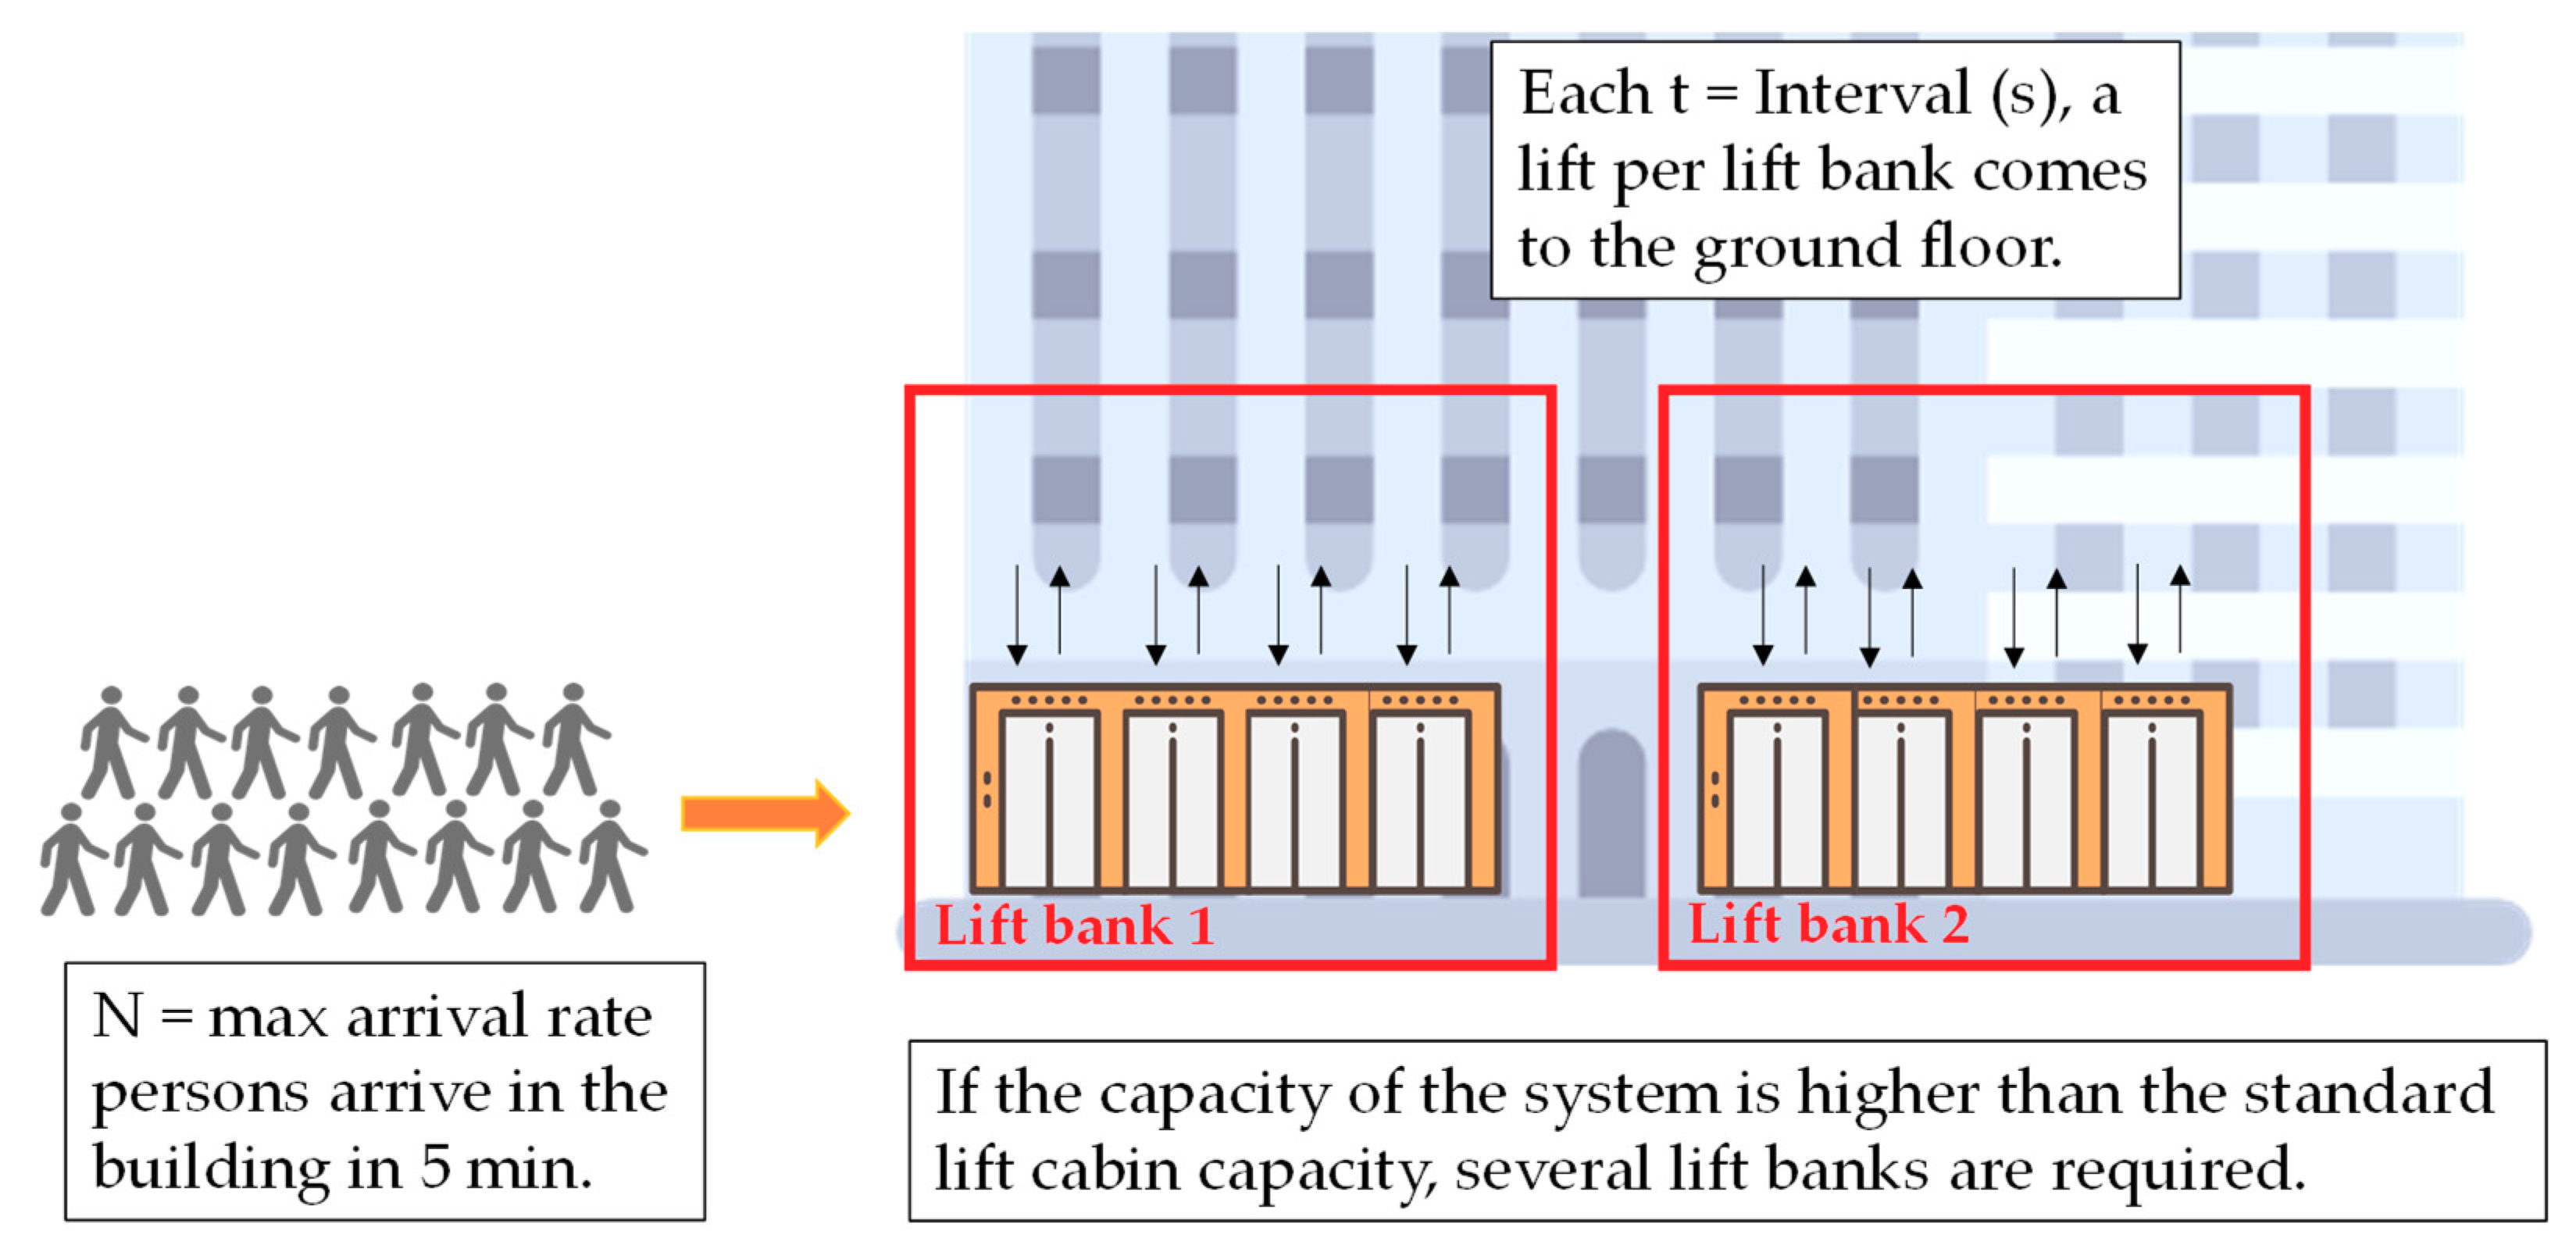
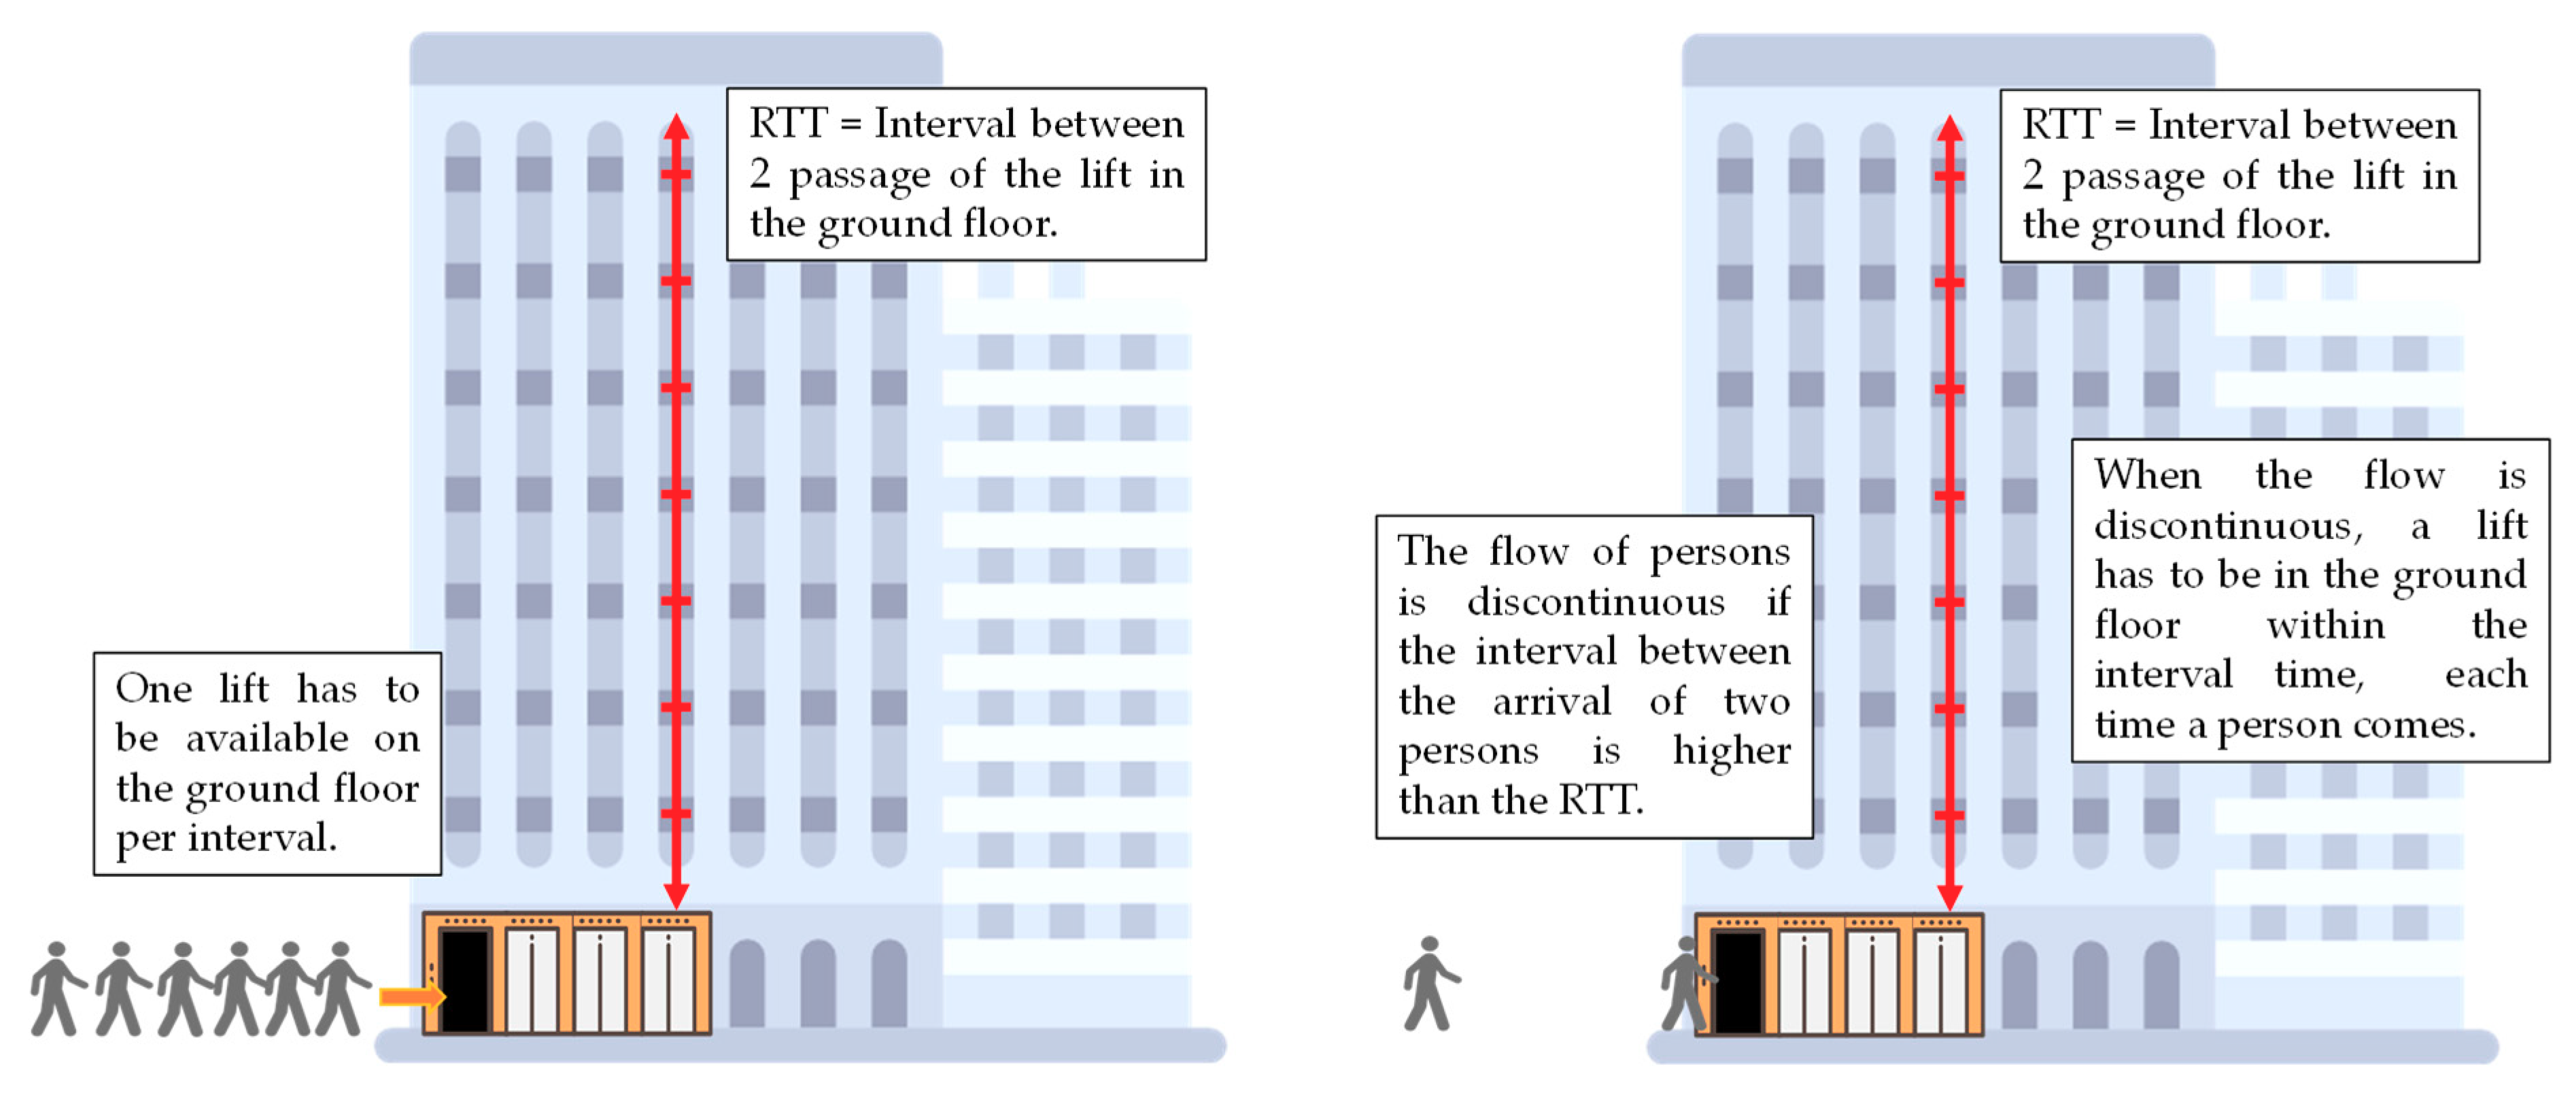
2.3. Traffic Demand Analysis

Traffic demand (i.e., number of lifts in a building) is calculated based on the building and lift characteristics as well as the assumptions on the use of lifts in buildings. Figure 2 illustrates the methodological steps for traffic demand analysis.
At first, the total population of a building is determined according to the ratio between total floor area and maximum floor area allowance per occupant. Maximum floor area allowance per occupant is dependent on the building type. The handling capacity determines the percentage of total population of the building that can be transported by the lift in 5 min. The handling capacity of an office building is higher than a residential building, due to transportation of a large percentage of persons e.g., during the opening, lunch breaks and closing hours of the office. It depends only on the building category (not on its characteristics and size). The tool considers the average of the range of values suggested in Siikonen [27], (Table 1).
Then the maximum arrival rate (i.e., the number of people, who wants to take the lift during up-peak traffic hours within five minutes) is calculated by multiplying the handling capacity with population. Interval (i.e., the time people wait before getting a lift during up-peak hours) is defined after literature [27], (Table 1). It depends only on the category of the building and not on its characteristics and its size. Capacity is the number of people that have to be transferred at the same time by the lift system of the building (Figure 3). It is deduced from the maximum arrival rate and the interval [23], (p. 25).
C a p a c i t y = m a x   a r r i v a l   r a t e 300 × i n t e r v a l
Capacity per lift is the maximum number of people who can be in one lift car. de Almeida, Patrão [19] (p. 57) suggests the values of the capacity per lift in kilograms. If the capacity needed by the building is higher than standard capacity, several lifts have to be at the ground floor per interval (Figure 4). This determines the number of lift banks [23], (p. 25).
N u m b e r   o f   l i f t   b a n k s = t r u n c ( C a p a c i t y   ( n e e d e d   b y   t h e   s y s t e m ) C a p a c i t y   p e r   l i f t ) + 1
Round time travel (RTT) is the average duration during up-peak time of one cycle of a lift. It includes the time taken for the travel to/from the highest reversal floor at contract speed plus the delay for each stop, plus the time for the passengers to load/unload [28]. It is calculated in the following manner [23], (p. 25).
R T T = 2 × H × t v + ( S + 1 ) × t s + 2 × P × t p
where,
  • H : highest reversal floor, approximated by the top floor [23], (p. 25)
  • t v : interfloor/single floor jump time (in s) is the time required to travel between two adjacent floors. It is calculated by dividing the height of one floor (by diving the height of the building with the number of floors) with the speed of the lift [17], (p. 57)
  • S : number of stops of the lift car during its round trip [23], (p. 25)
  • t s : operating time is 3 s.
  • P : number of passengers in the lift car [21], (p. 25)
  • t p : passenger transfer time (per passenger) is 1.2 s.
Number of lift cars per lift bank depends on the round trip travel, the interval, and the maximal arrival rate [23], (p. 25). To find the number of lift banks, we have considered that a lift car per lift bank will land at the floor each interval time. Then, there are two different cases occur:
Case 1—The flow of comers is continuous during up-peak hours (Figure 5, left). Each time a lift arrives at the ground floor, there are newcomers waiting for it. It means that
300 m a x   a r r i v a l   r a t e i n t e r v a l
n u m b e r   o f   l i f t   c a b i n s   p e r   l i f t   b a n k = t r u n c ( R T T i n t e r v a l ) + 1
In this case, the number of lift cars per lift bank depends on the round-trip travel, and the interval.
Case 2—The flow of comers is discontinuous during up-peak hours (Figure 5, right). Indeed, in narrow buildings (with low floor area), the number of people is low. In this study, the Central Business District (CBD) typology in Hong Kong fits to Case 2.
Even by considering the maximum arrival rate, the interval between two comers is higher than the waiting interval. It means that
300 m a x   a r r i v a l   r a t e > i n t e r v a l
In this, the number of lift cars also depends of the interval between two comers = 300 m a x   a r r i v a l   r a t e and the formula on number of lift cabin has to be adapted as
n b   l i f t   c a b i n e s = t r u n c ( m a x   i n t e r v a l 300 × ( R T T i n t e r v a l ) ) + 1
Then the number of lifts is calculated by multiplying the number of lift banks by the number of lift cars per lift bank.
n u m b e r   o f   l i f t = n u m b e r   o f   l i f t   p e r   l i f t   b a n k × n u m b e r   o f   l i f t   b a n k

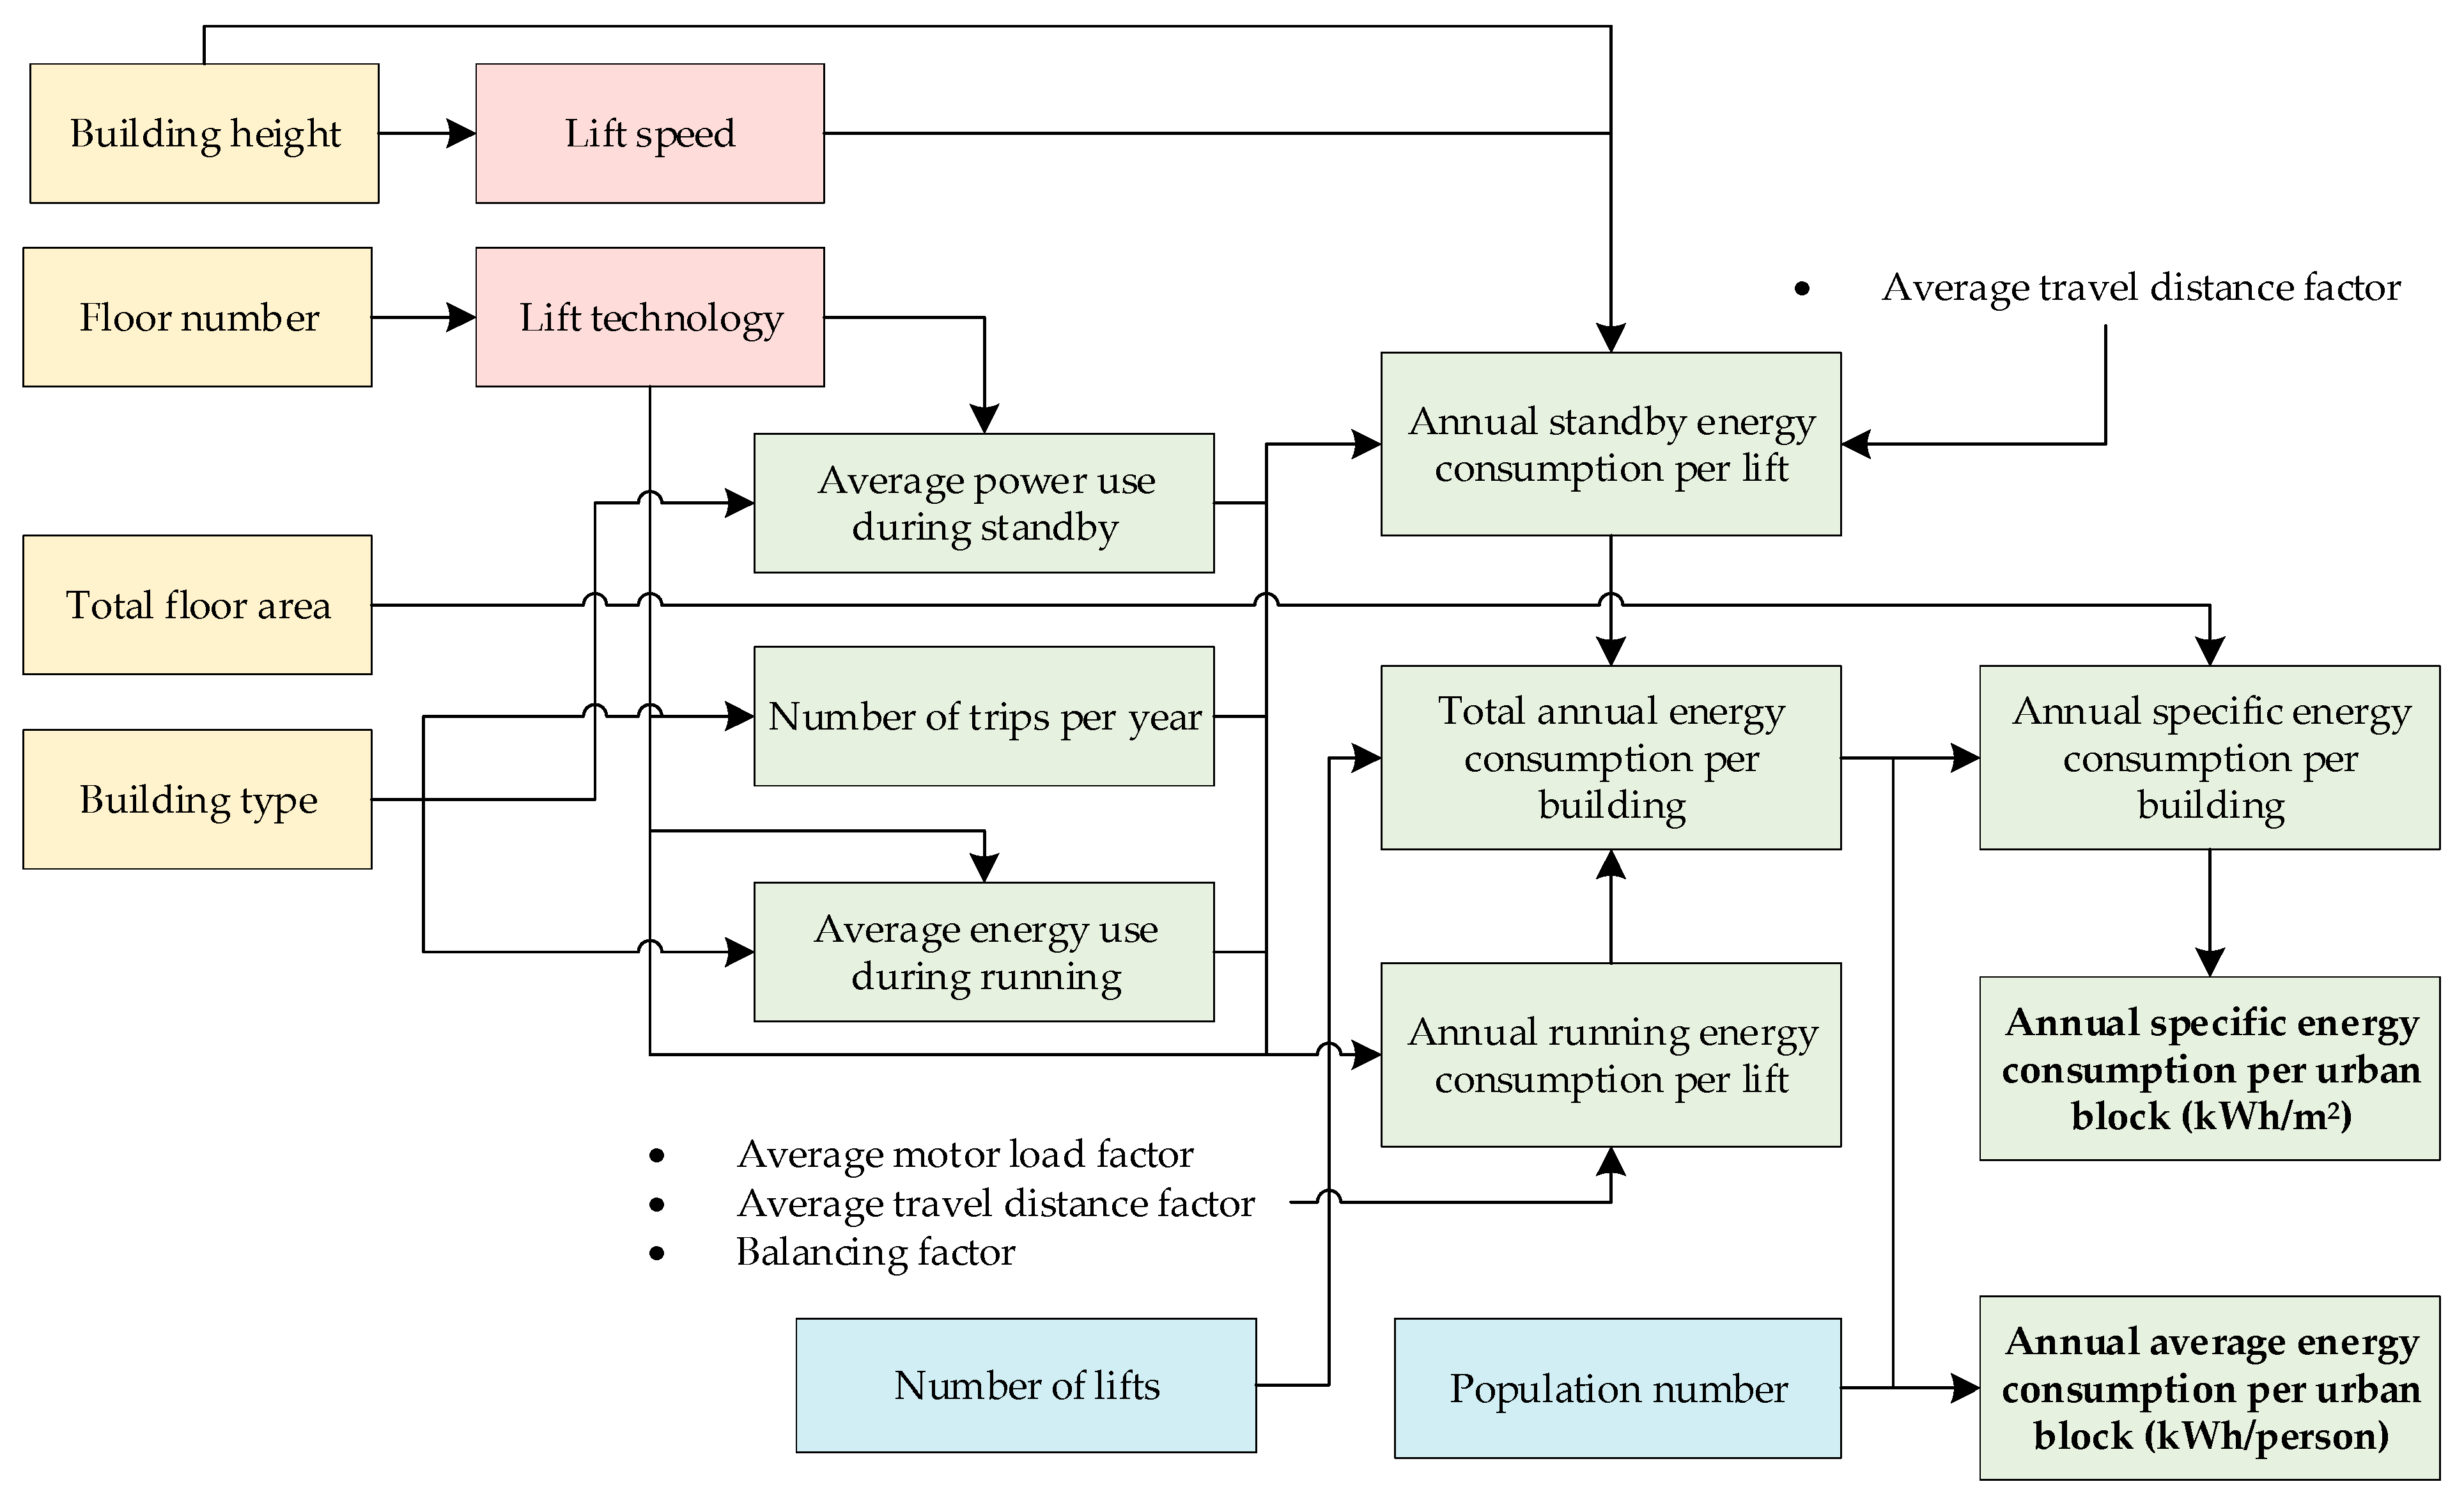
2.4. Energy Consumption Calculation

Annual energy consumption of the lift system can be estimated by summing the energy used during running and standby modes. The methodological steps and corresponding variables are explained in Figure 6.

2.4.1. Energy Consumption during Running Mode

(a) Average energy consumption during running mode (Wh)
The norm ISO 25745-2 specifies the definition of a reference cycle and its energy consumption [29]. The reference trip cycle is an empty car trip up and then down between terminal floors. It includes the opening and closing of the doors and all the energy consumed by the lift including lights, fans, alarms, Closed-circuit television (CCTV), etc. Energy consumption per cycle is calculated based on building category and lift technology. The average value of energy consumption per cycle for each lift technology and building type is considered from [19], (p. 78).
The energy consumption per cycle is unique to each lift (depending on its maintenance schedule, age, characteristics, etc.). It also depends on the building characteristics such as the height of the building.
(b) Annual energy consumption during running mode per lift (kWh)
The methodology used to determine the annual energy used for travelling per lift is adapted after [19,26].
E l i f t   t r a v e l = c a m l × c a t d × E c y c l e × 2 × ( 1 c b a l ) 1000 × n t r i p
where,
  • c a m l : average motor load factor is the ratio between the average motor load and the maximum possible motor load. It depends of the lift technology [19], p. 64
  • c a t d : average travel distance factor depends on how often the lift stops during a trip between terminal floors, and the number of lifts in the building. Lifts are considered to have more than two stops [19], (p. 65)
  • c b a l : balancing factor considers the defect of the counterweight, when the technology used for the lift is traction [19], (p. 65)
  • n t r i p : number of trips per year [19], (p. 65)

2.4.2. Energy Consumption during Standby Mode

(a) Average power consumption during standby mode (Wh)
During the standby model, the lift consumes some energy (e.g., emergency lighting). Therefore, a power use during standby mode is attributed to each lift according to building category and lift technology. The power use during standby mode is unique to each lift (depending on its maintenance, age, characteristics, etc.) and is considered from [19], (p. 79).
(b) Annual energy consumption during standby mode per lift (kWh)
The methodology used to determine the yearly energy used for stand-by per lift is adapted after [19,26].
E s t a n d   b y = ( 8760   h 1   y c a t d × h × n t r i p v × 1   h 3600   h ) × 1   k W 1000   W × P s t a n d b y
where,
  • c a t d : average travel distance factor depends on how often the lift stops during a trip between terminal floors, and the number of lifts in the building. Lifts are considered to have more than two stops [19], (p. 65)
  • h: height of the building
  • n t r i p : number of trips of the lift per year [19], (p. 57)
  • v : speed of the lift [19], (p. 57)
  • P s t a n d b y : power used by the lift when it is on “standby” mode [19], (p. 57)

2.4.3. Total Energy Consumption

Total annual energy consumption per building (kWh) is calculated by summing the energy consumption during running and standby mode of lift and then multiplying by the number of lifts in a building.
A n n u a l   e n e r g y   c o n s u m p t i o n   p e r   b u i l d i n g   ( k W h ) = n b   o f   l i f t s × ( a n n u a l   e n e r g y   u s e d   f o r   t r a v e l l i n g   p e r   l i f t + a n n u a l   e n e r g y   u s e d   f o r   s t a n d   b y   p e r   l i f t )
Annual specific energy consumption per building is then calculated by dividing the annual energy consumption for lifts (kWh) by the total gross floors area of the building.
A n n u a l   s p e c i f i c   e n e r g y   c o n s u m p t i o n   p e r   b u i l d i n g   ( k W h m 2 ) = A n n u a l   e n e r g y   c o n s u m p t i o n   p e r   b u i l d i n g   ( k W h ) T o t a l   f l o o r   a r e a   o f   t h e   b u i l d i n g
Finally, annual specific energy consumption per urban block (Equation (13)) can be calculated by summing the annual specific energy consumption of each building and then dividing by the total number of buildings in that block. We also calculated annual average energy consumption in each of the urban blocks (Equation (14)) by diving the total annual energy consumption by the number of people living in the buildings to illustrate a different perspective of the obtained result.
A n n u a l   s p e c i f i c   e n e r g y   c o n s u m p t i o n   p e r   u r b a n   b l o c k   ( k W h m 2 ) = i b u i l d i n g A n n u a l   s p e c i f i c   e n e r g y   c o n s u m p t i o n   p e r   b u i l d i n g i   ( k W h m 2 ) N b   o f   b u i l d i n g s
A n n u a l   a v e r a g e   e n e r g y   c o n s u m p t i o n   p e r   u r b a n   b l o c k   ( k W h p e r s o n ) = i b u i l d i n g A n n u a l   e n e r g y   c o n s u m p t i o n   p e r   b u i l d i n g i   ( k W h ) N b   o f   p e r s o n

3. Implementation of Method

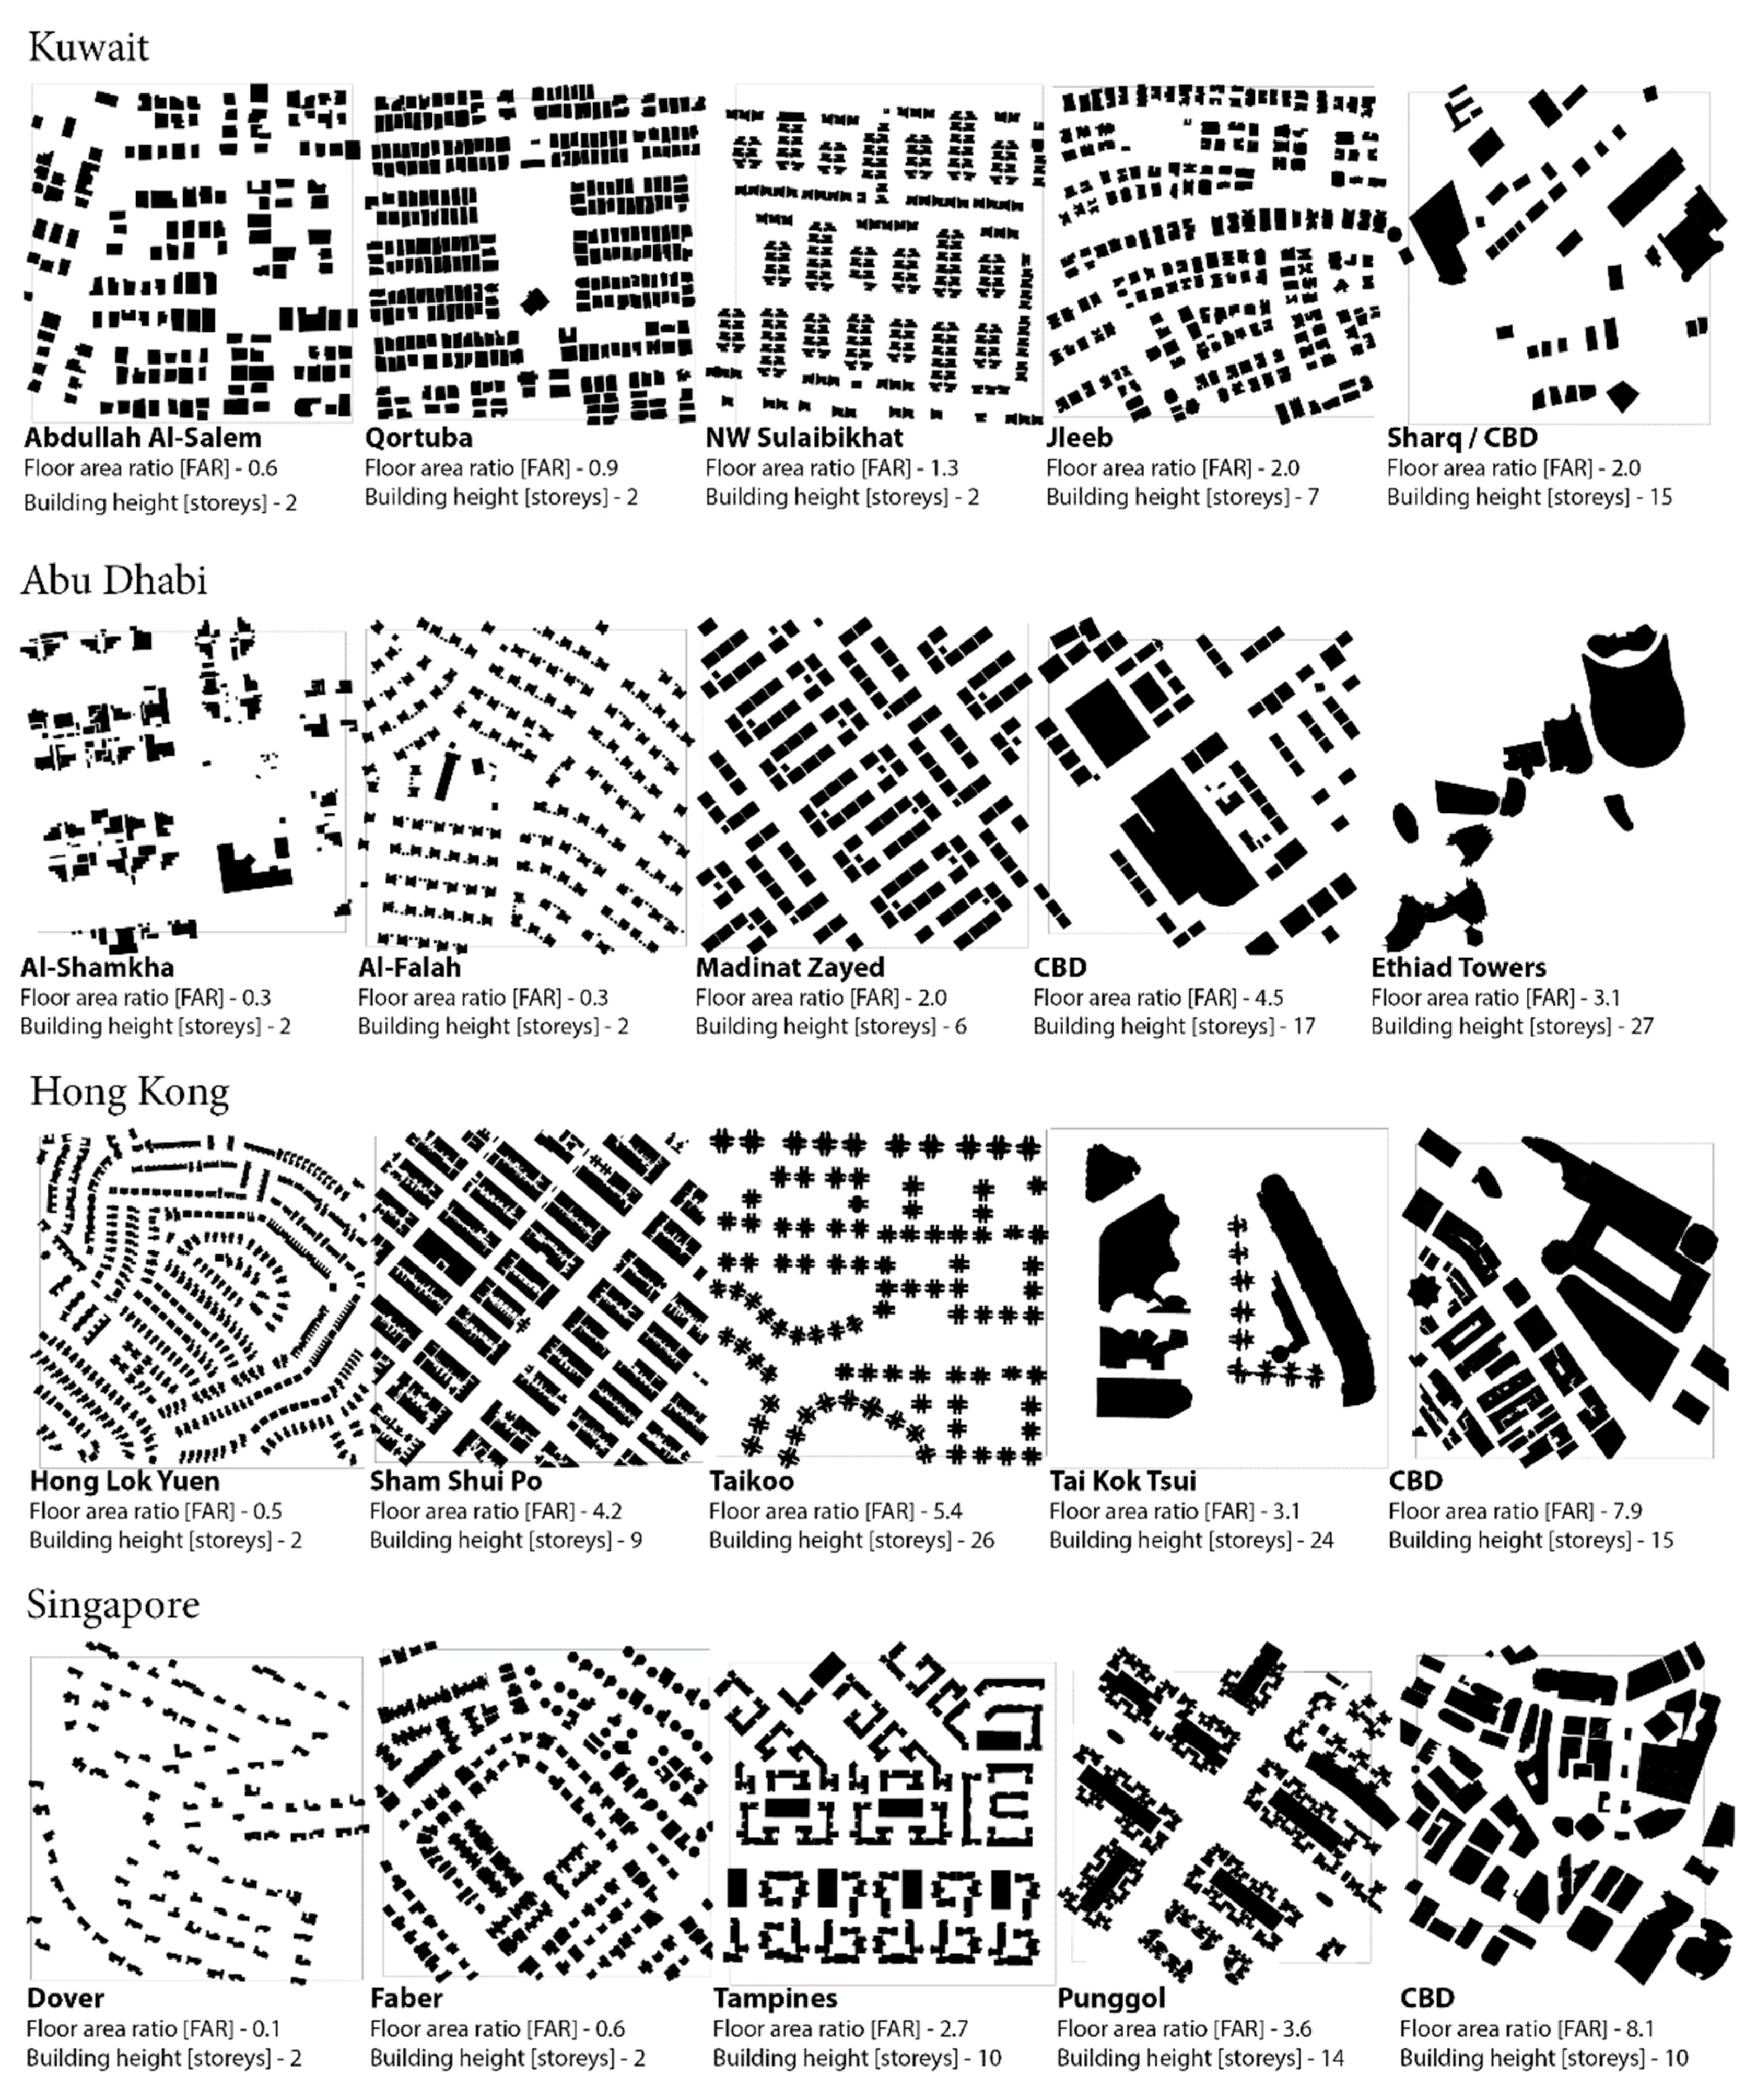
3.1. Selected Urban Morphologies

The proposed method is applied in 20 representative urban morphologies in Kuwait, Abu Dhabi, Hong Kong and Singapore. They were established within the framework of the Resource Urbanisms project and with the participation of respective local government and institutes, local project partners and experts [30]. The morphologies represent real urban patterns at a scale of 500 × 500 m, with a focus on neighbourhood design, streets, building configurations and types. They were defined using information on the building footprint, building height and number of floors. Therefore, five distinct urban forms were identified in each city, based on the most generic features of real building configurations. They included villas, mixed use/residential apartments, CBD and iconic buildings (Figure 7). As in real urban areas, these typologies mostly coexist with different types. Therefore, the samples, except for the CBD’s were enlarged for the full sample area so that the urban form used for all calculations can be seen as an idealised urban form of the respective type.

3.2. Required Data

Four different categories of data and multiple variables are required to analyse vertical mobility and to calculate energy consumption for the lifts (Table 1). The data on building characteristics (e.g., number of floors, height, uses, etc.) are collected through surveys and literature review. The 3D city models of selected urban blocks are created from the building footprints according to the approach suggested in Wendel et al. [31]. In this regard, standardised CityGML format at the Level of Detail 1 (LOD1, having flat roof structure) is chosen as input building data. A more detailed explanation of the use and application of various CityGML data is given in [32,33,34].
The data on lift characteristics (e.g., technology, speed, number of trips), traffic analysis (e.g., population, handling capacity, maximum arrival rate, etc.) and average energy consumption of lift (average consumption per trip, stand-by mode, etc.) are collected from the literature review. Based on these input values and other assumptions, annual energy consumption of lift in each building and in each urban block is calculated. A detailed description of the different variables and sources is given in Table 1. The summary of values chosen for different variables according to building category and lift technology is also explained in Table A1 in Appendix A.

3.3. Assumptions

The calculation is performed based on the building types (e.g., commercial, office, residential, etc.) existing in the database. Buildings having no type information are considered as residential buildings, whereas buildings in CBD typology are assumed offices. In general, within one building category, similar types of buildings are assumed to exist. In three typologies (Punggol, Tampines and Sharq), some multi-floors car parks are available. Therefore, a car park type has been added to the calculation and the data concerning car park lifts are extracted from Nipkow and Schalcher [17].
Throughout all typologies, it is assumed that the buildings having less than 3 floors (plus ground floor) and the individual houses (e.g., detached) do not contain a lift. However, in the case of Kuwait, the detached houses of the villa type having at least 2 floors (plus ground floor) typically contain a lift. These assumptions are made due to the superior comfort conditions existing in Kuwait and Abu Dhabi villas. However, the villas in Abu Dhabi are mostly composed of 1 or 2 floors, thereby no lifts are assumed in the corresponding typology. Buildings having 5 floors or less are assumed to be equipped with hydraulic lifts, between 6 and 25 floors with geared lifts and with 26 floors or more equipped with gearless lifts. The number of floors of the building is assumed equal to the number of floors accessible by lift and all the floors have the same area as the ground floor.
The height of a building is assumed as the height of the elevator shaft. We consider only one height value for a building: in case of high-rise buildings, the podium and the tower are considered as two separate buildings.
The number of trips per year varies a lot from one building to another (depending on its use and characteristics) and is difficult to estimate accurately. Buildings in Europe are different from the ones considered in this project, therefore, the real number of trips per year can differ. Finally, the capacity per lift is based on the average capacity of European buildings and may differ in other Asian buildings.

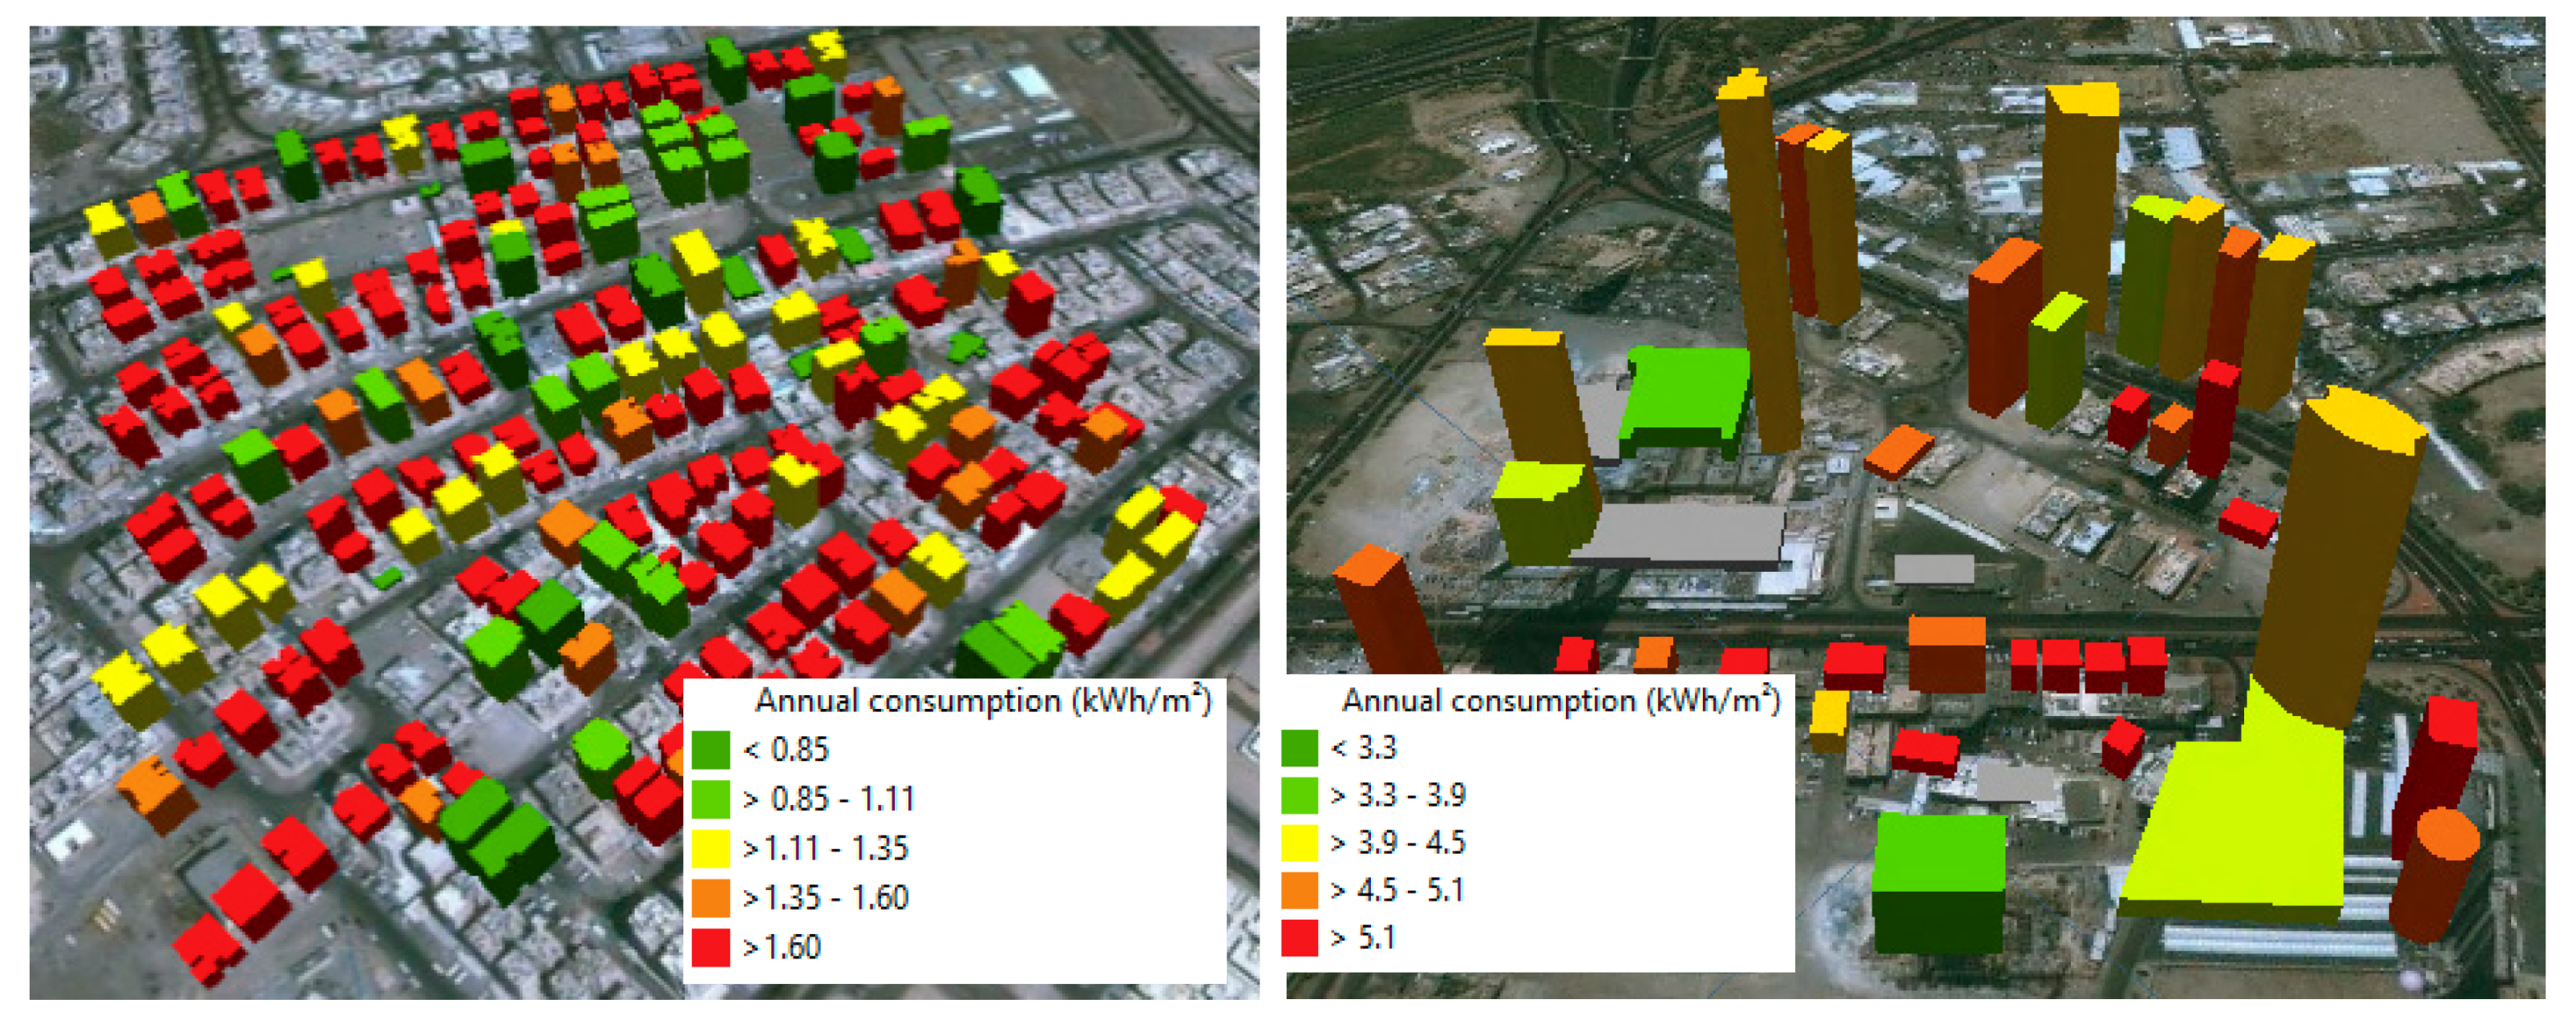
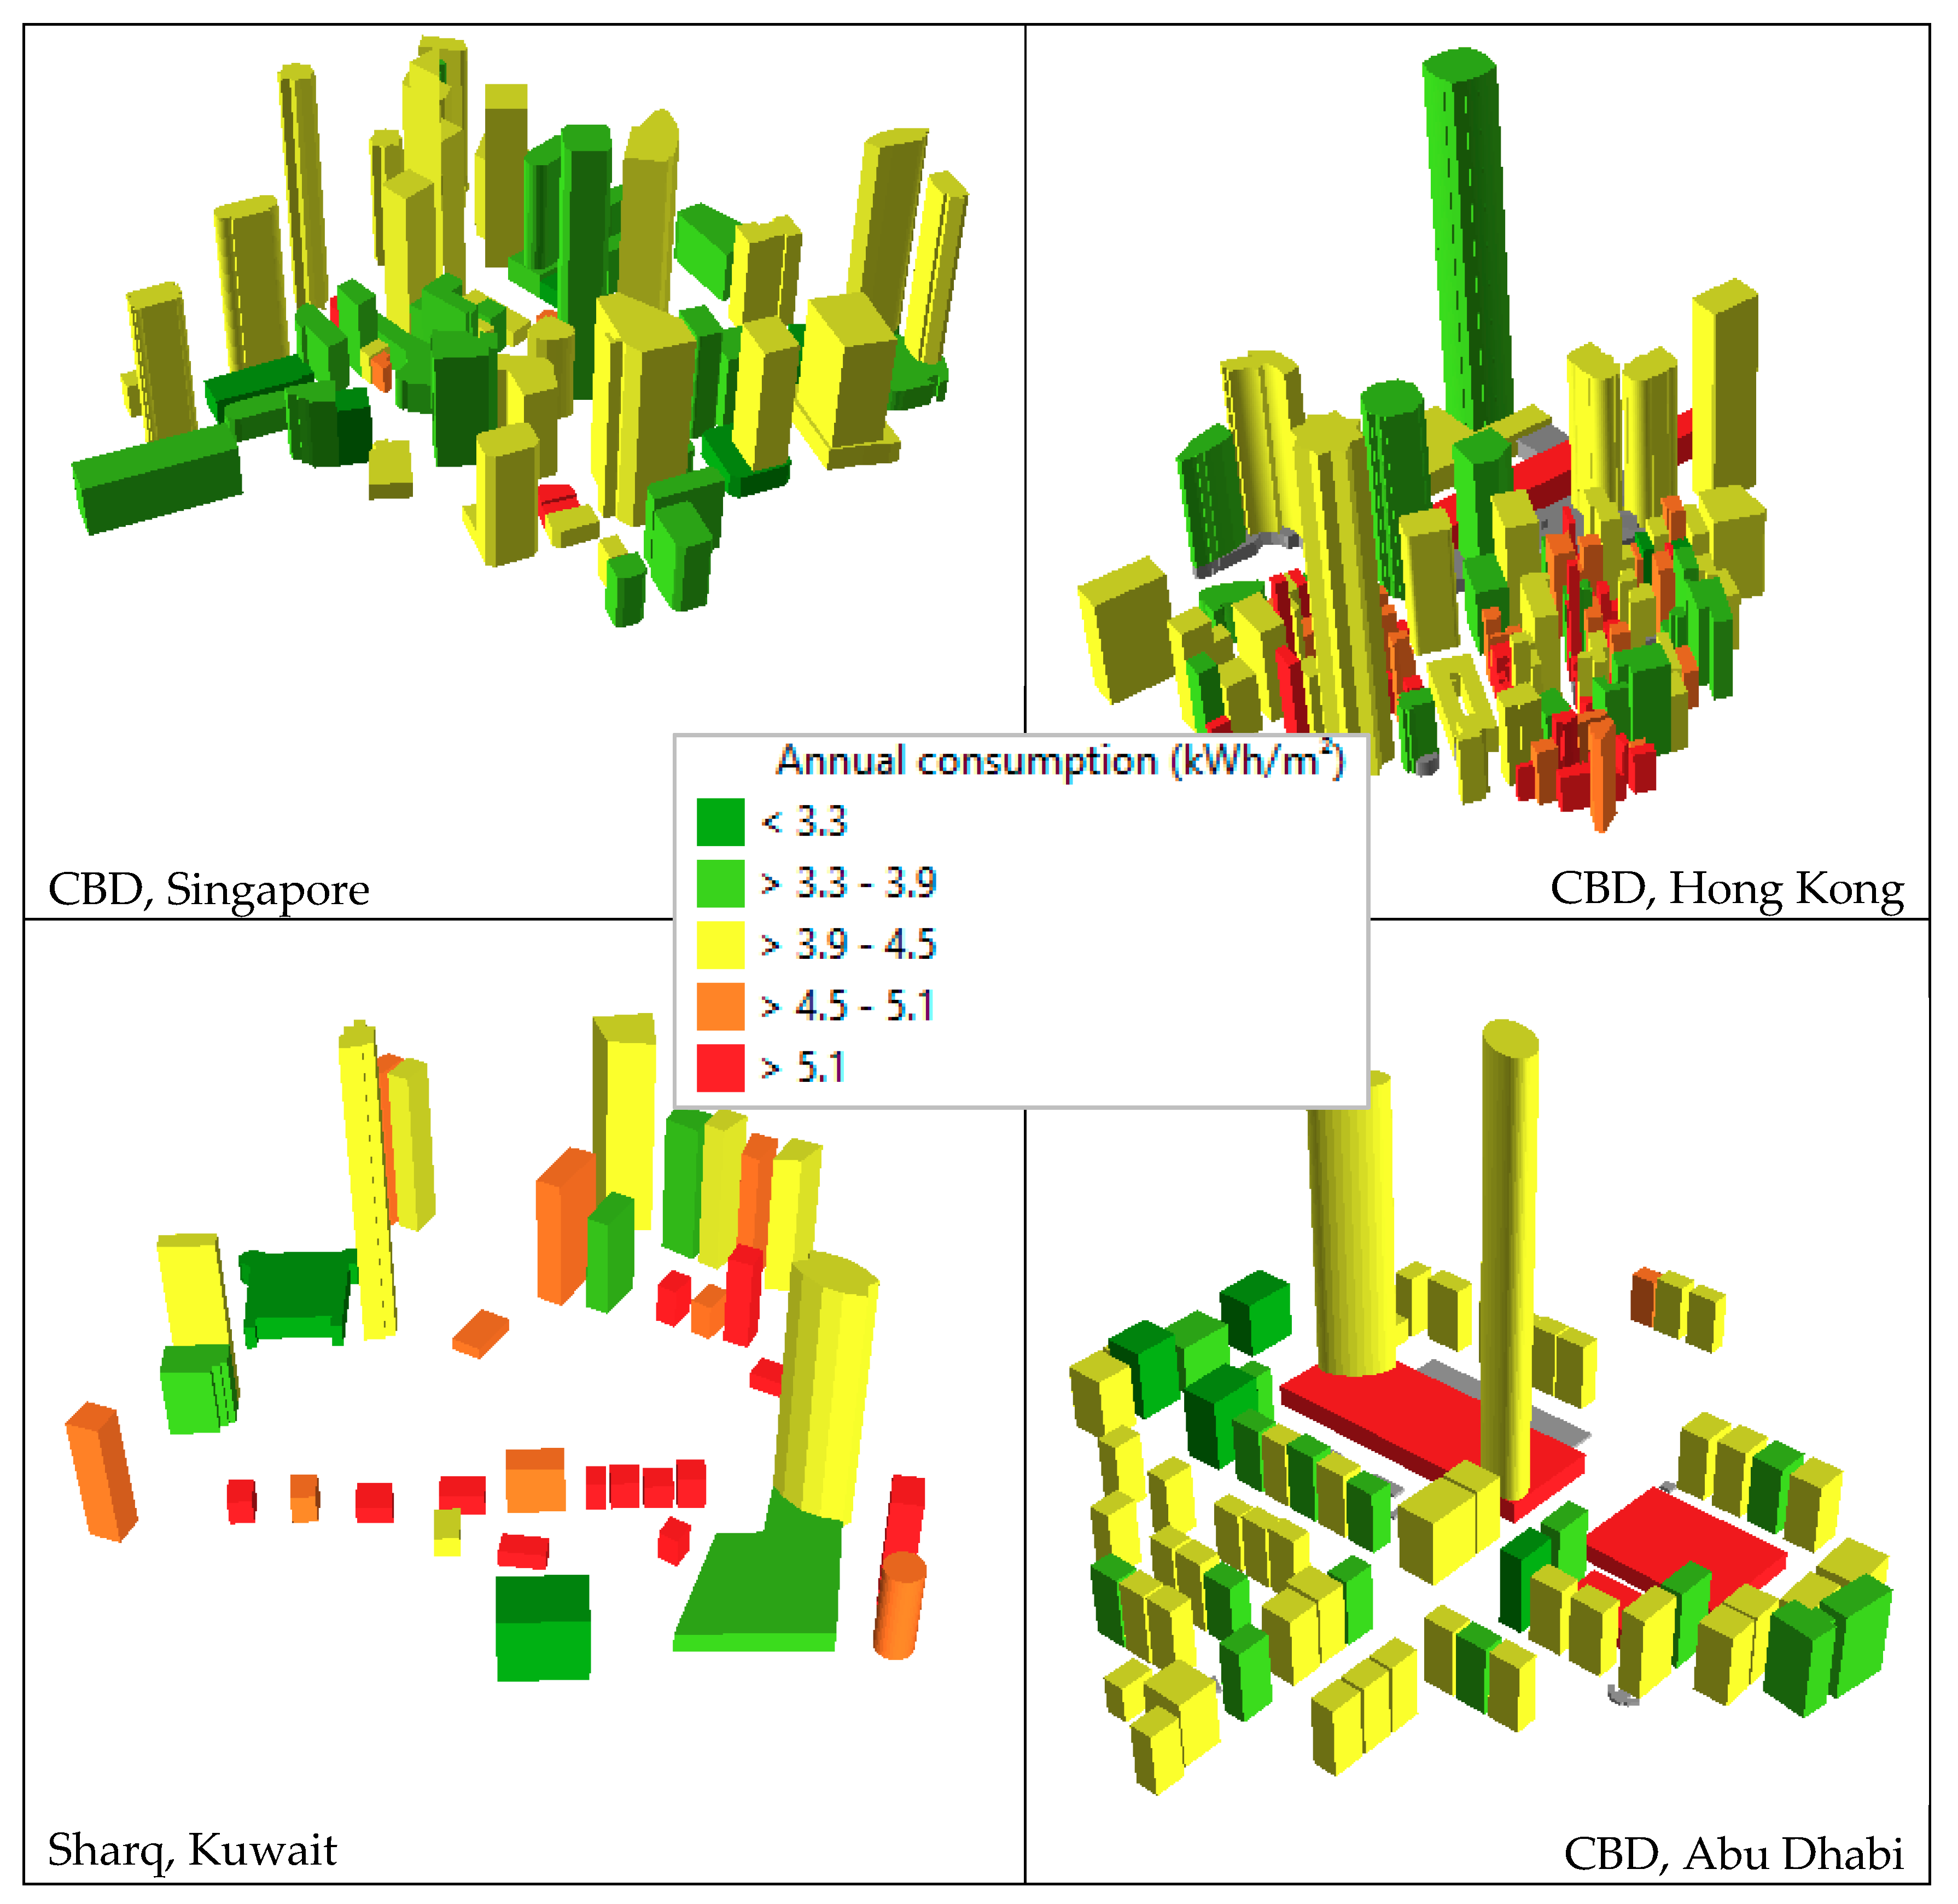
4. Discussion and Visualisation of Results

4.1. Evaluation in Each City and Morphology

Each city consists of buildings having different arrangements, shape, and therefore, is expected to display varying specific energy consumption for vertical mobility.

4.1.1. Kuwait

The urban blocks in Abdullah Al Salem, NWSulaibikhat and Qortuba consist of individual houses. One of the assumptions made in this study is that Kuwaiti single houses up to 2 floors (plus ground floor) are installed with a lift, because of better quality of life and comfort standards. The houses in Abdullah Al Salem consist of maximum 2 floors, thereby there is no energy consumption for vertical mobility. In individual houses, the residents use only one lift and the model does not optimise the number of lifts. Besides, single houses are less than 5 floors, and according to the model, they are equipped with hydraulic lifts that are not energy efficient. Therefore, the maximum energy consumption for lift is observed in NWSulaibikhat (around 6 kWh/m2a), which consists of villa type buildings.
The JIleeb typology displays the minimum energy consumption of 2 kWh/m2a. Jlleeb in Kuwait is mostly composed of low-rise buildings with multi-family houses, having a height of up to 12 floors. The energy consumption is calculated based on the installed lift technologies e.g., hydraulic lifts (considered on buildings with 5 floors or less) and geared lifts (considered on buildings up to 5 floors) and therefore, the consumption varies across the buildings. The buildings having hydraulic lifts consume between 1.76 and 3.68 kWh/m2a, with an average of 2.48 kWh/m2a, whereas geared lifts consume between 0.71 and 3.37 kWh/m2a, with an average of 1.47 kWh/m2a (Figure 8, left). Within one lift category (hydraulic or geared lifts), the higher the total floor area is, the better the number of lifts per building is optimised, and the lower the energy consumption for vertical mobility is.
The Sharq (CBD typology) of Kuwait is mostly composed of office buildings. The annual specific energy consumption for vertical mobility in Sharq (5 kWh/m2a) is significantly higher than Jleeb. It can be explained by the presence of more traffic in the office buildings than in the residential buildings. Even considering the same building geometry e.g., height, because of the type of usage, office buildings are installed with more lifts and therefore, the energy consumption will be higher than the residential buildings. Figure 8 (right) explains that the high-rise compact buildings (with more floors and a smaller floor area) consume more energy for vertical mobility than a non compact mid-rise building (with less floors and a higher floor area), even both of them have the same total floor area. It also reveals that the building having a smaller total floor area consumes more energy per square meter for lifts.

4.1.2. Singapore

Faber and low-density urban blocks in Singapore consist of individual houses and do not have any lift system installed. Punggol and Tampines consist of some mid-rise residential buildings. Compared to residential typologies in other cities, the energy consumption for vertical mobility of Punggol and Tampines is lower, even if their height is greater (24 floors in average in Punggol and 10 floors in Tampines). Although large total area of Tampines (in average 11,158 m2) indicates higher population, the model allocated appropriate number of lifts according to the traffic requirements and thus optimised the energy consumption calculation.
Some buildings in Tampines typology have a higher specific energy use than others, mainly because their floor area is slightly smaller (1093 m2 against 1344 m2 for 11 floors buildings) than the others. To fulfil requirements on the traffic flow, number of lifts are the same: buildings with a smaller area are less optimised. Besides, the model considers that lifts in mid and high-rise buildings (Geared traction for buildings up to 5 floors and gearless traction for buildings up to 24 buildings) are more energy efficient than lifts in low-rise buildings (Hydraulic lift for buildings less than 5 floors).
CBD typology contains a wide range of building types and forms. Buildings less than 5 floors are equipped with hydraulic lifts, so they consume more energy. The high-rise buildings (with more floors and a smaller floor area) consume more energy than a wide mid-rise building (with less floors and a bigger floor area) for the same total floor area. For example, a building of 15 floors for a total area of 79,260 m2 will consume 3.48 kWh/m2a energy, whereas a building of 69 floors for a total area of 81,820 m2 will consume 4.06 kWh/m2a energy (see Figure 9).

4.1.3. Hong Kong

Shophouses in Hong Kong is composed of low-rise multi-family buildings, which are very narrow in form. The floor area of 52% of the Shophouses buildings is less than 80 m2. As a consequence, even if buildings are high (10 floors in average), their total floor area and their number of residents are low and only one lift is assumed to be installed in each building. Because of the small size of the buildings, the lifts are also not fully utilised. The higher number of lifts (existing in all the buildings in Shophouses) to serve the residents in this block triggers a higher energy consumption for vertical mobility (Figure 10).
HR Podium and Taikoo buildings in Hong Kong are mid-rise residential buildings. They display similar characteristics as in the cases of Punggol and Tampines typologies in Singapore.
The energy consumption in Hong Kong CBD is very high, compared to the CBDs in other cities (10.19 kWh/m2a for Hong Kong CBD and an average of 3.68 kWh/m2a for the other CBDs) (Figure 11). This high value is occurred due to the narrow tall buildings, as in the case of Shophouses typology. The floor area of the 30% buildings in CBD typology is less than 100 m2, having an average height of 40 m. The number of lifts installed in this typology is higher than in a typology having wider buildings. The number of lifts in the buildings are not optimised as well. As a result, more lifts existing in this typology along with a low floor area trigger even higher energy consumption per square meter.

4.1.4. Abu Dhabi

Two different residential urban blocks exist in Abu Dhabi: Etihad towers, with wide high-rise buildings and Madinat Zayed, with buildings having 7 floors. In Etihad Towers, where buildings have a large total area, the specific energy consumption for vertical mobility is very low (0.83 kWh/m2a). Very high-rise Etihad towers, with more than 60 floors consume more energy than the lower ones within the same block. The buildings in Madinat Zayed are smaller: the model allocated some geared lifts that consume more energy than the gearless lifts in Etihad towers. As the buildings are smaller, the number of lifts per residents is less optimised, which lead to a higher energy consumption per square meter (1.26 kWh/m2a).
In Abu Dhabi CBD typology, podiums consume significantly higher energy (Figure 9), compared to the other buildings of the typology. Podiums were considered as commercial buildings, which means that the lifts are intensively used. They have less than 5 floors and the model considers that hydraulic lifts are installed. Among mid-rise buildings (between 20 and 25 floors), the larger floor area lead to less vertical energy consumption per square meter. The average energy consumption in CBD is around 3.80 kWh/m2a.

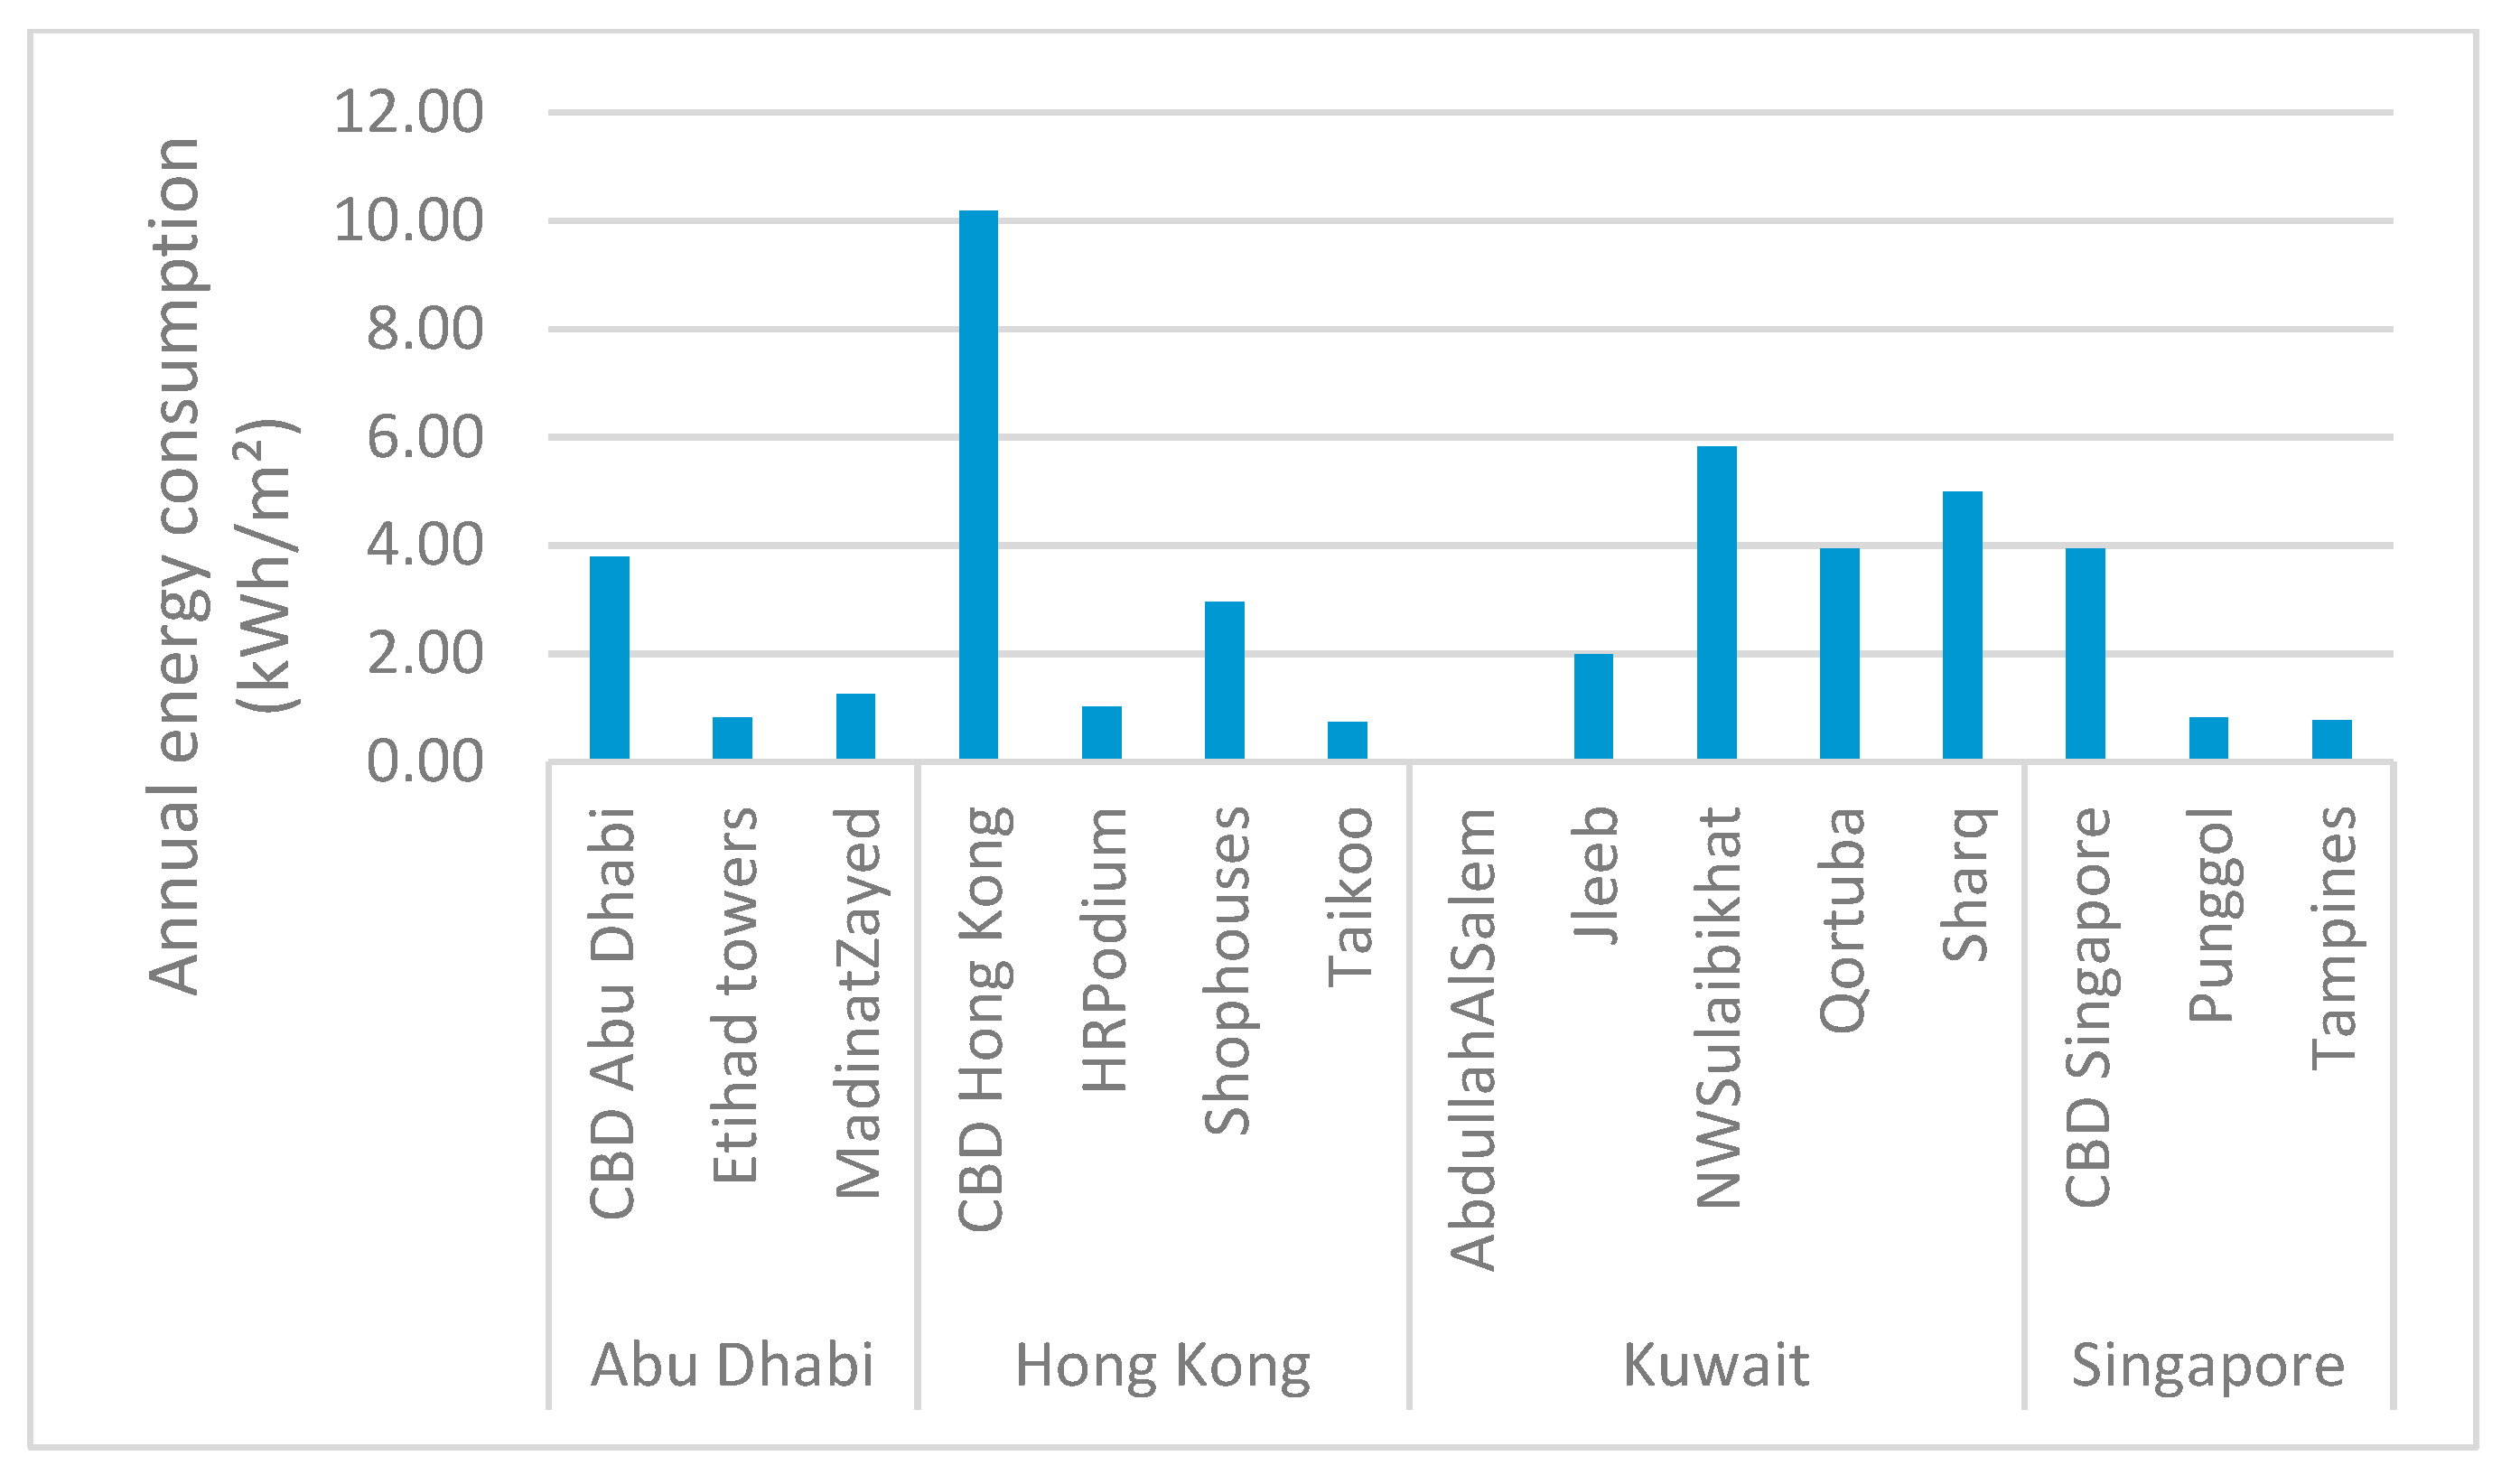
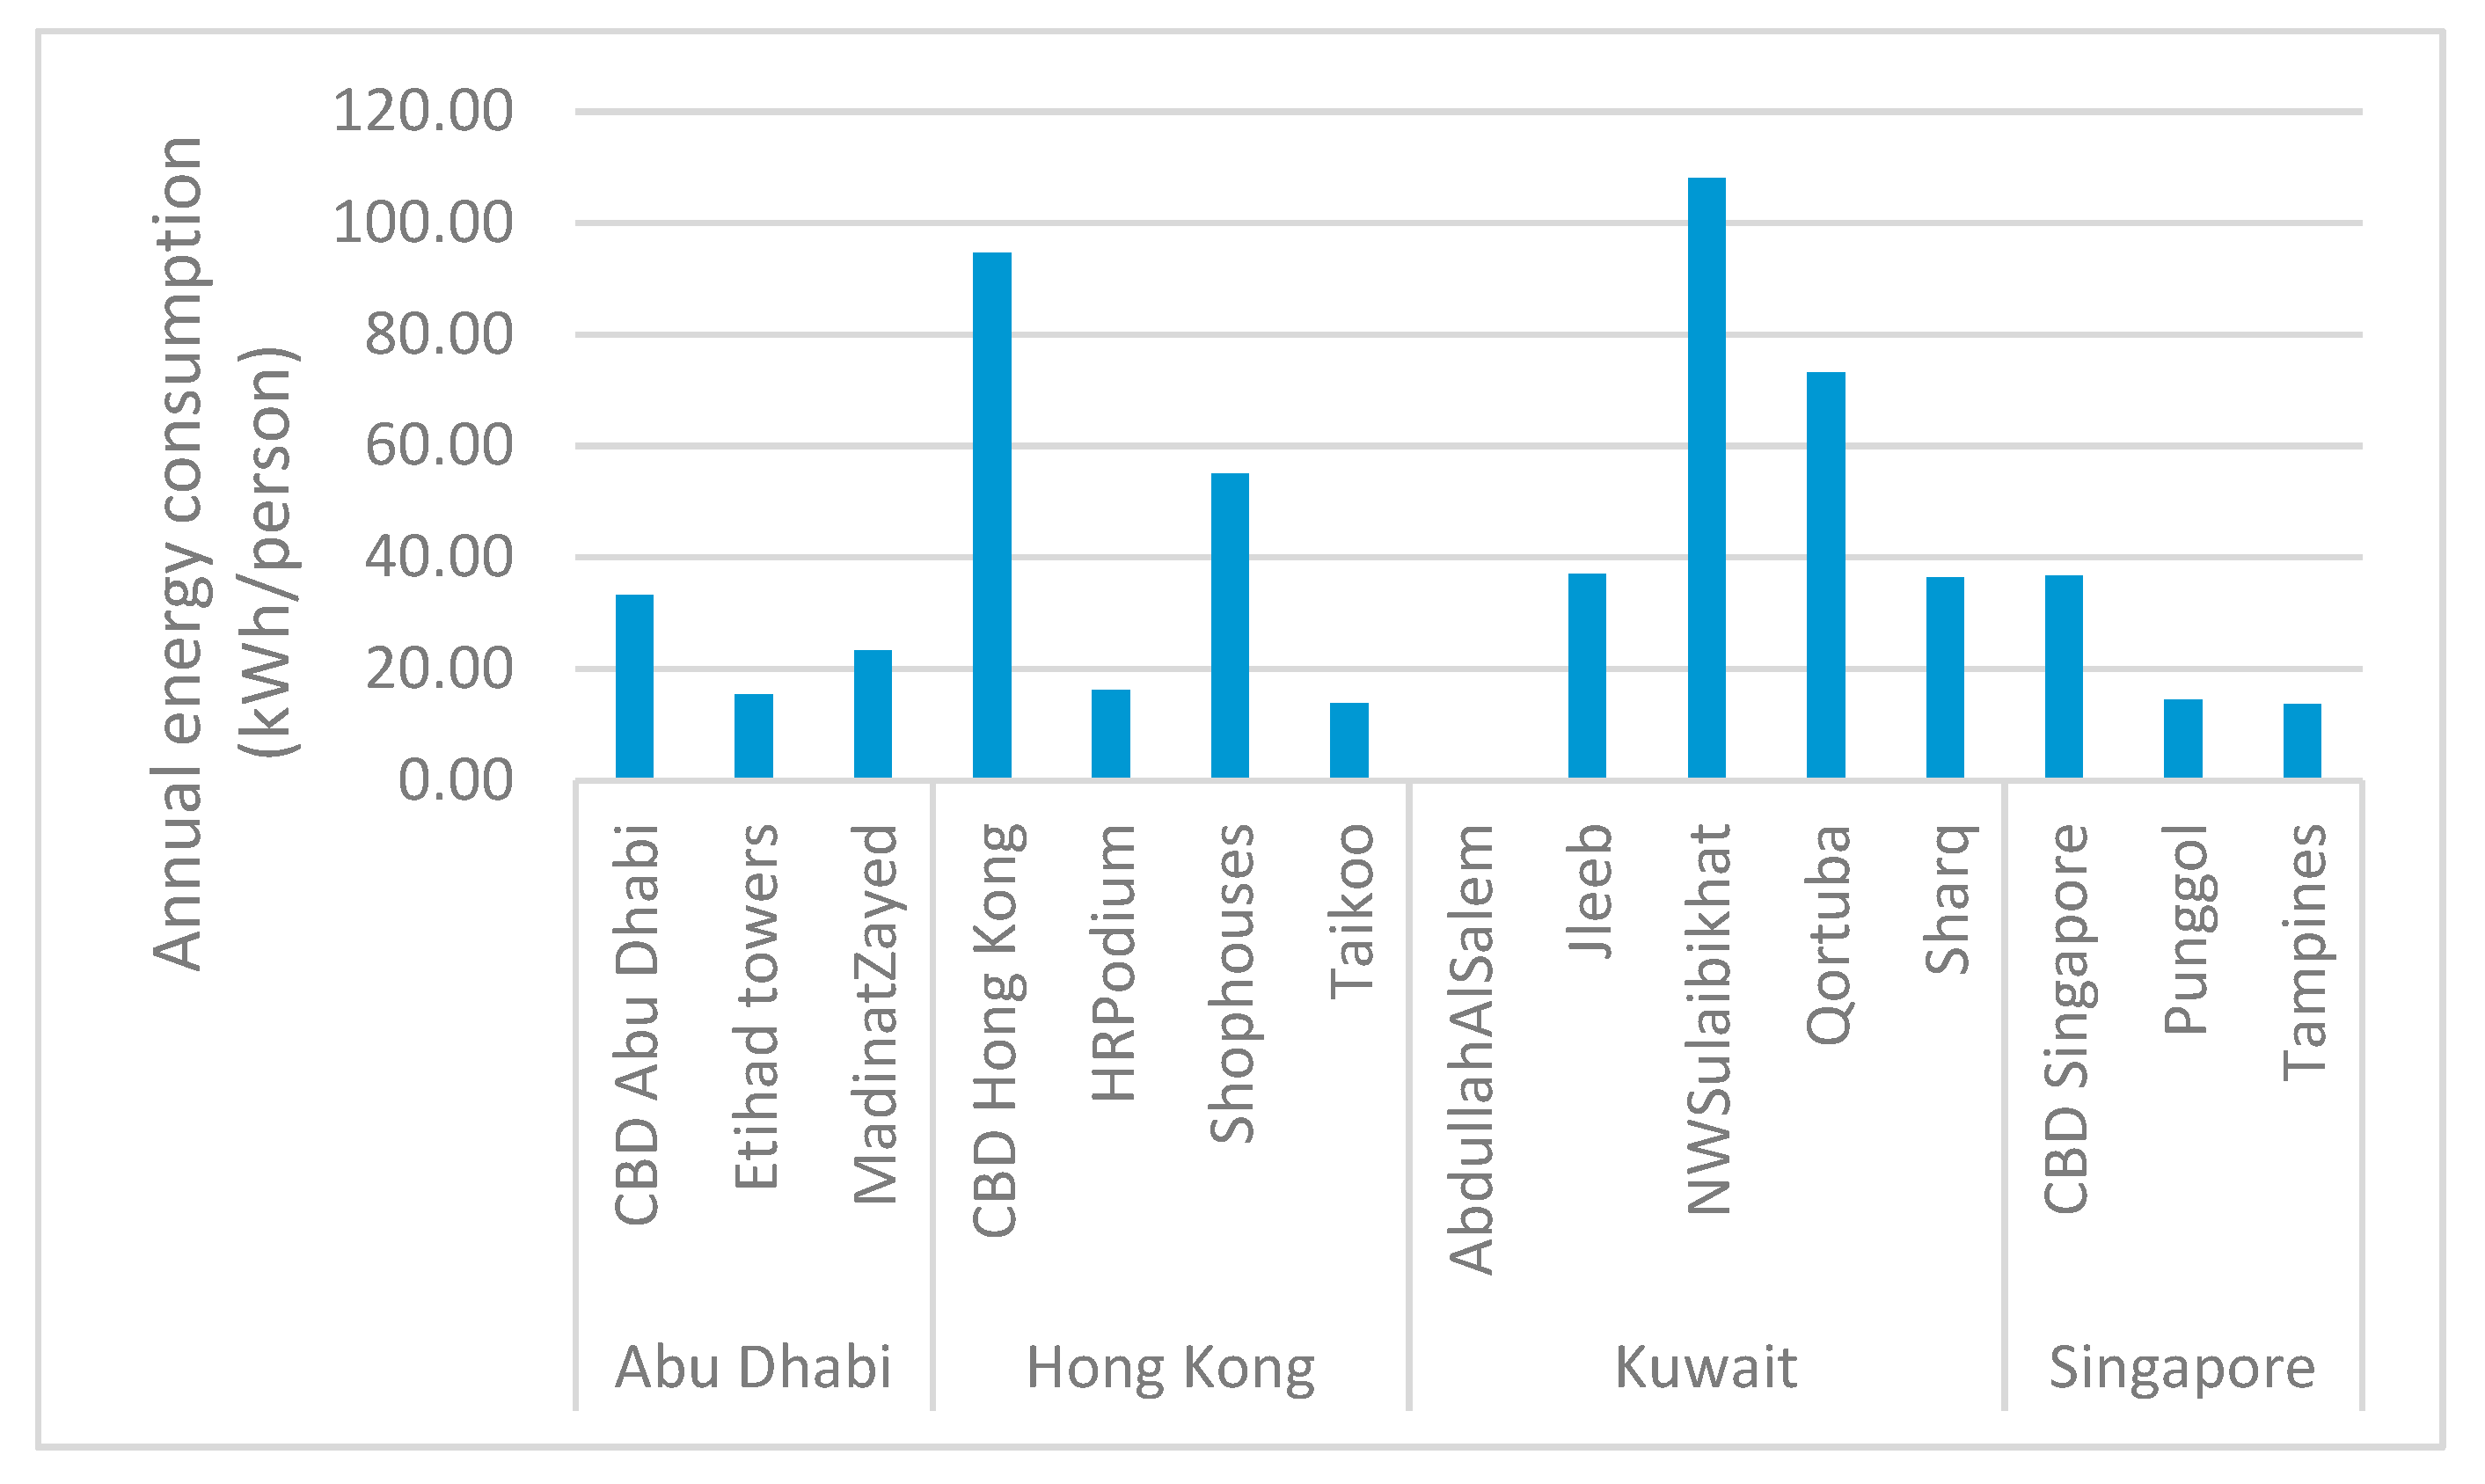
4.2. Comparative Analyses

The CBD typologies display higher energy consumption than the other typologies (Figure 11). For example, the average energy consumption in CBD Hong Kong is around 10 kWh/m2a, which is around three times higher than the average consumption for vertical mobility in Hong Kong.
Tampines typology (mid-rise residential buildings, having 10 floors on average) in Singapore can be compared with that of JIleeb (low-rise buildings with multi-family houses, having 8 floors on average) in Kuwait. The average annual specific energy consumption in Tampines (0.77 kWh/m2) is significantly lower than that of Jleeb (2 kWh/m2). The average total number of floors in JIleeb and Tampines are similar, but the average total floor area in Tampines (10,724 m2) is five times higher than that of Jleeb (2020 m2). Proposed generic tool allocate optimal number of lifts in these large buildings in Tampines to address the increased traffic needs. Moreover, since all the buildings are above 5 stories, more energy efficient hydraulic lifts are installed in Tampines. Yet, some buildings in the Tampines typology display higher specific energy needs than other buildings because of the smaller floor area.
The average annual energy consumption can also be compared considering the number of people living within the buildings in all these typologies (Figure 12). It varies from 13.61 kWh/person (in Tampines) to 108.08 kWh/person (NWSulaibikhat). Some of the typologies accommodate a smaller number of residents (e.g., Qortuba and NWSulaibikhat in Kuwait or Madinat Zayed in Abu Dhabi), and due to their better quality of life (comfort) the average annual energy consumption per person are comparatively higher than other dense residential typologies (e.g., Tampines or Pungol in Singapore).

5. Reliability of Data and Model Validation

5.1. Reliability of Data

Different variables are collected from the literature to characterise the buildings and lift technologies as well as to analyse the traffic demand and to calculate energy consumption. The reliability of the input variables is evaluated by ranking as high and medium (Table 2).

5.2. Validation of the Results

Most of the previous studies performing calculation of energy consumption focused on one lift at a time in a particular building or type of building. They did not calculate energy consumption at building level and mostly investigated measured consumption values, which varied significantly from one case to another (see Table 3). For example, the lift system in a low-energy office building in Trondheim having an area of around 16,200 m2, consumes 0.3 kWh/m2a energy [36]. In another low-energy office building in Colorado of 20,438 m2 area, the geared traction lift system consumes 2.52 kWh/m2a energy [37]. In a mix-use building (commercial and office) in Shanghai of 26,000 m2 area and 28 floors, the lift system consume 19 kWh/m2a energy [38]. We observed that the reference values for lift energy consumption is 4 kWh/m2a for a high-rise building [39] and 2.12 kWh/m2a for an office building of 40,000 m2 (with 20 m2 per employee). Venables et al. [40] measured annual energy consumption (kWh) in three office buildings (equipped with different lifts) in the United Kingdom. They significantly vary according to the type of lift technology installed in the buildings.
In our study, the energy consumption varies significantly among the buildings and urban blocks. It is mainly driven by the building category, forms, and the type of lift system installed. For example, the high-rise buildings in both Singapore and Kuwait have an energy consumption between 3.3 and 5.1 kWh/m2a. The average energy consumption in these typologies is around 3.94 kWh/m2a and 4.99 kWh/m2a.
As the objective of the method is not a precise prediction of energy use for lift operation for whole cities but to provide a comparative assessment, the described measured values for the energy use are supporting the research presented in the paper.

6. Conclusions

With the high-density development in Asian cities, the amount of energy use for vertical mobility is increasing. To assess the relevance of this part of the total energy use of buildings and districts, we performed energy calculation of lifts due to vertical mobility at the building and urban block level. The proposed method is based on the state of the art of literature review, codes of practice, ISO/DIS 25745-1 standard and 3D city models. A generic tool is also developed and applied in the 20 typical urban blocks in four diverging Asian cities: Kuwait, Abu Dhabi, Hong Kong and Singapore. The data on building attributes (number of floors, height, etc.), geometries (3D city models) and lift (technology, speed, etc.) characteristics are gathered from different sources. They were used to perform traffic analyse (population, handling capacity, etc.) and calculate annual energy consumption of lifts. Each urban block consists of buildings having different arrangements, shapes, types, etc. Therefore, specific energy use for vertical mobility varies among the blocks and cities. Overall, the results also show that even for the most vertical morphologies, energy demand for vertical mobility is only a fraction of energy demands observed for horizontal mobility [30]. Therefore, the results of this study do not question the general argument for more compact urban form. Yet, adding the share of energy used for vertical mobility can help to assess the complete energy balance in rapidly growing urban areas, in which all components of the energy use such as heating, cooling, lighting, horizontal mobility, etc. should be included.
Even though these results were to be expected, the study also points out the adverse effect of increased need for comfort. Household lifestyle and comfort conditions play a major role in energy calculation. Low-density urban blocks such as Qortuba or NWSulaibikhat (in Kuwait) showed increased cooling energy need due to their form and increased comfort [30]. They are also equipped with lift systems and therefore requires increased energy for vertical mobility even in two storey buildings (Figure 11). Their specific annual energy use for vertical mobility is equivalent to that of the CBD in Abu Dhabi. Due to the limited extent of the current study, these results cannot be generalised but underline the important issue of comfort needs, which often are a main driver of energy use [42] that must be considered both in building and urban planning to avoid increased energy use in even more efficient buildings.
The proposed tool is implemented in a spreadsheet programme. It is easy to use and can be adaptable to other urban blocks and cities. Different parameters such as lift systems or building types can be easily changed to evaluate different scenarios. We discussed that the choice of lift systems can yield significant differences in the energy consumption. Therefore, this study can help in energy efficient lift installation from the building to urban scales; such study was not performed before.
This study also revealed some major data and methodological challenges for modeling and analysing the impact of urban form on vertical energy consumption. First, we must study city and country specific user behavior on the use of lift to assess the associate energy consumption. For example, the presence of lifts in villa type buildings indicates the importance of the individual’s choice or lifestyle, which is an important topic in vertical mobility. We did not study the energy consumption due to escalators or regenerative lifts. In the future, detailed survey on the use of lifts in Asian context can be carried out to improve the confidence in model assumption. The environmental impact i.e., GHG emissions produced during the operation of the lift can also be studied. Life cycle analyses and some economic indicators such as operational, investment and total cost of the lift can also be performed. The results can be validated against measured energy consumption data in some selected buildings in some of these urban blocks. Finally, the sensitivity analyses will help to identify the impact of some uncertain model parameters on model outcomes.

Author Contributions

S.M.M. envisioned and wrote the article with a support from A.D., A.K. and P.R.; A.D. performed the initial analyses of the study, with the support of S.M.M. and A.K. The article was improved by the contributions of all the co-authors at various stages of the analysis and writing process.

Funding

This research was supported by the Kuwait Foundation for the Advancement of Sciences (KFAS) and the London School of Economics and Political Science (LSE) Middle East Centre. It was carried out within the Resource Urbanisms project that LSE Cities led between 2015 and 2017.

Acknowledgments

The authors would like to thank the project researchers Jochen Wendel, Alexandra Gomes, Muhammad Adeel, Fizzah Sajjad, Jenny McArthur, Sharifa Alshalfan, Peter Schwinger, Devisari Tunas, Christiane Lange, Clemence Montagne and Steffen Hertog as well as all experts and authorities for providing valuable inputs to this work. Finally, our sincere gratitude extends to the editors and three anonymous referees for their insightful comments, which helped us to improve the manuscript.

Conflicts of Interest

The authors declare no conflict of interest.

Appendix A

Table A1. Summary of values chosen for different building categories and lift technologies (based on the references explained in Table 1).
Building TypologyLift TechnologyAverage Energy per Cycle (Wh)Power Used during Standby Mode (W)Number of Trips per YearLift Capacity (per pers)Occupant Density (gross area/pers)Handling Capacity (Average)Interval (Average) (s)
ResidentialGeared Traction50.4163.862,300418.586.25%65
ResidentialGearless Traction33.07249131,000618.586.25%65
ResidentialHydraulic63.8180.444,900518.586.25%65
OfficeGeared Traction57.9244.8232,00079.2913.50%28.5
OfficeGearless Traction43.9320.7242,00089.2913.50%28.5
OfficeHydraulic83.1182.9164,00079.2913.50%28.5
HotelGeared Traction77.7198.5199,00094.64514.00%32.5
HotelGearless Traction44.13204.3220,000124.64514.00%32.5
HotelHydraulic107.6113.686,000114.64514.00%32.5
CommercialGeared Traction42.5213.4192,000103.71612.00%25
CommercialGearless Traction24235.1224,000103.71612.00%25
CommercialHydraulic92.9177.3142,000103.71612.00%25
Car parkGeared Traction52.510060,0004106.25%65.0
Car parkGearless Traction52.510060,0006106.25%65.0
Car parkHydraulic52.510060,0005106.25%65.0

References

  1. UN. The World’s Cities in 2016—Data Booklet (ST/ESA/ SER.A/392); United Nations, Department of Economic and Social Affairs, Population Division: New York, NY, USA, 2016. [Google Scholar]
  2. Zhao, J. Analysis of Urban Form Parameters with a Focus on Energy Consumption. Ph.D. Thesis, Technische Universität Dortmund, Dortmund, Germany, 2016. [Google Scholar]
  3. Ko, Y. Urban form and residential energy use: A review of design principles and research findings. J. Plan. Lit. 2013, 28, 327–351. [Google Scholar] [CrossRef]
  4. Bian, C.; Lin, L.; Zhang, Q. Effects of China’s Urban Form on Urban Energy Consumption. In Proceedings of the 40th Annual IAEE International Conference, Singapore, 18–21 June 2017; p. 9. [Google Scholar]
  5. Rode, P.; Keim, C.; Robazza, G.; Viejo, P.; Schofield, J. Cities and energy: Urban morphology and residential heat-energy demand. Environ. Plan. B Plan. Des. 2014, 41, 138–162. [Google Scholar] [CrossRef]
  6. Rode, P.; Burdett, R.; Robazza, G.; Schofield, J.; Keim, C.; Avci, N.; Dimitrova, S.; Garcia, P.V.; Murshed, S.M.; Bahu, J.-M. Cities and Energy: Urban Morphology and Heat Energy Demand; Final Report; LSE Cities, The London School of Economics and Political Science: London, UK, February 2014; p. 232. [Google Scholar]
  7. Mindali, O.; Raveh, A.; Salomon, I. Urban density and energy consumption: A new look at old statistics. Transp. Res. Part A Policy Pract. 2004, 38, 143–162. [Google Scholar] [CrossRef]
  8. Maharjan, S.; Tsurusaki, N.; Divigalpitiya, P. Influencing Mechanism Analysis of Urban Form on Travel Energy Consumption—Evidence from Fukuoka City, Japan. Urban Sci. 2018, 2, 15. [Google Scholar] [CrossRef]
  9. Liu, C.; Shen, Q. An empirical analysis of the influence of urban form on household travel and energy consumption. Comput. Environ. Urban Syst. 2011, 35, 347–357. [Google Scholar] [CrossRef]
  10. Liu, C. Exploring the Influence of Urban form on Travel and Energy Consumption, Using Structural Equation Modeling. Ph.D. Thesis, University of Maryland, College Park, MD, USA, 2012. [Google Scholar]
  11. Osorio, B.; McCullen, N.; Walker, I.; Coley, D. Understanding the relationship between energy consumption and urban form. Athens J. Sci. 2016, 4, 115–141. [Google Scholar] [CrossRef]
  12. Yin, Y.; Mizokami, S.; Maruyama, T. An analysis of the influence of urban form on energy consumption by individual consumption behaviors from a microeconomic viewpoint. Energy Policy 2013, 61, 909–919. [Google Scholar] [CrossRef]
  13. Adak, M.F.; Duru, N.; Duru, H.T. Elevator simulator design and estimating energy consumption of an elevator system. Energy Build. 2013, 65, 272–280. [Google Scholar] [CrossRef]
  14. Al-Sharif, L. Lift energy consumption: General overview (1974–2001). Elevator World 2004, 52, 61–67. [Google Scholar]
  15. Ahmed, S.S.; Iqbal, A.; Sarwar, R.; Salam, M.S. Modeling the energy consumption of a lift. Energy Build. 2014, 71, 61–67. [Google Scholar] [CrossRef]
  16. Barney, G. Energy Models for Lifts. In Proceedings of the 1st Symposium of Lift and Escalator Technologies, Northampton, UK, 29 September 2011; pp. 22–31. [Google Scholar]
  17. Nipkow, J.; Schalcher, M. Energy Consumption and Efficiency Potentials of Lifts; Swiss Agency for Efficient Energy use S.A.F.E.: Zurich, Switzerland; HTW Chur University of Applied Sciences: Chur, Switzerland, 2006; p. 3. [Google Scholar]
  18. Tukia, T. Determining and Modeling the Energy Consumption of Elevators. Master’s Thesis, Aalto University School of Electrical Engineering: Espoo, Finland, 2014. [Google Scholar]
  19. De Almeida, A.T.; Patrão, C.; Fong, J.; Araújo, R.; Nunes, U.; Rivet, L.; Lindegger, U.; Nanetti, M.; Cariani, W.; Disi, A.; et al. E4 Project Energy Efficient Elevators and Escalators; ISR—University of Coimbra: Coimbra, Portugal, March 2010; p. 122. [Google Scholar]
  20. Tukia, T.; Uimonen, S.; Siikonen, M.-L.; Hakala, H.; Donghi, C.; Lehtonen, M. Explicit method to predict annual elevator energy consumption in recurring passenger traffic conditions. J. Build. Eng. 2016, 8, 179–188. [Google Scholar] [CrossRef]
  21. Bannister, P.B.; Bloomfield, C.; Chen, H. Empirical Prediction of Office Building Lift Energy Consumption. In Proceedings of the Building Simulation 2011: 12th Conference of International Building Performance Simulation Association, Sydney, Australia, 14–16 November 2011; pp. 2635–2642. [Google Scholar]
  22. Energy Calculator. thyssenkrupp Elevator Corporation © 2018, United States. Available online: https://www.thyssenkruppelevator.com/Tools/energy-calculator (accessed on 30 July 2018).
  23. EMSD. Guidelines on Energy Efficiency of Lift & Escalator Installations; Electrical and Mechanical Services Department: Hong Kong, China, 2007; p. 31.
  24. Hui, C.M.; Yeung, C.Y. Analysis of standby power consumption for lifts and escalators. In Proceedings of the 7th Greater Pearl River Delta Conference on Building Operation and Maintenance, Hong Kong, China, 6 December 2016. [Google Scholar]
  25. EMSD. Code of Practice for Energy efficiency of Lift and Escalators Installations; Electrical and Mechanical Services Department: Hong Kong, China, 2007.
  26. Energy Performance Of Lifts And Escalators—Part 1: Energy Measurement And Conformance; ISO/DIS 25745-1; International Organization for Standardization: Geneva, Switzerland, 2008.
  27. Siikonen, M.-L. On traffic planning methodology. Elevator Technol. 2000, 27, 267–274. [Google Scholar]
  28. Peters, R.D. Improvement to the Up Peak Round Trip Time Calculation. Int. J. Elevator Eng. 2000, 3. [Google Scholar]
  29. ISO. Energy performance of lifts, escalators and moving walks—Part 2: Energy calculation and classification for lifts (elevators). In ISO 25745-2:2012; International Organization for Standardization: Geneva, Switzerland, 2012. [Google Scholar]
  30. Rode, P.; Gomes, A.; Adeel, M.; Sajjad, F.; McArthur, J.; Alshalfan, S.; Schwinger, P.; Montagne, C.; Tunas, D.; Lange, C.; et al. Resource Urbanisms: Asia’s Divergent City Models of Kuwait, Abu Dhabi, Singapore and Hong Kong; LSE Cities, School of Economics and Political Science: London, UK, 2017; p. 71. [Google Scholar]
  31. Wendel, J.; Simons, A.; Nichersu, A.; Murshed, S.M. Rapid development of semantic 3D city models for urban energy analysis based on free and open data sources and software. In Proceedings of the 3rd ACM SIGSPATIAL Workshop on Smart Cities and Urban Analytics, Redondo Beach, CA, USA, 7 November 2017; p. 7. [Google Scholar]
  32. Murshed, S.M.; Al-Hyari, A.; Wendel, J.; Ansart, L. Design and Implementation of a 4D Web Application for Analytical Visualization of Smart City Applications. ISPRS Int. J. Geo-Inf. 2018, 7, 276. [Google Scholar] [CrossRef]
  33. Murshed, S.M.; Lindsay, A.; Picard, S.; Simons, A. PLANTING: Computing High Spatio-Temporal Resolutions of Photovoltaic Potential of 3D City Models. In Geospatial Technologies for All, Lecture Notes in Geoinformation and Cartography; Mansourian, A., Pilesjö, P., Harrie, L., van Lammere, R., Eds.; Springer International Publishing AG: Cham, Switzerland, 2018; in press. [Google Scholar]
  34. Murshed, S.M.; Picard, S.; Koch, A. Modelling, Validation and Quantification of Climate and Other Sensitivities of Building Energy Model on 3D City Models. ISPRS Int. J. Geo-Inf. 2018, 7, 447. [Google Scholar] [CrossRef]
  35. International Code Council. International Code Council. International Building Code 2015 (IBC 2015). In Chapter 3 Use and Occupancy Classification; International Code Council, Inc.: Washington, DC, USA, 2015. [Google Scholar]
  36. Djuric, N.; Novakovic, V.; Frydenlund, F. Electricity use in two low energy office buildings in Norway. REHVA Eur. HVAC J. 2012, 49, 30–34. [Google Scholar]
  37. Lobato, C.; Pless, S.; Sheppy, M.; Torcellini, P. Reducing plug and process loads for a large scale, low energy office building: Nrel’s research support facility. In Proceedings of the ASHRAE Winter Conference, Las Vegas, NV, USA, 29 January–2 February 2011; pp. 1–2. [Google Scholar]
  38. Wang, X.; Huang, C.; Cao, W. Energy audit of building: A case study of a commercial building in Shanghai. In Proceedings of the Power and Energy Engineering Conference (APPEEC), Chengdu, China, 28–31 March 2010; pp. 1–4. [Google Scholar]
  39. Schroeder, J. Energy Consumption and Power Requirements of Elevators; Springer: Boston, MA, USA, 1988. [Google Scholar]
  40. Venables, J.; Monaghan, E. Smarter Buildings: Real-World Energy Use of Lifts/Elevators in Contemporary Office Buildings and Its Mitigation through Stair-Use Promotion; StepJockey and SVM Associates: London/Birmingham, UK, May 2016; p. 36. [Google Scholar]
  41. Al-Sharif, L. Lift and Excalator Energy Consumption. In Proceedings of the CIBSE/ASHRAE Joint National Conference, Harrogate, UK, 29 September–1 October 1996; pp. 231–239. [Google Scholar]
  42. Koch, A.; Zech, D. Impact analysis of heat consumption: User behaviour and the consumption of heat energy. In The Nature of Sustainable Consumption and How to Achieve It: Results from the Focal Topic “From Knowledge to Action–New Paths Towards Sustainable Consumption; Defila, R., Giulio, A.D., Kaufmann-Hayoz, R., Eds.; Oekom Verlag: München, Germany, 2012; pp. 353–365. [Google Scholar]
Figure 1. Methodological overview to calculate energy consumption of vertical mobility.
Urbansci 03 00004 g001
Figure 2. Traffic demand analysis to calculate number of lifts in a building (yellow, pink and blue boxes represent building, lift and traffic components, respectively).
Urbansci 03 00004 g002
Figure 3. Capacity estimation of the lift system to welcome the newcomers (standard case).
Urbansci 03 00004 g003
Figure 4. Capacity estimation of the lift system. In case the capacity of the system is higher than the standard lift car capacity, several lift banks are required.
Urbansci 03 00004 g004
Figure 5. Estimation of number of lift cars per lift bank, left: case 1 where the flow of comers is continuous during up-peak hours, right: case 2 where flow of comers is discontinuous during up-peak hours.
Urbansci 03 00004 g005
Figure 6. Methods to calculate energy consumption of lifts (yellow, pink, blue and green boxes represent building, lift, traffic and energy consumption components, respectively).
Urbansci 03 00004 g006
Figure 7. Selected urban morphologies in Kuwait, Abu Dhabi, Hong Kong and Singapore [30].
Urbansci 03 00004 g007
Figure 8. Spatial distribution of average annual specific energy consumption of lift in JIleeb (left) and Sharq (right) in Kuwait.
Urbansci 03 00004 g008
Figure 9. Comparison of energy consumption of lifts in office buildings/CBDs in the four cities.
Urbansci 03 00004 g009
Figure 10. Comparison of energy consumption in some selected residential buildings in Hong Kong and Kuwait (the buildings with grey colour do not contain any lift).
Urbansci 03 00004 g010
Figure 11. Average annual specific energy consumption for vertical mobility in different urban blocks in four cities.
Urbansci 03 00004 g011
Figure 12. Average annual energy consumption for vertical mobility in different urban blocks in four cities.
Urbansci 03 00004 g012
Table 1. List of variables and sources for calculating energy consumption of lifts.
CategoryVariableSourceUse of Data Use of Method
Building characteristicsFloor areaDatabase x
Building typeDatabasex
Number of floorsDatabasex
Height of the buildingDatabasex
Lift characteristicsLift technology[19], p. 57x
Speed[23], p. 16x
Number of trips per year[19], p. 57x
Traffic analysisPopulation[35], Table 1004.1.1x
Handling capacity[27], Table 1x
Maximum arrival rate[23], p. 25 x
Interval[27], Table 1x
Capacity[23], p. 25 x
Capacity per lift[19], p. 57x
Number of lift banks[23], p. 25 x
Round trip travel[23], p. 25 x
Number of lift car per lift bank[23], p.25 x
Number of lift[23,25] x
Energy consumptionAverage energy use during running mode per cycle[19], p. 78xx
Annual running energy consumption per lift[19,26] x
Power use during standby mode[19], p. 79xx
Annual energy for standby mode per lift[19,26] x
Table 2. Qualitative evaluation of the model input variables.
VariableReliabilityComments/to Improve
Floor AreaHighCalculated from building footprints.
Building TypeMediumIf building types are missing in database, assumptions are made.
Number of floorsHighField survey through local experts.
Height of the buildingHighField survey through local experts.
PopulationMediumCalculated according to building type and floor area.
Handling capacityMediumLiterature review.
Maximum arrival rateMediumLiterature review.
IntervalMediumLiterature review.
CapacityMediumLiterature review.
Number of liftsMediumLiterature review.
Lift technologyMediumChoice between hydraulic and geared lifts are made after literature.
SpeedMediumSpeed is defined based on the height of the building, and not the building category and the lift technology used (except for hydraulic lifts).
Capacity per lift, Number of trips per year, Average energy use per cycle, Power use during stand-by modeMediumBased on measurements on 87 lifts in Italy, Germany, Poland and Portugal [19]. We assume the same values for Asian cities.
Table 3. Literature review on the validation of energy consumption for lifts.
ReferencesType of DataType of BuildingLift InformationEnergy Consumption Value
[36]MeasuredLow energy office building in Trondheim (Norway), with 16,200 m2 floor area 0.3 kWh/m2a
[38]MeasuredEnergy Audit of a commercial building in Shanghai (China), 26,000 m2 floor area4 lifts, power requirement of 22 kW and 15 kWh19 kWh/m2a
[39]Requirements for high-rise building in 1988Office building 4 kWh/m2a
[41]Value taken for calculation in an exampleLift and escalator energy consumption for office building of 20,000 m26 lifts2.12 kWh/m2a
[40]MeasuredSeven-storey (excluding ground) office building, serving 460 employees (UK)3 gearless liftsbetween 14,716 kWh and 19,862 kWh (3.2 kWh/m2a and 4.4 kWh/m2a) *
[40]MeasuredSeven-storey (excluding ground) office building, serving 460 employees (UK)3 geared liftsbetween 63,636 kWh and 98,852 kWh (14 kWh/m2a and 21 kWh/m2a) *
[40]MeasuredTwo-storey (excluding ground) office building, serving 410 employees (UK)2 hydraulic liftsbetween 121,962 kWh and 145,130 kWh (30 kWh/m2a and 36 kWh/m2a) *
[37]MeasuredOffice building of 20,438 m2, completed in 2010 in Colorado (National Renewable Energy Laboratory building) 3 storeysHydraulic lifts2.52 kWh/m2a
[37]Hypothesis of refurbishmentOffice building of 20,438 m2, completed in 2010 in Colorado (National Renewable Energy Laboratory building) 3 storeysRegenerative geared lifts1.73 kWh/m2a
* Assuming a gross surface area of 9.29 m2 per employee [35].

