Article

Challenges of Researching Showering Routines: From the Individual to the Socio-Material

Department of Geography and Environmental Management, University of the West of England, Bristol BS16 1QY, UK
*
Author to whom correspondence should be addressed.
Urban Sci. 2019, 3(1), 19; https://doi.org/10.3390/urbansci3010019
Submission received: 13 December 2018 / Revised: 23 January 2019 / Accepted: 29 January 2019 / Published: 31 January 2019
(This article belongs to the Special Issue Future of Water: Local, Regional and Global Best Practice)

Abstract

:
In the UK, water supplies are under pressure from climate, population and lifestyle change. Showering is the largest component of domestic water consumption. Young adults are high water-users at a transitional life-stage, when practices are dynamic, and habits shaped. This paper presents the methodology, early findings and reflections on challenges of working with different data types and scales, to explore real-world water-saving through a mixed-methods approach, focusing on showering patterns of first year university students in campus accommodation at the University of the West of England, Bristol, UK. Combining household meter, logged water-fixture micro-component, personal-use questionnaire, user diary and stakeholder focus group data with the Scottish Government Individual-Social-Material model, typical showering demand reduction interventions were evaluated and insights into alternative interventions were generated. Results indicate Estates’ routine equipment maintenance and database management affect data quality and consistency. Despite these issues a profile of daily student water use was derived (equivalent to 114 L per person per day) but with high variability between different households (from 83 to 151 L per person per day). Average shower durations (self-reported 10–12 min) were higher than reported UK norms, although frequency was similar to the UK daily shower norm. Average measured shower volumes (51 L in one house) were not excessive, indicating shower fixtures provided a contribution to water saving.

1. Introduction

The privatised water supply companies in England and Wales have had a statutory duty to promote the efficient use of water since the 1990s [1] and in 2010 Ofwat (the economic regulator of the privatised water companies in England and Wales) introduced new prescriptive water saving targets [2]. Water policy-makers deal in the language of average “per capita consumption” (PCC) measured in litres per person per day (L/p/d), as a key metric for domestic water use. The estimated average PCC in England is about 150 L/p/d [3], although the latest reports, following seven years of highly publicized targets indicate that this figure is now reducing (141 L/p/d [4]). The current government ambition is to reduce average PCC to 130 L/p/d by the year 2030 [5].
This conservation goal presents several challenges for water companies in understanding the dynamics of daily water-using routines [6]. PCC is only an estimate [7] and can be calculated based on the measured water volume supplied to domestic properties divided by the estimated population served or based on a panel study of metered households for which water companies hold more reliable occupancy data [8]. In addition, only about half of domestic households are currently metered, although this number is increasing, with extensive regional metering programmes in some areas. In contrast, calculating the PCC for students living in university accommodation is easier and the results more reliable than calculations for the wider population, as information on lettings and corresponding occupancy is more readily available. However, assumptions still need to be made on actual occupancy levels, as a let flat may not be fully occupied, with tenants opting to spend much of their time living elsewhere with friends or, for UK-based students, returning home at weekends and holidays. Conversely, rooms may be over-occupied with house guests staying occasionally, regularly or on a semi-continual basis.
One methodological problem with relying on average PCC is that it represents an underestimate of total personal consumption. Water is not consumed by individuals solely within the household meaning that for most of the UK population, average PCC excludes personal water-use in places of work, education and leisure, through sanitation and hygiene (WC flushing and hand washing) or process water from the provision of drinks and meals consumed away from home (cooking and dishwashing). For example, daytime office use may add a further 16–28 L/p/d to personal consumption [9] to the current official estimate of PCC [5].
Another challenge is that the process of aggregating and averaging individual water use hides the variations in everyday personal water use patterns. There is growing interest in understanding more precisely how water is consumed in the course of everyday life, so that behaviourally-focused interventions can be designed to reduce consumption [10]. Micro-component studies indicate that there is a great variety in individual household patterns of consumption [11,12], made more difficult to measure when almost two thirds of consumption occurs in the privacy of a locked bathroom.
There is growing interest in viewing increasingly resource-intensive routines from a social practices perspective to examine the dimensions and dynamics of everyday life. This perspective helps to reveal the material cultures that underpin patterns of consumption, by daylighting the role of the constituent elements of material, skills and social understandings and their linkages that govern the reproduction and transformation of practices, and how material and social structures can limit individual agency [13]. Browne, et al. [14] have used cluster analysis to classify personal washing routines (showering and bathing) according to frequency, diversity, technology and out-sourcing, with social-demographic information layered upon the resulting practice clusters to describe and interpret the classification. Qualitative research into water use is clearly necessary, though difficult to organise.
Working with average PCC values also hides the differences between different demographic groups (age, gender or nationality). Research by Waterwise [15] indicates that younger people shower for about two-minutes longer than older population segments. Whilst education is seen to be important for creating more sustainable behaviours in both children directly and with other members of the household by ‘pester-power’ [16], there is little evidence of any effect on water use from the many environmental educational programmes delivered in UK schools [17], despite self-reporting of pro-environmental attitudes. Some research suggests that older generations may be more environmentally conscious and less consumptive [18]. There are likely to be stronger social pressures working in the opposite direction of rising environmental awareness among young adults, partly because of life-course stage and the need to conform to higher standards related to body-image and lifestyle aspirations. Young adults are at the transition point between maturing from dependent children into independent autonomous adults and universities can play an important role in facilitating social change to address important issues [19,20,21].
This research is focused upon the UK context, in terms of utility governance, infrastructure, supply pressures and social drivers but the authors recognise that there is a larger literature focusing on such issues outside the UK, including [22,23,24,25,26].
In this study the variations in showering routines amongst a group of mostly first year under-graduate students living in on-campus university accommodation were observed using a range of data including water consumed at both household and shower component level and self-reported data collected from user-questionnaires and diaries. These insights were combined with outputs from a series of focus groups, to evaluate a range of conventional technological and behavioural water-saving interventions, to collectively design alternative action programmes. The focus group discussions and outputs were structured using the Scottish Government “Individual-Social-Material” toolkit to move discussions beyond traditional individual behaviour change ideas to encompass wider social and material determinants. The ISM model is based on theory and was developed out of an international review of successful behaviour change initiatives [27]. It has been refined through research and the evaluation of alternative environmental behaviour change interventions.
A mixed-method approach was adopted, in which both quantitative volumetric and qualitative end-user data were collected. Data processing and analysis is on-going. The research is aiming to:
  • Develop experimental methods to test the efficacy of real-life water-saving interventions in a living laboratory (the initial design and some of the challenges faced with the complexity of triangulating between different epistemological and methodological approaches to combine volumetric and end-user reported data are reported in this paper);
  • Explore and analyse the variation and complexity of showering routines of young adults (early findings are reported here) and use these insights to;
  • Develop targeted practical and novel water efficiency interventions underpinned by theories of behaviour change and social practice (next steps, beyond the scope of this paper).

2. Materials and Methods

2.1. Participants and Setting

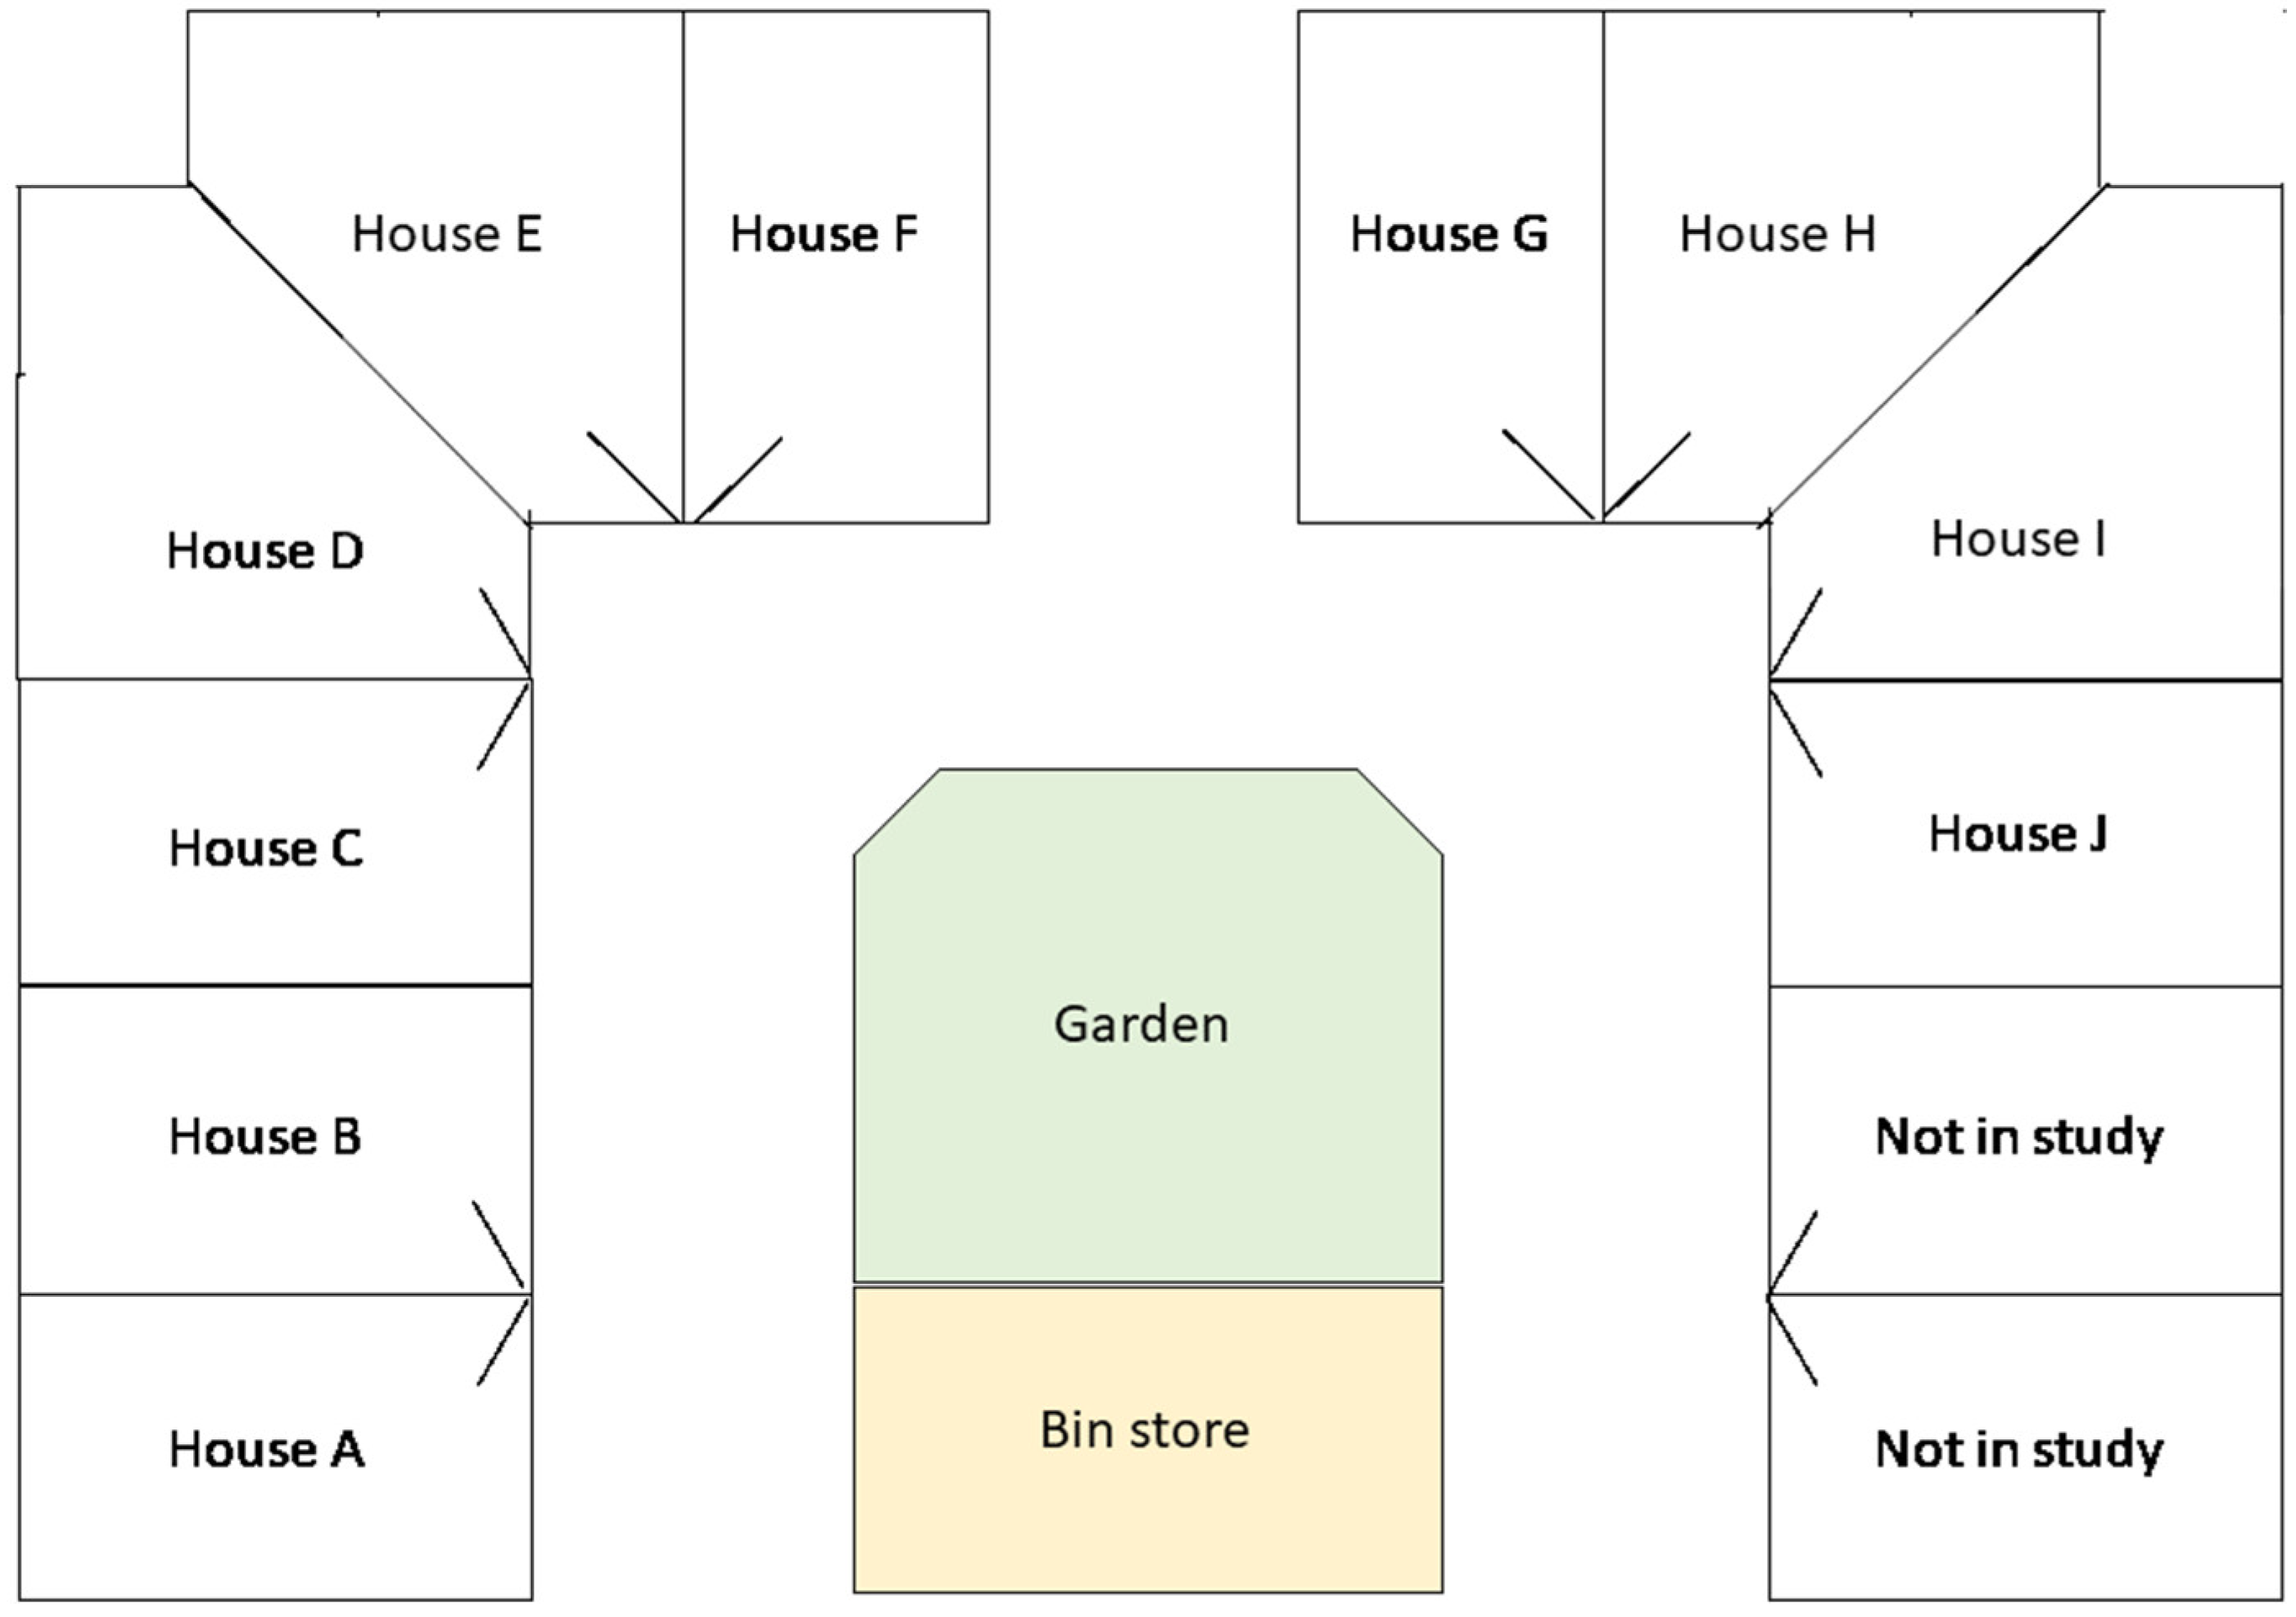
The fieldwork was conducted during the first quarter of 2018 and set out to explore the showering routines and associated water consumption by student residents. The study site concentrated on ten townhouses comprising 88 beds, within a larger 404-bed development, built in 2014 at the University of the West of England (UWE) main Frenchay campus located in Bristol. The water consumption for all 37 houses in the development is measured by sub-meters at 30-min intervals, as part of the Building Management System managed by the university Estates department. Two thirds of the houses in the development are comprised of twelve single study bedrooms. However, this study focused on ten of the smaller eight and ten-bed houses (total design occupancy of 88 persons), clustered together around a courtyard (labelled A-J in this paper to help preserve participant anonymity). In each house, the ground floor has a communal kitchen/diner with two mixer-tap sinks (high flow, no regulators) and a single dual-flush WC with wash-hand basin (with flow regulating tap aerators). Some leaking kitchen taps were identified and reported to the Estates department for fixing. The exterior of the development is shown in Figure 1 and a plan illustrating the configuration of the houses, arranged around a central courtyard is presented in Figure 2.
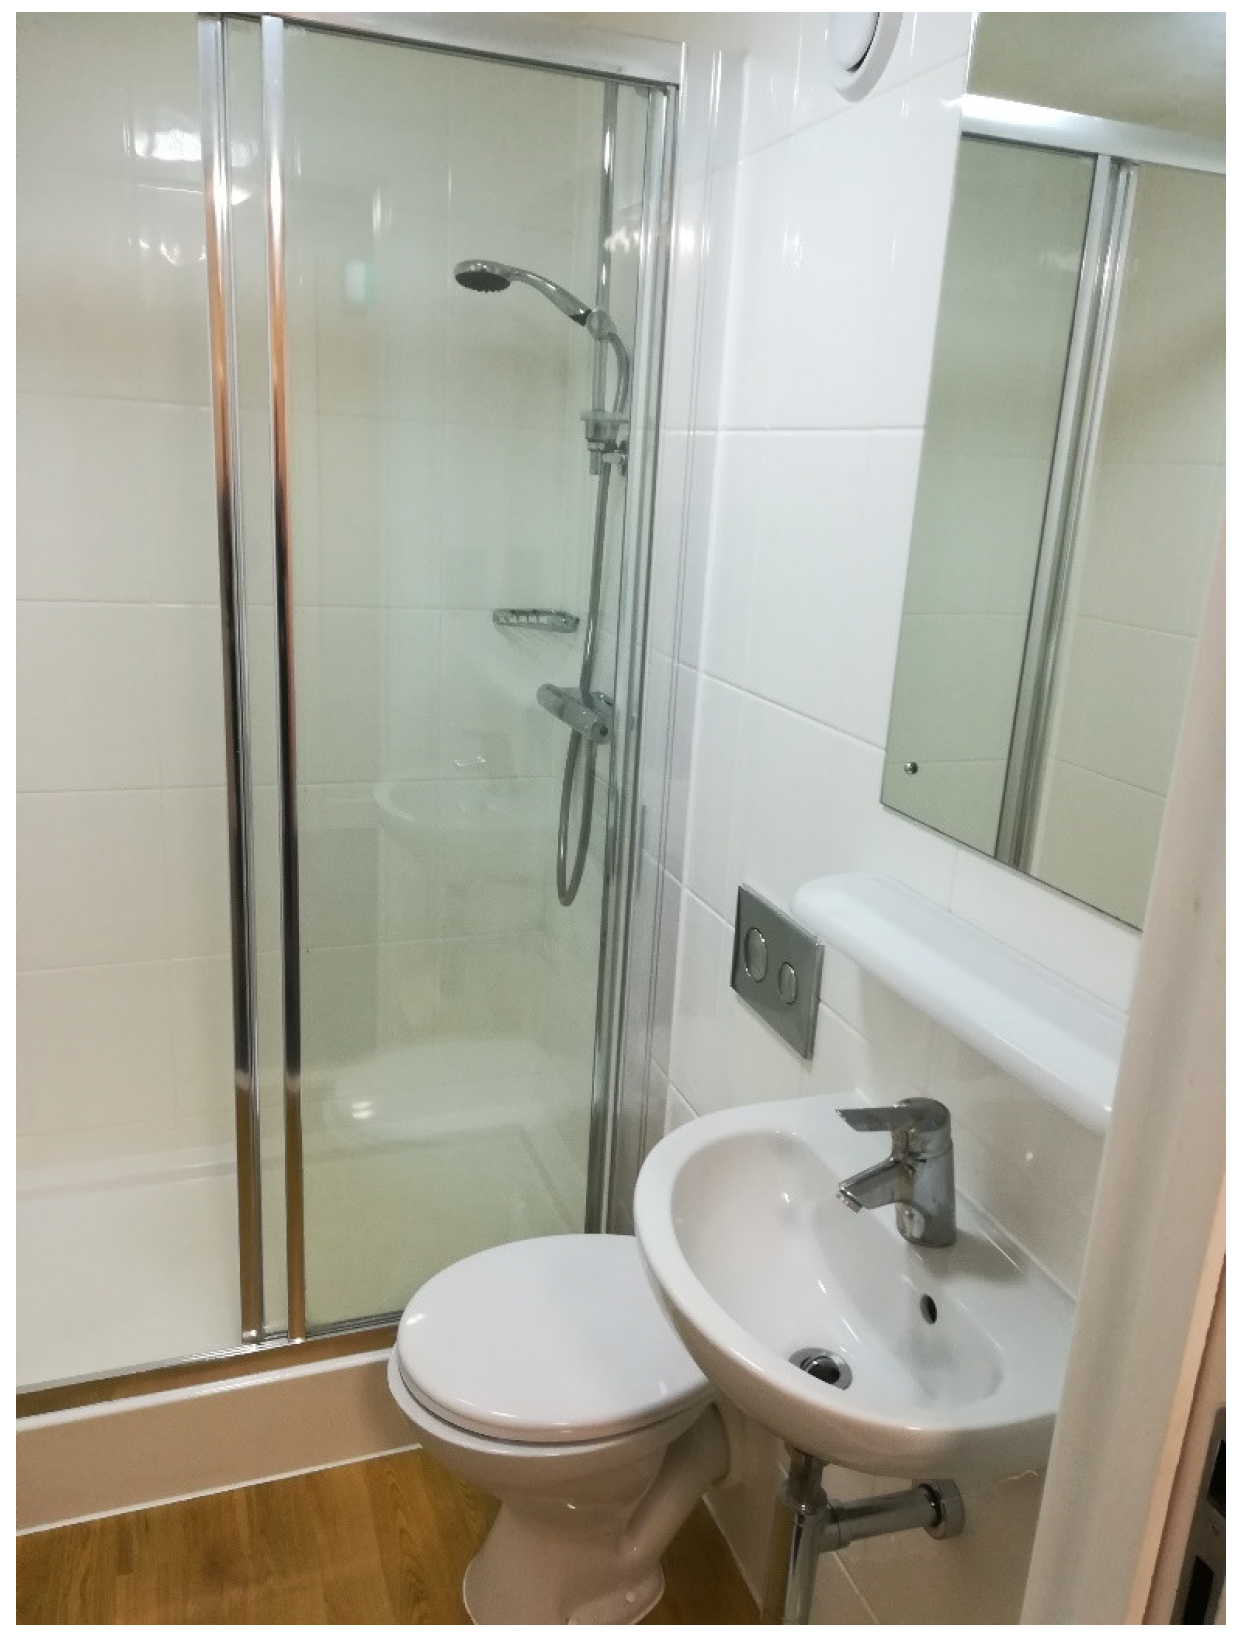
Six of the ten townhouses (A, B, C, F, G, J) comprise eight single bed study rooms with four shared WC/shower rooms (Figure 3) arranged across two upper stories (four bedrooms and two WC/shower rooms per floor). Four slightly larger corner-aspect townhouses (D, E, H, I) have the capacity for ten occupants, with one twin/shared bedroom, three single occupancy bedrooms and two shared WC/shower rooms on each of the upper two floors. The shower rooms include a shower enclosure with water efficient showerhead (c.8 litres per minute, L/m), wash-hand basin (tap-aerators, flow regulated to c.4–5 L/m) and a dual-flush (pneumatic) WC. Laundry facilities are provided centrally for residents in a separate building and are outside the scope of this study. There is no outside water use such as gardening or car washing that needs to be accounted for. Accommodation fees are inclusive of all water and energy and therefore, the residents are unlikely to be sensitised to the water-energy nexus of showering resource demand.
Demographic data from the university Accommodation Services are summarised in Table 1. The research team had no influence over the demographic allocation of residents to the study site. There were only two void beds (house E), whilst houses A, C and F were female only, to accommodate cultural expectations. Thirty-five residents (41%) had UWE gym membership (another location where showering might take place).
Ethical approval for this research involving human participants, using loggers, diaries, questionnaires and focus groups was approved by the University Research Ethics Committee in May 2017. The research was conducted in accordance with the UWE Bristol Code of Good Research Conduct [28].

2.2. Water Fixtures Audit

In August 2017, during the summer void period, the Researcher undertook an audit of the water fixtures within the un-occupied development to familiarise herself with the plumbing installations. Flow-rate data were collected for five townhouses across the wider 37-house development including two within the study site (houses B and G) and are indicative of the relatively standardised fixtures for each house across the estate. Note, the showerheads (manufactured by Ideal Standard) and tap aerators are exchanged (removed, cleaned and replaced) on a quarterly basis by the Estates department, as part of the Legionella control management protocol and are not necessarily replaced with identical fittings but with whatever is available at the time. The water fixtures are also flushed on a weekly basis during periods of no occupancy (not relevant for the period of this study).

2.3. Water Consumption Monitoring

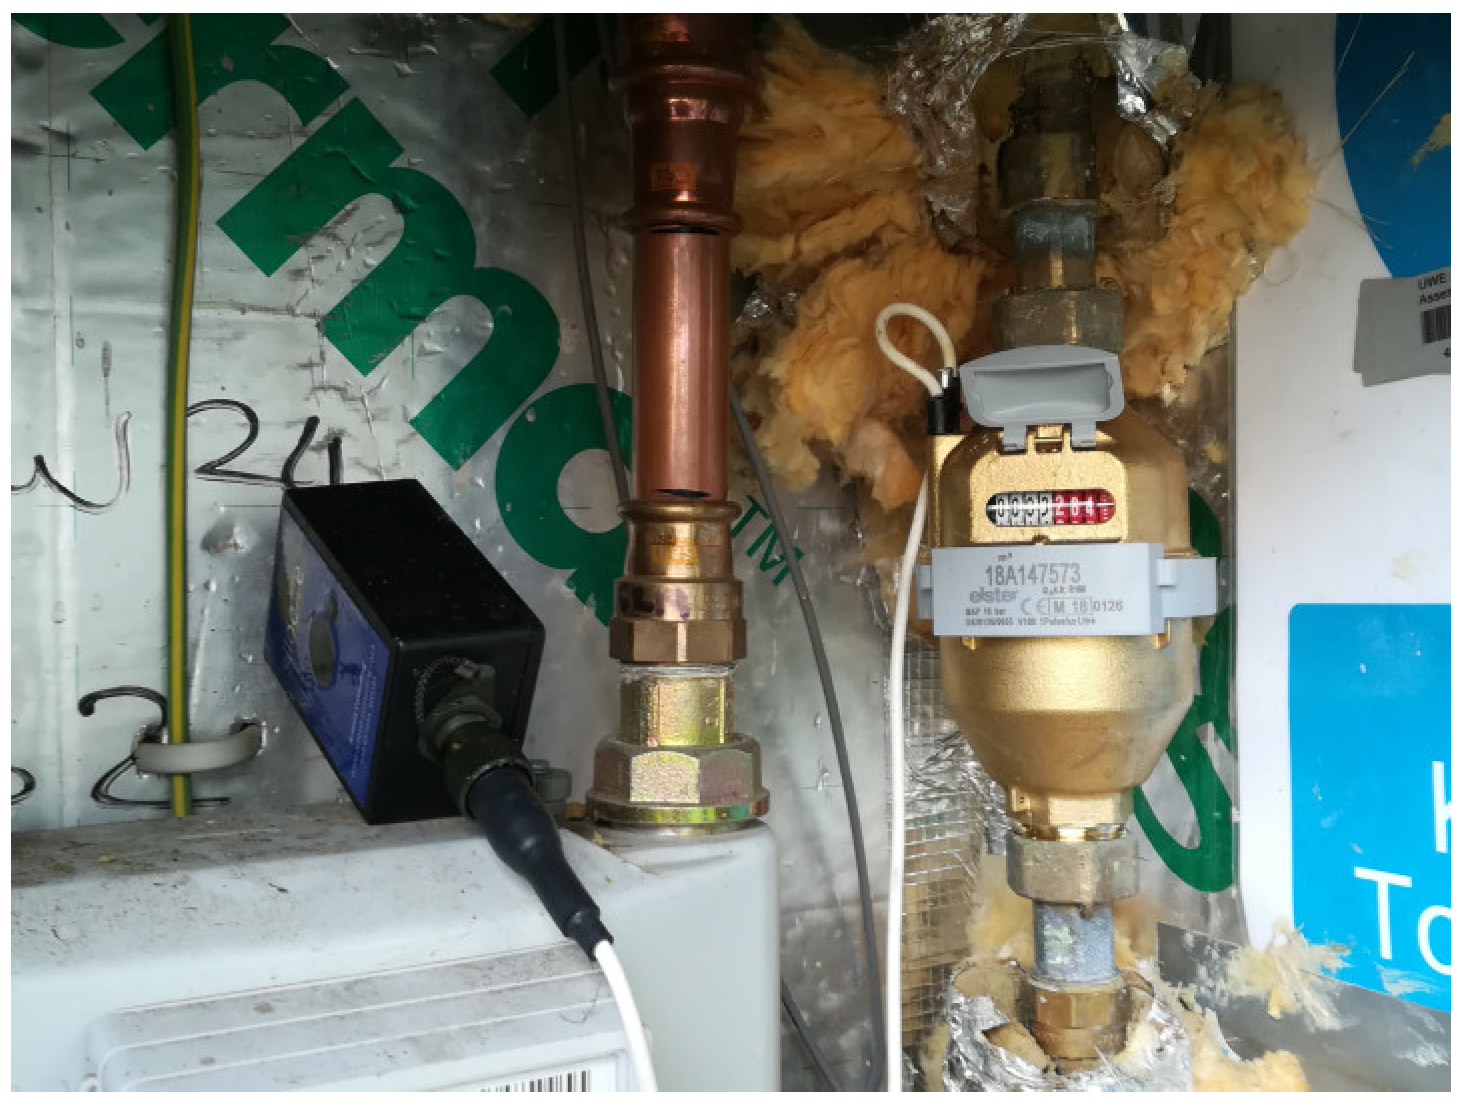
Each townhouse within the development is sub-metered at 30-min intervals as part of the university’s Business Management System (BMS). To supplement the BMS data, the ten townhouses in the study were also fitted with “Silhouette” loggers (supplied by Artesia Consulting, see Figure 4), which record a pulse for every 500 mL of water through the meter. This finer resolution is enough to identify individual shower events and allow analysis of flow, duration and frequency profiles within a household without being overwhelmed with data points (it is acknowledged that 500 mL is not sufficiently fine to accurately identify tap use at a fitting level). Application of segmentation algorithms allows researchers to bridge the gap between direct measurement of household-scale consumption and the specific contributions of individual water-using fixtures.
Following an 18-day test using one logger (from 15 November 2017, to check for metering system compatibility), Silhouette loggers were installed with splitter cables from each sub-meter on 18 and 19 December 2017 and removed on 26 March 2018.

2.4. Water-Saving Interventions

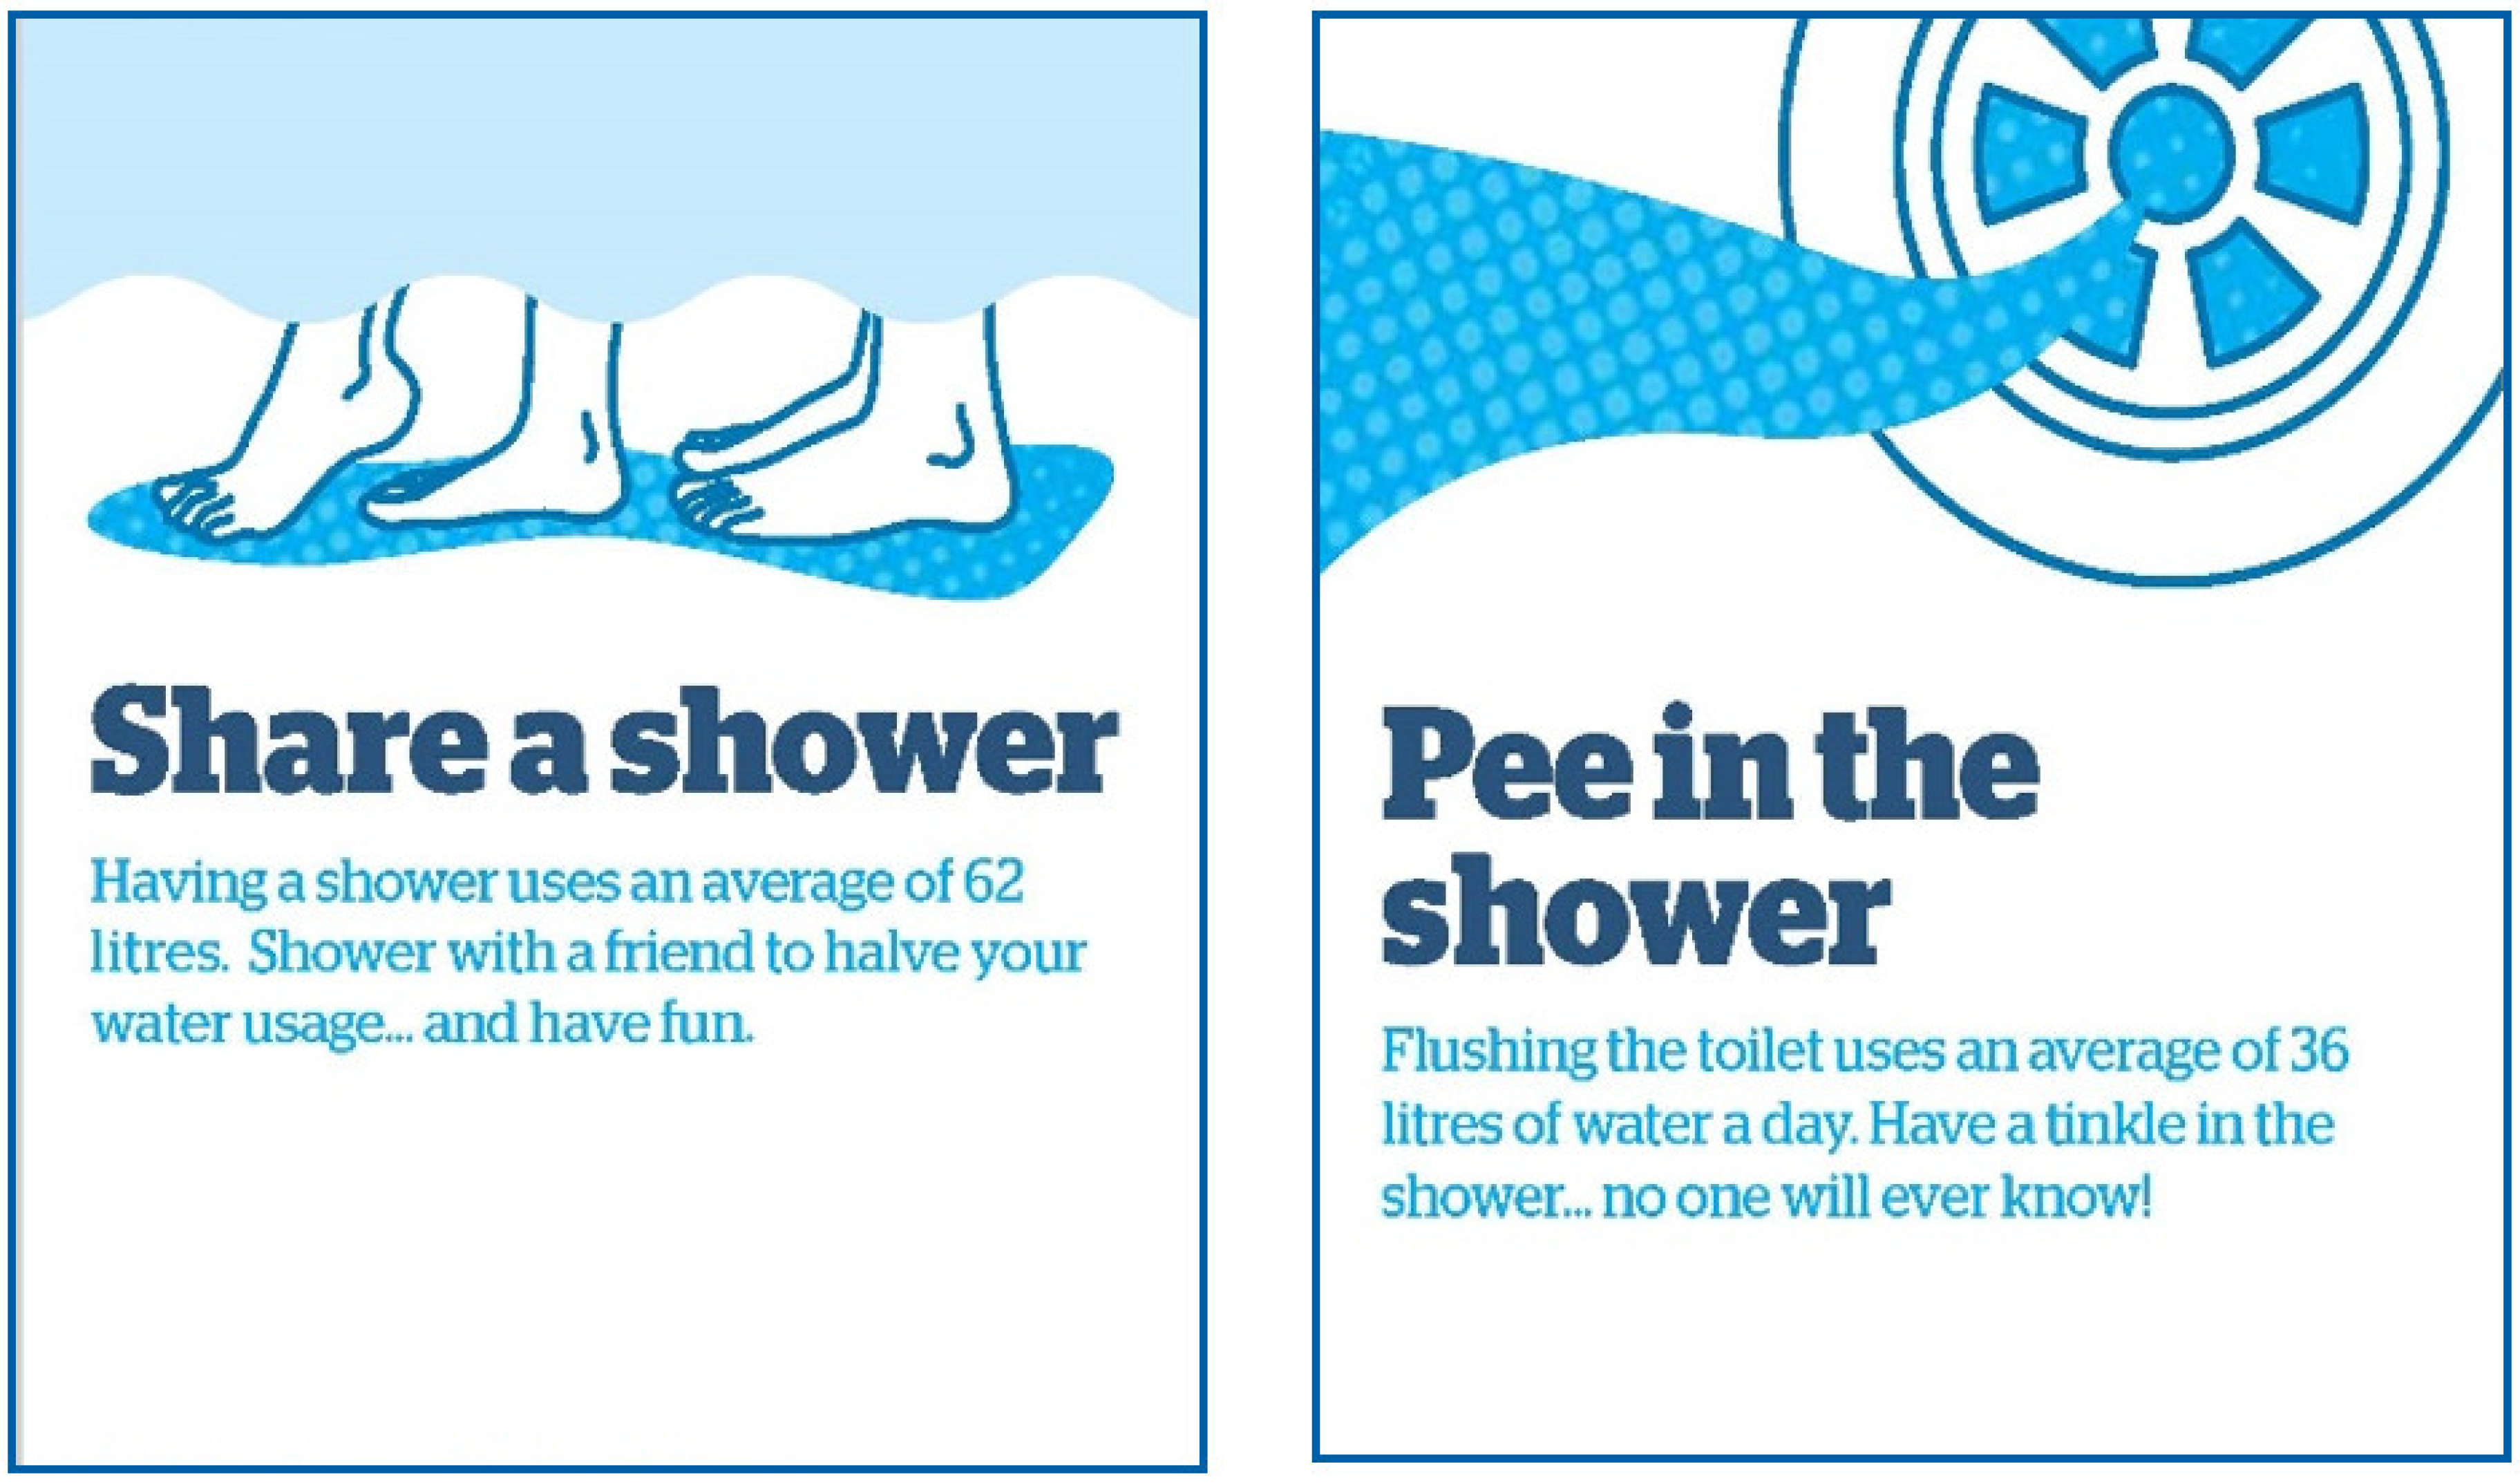
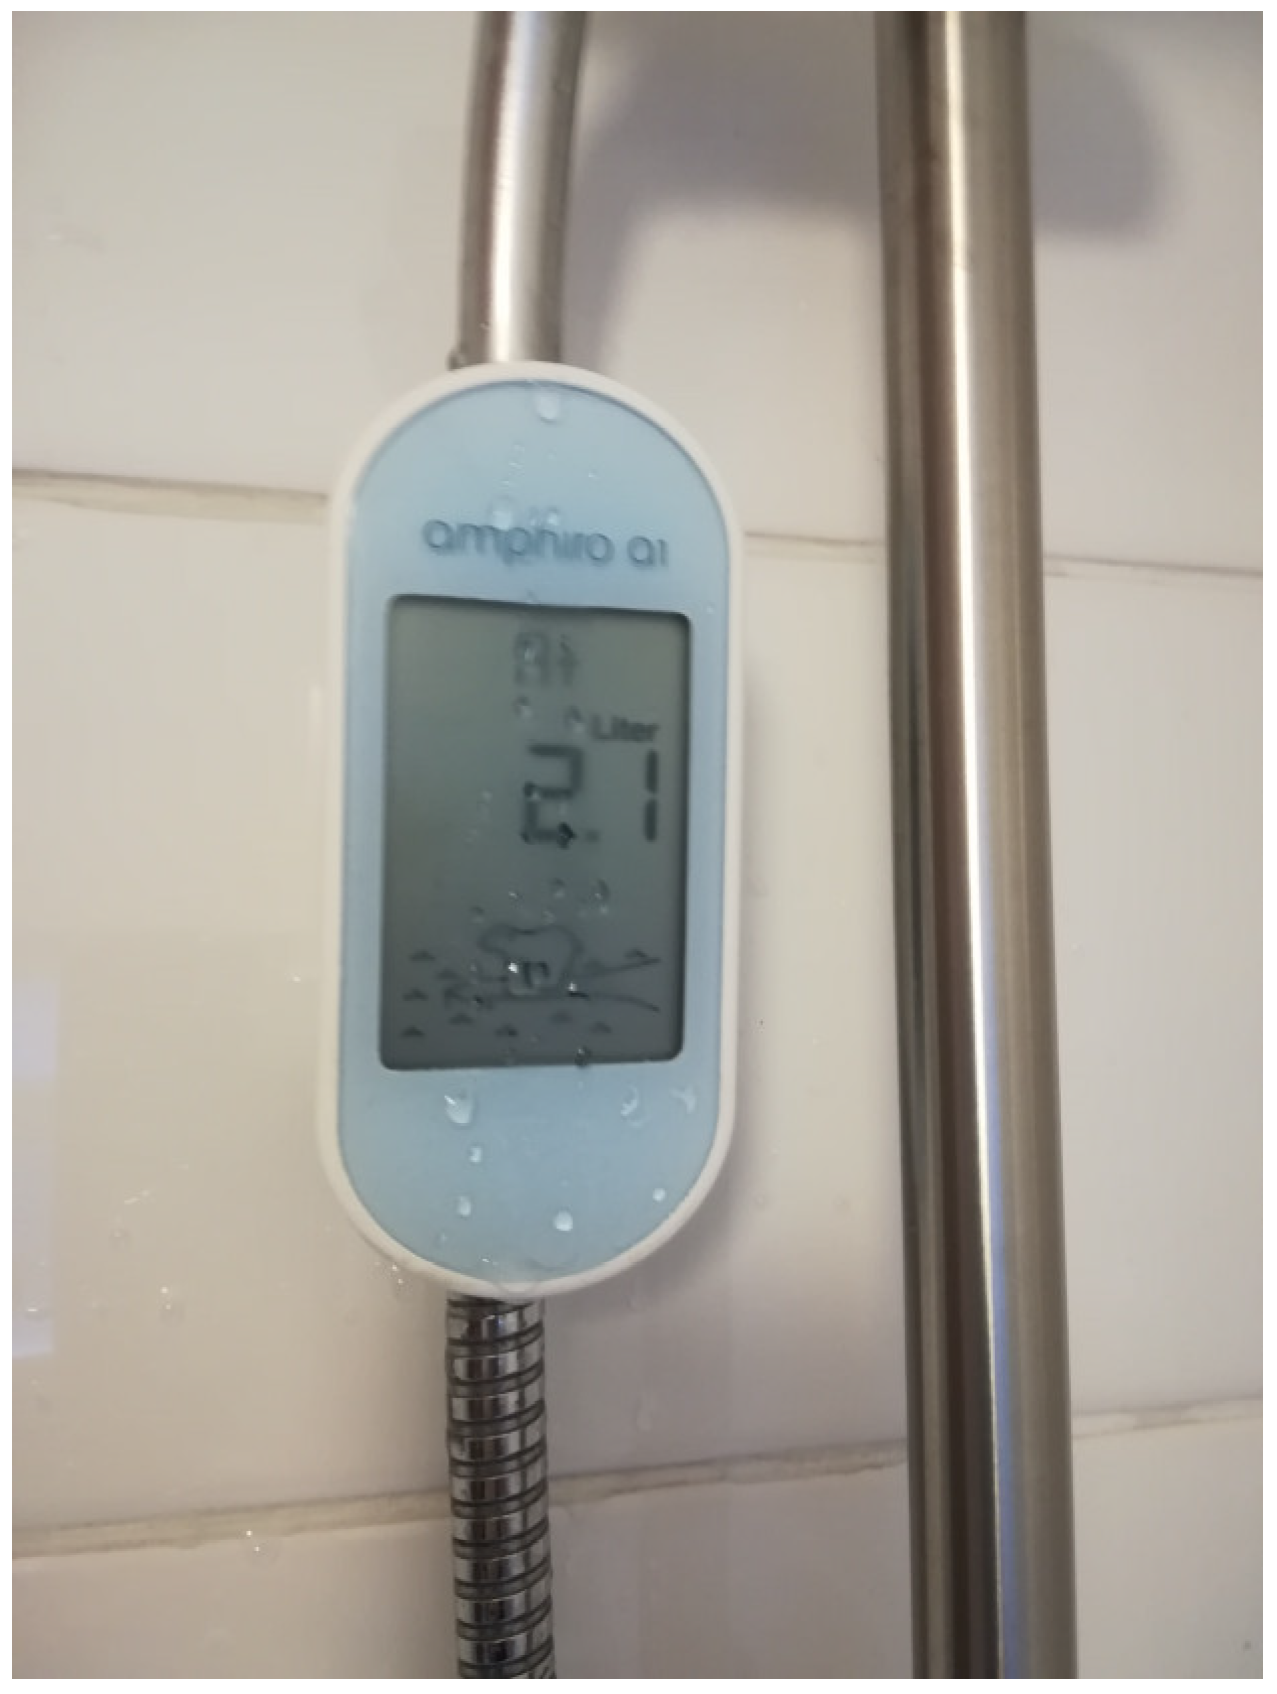
Conventional water-saving interventions of the sort deployed by current water company water-efficiency programmes were tested during the study in pairs of households. These are summarised in Table 2 and illustrated in Figure 5 and Figure 6.

2.5. Qualitative End-User Data Collection

To complement the volumetric data, user data from individuals was also collected to help understand the drivers, attitudes and perceptions underlying shower routines of student residents. Participants were principally recruited by door-knocking and leafleting of the target houses, with recruited participants subsequently asking their housemates to join in.
Initially, residents were asked to keep a simple shower diary for two weeks (21 February to 07 March 2018). The Researcher aimed to recruit two or three diary participants per house (20–30 in total, representing between a quarter and a third of the population). Active consent was obtained from all volunteers, as per the approval granted from the University’s research ethics governance process. Participants were compensated for their time and commitment with a £20 shopping voucher of their choice on return of completed diaries. Participants were provided with a simple two page template (one page per week), to record, for each shower:
  • Date
  • Time of day
  • Duration
  • Location (shower room or off-site)
  • Volume (Amphiro users only—houses G/H)
  • Products used
  • In-shower activities
  • Thoughts or emotions during the shower.
A series of five focus groups were conducted, one for each pair of houses/intervention type. The focus group workshop for houses I/J was conducted at the mid-way point of the diary fortnight, on 28-February 2018. This focus group had a dual purpose as it formed both the water-saving intervention itself (in the form of face-to-face education and engagement), and served to co-design future water-saving actions. The four subsequent focus groups followed a similar structure to evaluate and co-design interventions and these were run on Wednesday afternoons on 07 March (houses G/H); 14 March (2 focus groups, houses C/D, followed by houses E/F); and 21 March 2018 (houses A/B). The final focus group was used as a ‘wash-up’ session and any diarists that had been unable to attend earlier focus group were invited.
Diary participants were actively invited to take part and they were also encouraged to ask their housemates to join in. The Researcher also advertised the focus groups by delivering leaflets a few days before the planned sessions with the promise of refreshments and entry into a prize draw for a £20 shopping voucher for all participants of the focus groups. Each focus group was run within the downstairs communal dining/sitting area of one of the pairs of houses (with prior agreement from the residents, pragmatically selected based on the higher number of engaged participants to ensure maximum attendance) and lasted for about 1.5 h. Once the research ethics consent forms were completed over refreshments, an audio-recording of the discussion was made for later transcription.
The discussion started by setting ground rules; discussing why there is a need for water efficiency; how water is used in the home (with showering and bathing accounting for about a third of demand and growing [29]); and a description of conventional water-saving interventions. The rest of the focus group used the “Individual-Social-Material” toolkit [30] to structure dialogue to both evaluate trialled interventions and co-design future actions to tackle a specific showering metric (chosen by the focus group, such as flow rate, duration, frequency or in-shower activities). The 18 factors from the three ISM contexts (see Figure 7) were introduced with definitions on a set of prepared flashcards. Each factor was discussed in turn and colour-coded notes were made by the group on an A3 sheet (green for Individual, blue for Social and black for Material contexts).
At the end of the diary fortnight, an online questionnaire was launched (07 to 21 March 2018) and all previously recruited research participants (directly by email) and other residents (via leaflets and word of mouth) in houses A-J were invited to take part. The questionnaire collected information on environmental awareness, showering habits and other water-using routines, water fixtures at home and demographic information. The questions were similar to a wider questionnaire targeted at all UWE students in October 2017. Participation was incentivised with entry into a prize draw for a £20 shopping voucher. Example questionnaire questions relating specifically to showering routine included:
1. 
Duration: Before the trial, approximately how many minutes do you spend in the shower (each time you shower)? Has this changed since the trial? [yes, no, don’t know] If yes, please describe how this has changed.
2. 
Frequency: How often do you shower? [More than once per day, Every day, 5–6 times per week, 3–4 times per week, 2 times per week, About once a week, Other]
3. 
Time of day: When do you usually shower? [Mostly first thing in the morning, usually before going out in the evening, usually before going to bed, No fixed pattern, Other]
4. 
Flow: When you first turn the shower on, do you: [Start showering straight away, wait a short while for the water to warm up before getting under, Turn the shower on then do something else while you wait for it to warm up, Other]
5. 
Products: How many different personal shower products do you use during a typical shower? For example: shampoo, conditioner, shower gel, soap, shaving gel/mousse, exfoliator, face-wash, face-pack, etc. [0, 1, 2, 3, 4, 5, more than 5]
6. 
Activities: Which activities do you undertake during a typical shower? Please tick ALL that apply. [Shampoo hair once, Shampoo hair twice, Condition hair, Wash body, Wash face, Exfoliate, Shave, Face-pack, Brush teeth, Other]

3. Results and Discussion

3.1. Quantitative Consumption Data Analysis

The results of the water fixtures audit are summarised in Table 3. Despite the same standard of fittings broadly installed across the estate, the water audit found some variability in flow rates. Most of the 26 showerheads tested were water efficient, ranging between 7 and 9 L/m and manufactured by Ideal Standard. However, one showerhead delivered a flow of more than 14 L/m (regulating the flow from 21 L/m without the showerhead). In contrast, one showerhead only delivered 4.2 L/m (with a flow of just 4.4 L/m without the showerhead).
In analysing the metered water consumption data from the BMS, it became apparent that the telemetry sometimes sticks. There were several periods before, during and after the trial in which the consumption value for a 30-min period was repeated in the next and subsequent time steps and this pattern could be detected across multiple sub-meters for the same time steps. This discovery puts a question mark over the reliability and accuracy of the BMS sub-meter water consumption data for this specific trial. Fortunately, higher quality data covering a period later in the year are available, as are data from other student accommodations on the same campus.
During the focus group and questionniare phase, the estate experienced a major water mains-burst event which resulted in a large proportion (c.40%) of the campus estate, including the trial site, having no mains-supplied water for a period of more than 30 h (from 02:30 h 14 March to 12:00 h 15 March 2018). When the water was turned back on following the repair, debris was pulled through into the pipework and resulted in several sub-meters including one of the trial houses (house A) being damaged (and flat-lining). In addition, for the duration of the trial, there is no BMS data for house G.
The BMS water consumption by paired household for the study period is summarized in Table 4. Preliminary analysis reveals that houses A/B (controls) had substantially higher PCCs than other houses in the study, including before interventions, whilst houses I/J had the lowest PCC for most of the study (except house H in the last week of the monitoring period). Change in average PCC between the different trial phases, from pre- to post-intervention showed a modest reduction for the houses with the posters (C/D, 5.1%) and shower timers (E/F, 5.5%). Whilst these reductions are greater than the control houses (A/B, 3.9%), further statistical analysis is required to assess if these changes are significant. Houses G/H (Amphiro) revealed the greatest PCC reduction (13.3%). Houses I/J, that received the face-to-face engagement session/focus group intervention showed a slight increase in PCC (+1.5%) but they consistently had the lowest PCC during the monitoring period.
Artesia Consulting downloaded the Silhouette logger data. Unfortunately, only one logger (house G, with the Amphiro smart meter intervention and 8 residents) recorded any pulses for the duration of the main trial. Subsequent investigation has shown that the splitter cables did not operate as expected and, in most cases, failed to send pulses to the loggers. For house G, the pulses were recorded at the expense of main sub-meter data recorded by the BMS. A solution to this problem was worked on prior to a repeated trial(s).
For house G, a total of 263 shower events were identified across 51 days of monitoring (from 22 January when the teaching term commenced, and full occupancy was assumed, to 13 March 2018, before the mains-burst ‘no water’ event). These results are summarised in Table 5. The top half of the Table shows that a mean per household consumption (PHC) for all days of 740.7 L per household per day (L/h/d) and assuming eight occupants, this equates to a modest PCC of 92.6 L/p/d. Showering activities account for just over one third of total household consumption (35.7%). Total water use is higher on weekdays, compared with weekends, with a slightly higher shower component. Average shower frequency for house G is notably lower (only 5.2 showers per day, equating to 0.65 per person per day) but of a slightly higher duration (9.1 min) than reported UK norms (of a daily 7 or 8-min shower [15]). Average shower volumes of 51.1 L are not excessive, indicating that the shower fixtures help to curtail consumption despite slightly longer durations.
The lower half of Table 5 provides summary consumption, shower frequency and durations for varying periods within the study period (for all days) that correlate with interventions. It illustrates that the installation of the Amphiro devices on 14 February appears to lower both total PHC (by 7%) and the shower component by an impressive 21% from 264.7 to 209.6 L/h/d. In addition, the shower frequency reduced by 13.5% (from 5.2 to 4.5) and the volume reduced by a significant 40.3% (from 51.1 to 30.5 L).
There are several explanations for this. The presence of the Amphiro appeared to slightly lower the mean shower flow from 6 L/min to 5.7 L/min (5% flow reduction) and the physical presence of the in-shower display facilitated a behavioural change in showering practice. During the period that participants were keeping diaries (21 February to 07 March 2018, see Section 3.2—only two out of eight occupants), the act of recording diaries brought the showering routines into their consciousness and altered the participant shower behaviours. Finally, during the later stages of the monitoring period, PHC and per household shower use reduced due to reduced occupancy, as students took early vacations or trips home to prepare end of term assignments.
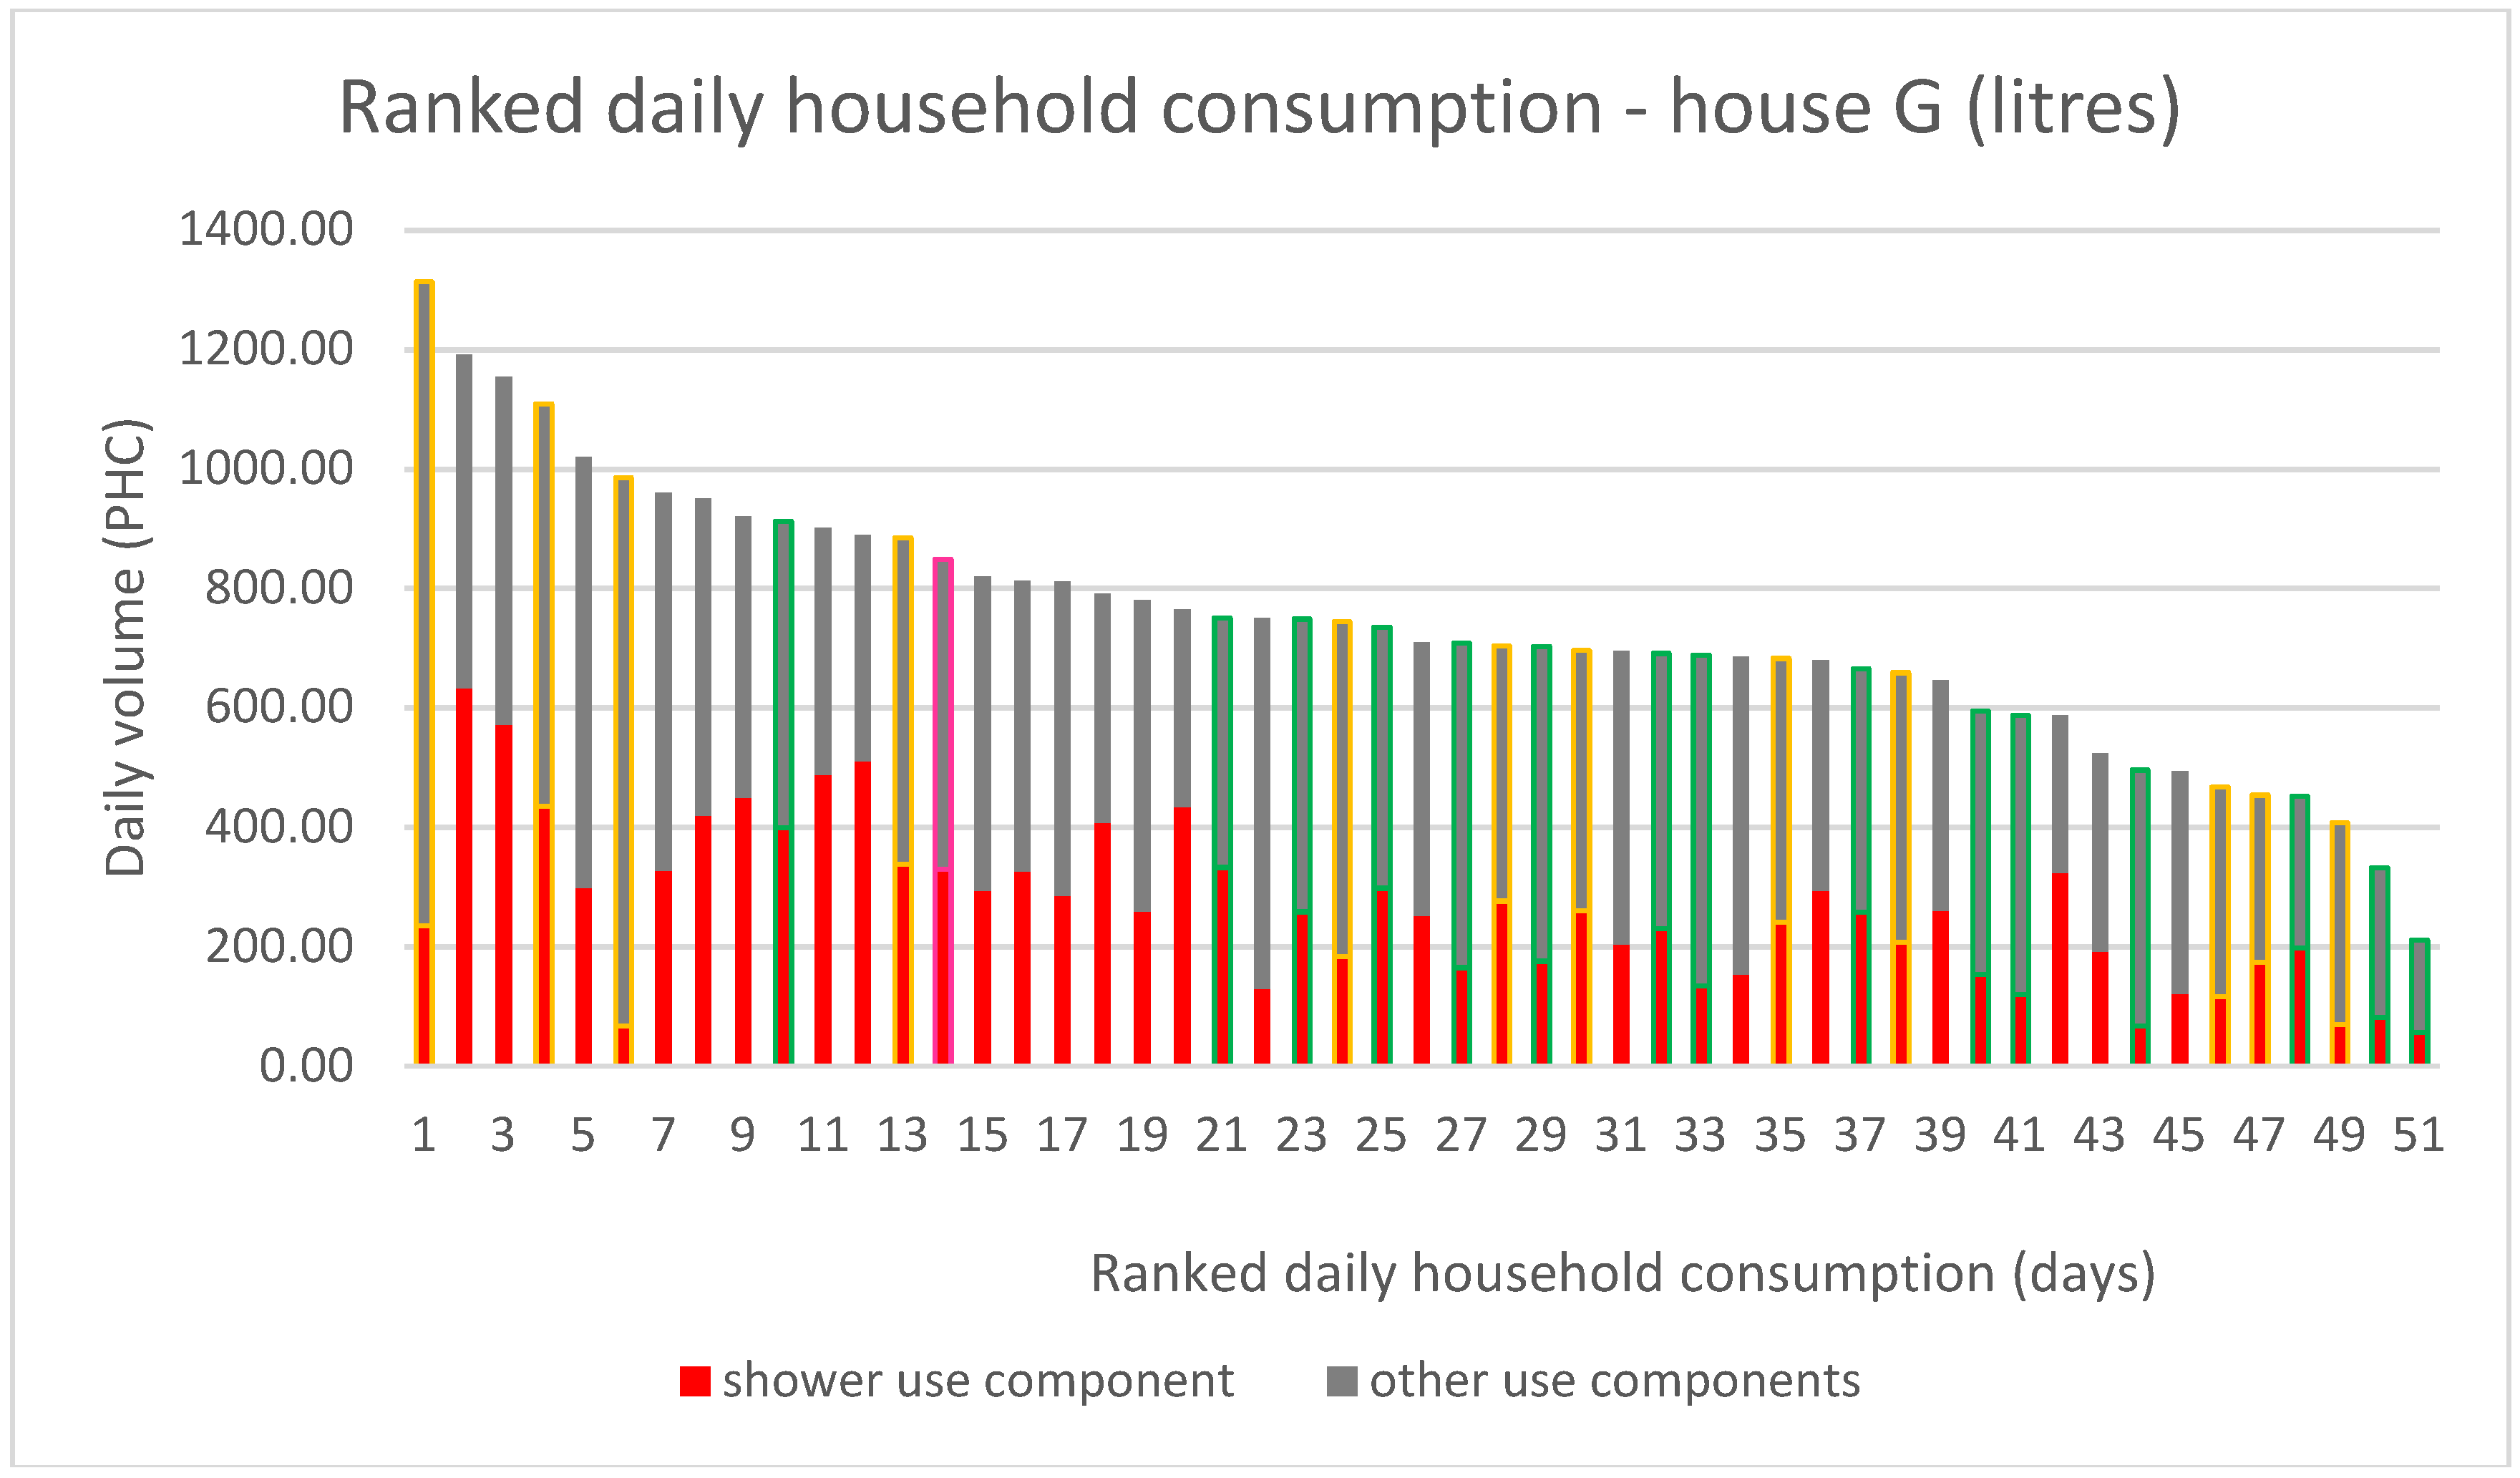
Figure 8 shows the correlation in the proportion of daily PHC (ranked from high to low)) with the associated showering component (red portion of the bars, 35% on average). Bars with no coloured outline represent days prior to intervention (before 14 February 2018, 23 days). Fifteen of the highest ranked days (top 25 days, above the median) correspond to pre-intervention days, with only seven pre-intervention days in the lower PHC days. The day that the Amphiro devices were installed (14 February 2018) is outlined in pink (ranked 14th out of 51 days by PHC volume). The days that diaries were recorded are outlined in green (21 February to 07 March 2018), whilst the days when the Amphiros were in situ, (but not diaries) are outlined in orange.

3.2. Qualitative End-User Data Analysis

There were 34 unique participants across all the user data collection methods, representing a 34% participation rate (adjusted for five participants recruited from outside the main study site). Participation (split by gender) is summarised in Table 6. There were nine participants (six females and three males) that contributed to all three methods (diaries, focus groups and questionnaire), representing 10% of the study population.
The diary method had the highest participation (19 female including three from outside the study site and 7 male). This high recruitment may be because the Researcher set out to recruit participants to keep diaries first; they were guaranteed a £20 shopping voucher on completion; and it was earlier in the semester, before end-of-term assessments loomed. Even removing the three female participants from site Q, the sample was skewed towards female participation (69% sample, versus 62% population). This may be due to recruitment bias on the part of the female Researcher or it may be evidence that females are more willing to be engaged in this sort of research.
The shower characteristics as self-reported in shower diaries are summarized in Table 7. The diaries confirm the norm of a near daily shower (0.98 showers per day), although this ranges from 0.4 (for a participant in house G, equivalent to every 2 or 3 days) through to 1.8 (nearly twice a day for a resident in house ‘Q.’ Most participants reported above social norm durations, with the mean for all diarists 11.2 min. House I/J bucked the trend and reported average durations in line with the UK 7 to 8-min norm, ranging from 3 to 20 min. The participants from the other houses collectively reported some excessively long showers of more than half an hour. Participants used an average of 2.5 products (shampoo, shower gel, etc.) and undertook 3.4 in-shower activities (such as shampooing hair, conditioning hair, washing body or face, shaving etc.) per shower.
Following the gender imbalance in diary participants, dominated by females, the pendulum swung in the opposite direction for the focus groups with more male participants (including two new recruits, from site Q). The immediacy of the activity being situated within the student house and the opportunity for free food (pizza) and juice may have influenced this change in gender participation; or because attendance at the focus group was perceived as less of a time commitment. Alternatively, females may be more reluctant to discuss private showering habits within the collective context of a focus group, preferring more private means of communication. These ideas will be explored in subsequent research.
Only in the first focus group on 28 February 2018, hosted by house J, did participants from the other paired house participate, despite multiple invitations via email, leaflet and door-knocking. This workshop was also the only gender-balanced group. As noted above, it also doubled up as the intervention itself (Table 2) and therefore, it was important that the diarists participated. The scheduling also meant that it was early into the participation process and did not get jeopardised by course assignment deadlines and other distractions.
The ISM model was used to structure discussions to evaluate conventional interventions (such as shower-timers, low-flow showerheads, posters, education and smart meters (Amphiros) and to co-design potential novel interventions. The ISM framework helped to capture a broad range of influences around shower use and the features of flow, duration, frequency and in-shower activities. The discussion meandered around because the disparate factors from the different domains (of Individual, Social and Material) are interconnected and complex. The ISM model helped to reach beyond individual determinants and uncover some of the wider social influences on showering routines. Whilst the participants struggled to relate some of the factors to their own experiences, those from houses C/D and E/F could relate more readily to the realities of water shortages, as these focus groups took place on 14 March 2018 during the ‘no water’ event, making the issue more tangible.
Focus group participants that had received the poster interventions, were favourable towards the ‘Pee in the shower’ poster but felt that it simply made the practice socially legitimate for those that already do it and therefore, would not actually result in any real water savings. The ‘Share a shower’ poster was deemed to be less practical and had the potential to result in longer duration showers, especially with having to negotiate space to access products or water flow within the confined space of the cubicle.
The Amphiro smart meters were favourable with the participants (especially those from house H who had experience of using them), as the device has power to interact with individual values and beliefs (to avoid drowning the polar bear) and setting norms for individual performance (litres used). Several participants that did not trial the Amphiro, voiced a need for an (at the point of use) in-shower technology (via a water proof visual display or audio play list), coupled with a Fitbit-type device or mobile phone app (several participants reported taking their phones into the shower room to play music). The device also served as a topic of conversation within the household (house H), bringing in the social dimension of comparison and competition. Some considered purchasing an Amphiro for their shared house the following academic year as a way of monitoring hot water use to make the division of water and energy bills more equitable.
The evaluation questionnaire had the lowest uptake, with 19 participants (15 female). This lower participation was disappointing as it provided rich background information on the student’s water-using routines along with socio-demographic information to supplement Accommodation Services lettings and demographic data. However, the Researcher also has the results of a similar questionnaire from October 2017 targeted as all UWE students, in which 158 responses were received (66% female, 33% male).
The questionnaires confirmed that young adults shower for longer durations than the general population, with average self-reported shower durations of 10–12 min, up to a maximum of 60 min (October 2017 questionnaire). Half of respondents take a daily shower with a further quarter showering between 4 and 6 times per week and 8% showering more than once per day. There is no clear pattern in terms of the time of day but morning showerers spend two- minutes less time performing their ablutions. The majority use at least three products (such as shampoo, conditioner, shower gel, etc.) and perform at least three activities (wash hair, condition hair, wash body, shave, etc.) in the shower.

4. Conclusions

This research is at an early stage and the first phase of fieldwork described in this paper has been used to test the experimental design. The research aims to use a combination of different metrics, including sub-meter PHC data alongside shower micro-components to quantify the showering routines of young adults. The initial development of an experimental design to test the efficacy of real-life water-saving interventions in a living laboratory has been described. Prior to undertaking the research stakeholders from Estates and Accommodation services were engaged and the research team familiarised themselves with the configuration, infrastructure and fixture performance of the houses to be tested. Challenges with the physical measurement of water consumption at both the household and shower fixture scale have been reported.
Despite apparent standardisation of water fixtures across the estate, there remains some inherent variability within the shower flow rates, compounded by the routine swapping of showerheads during Legionella risk management processes. Further investigation is needed to understand why the BMS consumption data is not completely reliable and accurate and a solution will be developed for the household meters to operate in parallel with the micro-component loggers in the next round of data collection.
Traditional volumetric data has been complemented with the collection of end-user insights into the complexity, heterogeneity and reality of how showering is practiced among the target user group, and how it might change during the transition from home to adult independence. The Researcher developed a degree of trust via dialogue with students living in the selected houses within the study site, to recruit end-users willing to accept water-saving interventions, record their showering routines (via diaries), share aspects of their personal and very private showering patterns (via questionnaires) and discuss influencing factors across individual, social and material domains on their showering behaviours, facilitated using the ISM model to bring rigour to evaluate and design of real-world water-saving interventions.
The next step is to combine the different strands of quantitative water consumption data with the qualitative insights to fully evaluate the efficacy of a range of conventional water-saving interventions. This appraisal will provide a platform to design novel water-saving approaches that can be tested using a modified experimental design (to address some of the challenges and limitations as reported here). The future intervention(s) will focus on the showering practices of users that have extended the purpose of showering beyond a personal cleaning function, into a leisure activity in the pursuit of high-intensity personal grooming standards (termed ‘Attentive cleaning’ [14]). The novel intervention(s) will focus on lengthy hair washing/conditioning routines of those that have multiple bottles of products lined-up in the shower cubicle, who take lengthy showers in the afternoon and evening, benefiting from the unlimited supply of hot water included in their housing rent, by making a connection to the social aspects of showering. Approaches to target other types of shower pattern, such as reducing the duration of ‘Simple daily showering’ [14] will also be explored.

Author Contributions

K.S. undertook the bulk of the research, from conception and design, through delivery, analysis and drafting this paper, as part of her PhD research. C.S. and S.W. supported K.S. in supervisory roles, providing guidance, sharing their experience and have assisted with addressing reviewer’s questions.

Funding

This doctoral research is part of the International Water Security Network and is funded by Lloyd’s Register Foundation, a charitable foundation helping to protect life and property by supporting engineering-related education, public engagement and the application of research. Grant number G0068.

Acknowledgments

Bristol Water PLC provided the 4-min shower timers and posters. Thanks to the Student Ambassadors who helped with the water fixtures audit and Artesia Consulting who loaned the Silhouette loggers and helped to segment the shower events. The Researcher is eternally grateful for the committed support of Alan Cook (UWE Estates), who installed the Silhouette loggers and Amphiro a1 shower meters, provided the BMS sub-meter data (and his patience when the Doctoral Researcher failed to read the sub-meters properly!). The Researcher is grateful to the 34 committed student residents who kept diaries, completed the evaluation questionniare, and/or hosted and participated in focus groups. Finally, thanks go to Rosie for helping prepare 18 ISM factor flashcards for use in the focus group sessions.

Conflicts of Interest

The authors declare no conflict of interest.

References

  1. Water Industry Act 1991. Part IIIA, Section 93A. Duty to Promote the Efficient Use of Water. Available online: https://www.legislation.gov.uk/ukpga/1991/56/contents (accessed on 30 April 2018).
  2. Water Briefing. Ofwat Plans Water Efficiency Targets for Companies. 2008. Available online: https://www.waterbriefing.org/home/regulation-and-legislation/item/3351-ofwat-plans-water-efficiency-targets-for-companies (accessed on 4 January 2017).
  3. Defra. Future Water: The Government’s Strategy for England. 2008. Available online: https://assets.publishing.service.gov.uk/government/uploads/system/uploads/attachment_data/file/69346/pb13562-future-water-080204.pdf (accessed on 4 January 2017).
  4. Water UK. The Amount We Use. Apr 2016–Mar 2017. Available online: https://discoverwater.co.uk/amount-we-use (accessed on 15 February 2018).
  5. HM Government. Future Water: The Government’s Water Strategy or England. 2008. Available online: https://assets.publishing.service.gov.uk/government/uploads/system/uploads/attachment_data/file/69346/pb13562-future-water-080204.pdf (accessed on 17 January 2019).
  6. Economic and Social Research Council. The Shower-Bath-Path: Even Private Habits Are Shared. 2011. Available online: http://www.lancaster.ac.uk/staff/shove/exhibits/showerv2.pdf (accessed on 1 November 2016).
  7. Holden, J. Water Resources: An Integrated Approach; Routledge: London, UK; New York, NY, USA, 2014. [Google Scholar]
  8. Edwards, K.; Martin, L. A methodology for surveying domestic consumption. Water Environ. J. 1995, 9, 477–488. [Google Scholar] [CrossRef]
  9. Construction Industry Research and Information Association. Water Key Performance Indicators and Benchmarks for Offices and Hotels. 2016. Available online: https://www.ciria.org/ProductExcerpts/C657.aspx (accessed on 23 February 2017).
  10. Jenkins, J.; Pericli, A.; Palframan, L. An exploration of customer attitudes toward water conservation measures in East Hertfordshire. In Proceedings of the Water Network Water Efficiency Conference, Brighton, UK, 9–11 September 2014; pp. 39–48. [Google Scholar]
  11. UK Water Industry Research. Integration of Behavioural Change into Demand Forecasting and Water Efficiency Practices; Report No. 16/WR/01/15; UK Water Industry Research: London, UK, 2016. [Google Scholar]
  12. UK Water Industry Research. Understanding Customer Behaviour for Water Demand Forecasting; Report No. 14/WR/01/14; UK Water Industry Research: London, UK, 2014. [Google Scholar]
  13. Hand, M.; Shove, E.; Southerton, D. Explaining Showering: A Discussion of the Material, Conventional, and Temporal Dimensions of Practice. Sociol. Res. Online 2005, 10, 1–13. Available online: https://journals.sagepub.com/doi/pdf/10.5153/sro.1100 (accessed on 22 January 2019). [CrossRef]
  14. Browne, A.; Pullinger, M.; Anderson, B.; Medd, W. Patterns of Water: Resource Pack. Results from the ARCC-Water/SPRG UK Household Water Practices Survey. Available online: http://www.sprg.ac.uk/uploads/resource-pack.pdf (accessed on 17 April 2018).
  15. Walker, G.; Zygmunt, J. The Water and Energy Implications of Bathing and Showering Technologies: A Review; Waterwise: London, UK, 2009; Available online: http://www.waterwise.org.uk/wp-content/uploads/2018/02/Waterwise-2009_The-Water-and-Energy-Implications-of-Bathing-and-Showering-Behaviours-and-Technologies.pdf (accessed on 1 November 2016).
  16. Damerell, P.; Howe, C.; Milner-Gulland, E.J. Child-oriented environmental education influences adult knowledge and household behaviour. Environ. Res. Lett. 2013, 8. [Google Scholar] [CrossRef]
  17. Bremner, S.; Jordan, D. Investigating the Impact of Water Efficiency Educational Programmes in Schools: A Scoping Study and Evidence Base Project; Waterwise: London, UK, 2012. [Google Scholar]
  18. Roberts, J.A. Green consumers in the 1990s: Profile and implications for advertising. J. Bus. Res. 1996, 36, 217–236. [Google Scholar] [CrossRef]
  19. Finlay, J.; Massey, J. Eco-campus: Applying the ecology model to develop green university and college campuses. Int. J. Sustain. High. Educ. 2012, 13, 150–165. [Google Scholar] [CrossRef]
  20. Moore, J. Barriers and pathways to creating sustainability programs: Policy, rhetoric and reality. Environ. Educ. Res. 2005, 11, 537–555. [Google Scholar] [CrossRef]
  21. Clarke, A.; Kouri, R. Choosing an appropriate university or college environmental management system. J. Clean. Prod. 2009, 17, 971–984. [Google Scholar] [CrossRef]
  22. Manouseli, D.; Anderson, B.; Nagarajan, M. Domestic Water Demand during Droughts in Temperate Climates: Synthsising Evidence for an Integrated Framework. Water Resour. Manag. 2018, 32, 433–447. Available online: https://link.springer.com/article/10.1007/s11269-017-1818-z (accessed on 4 January 2019). [CrossRef]
  23. Viera, P.; Jorge, C.; Covas, D. Novel Performance Assessment Indices for Domestic Water Use. 13th Computer Control for the Water Industry Conference, CCW1 2015. Available online: https://www.sciencedirect.com/science/article/pii/S1877705815026132 (accessed on 4 January 2019).
  24. Schuetze, T.; Santiago-Fandiño, V. Quantitative Assessment of Water Use Efficiency in Urban and Domestic Buildings. Water 2013, 5, 1172–1193. Available online: https://doaj.org/article/8e8266c9de284688870f17aeac42845c (accessed on 4 January 2019). [CrossRef]
  25. Gram-Hanssen, K.; Christensen, H.T.; Madsen, L.V.; do Carmo, C. Sequence of Practices in Personal and Societal Rhythms—Showering as a Case. Time Society. 2019. Available online: https://journals.sagepub.com/doi/pdf/10.1177/0961463X18820749 (accessed on 22 January 2019).
  26. Sharpe, R.A.; Osborne, N.J.; Skerrat, G. Household water efficiency strategies in Cornwell, SW England. Water Environ. J. 2015, 29, 457–473. Available online: https://www.onlinelibrary.wiley.com/doi/full/10.1111/wej.12150 (accessed on 4 January 2019). [CrossRef]
  27. Southerton, D.; McMeekin, A.; Evans, D. International Review of Behaviour Change Initiatives; Scottish Government: Edinburgh, Scotland, UK, 2011. Available online: http://www.gov.scot/Resource/Doc/340440/0112767.pdf (accessed on 30 October 2017).
  28. UWE Bristol. Code of Good Research Conduct. Available online: https://www1.uwe.ac.uk/research/researchgovernance/codeofgoodresearchconduct.aspx (accessed on 24 January 2017).
  29. Energy Saving Trust. At Home with Water: The Biggest Ever Review of Domestic Water Use in Great Britain. 2013. Available online: http://www.energysavingtrust.org.uk/sites/default/files/reports/AtHomewithWater%287%29.pdf (accessed on 17 April 2018).
  30. Darnton, A.; Horne, J. Influencing Behaviours—Moving beyond the Individual: A User Guide to the ISM Tool; Scottish Government: Edinburgh, UK, 2013. Available online: http://www.gov.scot/Resource/0042/00423436.pdf (accessed on 30 October 2017).
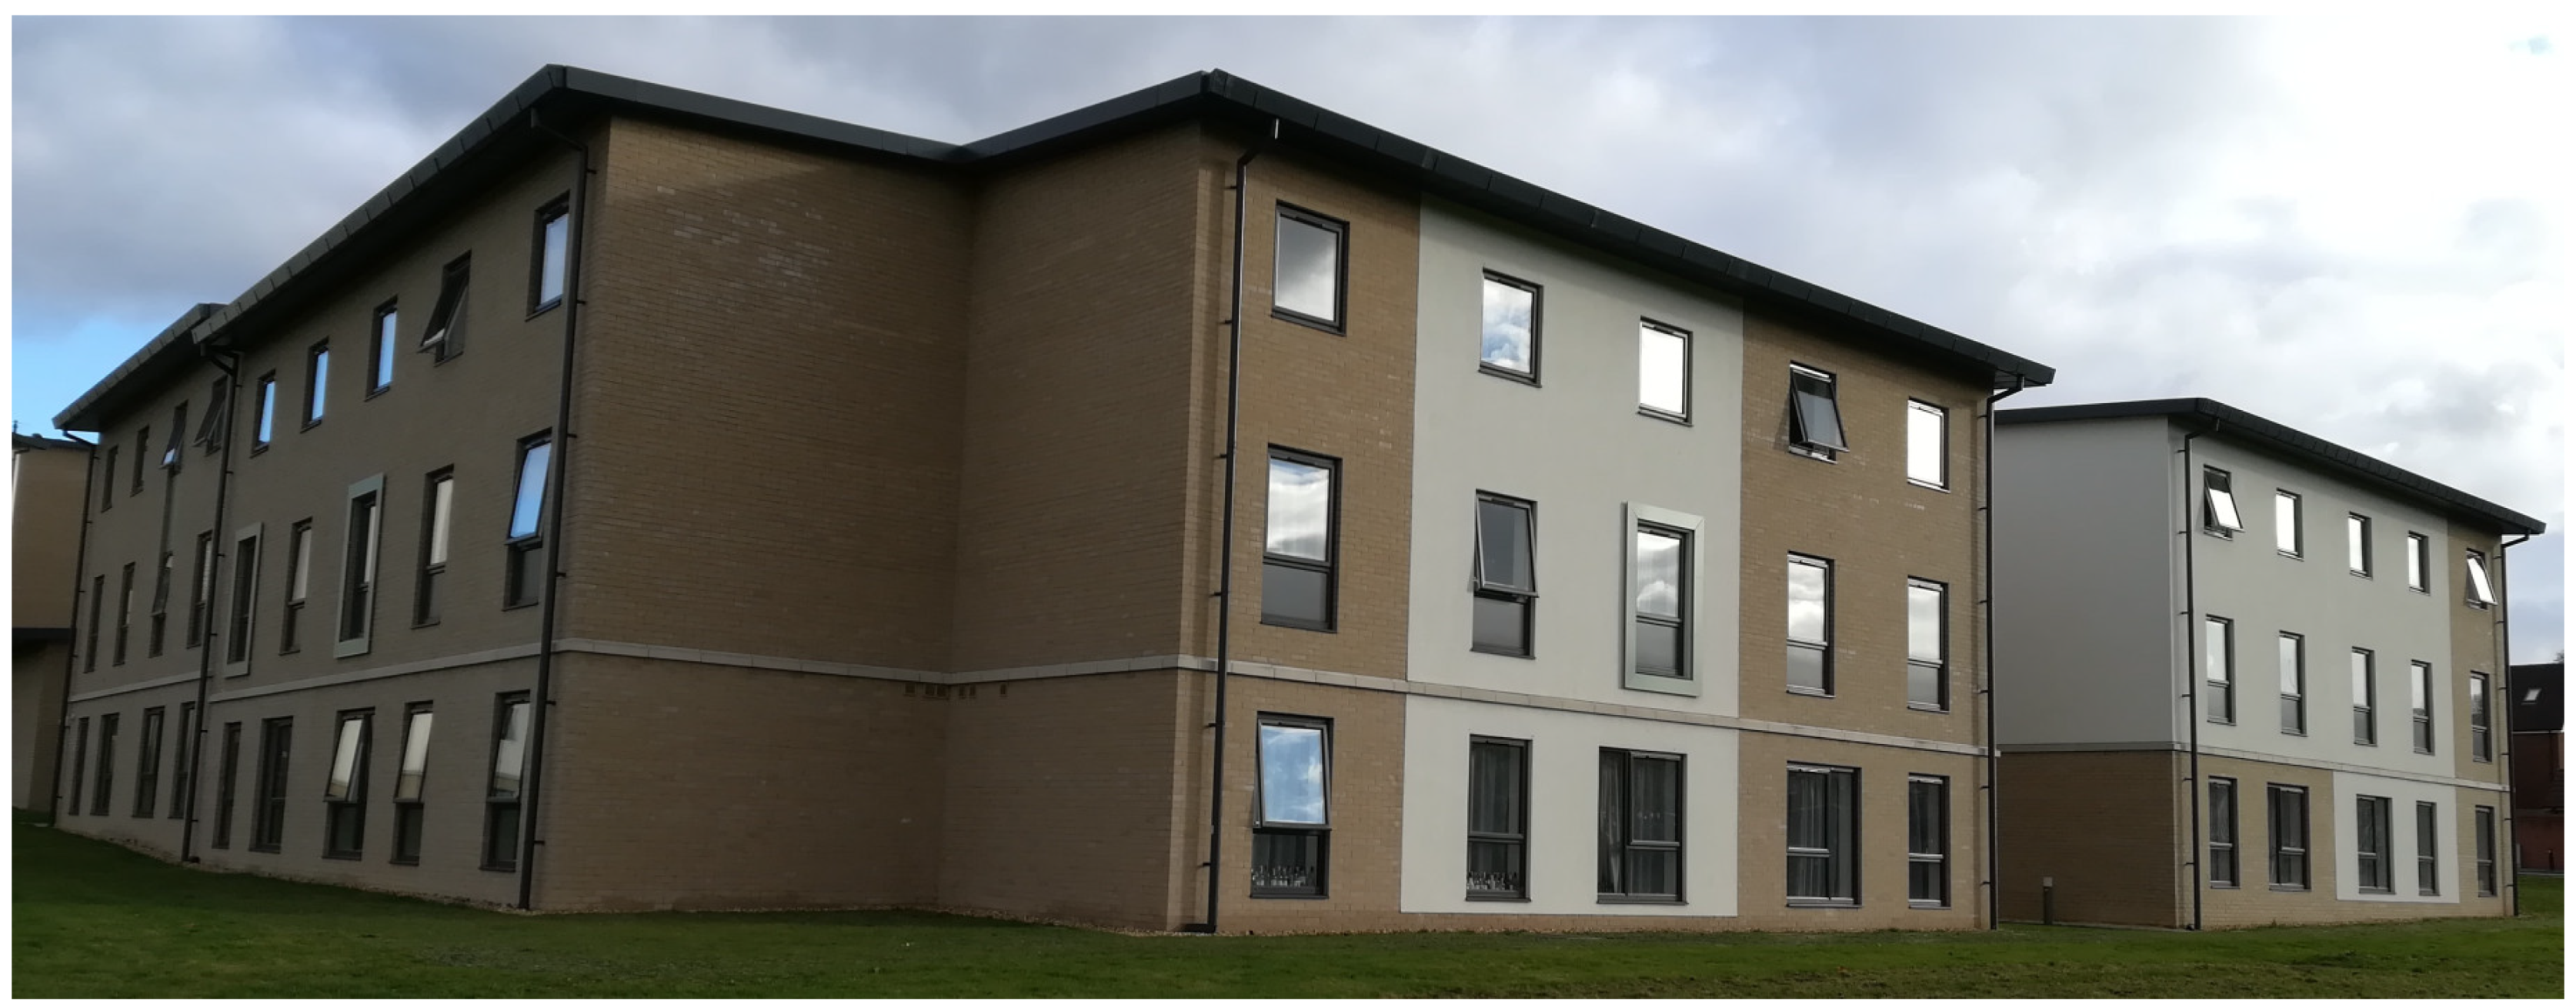
Figure 1. Exterior of university housing development (from rear corner of houses H and I). Used with permission of the creator.
Urbansci 03 00019 g001
Figure 2. Plan of study site (not to scale).
Urbansci 03 00019 g002
Figure 3. Shower/WC room. Used with permission of the creator.
Urbansci 03 00019 g003
Figure 4. Silhouette logger (black box) attached to water meter. Used with permission of the creator.
Urbansci 03 00019 g004
Figure 5. Posters displayed on back of shower room doors in houses C (‘Share a shower’) and D (‘Pee in the shower’). Used with permission of Bristol Water PLC.
Urbansci 03 00019 g005
Figure 6. Amphiro a1 smart shower device. Used with permission of the creator.
Urbansci 03 00019 g006
Figure 7. Individual-Social-Material model (Crown Copyright). From Darnton and Horne (2013) [30].
Urbansci 03 00019 g007
Figure 8. Ranked daily Per Household Consumption assigned to showers and other uses (house G).
Urbansci 03 00019 g008
Table 1. Demographics of residents in the study site.
HouseOccupancy Gender Ratio
(Female:Male)
Age Range
(18–22 Years:23–29 Years)
UWE Gym MembershipNationality
(UK, EU, Non-EU)
A88:03:551, 0, 7
B84:48:027, 0, 1
C88:07:140, 0, 8
D105:56:425, 0, 5
E8 (2 void)5:37:146, 0, 2
F88:08:025, 2, 1
G84:48:025, 2, 1
H103:79:148, 2, 0
I104:69:178, 2, 0
J84:47:137, 1, 0
Total8653:3372:143552, 9, 25
%97.7% of max62:38%84:16%41%61, 11, 29%
Table 2. Summary of water-saving interventions tested.
HouseInterventionLocation
A/BNil—control group
C/DPosters
(installed 14-February, removed 07-March 2018)
Generic water-saving messages in communal area notice board/downstairs WC (back of door)
‘Share a shower’ (house C) and ‘Pee in the shower’ (house D) in shower rooms (back of door) (see Figure 5)
E/F4-mintue shower timers
(left with diary participants on 21-February 2018)
One per resident
G/H Amphiro a1 smart shower meter
(installed 14-February, diary participants briefed on 21-February 2018)
Installed in each shower room (see Figure 6)
I/JFace-to-face engagement
(28-February 2018, 2.30 pm in house J)
Communal area—all residents invited, refreshments provided
Table 3. August 2017 water fixtures audit—summary of shower flow rates.
HouseNumber of ShowersMean Showerhead Flow Rate (L/m)Mean Unregulated Shower Flow (no Showerhead, L/m)
B48.08.7
G47.711.3
Q168.910.1
Q267.59.6
Q366.66.9
Total267.79.2
Table 4. Per Capita Consumption for different phases of monitoring across the study site (L/p/d).
HouseWhole Study PeriodPre-InterventionInterventions DeployedDiariesPost-DiariesChange in PCC (L and %)
22 January–13 March22 January–13 February14 February–20 February21 February–07 March08 March–13 MarchBetween pre- /post-intervention
Interventions (poster/timer/Amphiro) NoneInstalled (as Table 2)Diaries (see Section 3.2)Remain in situ
No. days51237156
A/B150.9157.0140.6148.1146.310.6 (3.9%)
C/D124.4131.1134.9119.897.833.2 (5.1%)
E/F106.3112.4111.9100.790.122.3 (5.5%)
G 1/H106.6123.0110.295.968.854.3 (13.3%)
I/J83.382.189.078.5 293.4+11.2 (+1.5%)
Mean114.3121.1117.3108.499.321.8 (5.6%)
1Siloette logger data used in lieu of BMS failure for house G.2intervention (focus group) deployed 28 February.
Table 5. Summary of Per Household Consumption and shower micro-component, house G.
VariableNumber of DaysMean PHC (L/h/d)Shower Volume Component of Mean PHC (L/h/d and %)Mean Shower Event Frequency (L/h/d)Mean Shower event Duration (Digital Minutes)Mean Shower Event Volume (L)
All days:51740.7264.7 (35.7%)5.29.151.1
Weekday37788.9284.8 (36.1%)5.49.352.2
Weekend14613.5211.6 (34.5%)4.48.747.4
Amphiro in situ 28687.2209.6 (30.5%)4.58.830.5
Diaries only15618.7195.5 (31.6%)4.78.431.6
Diaries to end21606.4189.4 (31.2%)4.29.031.2
Table 6. Summary of participants (split by gender).
HouseInterventionDiariesFocus GroupsQuestionnaire Responses
QControl3 Urbansci 03 00019 i001 12 Urbansci 03 00019 i002 21 Urbansci 03 00019 i001,1 Urbansci 03 00019 i002 3
AControl1 Urbansci 03 00019 i00100
BControl1 Urbansci 03 00019 i001 1 Urbansci 03 00019 i0021 Urbansci 03 00019 i001 1 Urbansci 03 00019 i0021 Urbansci 03 00019 i001
CPoster 11 Urbansci 03 00019 i00102 Urbansci 03 00019 i001
DPoster 22 Urbansci 03 00019 i001, 1 Urbansci 03 00019 i0022 Urbansci 03 00019 i001 3 Urbansci 03 00019 i0021 Urbansci 03 00019 i001 1 Urbansci 03 00019 i002
EShower timers2 Urbansci 03 00019 i00102 Urbansci 03 00019 i001
FShower timers3 Urbansci 03 00019 i0013 Urbansci 03 00019 i0014 Urbansci 03 00019 i001
GAmphiro2 Urbansci 03 00019 i00101 Urbansci 03 00019 i001
HAmphiro2 Urbansci 03 00019 i001 3 Urbansci 03 00019 i0021 Urbansci 03 00019 i001 5 Urbansci 03 00019 i0022 Urbansci 03 00019 i001 1 Urbansci 03 00019 i002
IFace-to-face2 Urbansci 03 00019 i0012 Urbansci 03 00019 i0010
JFace-to-face2 Urbansci 03 00019 i0021 Urbansci 03 00019 i001 3 Urbansci 03 00019 i0021 Urbansci 03 00019 i001,1 Urbansci 03 00019 i002
Total 19 Urbansci 03 00019 i001, 7 Urbansci 03 00019 i00210 Urbansci 03 00019 i001, 12 Urbansci 03 00019 i00215 Urbansci 03 00019 i001, 4 Urbansci 03 00019 i002
Urbansci 03 00019 i001= female, Urbansci 03 00019 i002= male.
1 
diaries = 3 females from site Q (outside study site, within 37-house development)
2 
focus groups—2 males from site Q (outside study site, attended house C/D focus group)
3 
questionnairess = 1 male from site Q (outside study site, (also attended house C/D focus group).
Table 7. Summary of shower characteristics self-reported in shower diaries.
HousesMean Frequency (per Day)Frequency Range (Min-Max, per Day)Mean Duration (Minutes)Duration Range (Min-Max, Minutes)Average Number of ProductsAverage Number of In-Shower Activities
A/B/Q0.980.5–1.814.05–302.73.6
C/D1.050.8–1.410.02–482.93.2
E/F1.060.9–1.114.13–433.33.7
G/H0.890.41.19.42–341.93.3
I/J0.960.7–1.17.63–202.12.9
All0.98 11.2 2.53.4