Using Building Floor Space for Station Area Population and Employment Estimation


Abstract
1. Introduction
2. Background
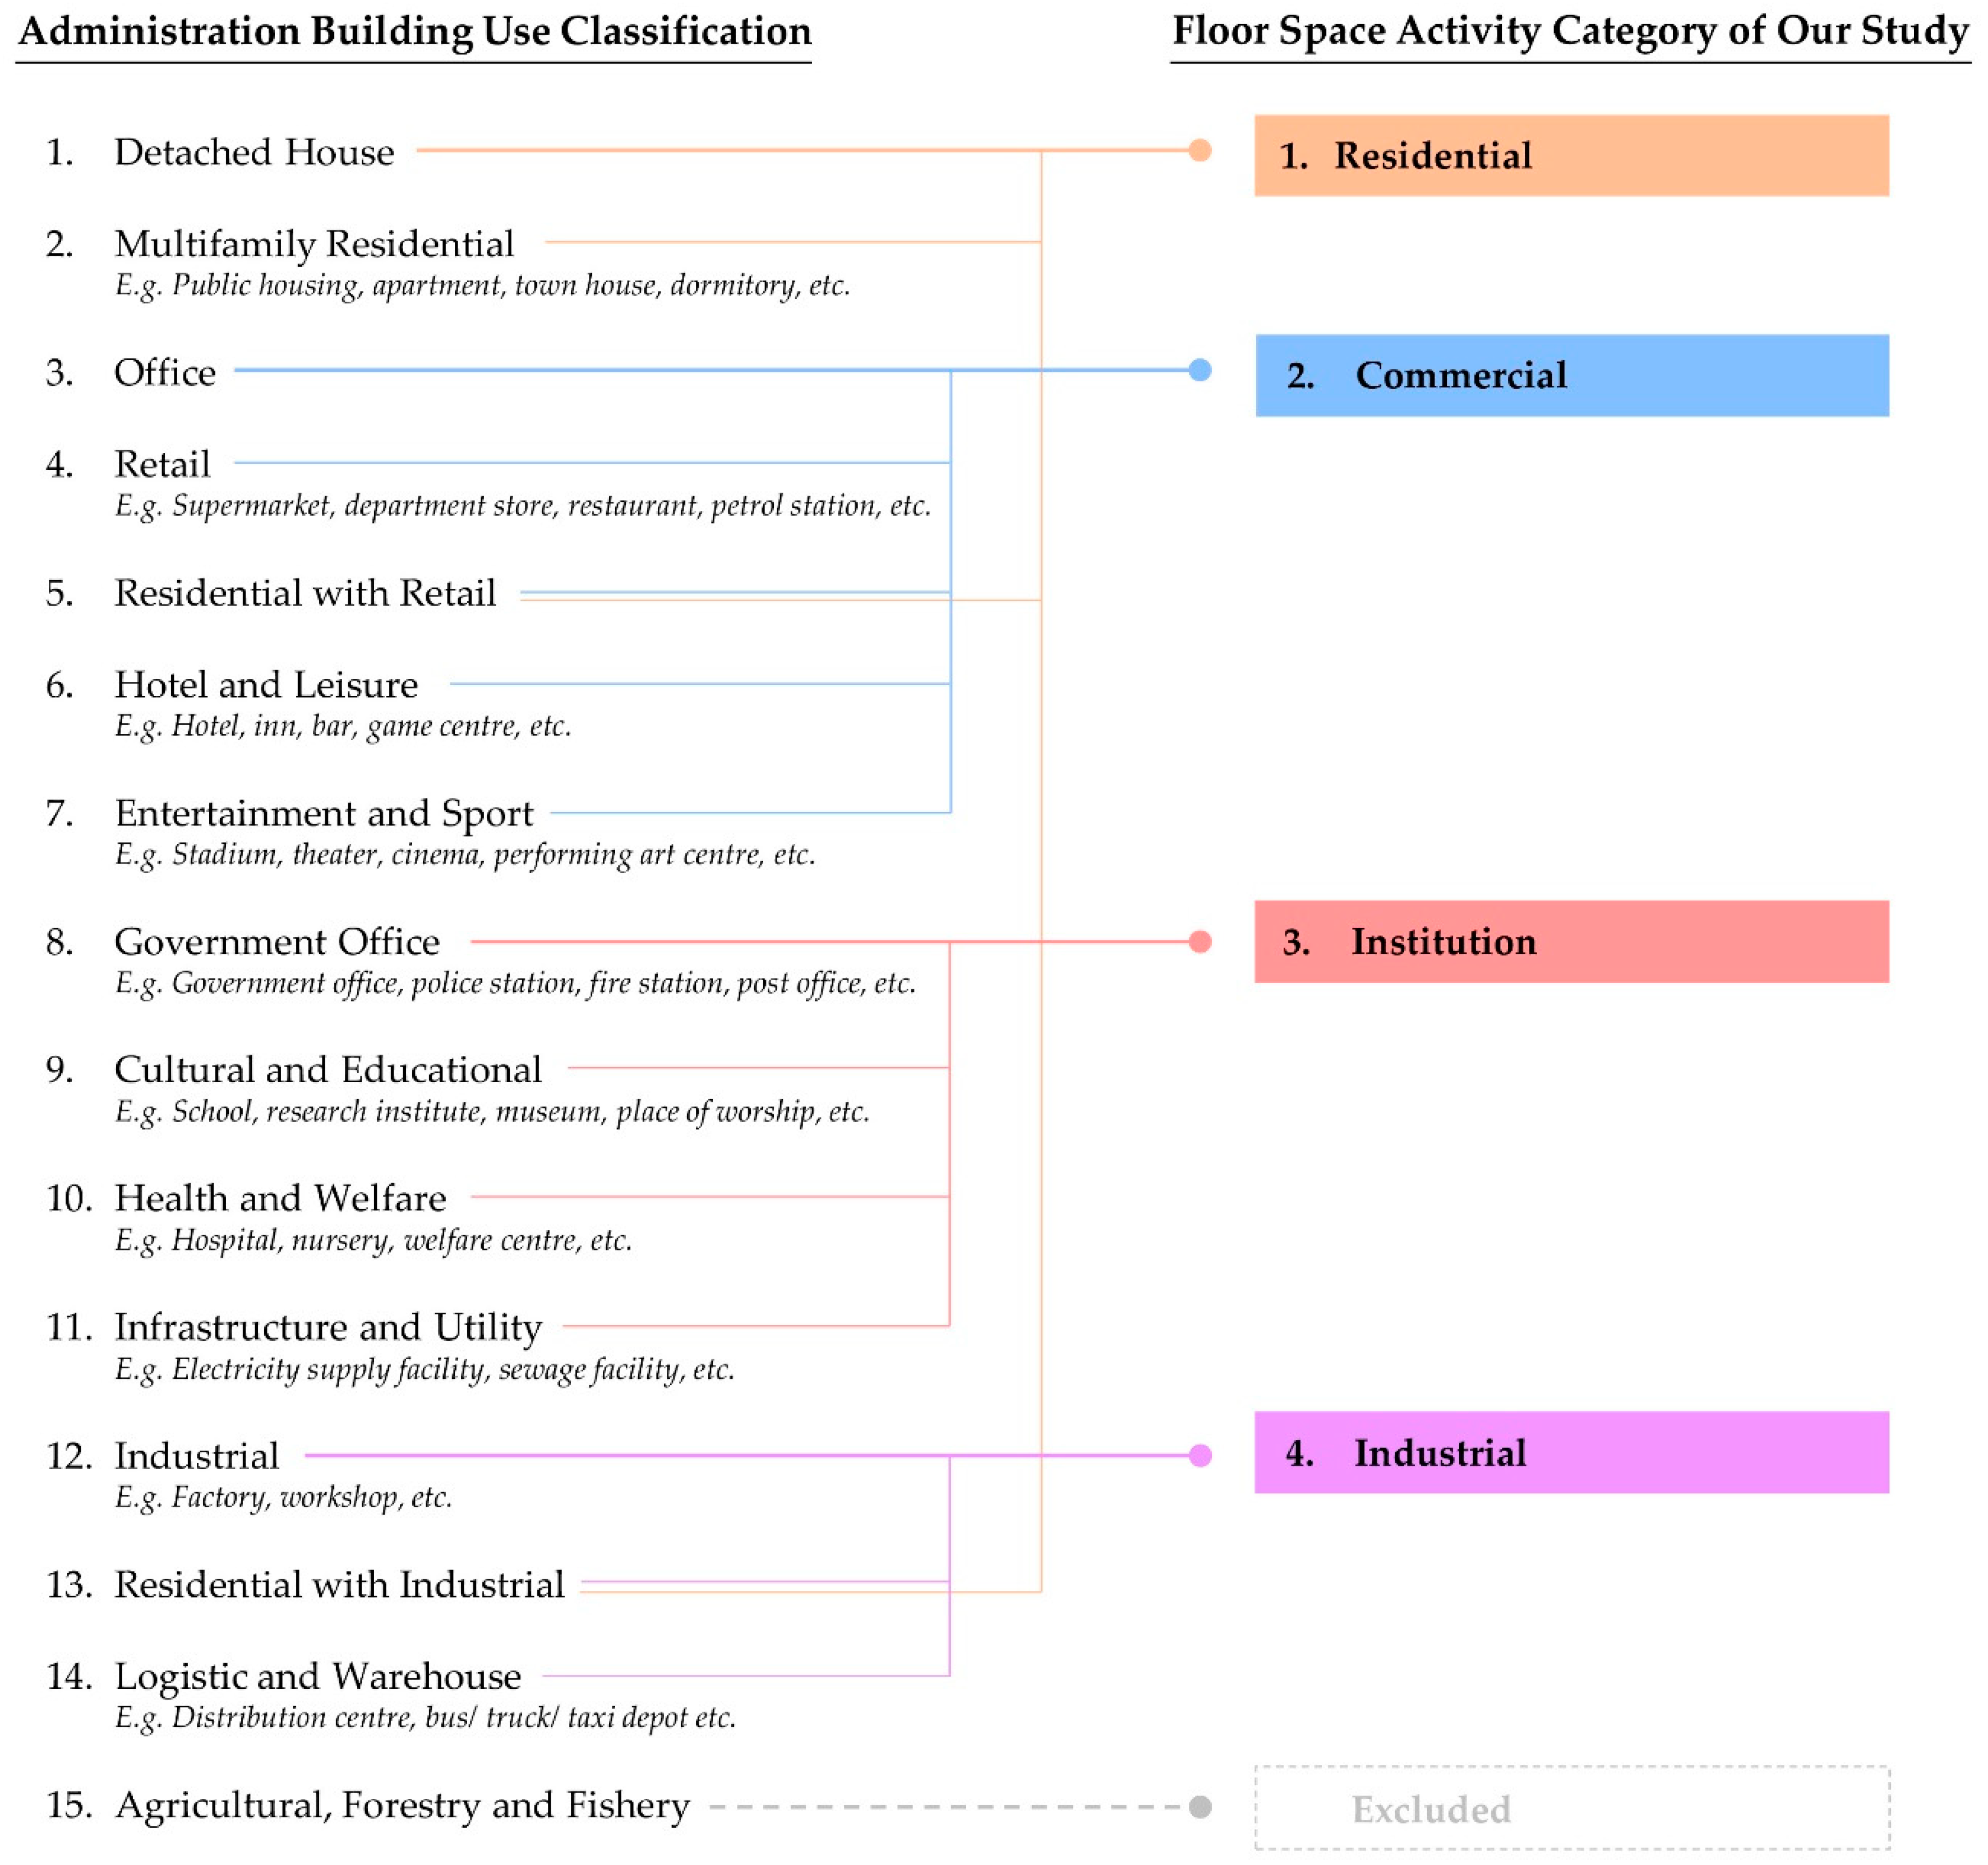
3. Methodology
3.1. Station Area Definition
3.2. Population and Employment Estimation Models
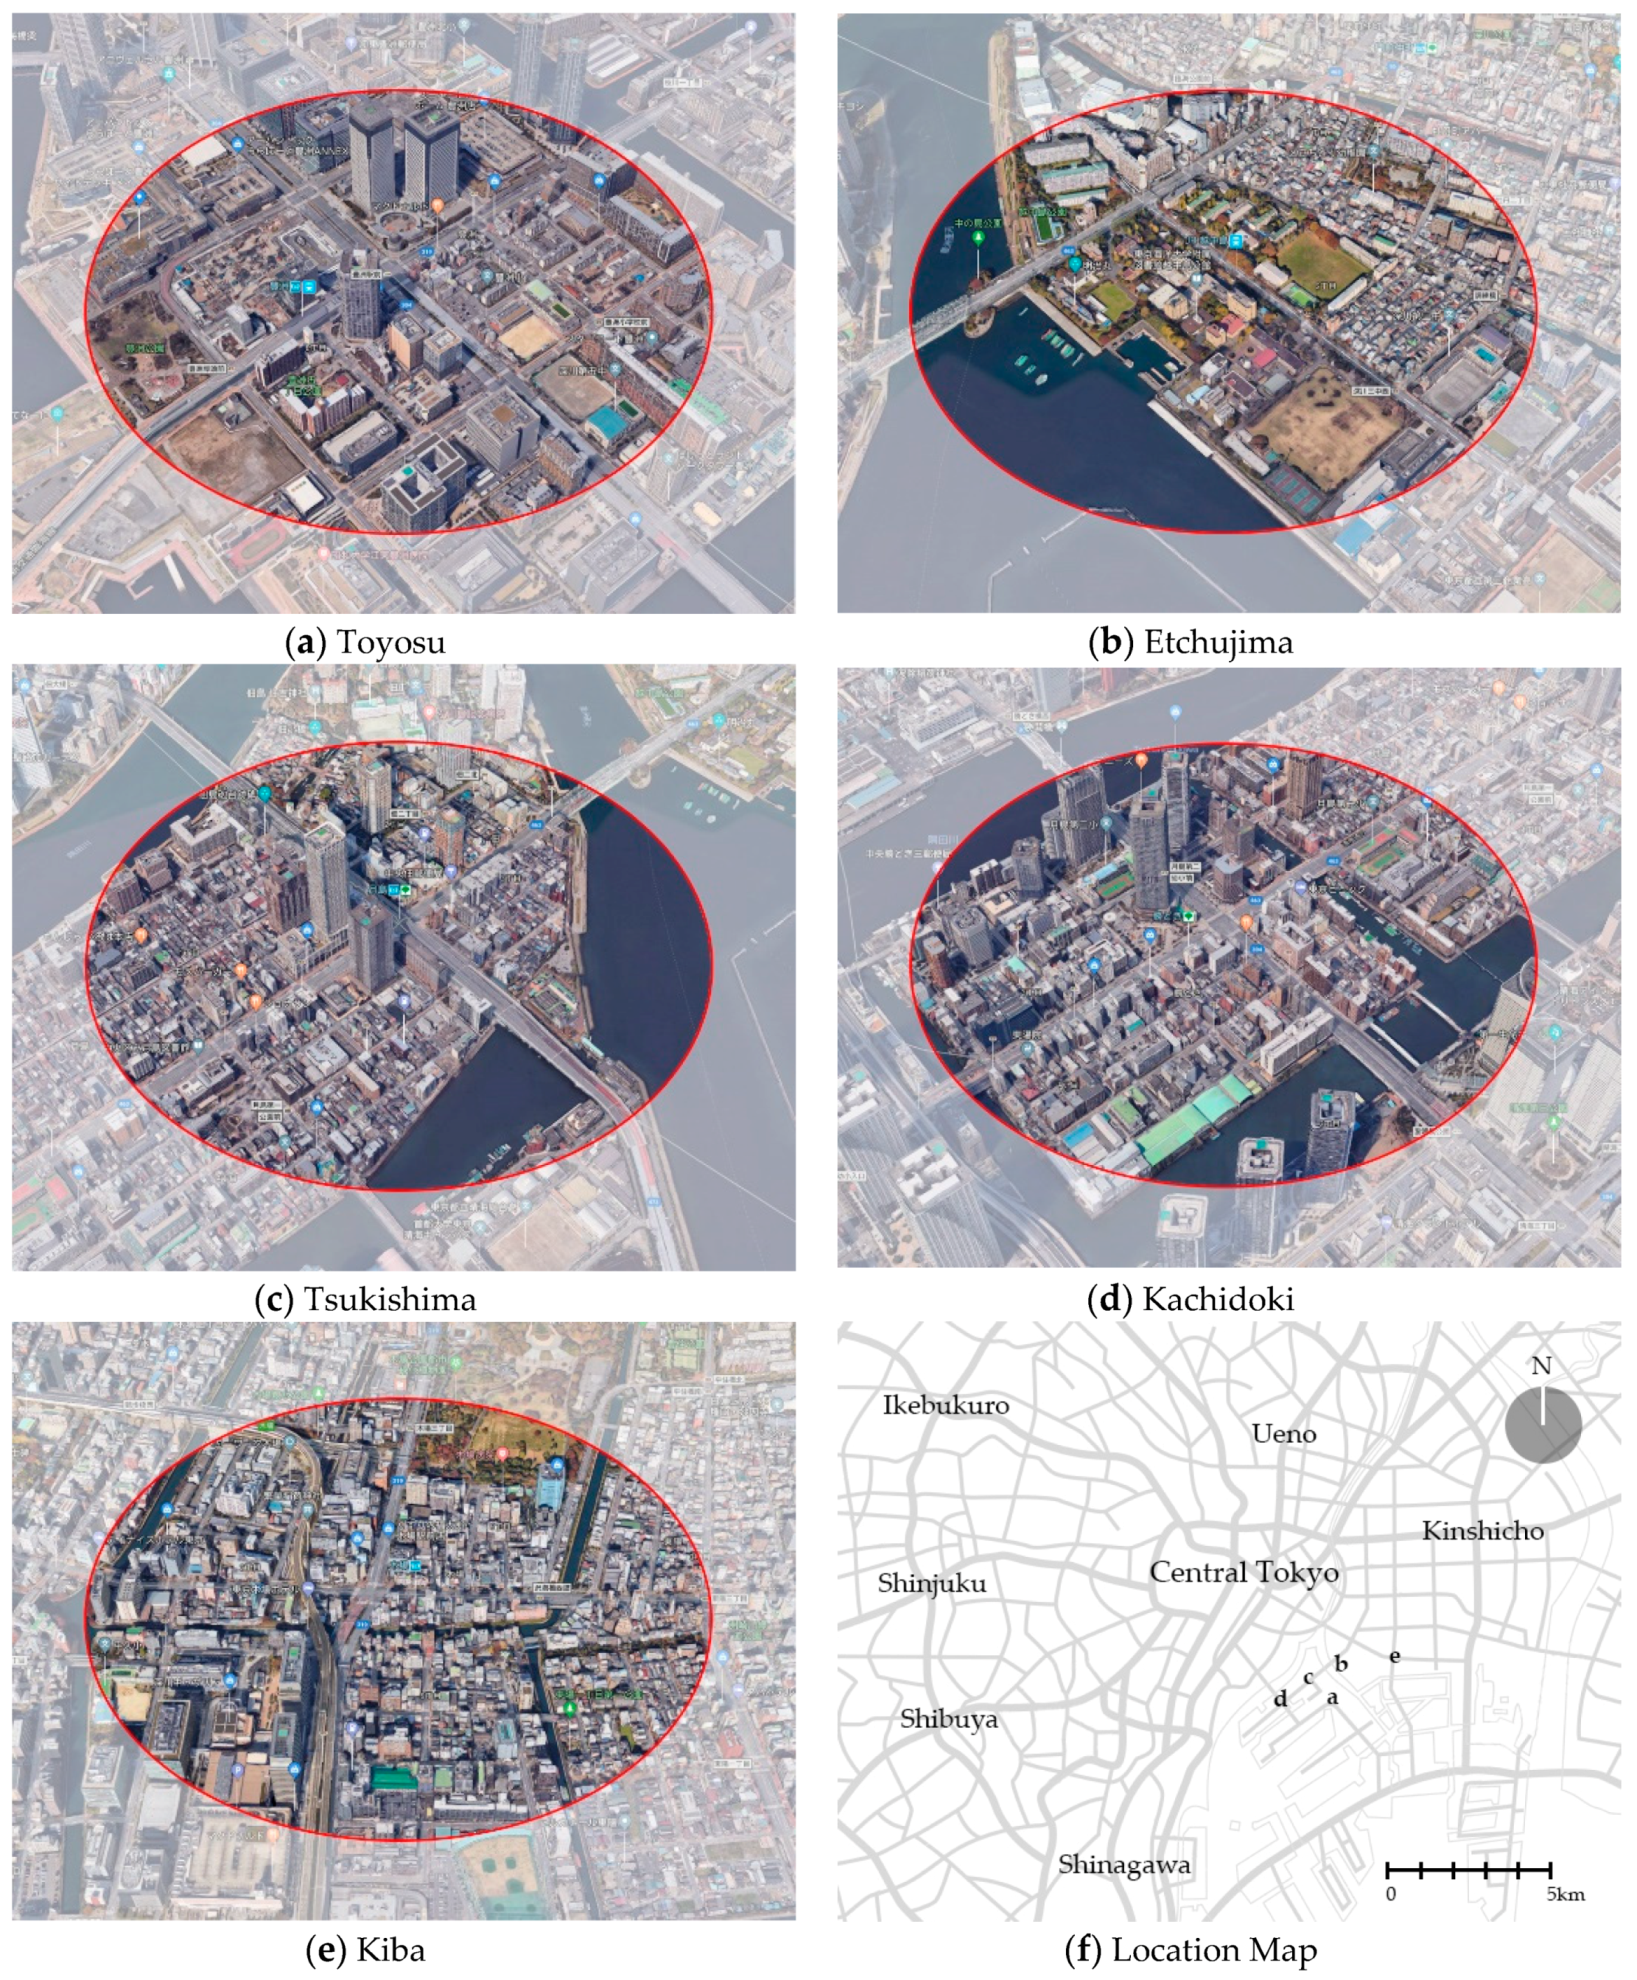
4. Study Area and Data
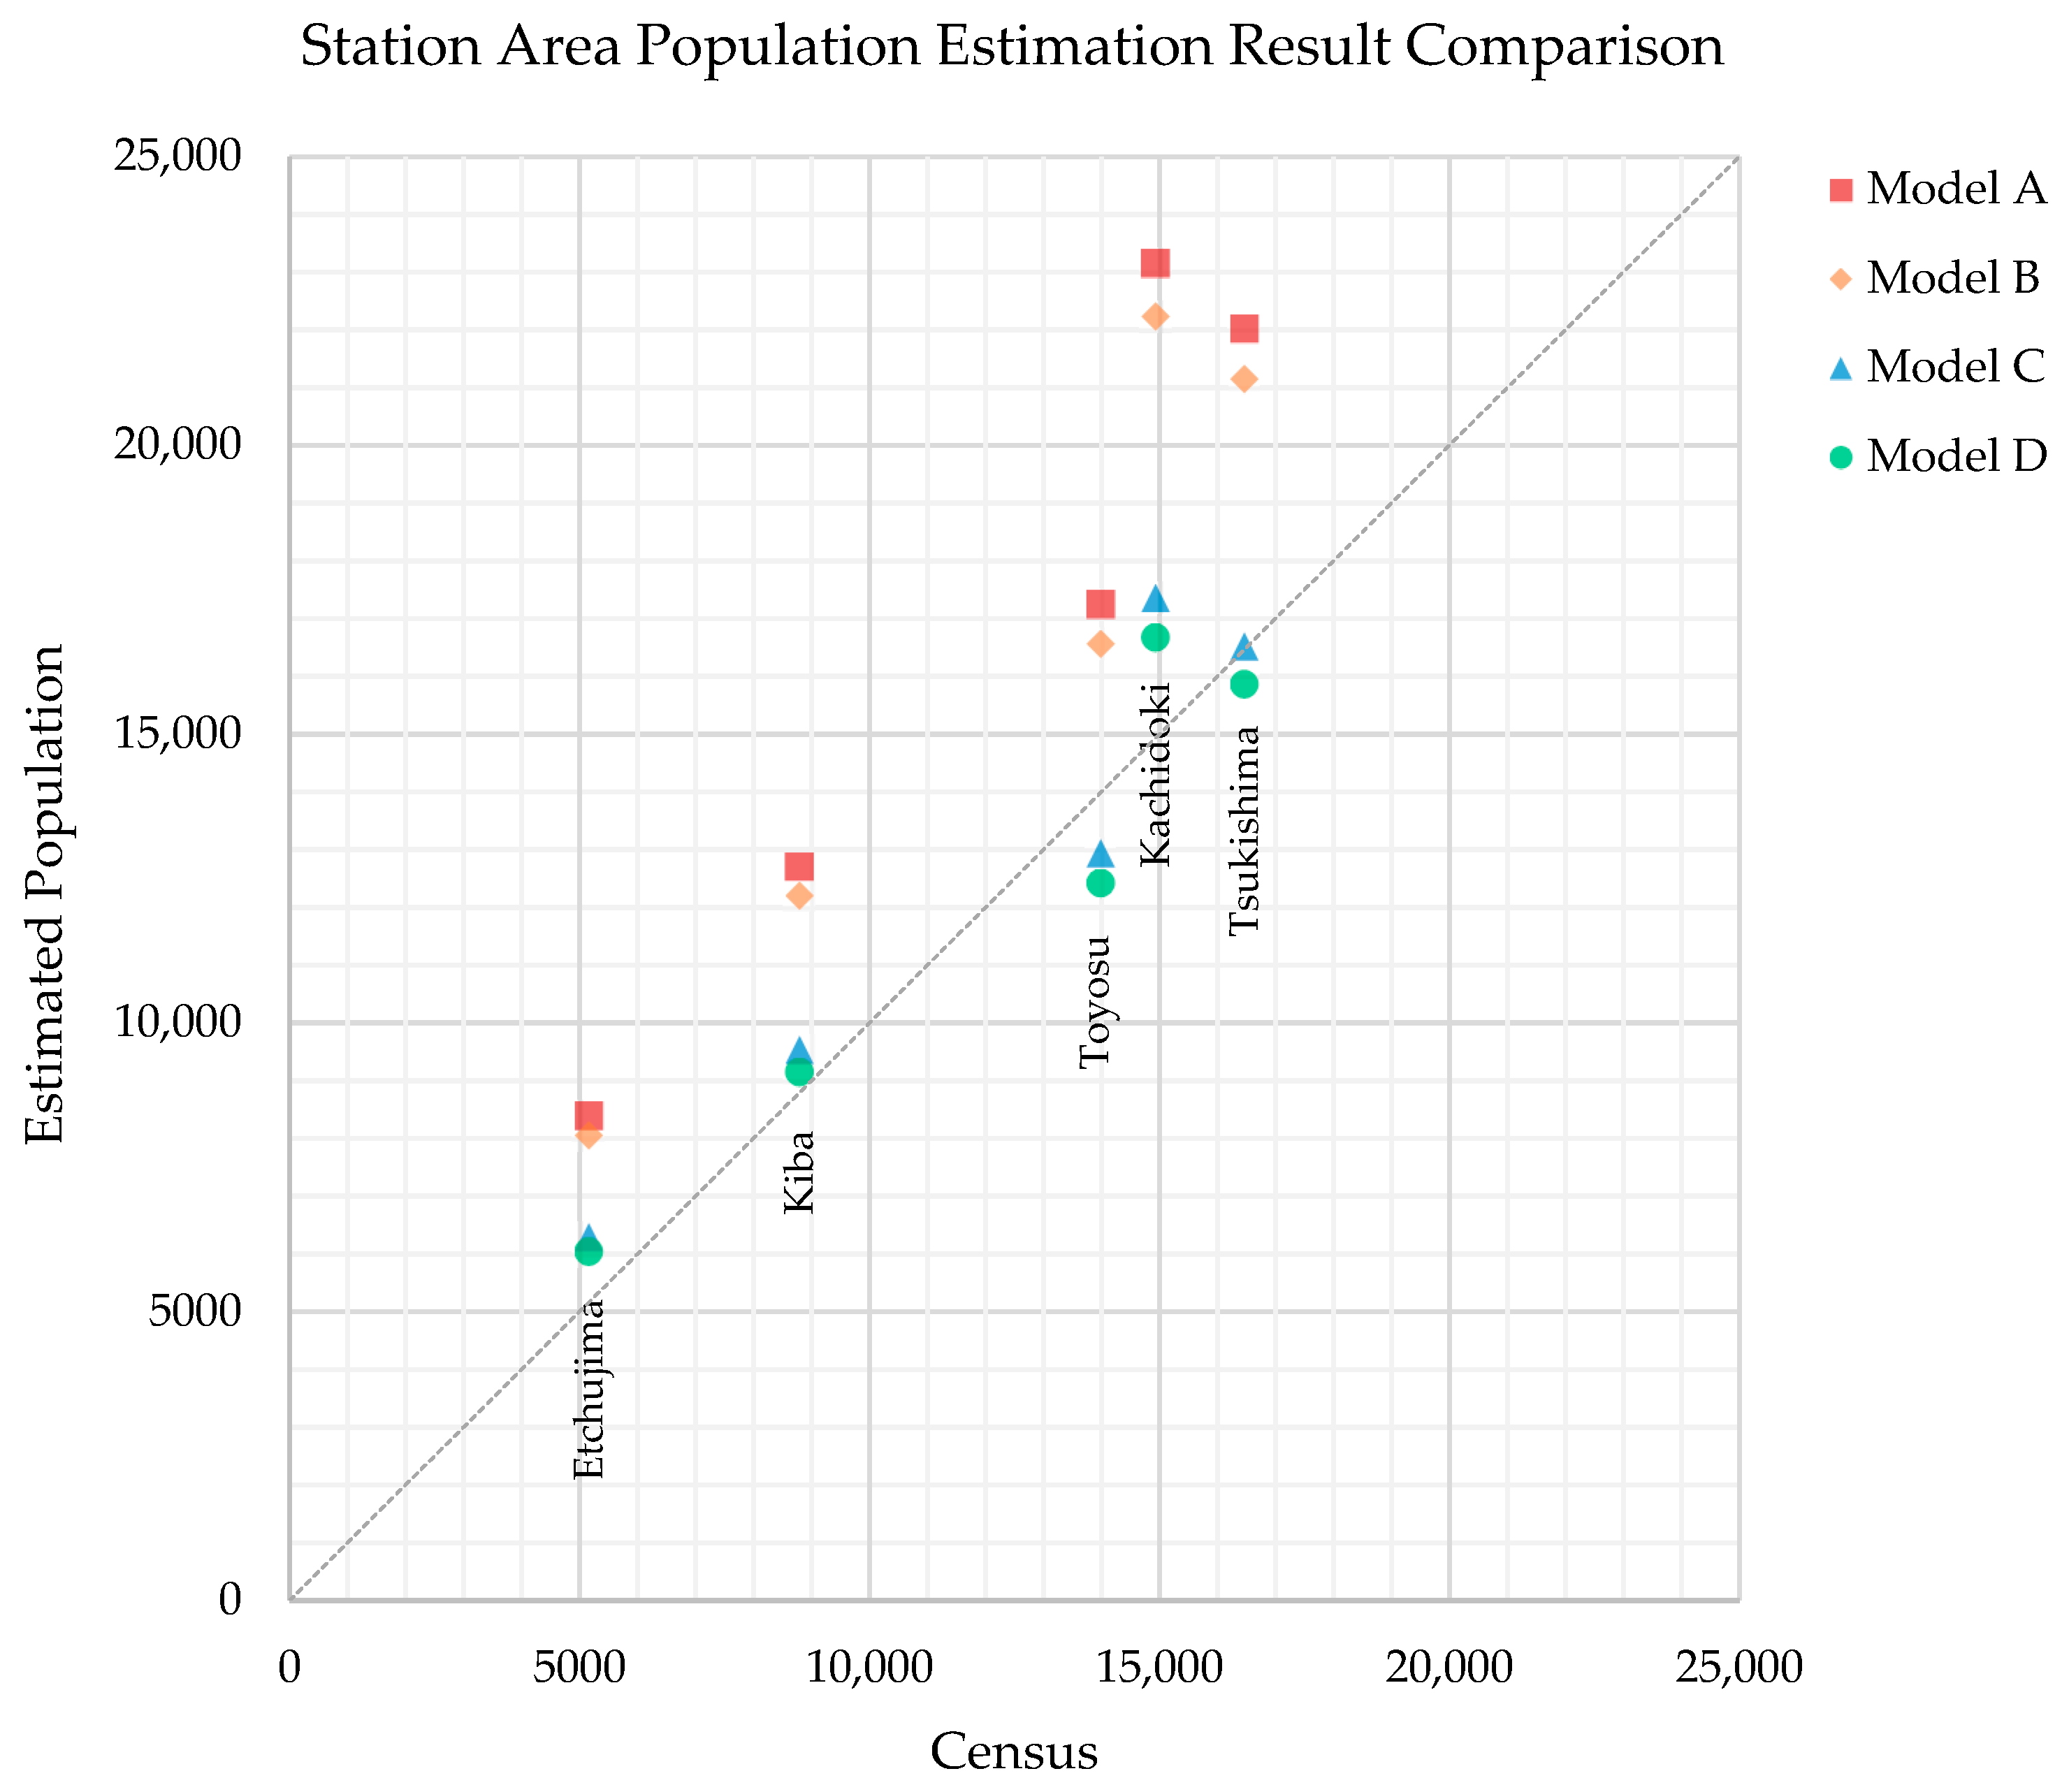
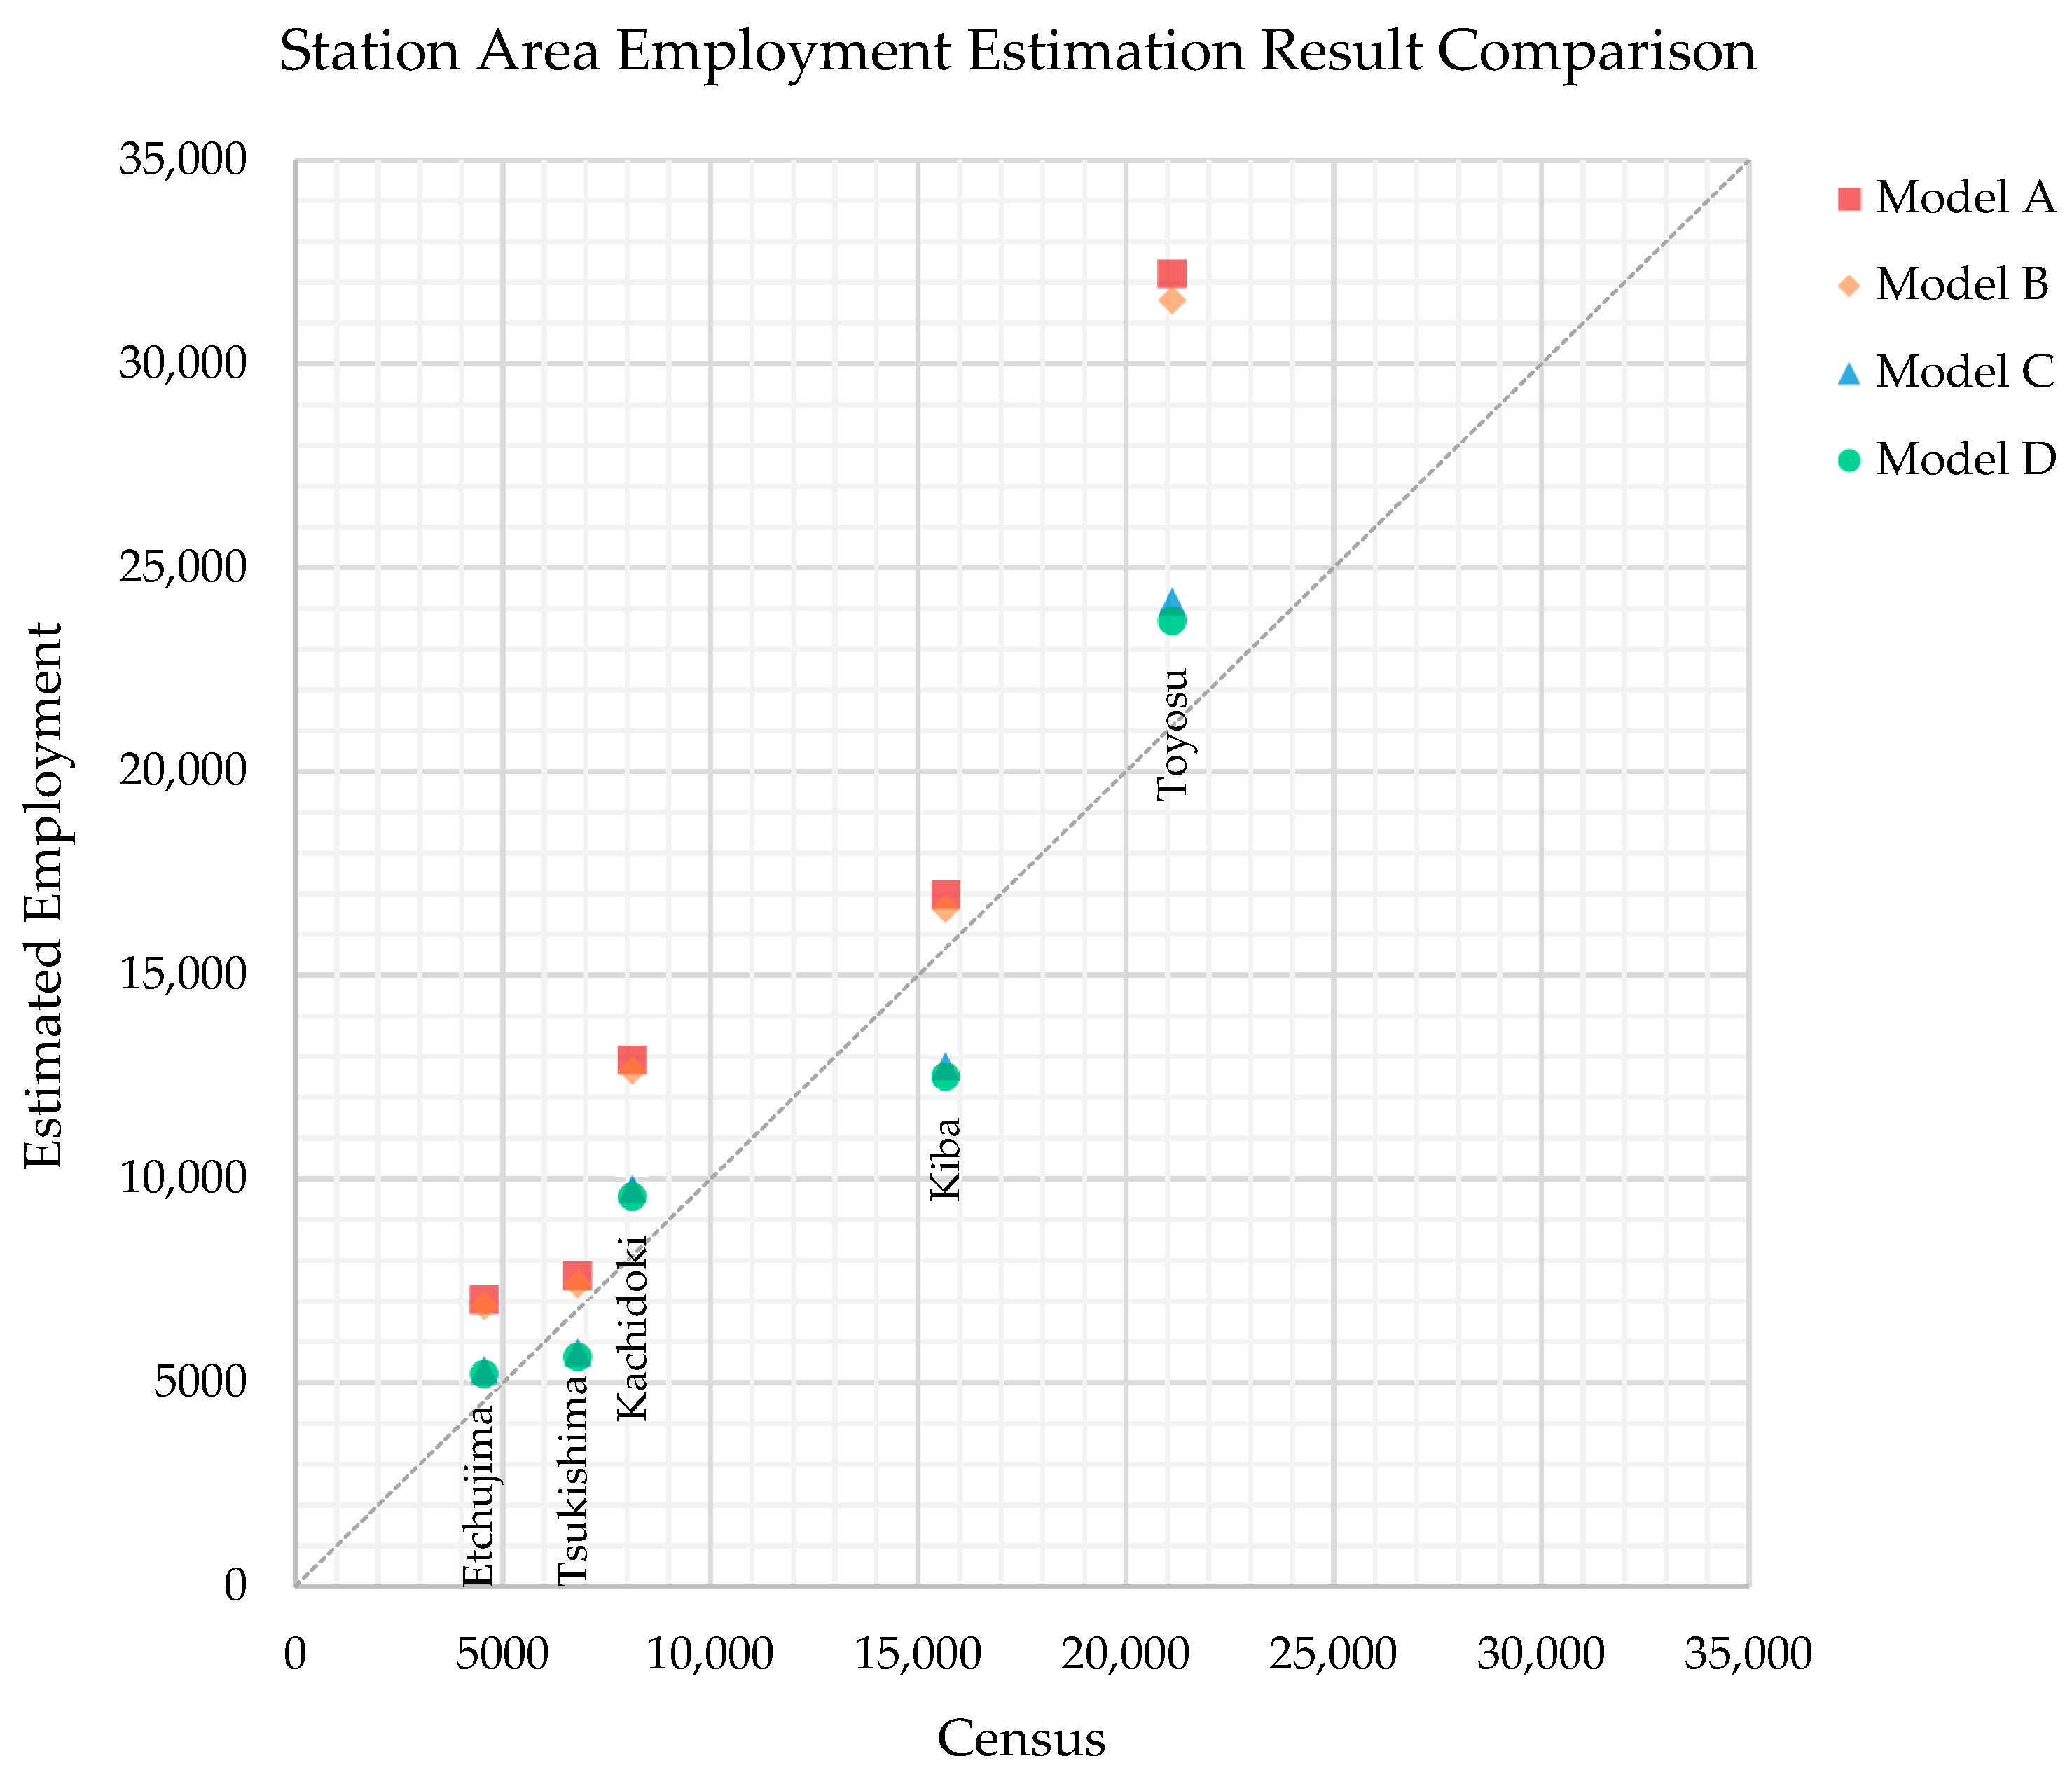
5. Results and Discussion
6. Conclusions
Author Contributions
Funding
Acknowledgments
Conflicts of Interest
Appendix A

Appendix B

References
- Santasieri, C. Planning for Transit Supportive Development: A Practitioner’s Guide; Federal Transit Administration: Washington, DC, USA, 2014.
- Duany Plater-Zyberk & Co. The Lexicon of New Urbanism. Available online: https://www.dpz.com/uploads/Books/Lexicon-2014.pdf (accessed on 4 December 2017).
- Calthorpe, P.; Yang, B.; Zhang, Q. Transit Oriented Development in China: A Manual of Land-use and Transportation for Low Carbon Cities; China Architecture & Building Press: Beijing, China, 2014. [Google Scholar]
- Reconnecting America and the Centre for Transit-Oriented Development. Why Transit-Oriented Development and Why Now? Available online: http://ctod.org/pdfs/tod101.pdf (accessed on 19 December 2017).
- Guerra, E.; Cervero, R. Cost of a Ride: The Effects of Densities on Fixed-Guideway Transit Ridership and Cost. J. Am. Plan. Assoc. 2011, 77, 267–290. [Google Scholar] [CrossRef]
- Rode, P.; Floater, G.; Kandt, J.; Baker, K.; Carrero, M.M.; Heeckt, C.; Smith, D.; Delfs, M. Going Green: How Cities Are Leading the Next Economy; LSE Cities, ICLEI and Global Green Growth Institute: London, UK, 2013. [Google Scholar]
- McMaster Institute for Transportation and Logistics. Benchmarking, Planning and Promoting Transit-Oriented Intensification in Rapid Transit Station Areas; McMaster University: Hamilton, ON, Canada, 2016. [Google Scholar]
- Papa, E.; Moccia, F.D.; Angiello, G.; Inglese, P. An Accessibility Planning Tool for Network Transit Oriented Development: SNAP. Planumthe J. Urban. 2013, 27, 1–9. [Google Scholar]
- Lin, T.; Xia, J.; Robinson, T.P.; Goulias, K.G.; Church, R.L.; Olaru, D.; Tapin, J.; Han, R. Spatial Analysis of Access to and Accessibility Surrounding Train Stations: A Case Study of Accessibility for the Elderly in Perth, Western Australia. J. Transp. Geogr. 2014, 39, 111–120. [Google Scholar] [CrossRef]
- Marks, M. People Near Transit: Improving Accessibility and Rapid Transit Coverage in Large Cities. Available online: https://www.itdp.org/pnt/ (accessed on 4 December 2017).
- Atkinson-Palombo, C.; Kuby, M.J. The Geography of Advance Transit-Oriented Development in Metropolitan Pheonix, Arizona, 2000–2007. J. Transp. Geogr. 2011, 19, 189–199. [Google Scholar] [CrossRef]
- Kamruzzaman, M.; Baker, D.; Washington, S.; Turrell, G. Advance Transit-Oriented Development Typology: Case Study in Brisbane, Australia. J. Transp. Geogr. 2014, 34, 54–70. [Google Scholar] [CrossRef]
- The Centre for Neighbourhood Technology. Transit-Oriented Development in the Chicago Region: Efficient and Resilient Communities for the 21st Century. Available online: https://www.cnt.org/sites/default/files/publications/CNT_TODInChicagoRegion.pdf (accessed on 19 December 2017).
- Azar, K.T.; Ferreira, J. Integrating Geographic Information Systems into Transit Ridership Forecast Models. J. Adv. Transp. 1995, 29, 263–279. [Google Scholar] [CrossRef]
- Kuby, M.; Barranda, A.; Upchurch, C. Factors Influencing Light-Rail Station Boardings in the United States. Transp. Res. Part A 2004, 38, 223–247. [Google Scholar] [CrossRef]
- Cervero, R.; Murakami, J.; Miller, M. Direct Ridership Model of Bus Rapid Transit in Los Angeles County, California. Transp. Res. Rec. J. Transp. Res. Board 2010, 2145, 1–7. [Google Scholar] [CrossRef]
- Durning, M.; Townsend, C. Direct Ridership Model of Rail Rapid Transit Systems in Canada. Transp. Res. Rec. J. Transp. Res. Board 2015, 2537, 96–102. [Google Scholar] [CrossRef]
- City of Waterloo; Urban Strategies Inc.; MMM Group Limited; Cushman & Wakefield Inc. City of Waterloo Station Area Planning: 5 Station Area Plans; City of Waterloo: Waterloo, ON, Canada, 2017. [Google Scholar]
- Treasure Coast Regional Planning Council. Florida TOD Guidebook. Available online: http://www.fltod.com/fl_tod_guidebook.htm (accessed on 9 January 2018).
- Metrolinx. Mobility Hub Guidelines for the Greater Toronto and Hamilton Area. Available online: http://www.metrolinx.com/mobilityhubs/en/ (accessed on 22 January 2018).
- City of Calgary. Brentwood Station Area Redevelopment plan. Available online: https://media4-production.mightybell.com/asset/729167/Brentwood_Station_ARP.pdf (accessed on 22 January 2018).
- Department of Statistics. Population and Housing Census of Malaysia 2010: Population Distribution by Local Authority Areas and Mukims; Department of Statistics: Putrajaya, Malaysia, 2011.
- Calabrese, F.; Ferrari, L.; Blondel, V.D. Urban Sensing Using Mobile Phone Network Data: A Survey of Research. Acm Comput. Surv. 2014, 47, 25. [Google Scholar] [CrossRef]
- Ratti, C.; Frenchman, D.; Pulselli, R.M.; Williams, S. Mobile Landscapes: Using Location Data from Cell Phones for Urban Analysis. Environ. Plan. B Plan. Des. 2006, 33, 727–748. [Google Scholar] [CrossRef]
- Deville, P.; Linard, C.; Martin, S.; Gilbert, M.; Stevens, F.R.; Gaughan, A.E.; Blondel, V.D.; Tatem, A.J. Dynamic Population Mapping Using Mobile Phone Data. Proc. Natl. Acad. Sci. USA 2014, 111, 15888–15893. [Google Scholar] [CrossRef] [PubMed]
- Dong, L.; Chen, S.; Cheng, Y.; Wu, Z.; Li, C.; Wu, H. Measuring Economic Activity in China with Mobile Big Data. Epj Data Sci. 2017, 6, 29. [Google Scholar] [CrossRef]
- Chen, B.; Song, Y.; Jiang, T.; Chen, Z.; Huang, B.; Xu, B. Real-Time Estimation of Population Exposure to PM2.5 Using Mobile- and Station- Based Big Data. Int. J. Environ. Res. Public Health 2018, 15, 573. [Google Scholar] [CrossRef] [PubMed]
- Naoki, M.; Masakazu, K.; Masayuki, T.; Motonari, K.; Yuki, O. Can Mobile Phone Network Data Be Used to Estimate Small Area Population? A Comparison from Japan. Stat. J. Iaos 2013, 29, 223–232. [Google Scholar] [CrossRef]
- Douglass, R.W.; Meyer, D.A.; Ram, M.; Rideout, D.; Song, D. High Resolution Population Estimates from Telecommunications Data. Epj Data Sci. 2015, 4, 4. [Google Scholar] [CrossRef]
- Ricciato, F.; Widhalm, P.; Craglia, M.; Pantisano, F. Estimating Population Density Distribution from Network-Based Mobile Phone Data; Publications Office of European Union: Luxembourg, 2015. [Google Scholar]
- Feng, J.; Li, Y.; Xu, F.; Jin, D. A Bimodel Model to Estimate Dynamic Metropolitan Population by Mobile Phone Data. Sensors 2018, 18, 3431. [Google Scholar] [CrossRef] [PubMed]
- Widhalm, P.; Yang, Y.; Ulm, M.; Athavale, S.; Gonzalez, M.C. Discovering Urban Activity Patterns in Cell Phone Data. Transportation 2015, 42, 597–623. [Google Scholar] [CrossRef]
- Jahani, E.; Sundsoy, P.; Bjelland, J.; Bengtsson, J.; Pentland, A.S.; de Montjoye, Y.A. Improving Official Statistics in Emerging Markets Using Machine Learning and Mobile Phone Data. Epj Data Sci. 2017, 6, 3. [Google Scholar] [CrossRef]
- Struijs, P.; Braaksma, B.; Daas, P.J. Official Statistics and Big Data. Big Data Soc. 2014. [Google Scholar] [CrossRef]
- Office for National Statistics, United Kingdom. Big Data at Office for National Statistics: How Alternative Sources of Data and Data Science Method Will Affect Our Processes and Outputs. Available online: https://www.ons.gov.uk/aboutus/whatwedo/programmesandprojects/theonsbigdataproject (accessed on 30 December 2018).
- Heggeness, M.L.; Murray-Close, M.; Stevens, K. Advancing Big Data and Social Science at the U.S. Census Bureau. Available online: https://www.census.gov/newsroom/blogs/research-matters/2017/11/advancing_big_dataa.html (accessed on 31 December 2018).
- Tam, S.-M.; Clarke, F. Big Data, Official Statistics and Some Initiatives by the Australian Bureau of Statistics. Int. Stat. Rev. 2015, 83, 436–448. [Google Scholar] [CrossRef]
- Liang, D.; Cheng, J. Big Data and Official Statistics in China. Available online: https://www.unescap.org/sites/default/files/1-Big%20Data%20and%20Official%20Statistics%20in%20China.pdf (accessed on 30 December 2018).
- Reimsbach-Kounatze, C. The Proliferation of “Big Data” and Implications for Official Statistics and Statistical Agencies: A Preliminary Analysis; OECD Publishing: Paris, France, 2015. [Google Scholar]
- Hammer, C.L.; Kostroch, D.C.; Quiros, G.; STA Internal Group. Big Data: Potential, Challenges, and Statistical Implications; International Monetary Fund: Washington, WA, USA, 2017. [Google Scholar]
- Radermacher, W.J. Official Statistics in the Era of Big Data Opportunities and Threats. Int. J. Data Sci. Anal. 2018, 6, 225–231. [Google Scholar] [CrossRef]
- Sivarajah, U.; Kamal, M.M.; Irani, Z.; Weerakkody, V. Critical Analysis of Big Data Challenges and Analytical Methods. J. Bus. Res. 2017, 70, 263–286. [Google Scholar] [CrossRef]
- Cox, D.R.; Kartsonaki, C.; Keogh, R.H. Big Data: Some Statistical Issues. Stat. Probab. Lett. 2018, 136, 111–115. [Google Scholar] [CrossRef] [PubMed]
- Luna, D.R.; Mayan, J.C.; Garcia, M.J.; Almerares, A.A.; Househ, M. Challenges and Potential Solutions for Big Data Implementations in Developing Countries. Yearb. Med Inform. 2014, 9, 36–64. [Google Scholar] [CrossRef] [PubMed]
- Hilbert, M. Big Data for Development: A Review for Promises and Challenges. Dev. Policy Rev. 2016, 34, 135–174. [Google Scholar] [CrossRef]
- Abdullahi, A.; Evans, A.; Ash, T. An Assessment of Big Data for Official Statistics in Caribbean: Challenges and Opportunities; United Nations Publication: Santiago, Chile, 2016. [Google Scholar]
- Lwin, K.; Murayama, Y. A GIS Approach to Estimation of Building Population for Micro-Spatial Analysis. Trans. Gis 2009, 13, 401–414. [Google Scholar] [CrossRef]
- Biljecki, F.; Ohori, K.A.; Ledoux, H.; Peters, R.; Stoter, J. Population Estimation Using a 3D City Model: A Multi-Scale Country-Wide Study in the Netherlands. PLoS ONE 2016, 11, e0156808. [Google Scholar] [CrossRef]
- Alahmadi, M.; Atkinson, P.; Martin, D. Estimating the Spatial Distribution of the Population of Riyadh, Saudi Arabia Using Remotely Sensed Built Land Cover and Height Data. Comput. Environ. Urban Syst. 2013, 41, 167–176. [Google Scholar] [CrossRef]
- Alahmadi, M.; Atkinson, P.; Martin, D. A Comparison of Small-Area Population Estimation Techniques Using Built-Area and Height Data, Riyadh, Saudi Arabia. IEEE J. Sel. Top. Appl. Earth Obs. Remote Sens. 2016, 9, 1959–1968. [Google Scholar] [CrossRef]
- Conner Holmes. Wilton Junction Master Plan. Available online: http://www.planning.nsw.gov.au/Plans-for-your-area/Priority-Growth-Areas-and-Precincts/Wilton (accessed on 12 February 2018).
- Japan International Cooperation Agency. The Study for the Development for the Kabul Metropolitan Area in the Islamic Republic of Afghanistan. Available online: http://open_jicareport.jica.go.jp/618/618/618_301_11965134.html (accessed on 13 February 2018).
- Priemus, H.; Flyvbjerg, B.; van Wee, B. Decision-Making on Mega Projects: Cost Benefic Analysis, Planning and Innovation; Edward Elgar Publishing Limited: Cheltenham, UK, 2008. [Google Scholar]
- Wang, L.; Wu, C. Population Estimation Using Remote Sensing and GIS Technologies. Int. J. Remote Sens. 2010, 31, 5569–5570. [Google Scholar] [CrossRef]
- Green, N.E. Aerial Photographic Analysis of Residential Neighbourhoods: An Evaluation of Data Accuracy. Soc. Forces 1956, 35, 142–147. [Google Scholar] [CrossRef]
- Hadfield, S.A. Evaluation of Land Use and Dwelling Unit Data Derived from Aerial Photography; Chicago Area Transportation Study, Urban Research Section: Chicago, IL, USA, 1963. [Google Scholar]
- Binsell, R. Dwelling Unit Estimation from Aerial Photography; Department of Geography, Northwestern University: Evanston, IL, USA, 1967. [Google Scholar]
- Ural, S.; Hussain, E.; Shan, J. Building Population Mapping with Aerial Imagery and GIS Data. Int. J. Appl. Earth Obs. Geoinf. 2011, 13, 841–852. [Google Scholar] [CrossRef]
- Hillson, R.; Alejandre, J.D.; Jacobsen, K.H.; Ansumana, R.; Bokarie, A.S.; Bangura, U.; Lamin, J.M.; Malanoski, A.P.; Stenger, D.A. Method for Determining the Uncertainty of Population Estimates Derived from Satellite Imagery and Limited Survey Data: A Case Study of Bo City, Sierra Leone. PLoS ONE 2014, 9, e112241. [Google Scholar] [CrossRef] [PubMed]
- Wu, S.; Wang, L.; Qiu, X. Incorporating GIS Building Data and Census Housing Statistics for Sub-Block Level Population Estimation. Prof. Geogr. 2008, 60, 121–135. [Google Scholar] [CrossRef]
- Qiu, F.; Sridharan, H.; Chun, Y. Spatial Autoregressive Model for Population Estimation at the Census Block Level Using LIDAR-derived Building Volume Information. Cartogr. Geogr. Inf. Sci. 2010, 37, 239–257. [Google Scholar] [CrossRef]
- Lu, Z.; Im, J.; Quackenbush, L. A Volumetric Approach to Population Estimation Using Lidar Remote Sensing. Photogramm. Eng. Remote Sens. 2011, 77, 1145–4456. [Google Scholar] [CrossRef]
- Xie, Y.; Weng, A.; Weng, Q. Population Estimation of Urban Residential Communities Using Remotely Sensed Morphological Data. IEEE Geosci. Remote Sens. Lett. 2015, 12, 1111–1115. [Google Scholar] [CrossRef]
- Wang, S.; Tian, Y.; Zhou, Y.; Liu, W.; Lin, C. Fine-Scale Population Estimation by 3D Reconstruction of Urban Residential Buildings. Sensors 2016, 16, 1755. [Google Scholar] [CrossRef]
- Daniels, R.; Mulley, C. Explaining Walking Distance to Public Transport: The Dominance of Public Transport Supply. J. Transp. Land Use 2013, 6, 5–20. [Google Scholar] [CrossRef]
- Diyanah, I.Z.; Hafazah, A.K.; Mohd Zamreen, M.A. Comparing Walking Behaviour Between Urban and Rural Residents. Procedia Soc. Behav. Sci. 2012, 68, 406–416. [Google Scholar] [CrossRef]
- Guerra, E.; Cervero, R.; Tischler, D. The Half-Mile Circle: Does It Best Represent Transit Station Catchments? Transp. Res. Rec. J. Transp. Res. Board 2012, 2276, 101–109. [Google Scholar] [CrossRef]
- Eppinger, S.D.; Browning, T.R. Design Structure Matrix Methods and Applications; The MIT Press: Cambridge, MA, USA, 2012. [Google Scholar]
- Kent, R. Quality Management in Plastics Processing; Elservier: Amsterdam, The Netherlands, 2016. [Google Scholar]
- Gunasekaran, A. Agile Manufacturing: The 21st Century Competitive Strategy; Elservier Science Ltd.: Oxford, UK, 2001. [Google Scholar]
- Asaka, T.; Ozeki, K. Handbook of Quality Tools: The Japanese Approach; Productivity Press: Cambridge, MA, USA, 1990. [Google Scholar]
- Watson & Associates Economist Ltd. Development Charge Background Study. Available online: http://www.waterloo.ca/en/living/developmentcharges.asp (accessed on 19 February 2018).
- County of Riverside. Riverside County General Plan. Available online: https://www.riversideca.gov/planning/gp2025program/general-plan.asp (accessed on 16 February 2018).
- SGS Economics and Planning. Parramatta CBD Planning Framework: Economic Analysis. Available online: https://www.sgsep.com.au/projects/parramatta-cbd-planning-framework-review (accessed on 16 February 2018).
- District of Mission. Employment Lands Strategy. Available online: http://www.mission.ca/wp-content/uploads/FINAL-DRAFT-DOCUMENT-ELS-File-from-April-7-20102.pdf (accessed on 19 February 2018).
- Strategic Regional Research Alliance. Commercial and Multi-Residential Forecasts for the Review of SmartTrack. Available online: http://smarttrack.to/wp-content/uploads/2016/06/Commercial-Multi-Residential-Forecast-for-the-review-of-SmartTrack-Report-.pdf (accessed on 28 February 2018).
- City of Woodland. Woodland General Plan Final Environmental Impact Report; City of Woodland: Woodland, CA, USA, 1996. [Google Scholar]
- Sev, A.; Ozgen, A. Space Efficiency in High-Rise Office Buildings. Metu J. Fac. Archit. 2009, 26, 69–89. [Google Scholar] [CrossRef]
- Barton, J.; Watts, S. Office vs. Residential: The Economics of Building Tall. Counc. Tall Build. Urban Habitat J. 2013, 38–43. Available online: http://global.ctbuh.org/resources/papers/download/255-office-vs-residentialthe-economics-of-building-tall.pdf (accessed on 7 May 2018).
- Statistics of Bureau of Japan. Heisei 27-nen kokuseichōsa: Danjo betsu jinkō sōsū oyobi setai [Year 2015 Census: Total Population by Gender and Household]. Available online: http://e-stat.go.jp/SG2/eStatFlex/ (accessed on 14 June 2018).
- Statistics of Bureau of Japan. Heisei 26-nen keizai sentā-kiso chōsa: Keiei soshiki betsu min’ei jigyōshosū oyobi jūgyōshasū [Year 2014 Basic Economic Census Survey: Number of Enterprises and Employee by Organisations]. Available online: http://e-stat.go.jp/SG2/eStatFlex/ (accessed on 14 June 2018).
- Greger, K. Spatio-Temporal Building Population Estimation for Highly Urbanised Area Using GIS. Trans. Gis 2015, 19, 129–150. [Google Scholar] [CrossRef]
- Google Maps. Toyosu Station, Tokyo, Japan. Available online: https://goo.gl/maps/7M3vXb4ptXk (accessed on 20 June 2018).
- Google Maps. Etchujima Station, Tokyo, Japan. Available online: https://goo.gl/maps/nW8wJq5ULiL2 (accessed on 20 June 2018).
- Google Maps. Tsukishima Station, Tokyo, Japan. Available online: https://goo.gl/maps/fd8VRFk776n (accessed on 20 June 2018).
- Google Maps. Kachidoki Station, Tokyo, Japan. Available online: https://goo.gl/maps/MDgNxCYLdmN2 (accessed on 20 June 2018).
- Google Maps. Kiba Station, Tokyo, Japan. Available online: https://goo.gl/maps/xuhHaHyjNF82 (accessed on 20 June 2018).
- Johnson, R.E. The Economics of Building: A Practical Guide for the Design Professional; John Wiley & Sons, Inc.: New York, NY, USA, 1990. [Google Scholar]
- Homes and Communities Agency. Employment Density Guide, 3rd ed.; Homes and Communities Agency: London, UK, 2015.
- Miller, N.G. Workplace Trends in Office Space: Implications for Future Office Demand. J. Corp. Real Estate 2014, 16, 159–181. [Google Scholar] [CrossRef]
- Statistics Bureau of Japan. 2015 Japan Statistical Yearbook. Available online: http://www.stat.go.jp/english/data/nenkan/back64/index.htm (accessed on 3 July 2018).
- Tokyo Metropolitan Government. Tokyo’s History, Geography and Population. Available online: http://www.metro.tokyo.jp/ENGLISH/ABOUT/HISTORY/index.htm (accessed on 3 July 2018).
- Association for Real Estate Securitization. Japan Property Index Databook. Available online: https://index.ares.or.jp/en/ajpi/download.php (accessed on 5 July 2018).
- Savills. Savills World Research: Japan. Available online: http://www.savills.co.jp/research/ (accessed on 5 July 2018).
- Ministry of Land, Infrastructure, Transport and Tourism. Jū seikatsu kihon keikaku (zenkoku keikaku) [Residential Living Area Standard (National Plan)]. Available online: http://www.mlit.go.jp/jutakukentiku/house/index.html (accessed on 3 July 2018).
- Nelson, A.C.; Nicholas, J.C. Estimating Functional Population for Facility Planning. J. Urban Plan. Dev. 1992, 118, 45–58. [Google Scholar] [CrossRef]
- Nadim, F.; Kjekstad, O.; Peduzzi, P.; Herold, C.; Jaedicke, C. Global landslide and avalanche hotspots. Landslides 2006, 3, 159–173. [Google Scholar] [CrossRef]
- Linard, C.; Alegana, V.A.; Noor, A.M.; Snow, R.W.; Tatem, A.J. A High Resolution Spatial Population Database of Somalia for Disease Risk Mapping. Int. J. Health Geogr. 2010, 9, 45. [Google Scholar] [CrossRef] [PubMed]
- Martin, D.; Williams, H.C.W.L. Market-Area Analysis and Accessibility to Primary Health-Care Centres. Environ. Plan. A Econ. Space 1992, 24, 1009–1019. [Google Scholar] [CrossRef]
- Yeh, A.G.O. The Development and Applications of Geographic Information Systems for Urban and Regional Planning in the Developing Countries. Int. J. Geogr. Inf. Syst. 1991, 5, 5–27. [Google Scholar] [CrossRef]
- Yeh, A.G.O. Urban Planning and GIS. In Geographic Information Systems: Principles, Techniques, Management and Application, 2nd ed.; Longley, P.A., Goodchild, M.F., Maguire, D.J., Rhind, D.W., Eds.; John Wiley & Sons, Inc.: Hoboken, NJ, USA, 2005; pp. 877–888. [Google Scholar]
- Wu, J.; Ping, L.; Ge, X.; Wang, Y.; Fu, J. Cloud Storage as the Infrastructure of Cloud Computing. In Proceedings of the 2010 International Conference on Intelligent Computing and Cognitive Informatics, Kuala Lumpur, Malaysia, 22–23 June 2010; Gong, M., Ed.; IEEE Computer Society: Los Alamitos, CA, USA, 2010; pp. 380–383. [Google Scholar] [CrossRef]
- Avram, M.G. Advantages and Challenges of Adopting Cloud Computing from an Enterprise Perspective. Procedia Technol. 2014, 12, 529–534. [Google Scholar] [CrossRef]
- Steiniger, S.; Hunter, A.J.S. Free and Open Source GIS Software for Building a Spatial Data Infrastructure. In Geospatial Free and Open Source Software in the 21st Century; Borcher, E., Neteler, M., Eds.; Springer: Berlin/Heidelberg, Germany, 2012; pp. 247–261. [Google Scholar]
- Conway, N. Open Source GIS: A Disruptive Force or a Driver of Innovation? Gis Prof. 2017, 78, 14–15. [Google Scholar]


| Variables | Model A | Model B | Model C | Model D | ||||
|---|---|---|---|---|---|---|---|---|
| Pop. | Emp. | Pop. | Emp. | Pop. | Emp. | Pop. | Emp | |
| Gross Floor Space | ✓ | ✓ | ✓ | ✓ | ✓ | ✓ | ✓ | ✓ |
| Net-to-Gross Floor Space Ratio | - | - | - | - | ✓ | ✓ | ✓ | ✓ |
| Net Floor Space per Dwelling Unit | ✓ | - | ✓ | - | ✓ | - | ✓ | - |
| Household Size | ✓ | - | ✓ | - | ✓ | - | ✓ | - |
| Net Floor Space per Employee | - | ✓ | - | ✓ | - | ✓ | - | ✓ |
| Occupancy Rate | - | - | ✓ | ✓ | - | - | ✓ | ✓ |
| Modeling Approach | Author(s) | Study Area | Geographic Scale | Purpose of Study |
|---|---|---|---|---|
| Model A | Watson & Associates Economist Ltd [72] | Waterloo, Canada | City-wide | To review the development charge with the forecasted public facilities to serve the new development. |
| County of Riverside [73] | Riverside County, United States | County | To appraise the population and employment growth from the general plan for socioeconomic, transportation, environment, public infrastructure, and facility planning. | |
| SGS Economics and Planning [74] | Parramatta, Australia | Precinct | To evaluate the implication of the city center master plan against the projected economic growth and housing demand. | |
| Connor Holmes [51] | Wilton Junction, Australia | Township | To analyze the land use supply and infrastructure planning of the new township proposal to meet the future forecasted population and job demand. | |
| District of Mission [75] | Mission, Canada | City-wide | To study commercial and industrial land availability to meet the future labor force demand. | |
| Model B | Strategic Regional Research Alliance [76] | Greater Toronto Area, Canada | Metropolitan | To examine the impact of regional express rail development on the jobs and housing growth around the transit stations. |
| City of Woodland [77] | Woodland, United States | Township | To evaluate the environment effects of potential population and employment growth from the general plan. | |
| Model C | City of Calgary [21] | Brentwood, Canada | Precinct | To assess the traffic impact of the station area redevelopment plan. |
| Japan International Cooperation Agency [52] | Kabul Metropolitan, Afghanistan | Metropolitan | To analyze the land use plan to meet the need for regional expansion. |
| Station Area | Population 1 | Employment 2 |
|---|---|---|
| Toyosu | 13,989 | 21,116 |
| Etchujima | 5166 | 4556 |
| Tsukishima | 16,463 | 6808 |
| Kachidoki | 14,934 | 8124 |
| Kiba | 8794 | 15,663 |
| Station Area | Estimated Total Gross Floor Area (sq. m) | |||
|---|---|---|---|---|
| Residential | Commercial | Institution | Industrial | |
| Toyosu | 578,098 | 631,139 | 20,442 | 3389 |
| Etchujima | 281,239 | 123,472 | 20,442 | 13,800 |
| Tsukishima | 738,100 | 122,505 | 42,060 | 14,440 |
| Kachidoki | 775,820 | 208,320 | 69,910 | 25,159 |
| Kiba | 425,943 | 325,754 | 14,404 | 13,728 |
| Variables | Residential | Commercial | Institution | Industrial |
|---|---|---|---|---|
| Net-to-Gross Floor Space Ratio | 0.75 1 | 0.75 1 | 0.75 1 | 0.90 1 |
| Occupancy Rate | 0.96 2 | 0.98 2 | 0.98 2 | 0.97 2 |
| Net Floor Space per Employee (worker per sq. m) | - | 20 3 | 35 3 | 50 3 |
| Net Floor Space per Dwelling Unit (unit per sq. m) | 65 4 | - | - | - |
| Household Size (residents per dwelling unit) | 1.94 5 | - | - | - |
| Station Area | Model A | Model B | Model C | Model D | ||||
|---|---|---|---|---|---|---|---|---|
| Pop (%) | Emp (%) | Pop (%) | Emp (%) | Pop (%) | Emp (%) | Pop (%) | Emp (%) | |
| Toyosu | +23.34 | +52.53 | +18.41 | +49.48 | −7.50 | +14.45 | −11.20 | +12.16 |
| Etchujima | +62.48 | +54.38 | +55.98 | +51.23 | +21.86 | +16.70 | +16.99 | +14.31 |
| Tsukishima | +33.81 | +11.86 | +28.46 | +9.59 | +0.36 | −15.46 | −3.66 | −17.19 |
| Kachidoki | +55.05 | +58.99 | +48.85 | +55.75 | +16.29 | +20.17 | +11.64 | +17.71 |
| Kiba | +44.56 | +8.37 | +38.78 | +6.18 | +8.42 | −18.46 | +4.08 | −20.11 |
| Mean Absolute Percentage Error (%) | 43.85 | 37.23 | 38.10 | 34.45 | 10.89 | 17.05 | 9.51 | 16.30 |
© 2019 by the authors. Licensee MDPI, Basel, Switzerland. This article is an open access article distributed under the terms and conditions of the Creative Commons Attribution (CC BY) license (http://creativecommons.org/licenses/by/4.0/).
Share and Cite
Teh, B.T.; Shinozaki, M.; Chau, L.W.; Ho, C.S. Using Building Floor Space for Station Area Population and Employment Estimation. Urban Sci. 2019, 3, 12. https://doi.org/10.3390/urbansci3010012
Teh BT, Shinozaki M, Chau LW, Ho CS. Using Building Floor Space for Station Area Population and Employment Estimation. Urban Science. 2019; 3(1):12. https://doi.org/10.3390/urbansci3010012
Chicago/Turabian StyleTeh, Bor Tsong, Michihiko Shinozaki, Loon Wai Chau, and Chin Siong Ho. 2019. "Using Building Floor Space for Station Area Population and Employment Estimation" Urban Science 3, no. 1: 12. https://doi.org/10.3390/urbansci3010012
APA StyleTeh, B. T., Shinozaki, M., Chau, L. W., & Ho, C. S. (2019). Using Building Floor Space for Station Area Population and Employment Estimation. Urban Science, 3(1), 12. https://doi.org/10.3390/urbansci3010012