1. Introduction
From the beginning of the new millennium, Spain has been affected by an economic context that has had a major impact on the dynamics and ways of building Spanish cities [
1,
2]. There has been an explosive urban growth up to the year 2008, which produced a spectacular impact on the real estate sector. Before this time, there had been a considerable territorial expansion of land suitable for development, which substantially modified the urban sprawl and the constructive typologies, incorporating modalities of low-density alternatives to those traditionally used in Spain. However, since 2008, the Global Financial Crisis has opened a period marked by a different scenario, causing an abrupt slowdown in social and economic dynamics.
In this context, there are factors throughout the periods (2000–2008 and 2009–2016) that can be understood as structural, and that have widely affected different European societies [
3]. Other factors are typical of the present Spanish reality, which has contributed to accentuate and single out the effects of the economic boom and the subsequent crisis of those years. These local and structural factors have marked differences, singularities, and sometimes specific responses, and have been supplemented elsewhere. Thus, there are cities that have dominated the processes of regeneration and the reform of traditional consolidated urban spaces; in other cities, dispersal strategies have taken over landscapes, but situations of decline and deterioration of intra-urban system elements have also appeared.
However, less attention has been paid to the dynamics of medium-size Spanish cities, where the intensity and time frame has not always coincided with the those mentioned before. From the demographic point of view, these medium-sized cities have been more dynamic than larger Spanish ones, reinforcing their role as the backbone of the territory and as sites of intercommunication.
This report pays attention to a group of inner medium-sized cities, away from the influence of coastal residential tourism. Here, the processes of urban sprawl are associated with factors of a different nature, but they have acted jointly, in some cases favoring urban dynamics in areas that have traditionally been agricultural being rapidly turned into forms of dispersion from the city. This process is part of a theoretical context that has been defined by a lack of agreement in relation to the concept of what a medium-sized city is from the point of view of statistical thresholds. Unfortunately, there are no criteria that could provide precise clarification on what is behind the idea of urban sprawl. To address this, this report deals with the behaviour of the peripheries of 24 cities, analysing the evolution of the population, the urban land, and the built-up land over two distinct periods. The first one coincides with the great dynamics of the construction (2000–2008). The second one focusses its attention on the subsequent crisis and the beginning of the recovery (2009–2016).
The main focus of this report examines the territorial point of view and the processes of urban sprawl in the surroundings of inner medium-sized cities in Spain. These are framed in a context of urban growth from the end of the last century up to the year 2008, which was an especially intense period for big cities; the dynamics that have affected their metropolitan areas have been much studied by the scientific community. The report also investigates the behaviour patterns of the city model, the logic behind territorial management, and adaptations to the requirements for sustainable development, social inclusion, and governance, which have changed [
4]. These changes have also been observed along the Mediterranean coast and among its islands, where sun and beach tourism have generated a strong demand for second homes [
5].
2. The Medium-Sized Cities and Urban Sprawl
Through studying what has happened during the periods 2000–2008 and 2009–2016, it can be said that these have been characterised by different dynamics. This report pays attention to what has happened in city outskirts, with the complexity associated with the conceptualisation of medium-sized cities and urban sprawl. The very idea of what a city is requires considerable effort by administrations and academics to define it. In Spain, it is associated with the statistical threshold of 10,000 inhabitants [
6]; the European Union sets the population limit at 50,000 inhabitants residing in the urban center, with densities higher than 1500 inhabitants per km
2 [
7]. There is not a shared definition of a compact city either, although some authors present it as a multidimensional reality including complex interactions that are more like an interpretative image of a spatial framework than a model developed from accurate data, which shows a certain functional mixture and a greater environmental sustainability [
8] (p. 24). The truth is that their morphology appears to be associated with cities that are consolidated with a certain building and demographic density.
Together with the complexity of the definition of the traditional, compact, intense, and dense city, there is a definition of urban sprawl shared by the academic community (territorial scope, building density, functional specialisation, constructive types, etc.). This originated in the United States, joining in a progressive movement after World War II, and marking some of the guidelines of progressive territorial integration, which has moved to define the different steps of the American urban hierarchy [
9] (p. 26). Subsequently, this has been reproduced in the European countries [
10,
11,
12,
13,
14]. Different authors, with different visions and approaches, have tried to provide terms in order to establish a reality that has gradually deterritorialised and reterritorialised the city [
15]. Some of these are: diffused city [
16], scattered city [
17], dispersed city [
18], or inefficient city [
19] (p. 72).
There are different reasons and different factors involved in the process. Some are of a general nature, and which highlight the close relationship between the way of building the city and globalisation. Technological innovations are the most important, particularly those related to the Global Information System [
20]. Along with this, close relationships with neoliberalism, capitalism, and financial sector strategies arise in relation to the real estate sector [
21,
22,
23]. In connection with these processes, normative frameworks that drive the forms of dispersed cities and enticing business opportunities have emerged; these have also occurred in a context of economic growth, which has provided significant amounts of money to the residential sector. We also have to add the reduction in travel costs; transport improvements and new communications infrastructure; the support of the public sector in favour of housing and property; the emergence of large companies engaged in the construction sector; the generalisation of large supermarkets within urban peripheries; the deterioration of the quality of life in some central urban areas; the progressive delegation of urban policies to private actors; and social changes (increase of rent, new housing preferences, and lack of affordable inner city housing) [
15,
24].
Apart from these structural factors, we must add others that are typical of the Spanish situation, from the beginning of the century until 2008, where unusual urban activity and a housing boom have occurred. These can be explained to some extent by the diverse nature and demographic constraints as Spain increased its population by six million people in just one decade as a result of intense international migratory flows [
25]. We must add the rise in the average incomes of the population in a context of economic prosperity; the presence of favourable policies for the acquisition of housing; the emergence of legislation turning from a rigid model of administrative control in the supply of land into another one based on flexibility and deregulation, converting virtually all of the developable land (Law of the Soil 7/1997 of 14 April measuring soil and the liberalisation of professional associations), and incorporating the figure of the urbanisation agent, who with no property but with authorisations and credit can initiate urban developer proceedings [
1,
2,
24,
26]. However, it has been mainly the effect of a financial sector that has set eyes on building as a window of opportunity, in the context of low interest rates, lending money to developers, construction companies, and end-buyers [
22,
27].
The result of this process has been threefold. On the one hand, traditional urban morphologies, with increased decentralisation and the dispersion of the population, housing, and activities in space areas that transcend the traditional city limits have changed. A second effect highlights that the reterritorialisation of the city towards its periphery has left monofunctional spaces in the outskirts (residential areas, mostly, but also commercial, leisure, or industrial areas), which are sometimes very far away, but remain well-connected, are dependent on cars, and have intense daily traffic flows between home and the workplace or leisure centers. Its impact is so strong that it has become one of the greatest problems for the 21st century [
28]. Finally, the construction typologies, which are associated with new social patterns of consumption but also the interests of local governments and real estate agents and preferences, have caused roads and transport logistics to change and improve.
A very different situation has been felt from the year 2008. The Global Financial Crisis meant an almost total halt to the economy in general, and specifically for the real estate sector. At the same time, a reflection in the political and administrative scope occurred in order to try to stop and correct some dysfunctions inherited from the period of “expansive urbanism” or “urban tsunami” [
1,
2].
On the other hand, a process of progressive return to the traditional city model has started to consolidate, to the detriment of the forms of urban sprawl. In the Spanish case, the emergence of new laws stand out; these have looked towards the consolidated city (identify the 2007 and 2014 laws), and which have opened the door to a new stage in urban spaces, now with less attention to the dispersed city and a growing interest in returning to a city model that is more sustainable in the social, environmental, and economic scope.
This set of situations has occurred over different stages of the urban system. They are located in two different territorial and functional areas: some are part of the polynuclear metropolitan areas, which affects their demographic and urban dynamics (in the case of Madrid, Barcelona, or Valencia), while in others, the dynamics are justified by internal logic (cities relatively far from large national capitals). In medium inner cities, these processes have also taken place, and have played out, with different intensities, in contrast to the dynamics and processes of the larger ones and their respective metropolitan areas.
3. Methodology and Sources
From the methodological point of view, a temporary framework that aims to focus attention on what happened in the 21st century has been used, differentiating between two well-marked periods. The first covers 2000 to 2008 and, as pointed out in previous pages, forms part of a context of an accelerated growth of the economy and the construction sector. The second corresponds to what happened between 2009–2016, which in this case is the reflection of an intense crisis felt until 2013 that had effects of a different nature, but which had among its causes and consequences construction that has left numerous social problems and failed examples of buildings, PAUs (Urban Planning Plans), or large projects related to urban marketing [
29,
30].
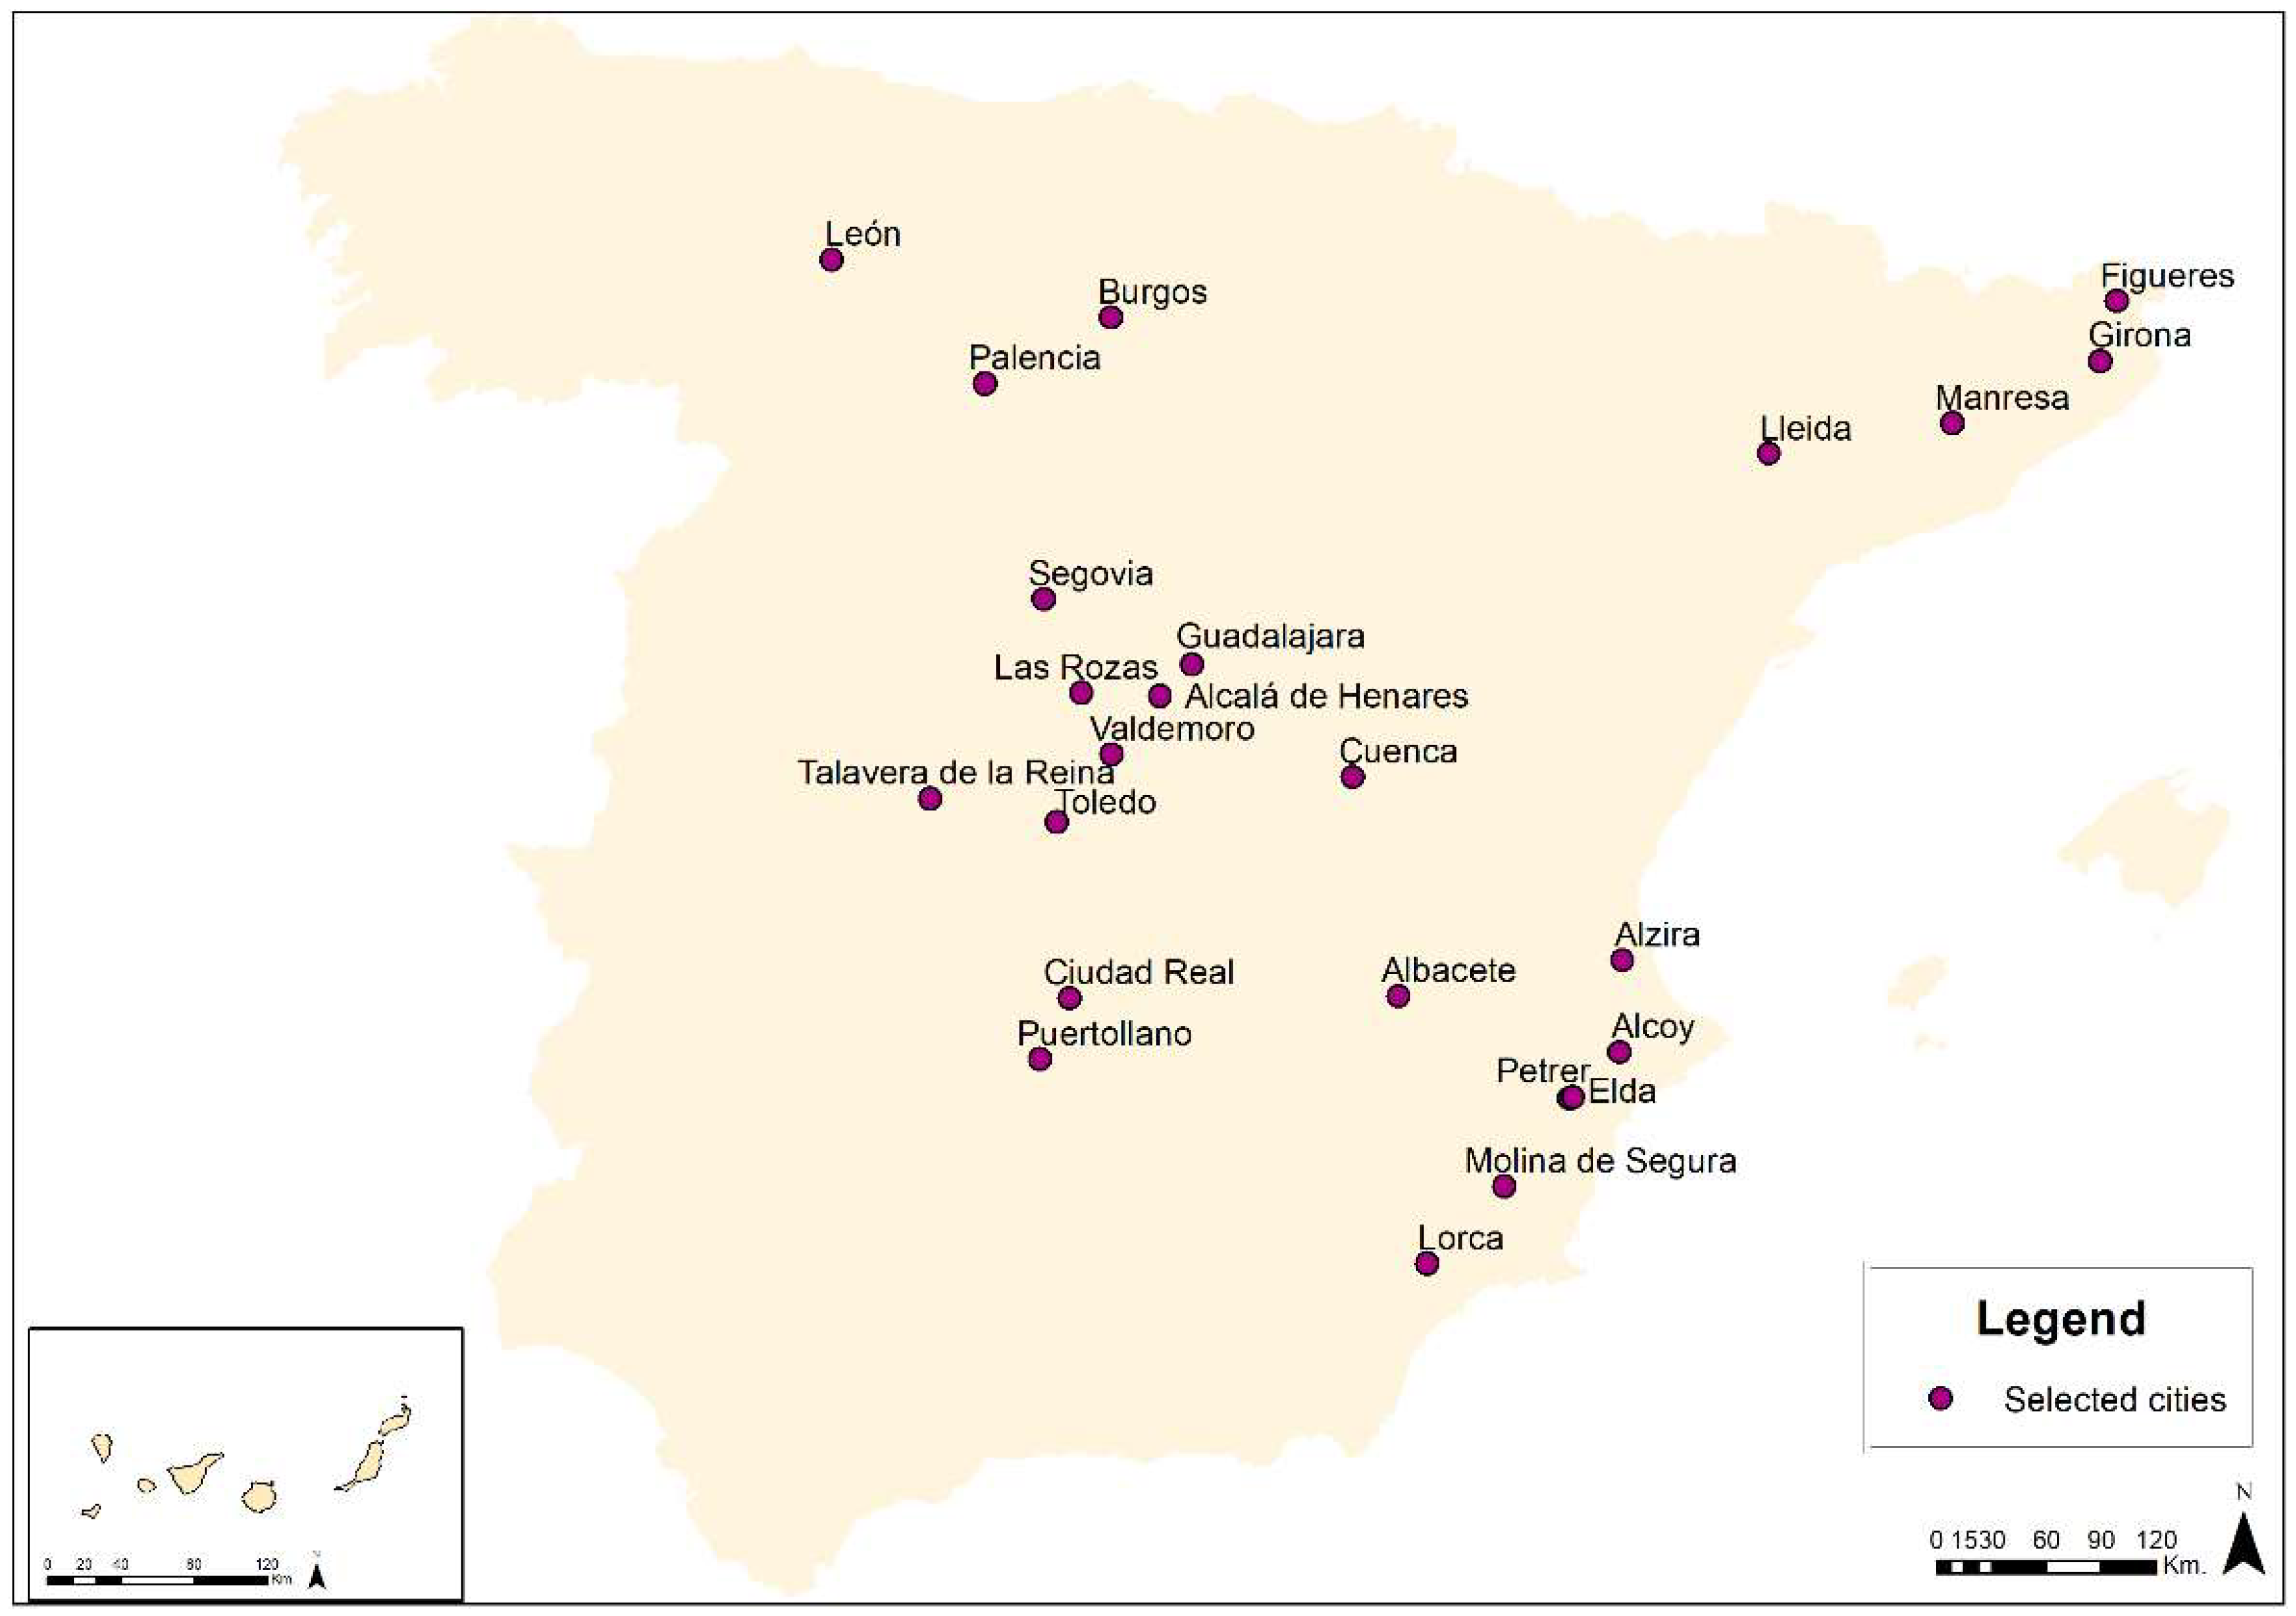
From the territorial point of view, we have selected 24 cities. See
Figure 1.
In order to analyse the behavior of the city outside its limits, a space of analysis consisting of a crown with a radius of 30 kilometers from each of the central cities has been generated, including the municipalities that have their own town council and local government within this radius (those whose council is outside this limit have been excluded from the analysis). This implies extending the idea of an urban area beyond municipalities adjacent to the city (the last criteria has been used in the preparation of the Urban Audit, Eurostat, and the Atlas of the Spanish Metropolitan Areas by the Ministry of Development) [
31,
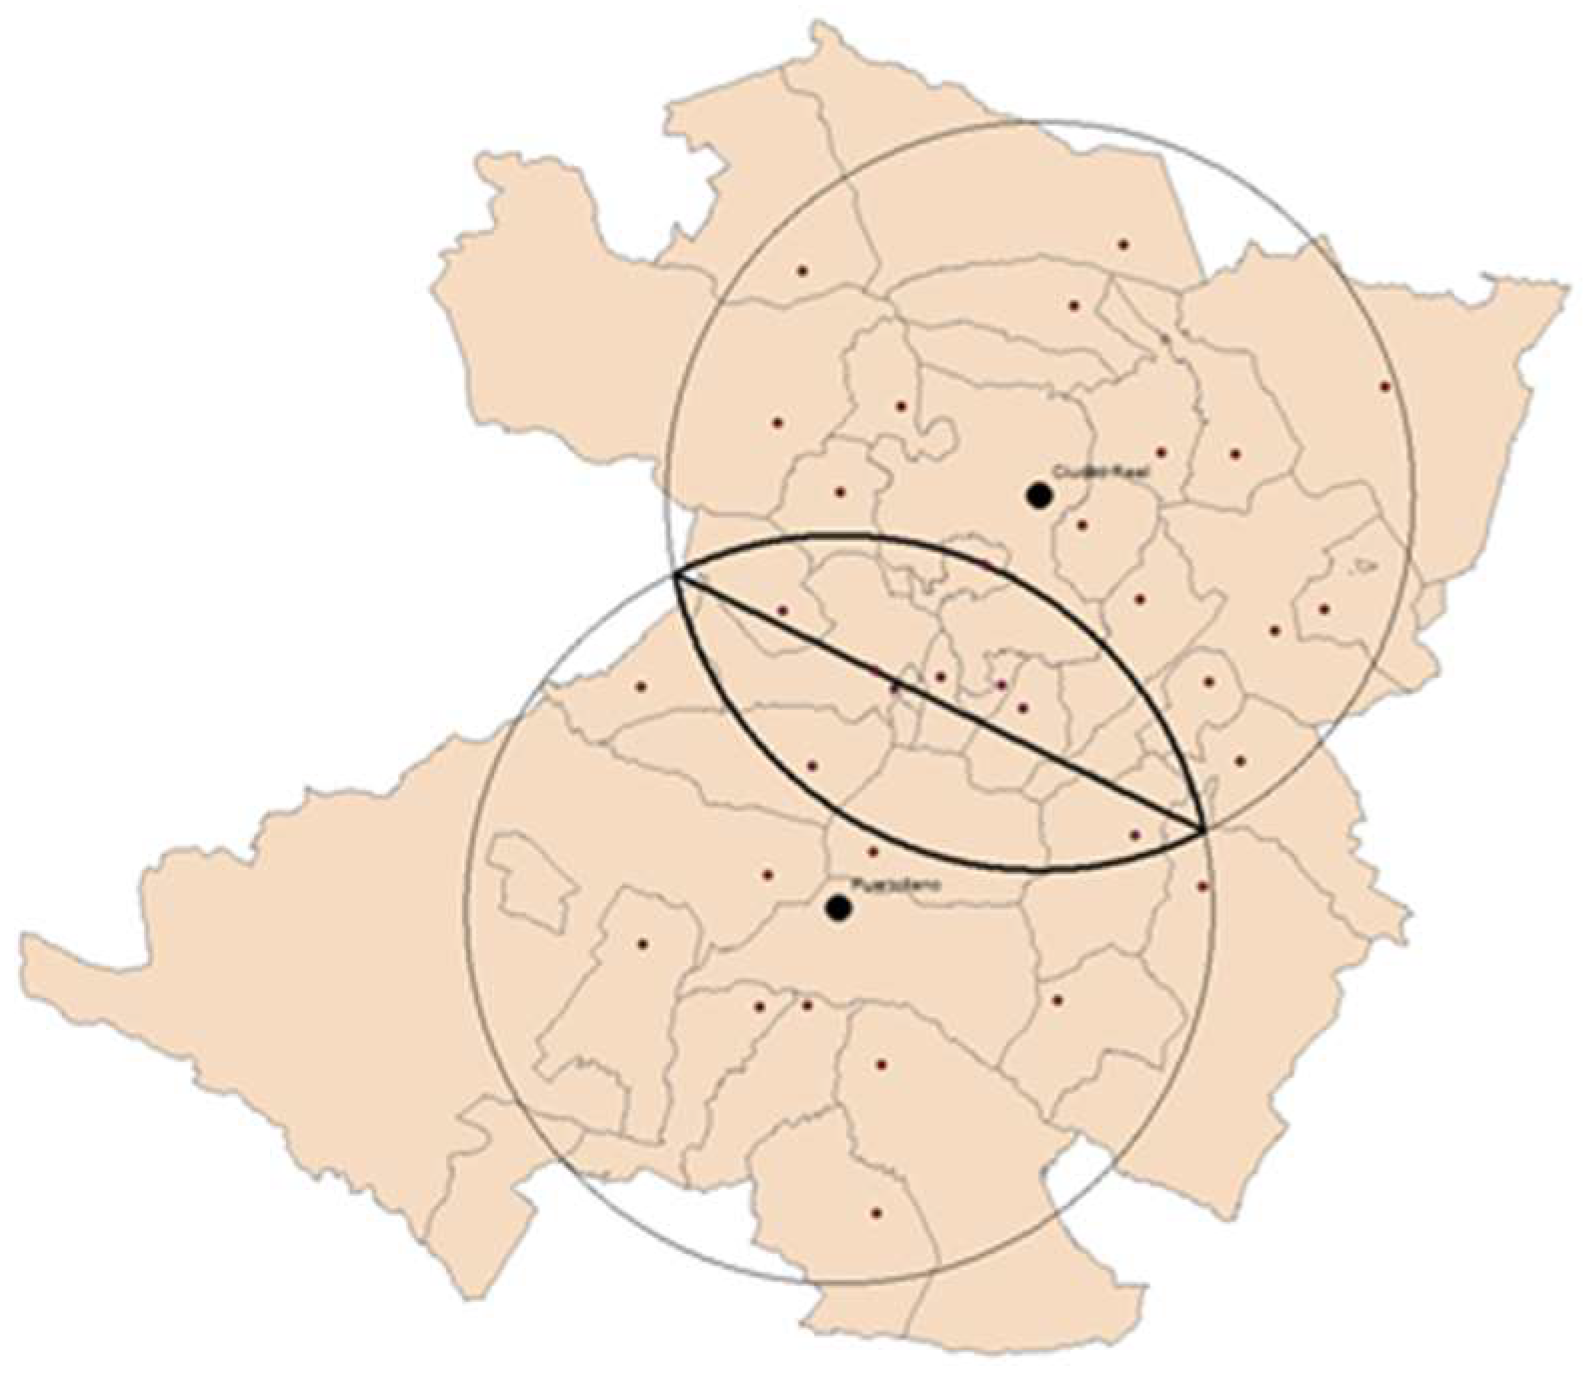
32]. For cases in which urban areas (UAs) overlap with other cities (they appear as cutting circles), the surface has been divided into two equal parts starting from the intersection points (
Figure 2). This situation occurs in: (1) Ciudad Real and Puertollano; (2) Guadalajara and Alcalá de Henares; (3) Alcoy and Alzira; (4) Alcoy and Elda-Petrer; (5) las Rozas and Segovia; (6) las Rozas de Madrid, Valdemoro, and Alcalá de Henares; (7) Toledo and Valdemoro; and (8) Figueras and Gerona.
On the other hand, when these analysed urban areas are in close proximity to other larger areas not included in the medium-city category, and their respective areas of influence overlap, the municipalities forming part of the greater city have been excluded, meaning that they depend functionally on them. Once the areas of distribution are identified, tables with the information added have been generated, differentiating between the core ‘city’, on the one hand, and the respective urban areas, on the other.
We have used two types of variables in order to analyse the changes operated in the respective urban crowns: population and residential plots (built and not built). In the case of the demography, the municipal register of inhabitants has been used (2000, 2008, and 2016, on 1 January each year, INE -Instituto Nacional de Estadística-). To understand the production process of the city, the Real Estate Register of the Ministry of Finance and Public Service (Cadastre) has been used as a source of information, from which several variables have been extracted, including the surface of urban plots built and urban plots surface not built for the three years considered (2000, 2008, and 2016). Similarly, from the files of the catalogue type in plain text format, which was provided by the Register’s electronic site, we have obtained information concerning the number of properties by municipality. These were established with the key of the property “urban” and the key of the group “housing”, which respond to the following types: 1.1. Collective housing of urban character (1.1.1. Open buildings and 1.1.2. Building in closed blocks), 1.2. Single-family houses of urban character (1.2.1. detached or semi-detached buildings and 1.2.2. terraced or closed blocks) and 1.3.1. Rural construction: exclusive use for housing.
A relative variation has been calculated. The municipality has been used as the unit of analysis.
An appropriate scale has been designated, assuming that it can cover certain realities, such as unequal territorial, demographic dimensions, or the presence of different settlement models, which can cover the presence of separated urban developments, and sometimes remote, municipal capitals. An example of this would be the case of Seseña, which has had much media coverage, where many of the new developments have been generated outside of the traditional city limits [
33]. Nevertheless, for the purposes of this report, this unit of calculation is valid to identify what has happened.
The final data has been worked on using a double scale: the city and urban areas (UA). The results have been mapped with ArcMap at the municipal scale when it has fallen to this level of detail, while the aggregate urban areas are presented in tabular form and using panel data, showing absolute values of the population within unbuilt and built surfaces.
4. Development of the Methodology
4.1. Demographic Transformations
The first issue that draws our attention while analysing the demographic dynamics [
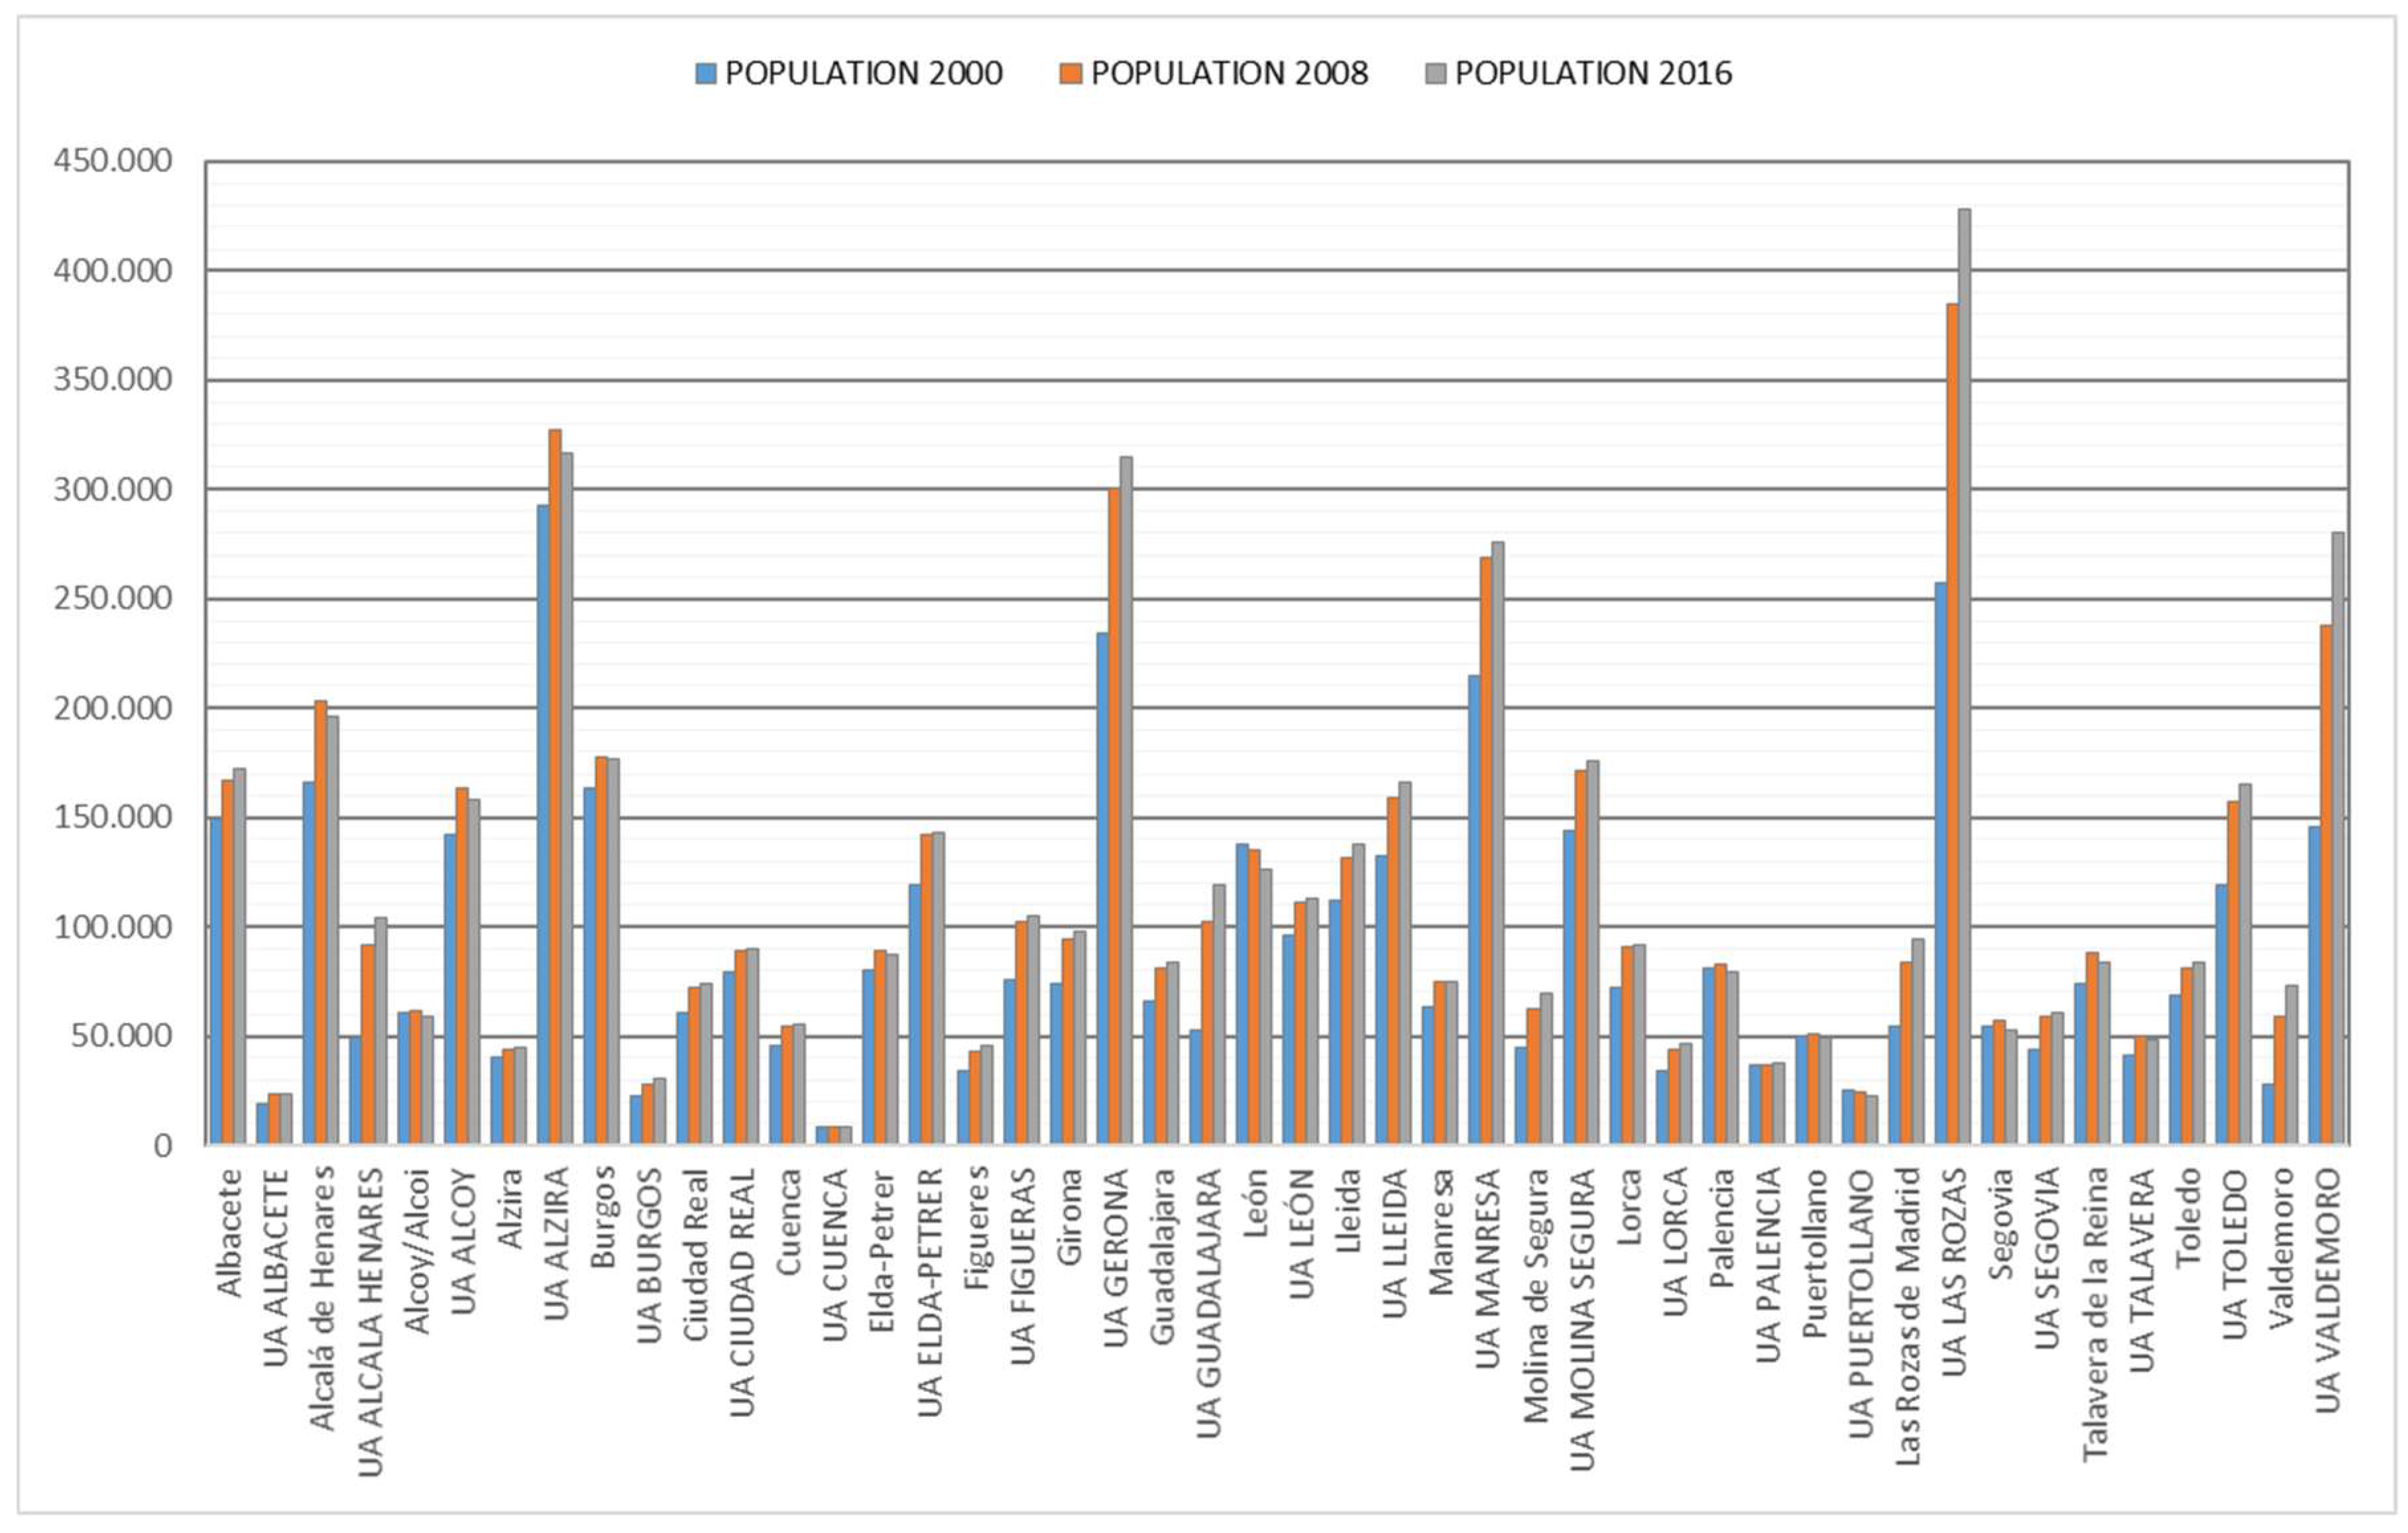
6] is that urban areas (UAs) provide positive dynamics in the first stage, while facing a situation of stagnation and even recession in the years after 2009 (
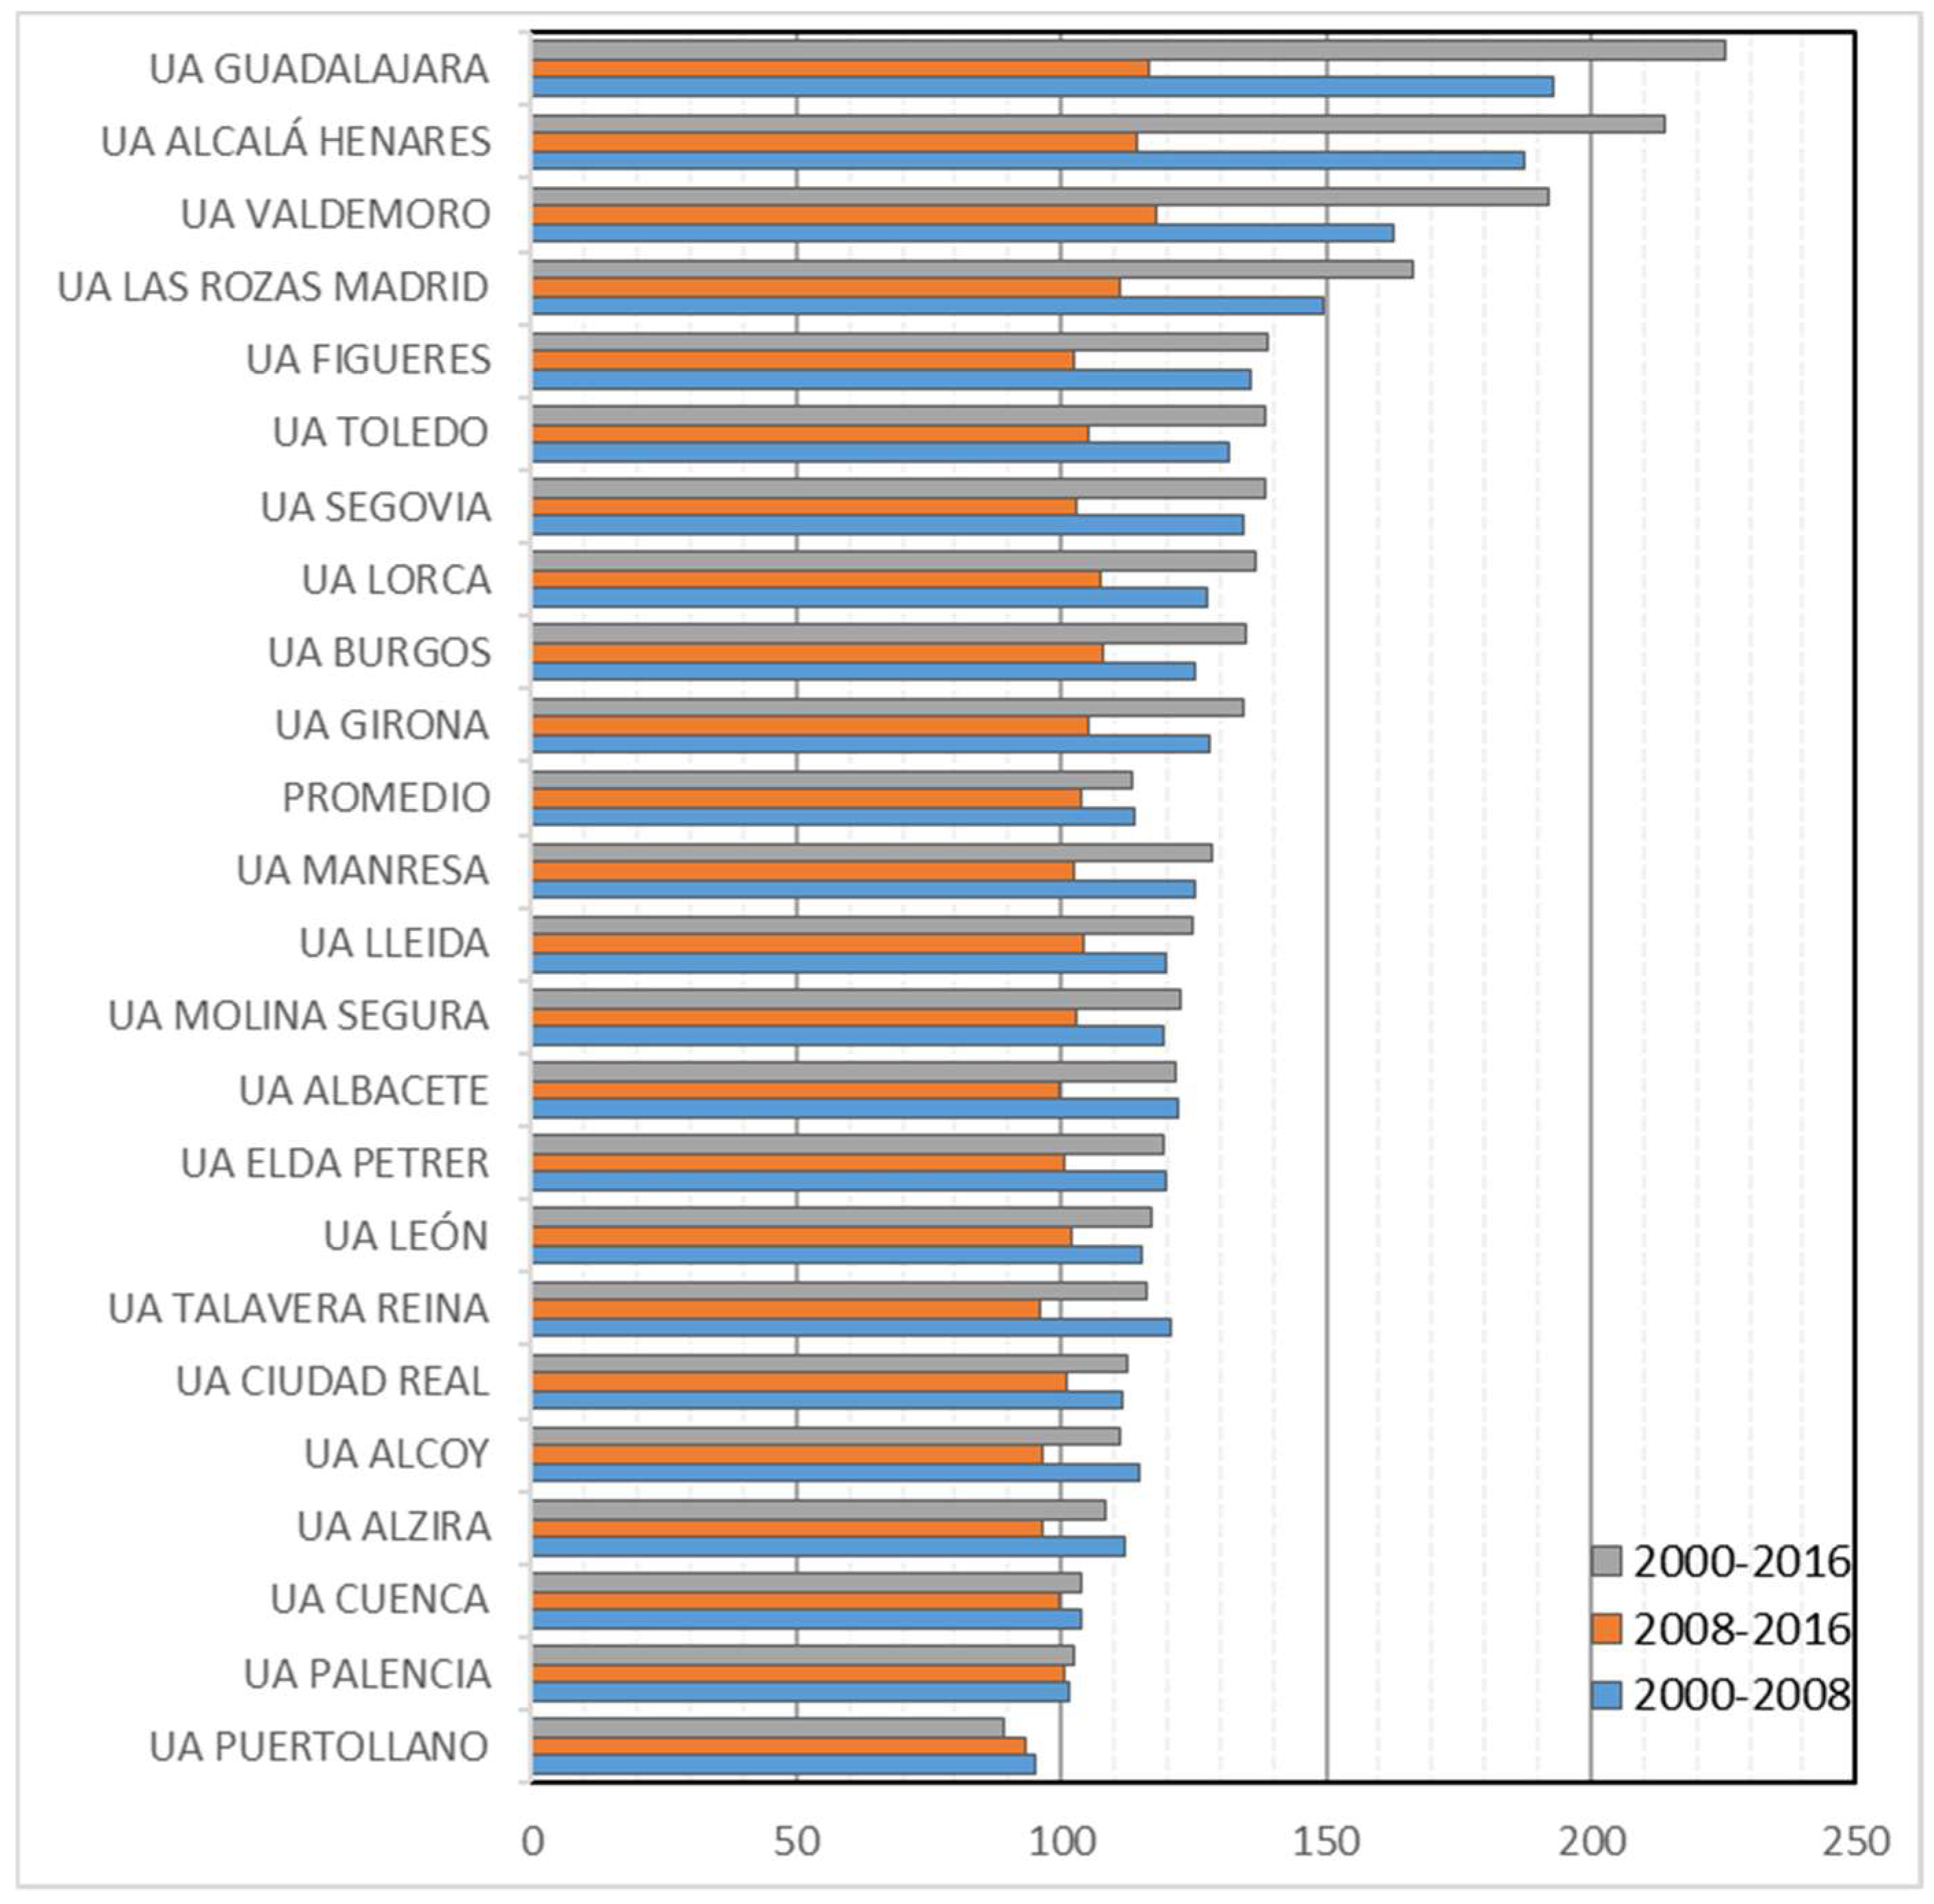
Figure 3). Another aspect to be highlighted is that the overall trend between 2000–2016: UAs has left variation rates higher than those of the cities. Only in six of the 23 cases considered (Ciudad Real, Cuenca, Molina de Segura, Puertollano, Las Rozas, and Valdemoro) has there been a greater dynamic of central urban spaces facing a more leisurely situation in their respective crowns. Considering the behaviour of the different UAs (excluding the central cities) on the basis of the values obtained for periods, four categories have been established from the resulting quartiles (
Figure 4).
Within the first category (first quartile), there are five UAs that have experienced a very positive and sharp increase—above 40%--along the two cycles considered. This suggests that the trends that were initiated at the beginning of the century as a result of the crisis have not slowed down. The ones in Guadalajara are located at this first level (population increased by 225% from 2000 to 2016); Alcalá de Henares (increased by 213%); Valdemoro, which almost reached these thresholds (191%); Las Rozas (166%); and Figueras (138%). In most cases, they are nearby cities integrated in the metropolitan area of Madrid (the first four).
Within the category II (second quartile), there are six cities, with more moderate increases, since they are all located between 28.3% for Manresa and 138.6% for Toledo. Lleida holds a medium position, with 124.75%.
The third category (third quartile) is made up of six urban areas with increase rates ranging from 112.5% (Ciudad) to 122% (Molina de Segura) between 2000–2016. Finally, the fourth category is made up of the UAs, with very contained and regressive dynamics, and with rates averaging around 110.9% for Alcoy and Puertollano, which experienced a population decrease (it lost 12% between 2000–2016).
Obviously, this first view, as pointed out before, is partial, because it captures the behaviour of UAs in an aggregate manner. In the scale below, there are considerable imbalances in the dynamics of the different municipalities that are part of each one of them.
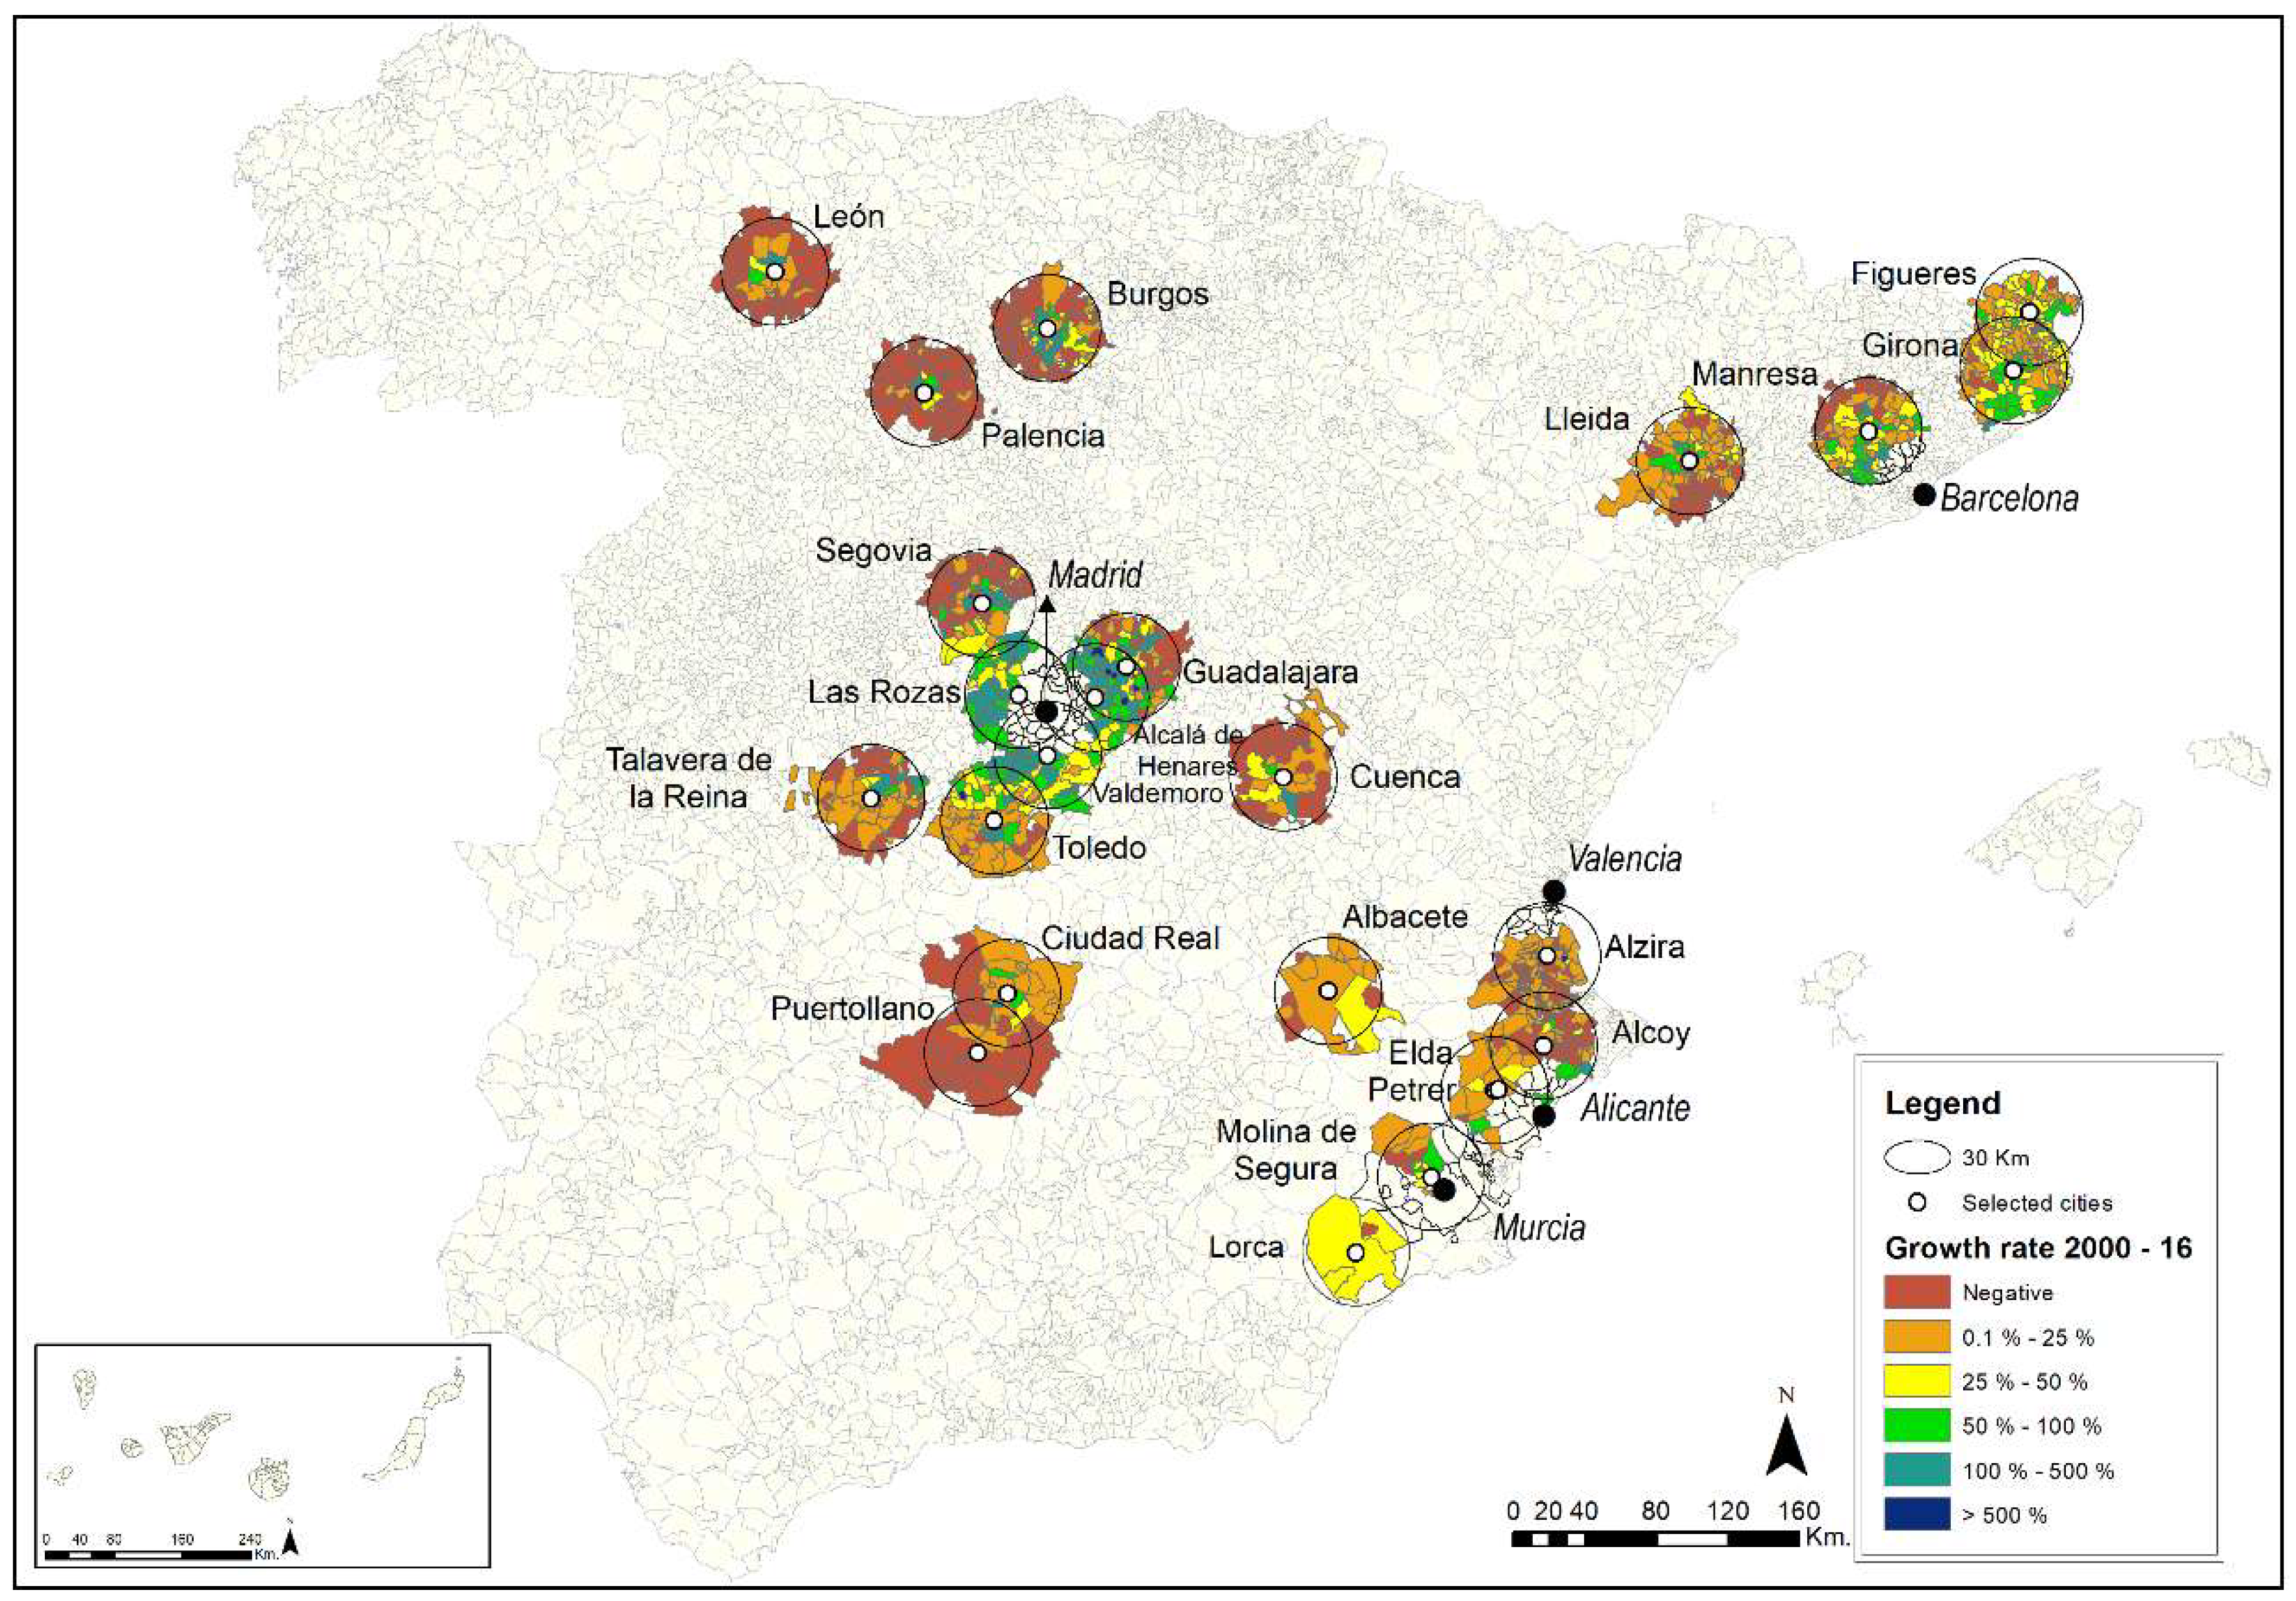
Figure 5 shows the rates of growth at the municipal level. It can be seen how higher behaviours usually appear in spaces adjacent to the central cities. However, they are mostly present in the environment of the large metropolitan areas. This is the case of the integrated or close to polynuclear organisation of Madrid, Barcelona, Alicante, or Valencia, although the phenomenon occurs with uneven intensity and variable geometry, and is conditioned by the position of the areas in relation to the communication networks and the economic dynamics of different areas. There is no doubt that the most pronounced growth situations have occurred between Guadalajara and Alcalá de Henares. More than 500% of superior dynamics occurred in the period 2000–2016, such as in the case of Yebes, with a 4706% of increase; Cañizar, which grew by 2233%; Quer (2157%); Chiloeches (1361%); Tórtola de Henares (1533%); Loranca de Tajuña (904%); Torija (722%); Pioz (705%); or Fuentelviejo (572%).
The municipalities that have grown between 100–500% are located in the geographical urban area of Las Rozas, Alcalá, and Valdemoro, and thus have become transitional between them and the cities of Toledo and Madrid, which articulates a polynuclear metropolitan system that includes Toledo and Guadalajara. A similar situation occurs in the municipalities located in the surroundings of Manresa and Gerona, which are linked with the urban area of Barcelona. These dynamics are lessening as the distance to each of the respective central cities increases. On the opposite extreme, with regressive taxes, we have the cases of Puertollano, Castilla-La Mancha, and Palencia in Castilla y León.
4.2. Changes in the Surface of Unbuilt Urban Plots
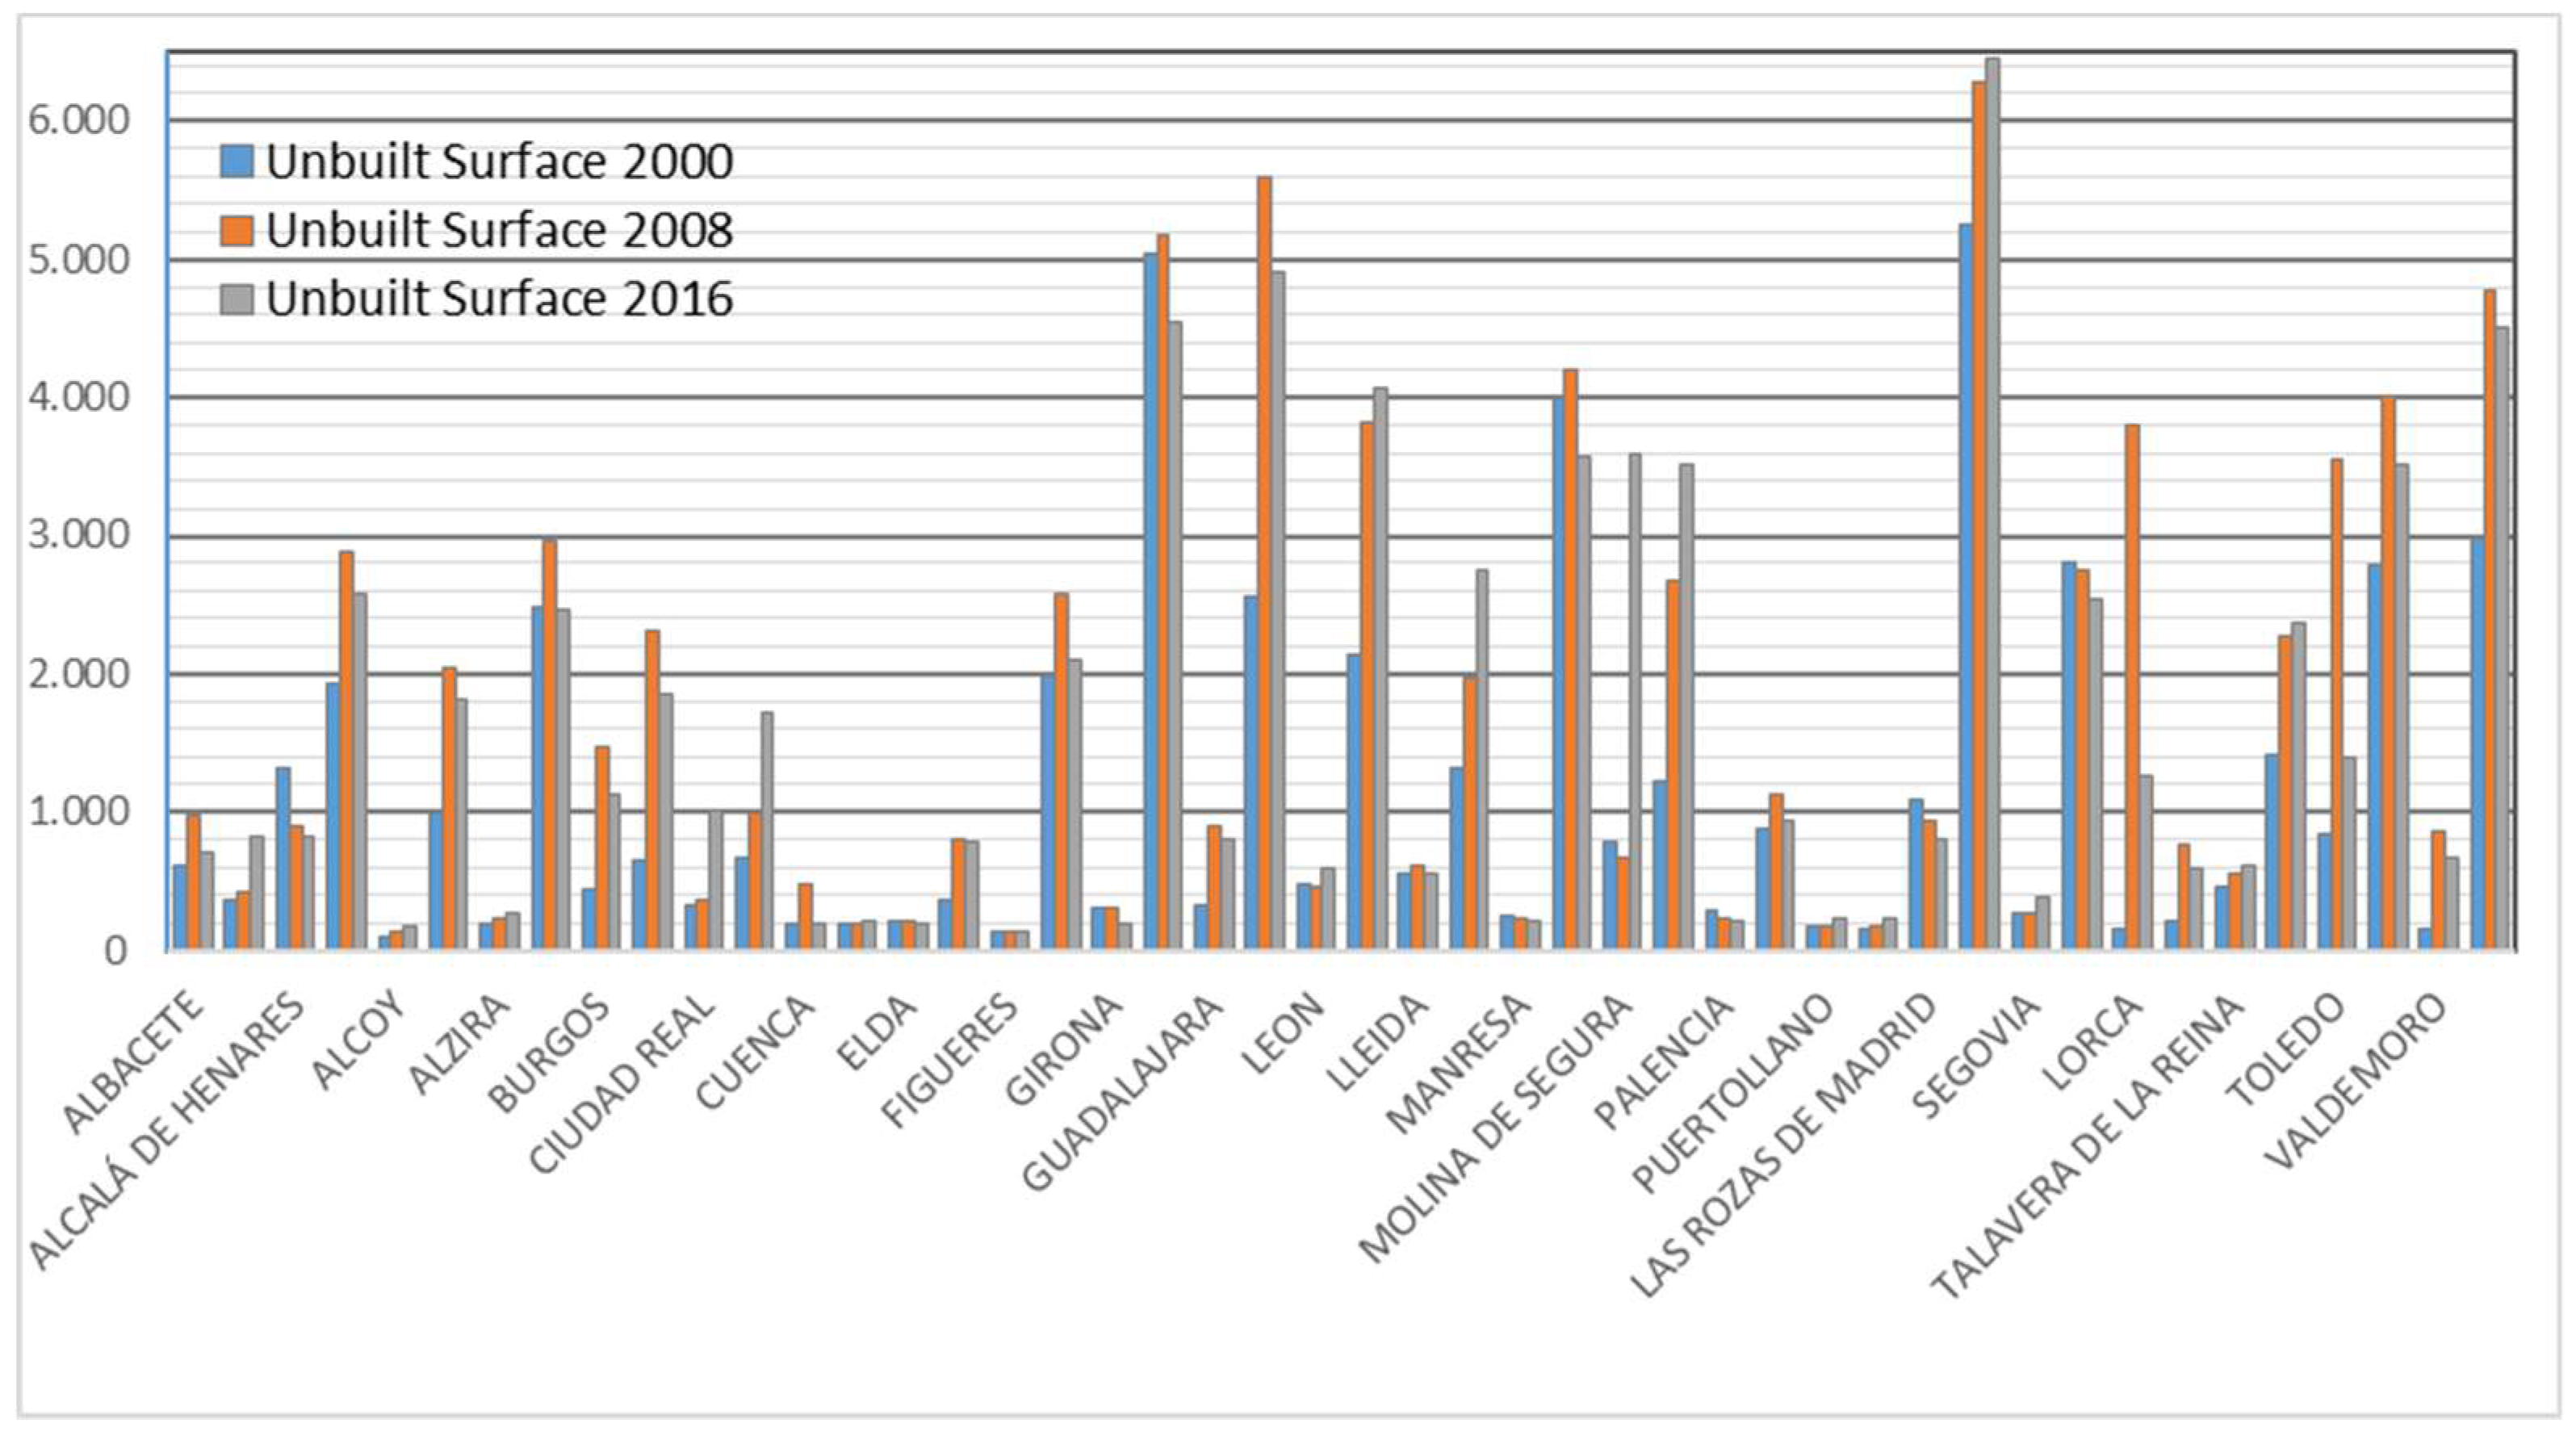
The processes of transformation of the surfaces of urban unbuilt plots (reserve flooring) leave variation rates pointing in two directions. In the cities, it can be seen, on the one hand, that a small group has left especially significant growth (Lorca, Valdemoro, and Toledo). From the temporal point of view, it is striking that the process has been mainly focused on the period 2000–2008, which is when the surface increased most (
Figure 6). However, in some cases, the trend is maintained, and it is even increasing over the long term (2000–2016), which indicates that urban land has continually been created in the UA after the onset of the crisis (Albacete, Ciudad Real, Cuenca, Molina del Segura, and Puertollano).
The momentum experienced by some of them, which sometimes has been greater than the main city (this situation has been given in 15 of the 23 areas), is highlighted. During the whole analysed period (2000–2016), we highlight the response of Burgos, where urban plots have grown by 285%; in Albacete, where urban plots have grown by 223%; in Alcoy, where urban plots have grown by 182%; León, where urban plots have grown by 190%; in Lleida, where urban plots have grown by 109%; and in Talavera, where urban plots have grown by 165%. We have to especially indicate the case of Lorca, which between 2000–2008 multiplied its land surface by a factor of 10.
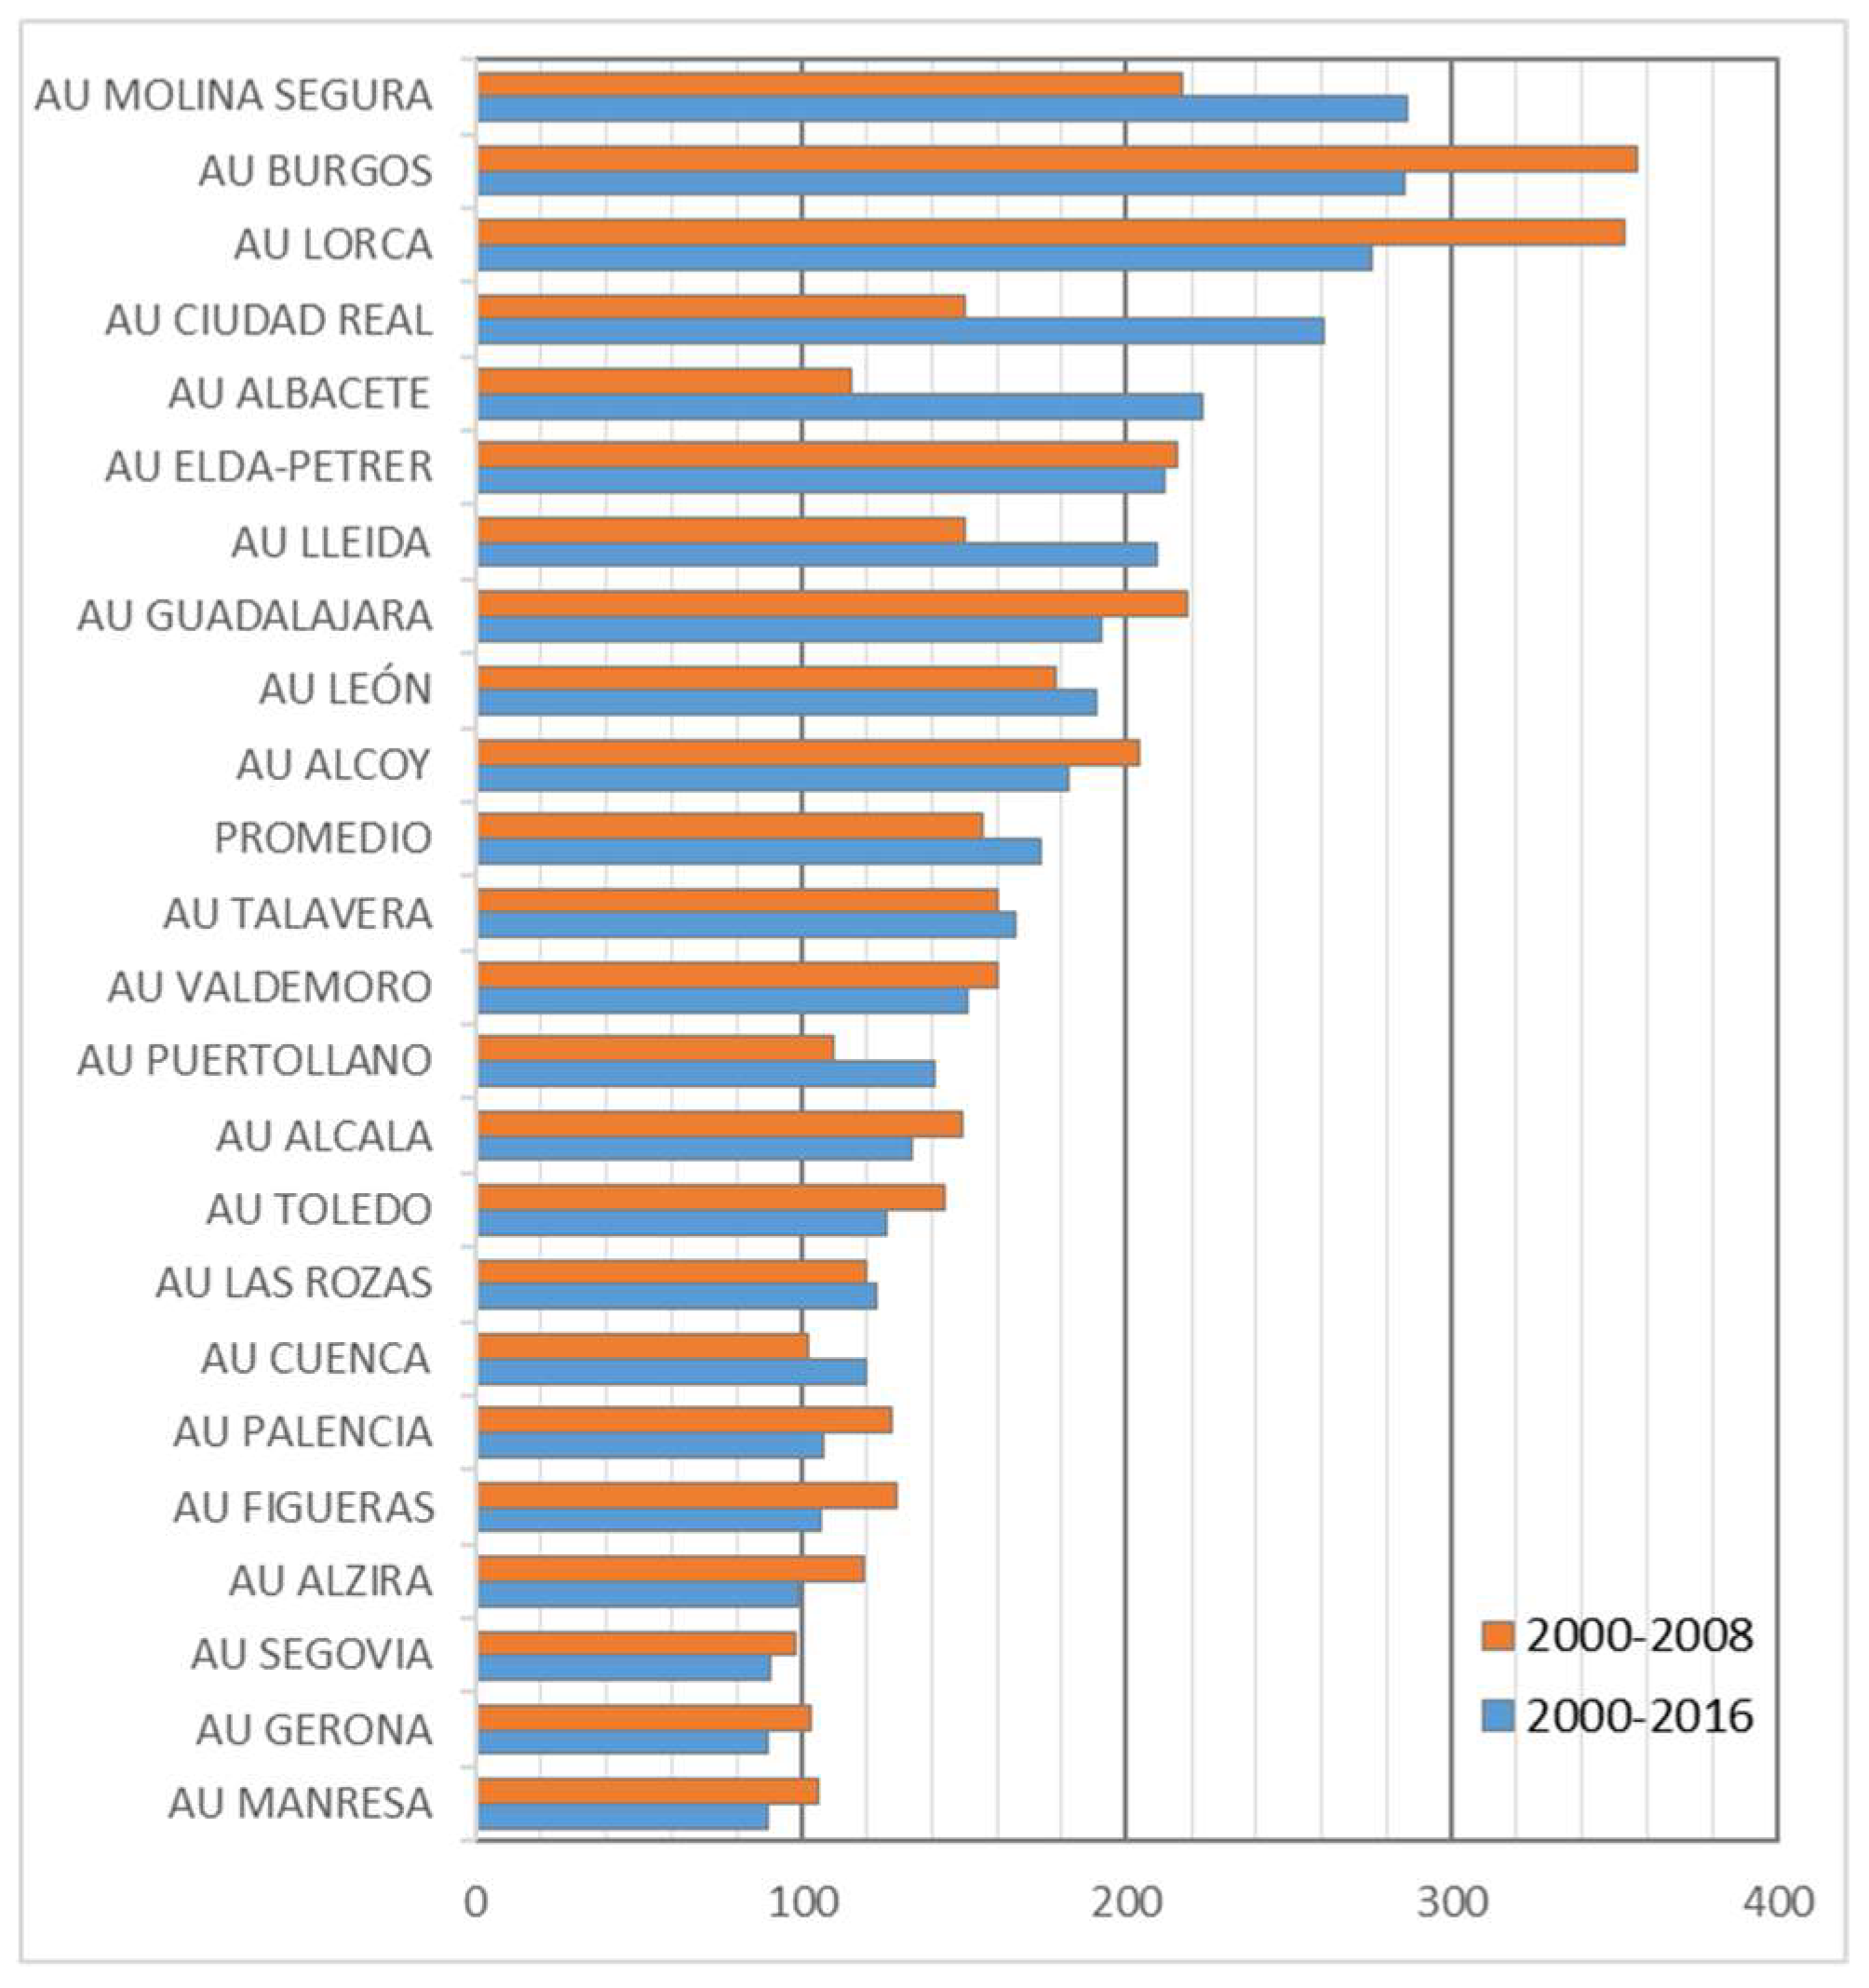
Organising the dynamics of the UAs by quartiles is a situation that differs substantially from the one presented in the demographic behaviour (
Figure 7). In the first category (first quartile), the cases of Molina del Segura (286%), Burgos (285%), Lorca (275%), Ciudad Real (269%), and Albacete (223%) have been included. If you set a comparison with the demographic behaviour, none of them are included among those that have left major variation in population rates. In the second category (second quartile), the cases of Elda-Petrer, Lleida, Guadalajara, León, Alcoy, and Talavera de la Reina have been included. These have growth rates ranging from 211% for the first to 165% in Talavera de la Reina. In this case, Valdemoro appears in the medium position. The third category includes the urban areas of Puertollano, Alcalá, Toledo, Las Rozas, Cuenca, and Palencia, with rates of variation ranging from 141% for the growth in first case to 106% in the last. The fourth category is the least dynamic example; it includes the cases of Figueras, Gerona, Segovia, Alzira, and Manresa, with variation rates between 105% and the first negative changes in the other four, which reached a minimum of 89.4% in the case of Manresa.
4.3. Variations in Urbanised Areas
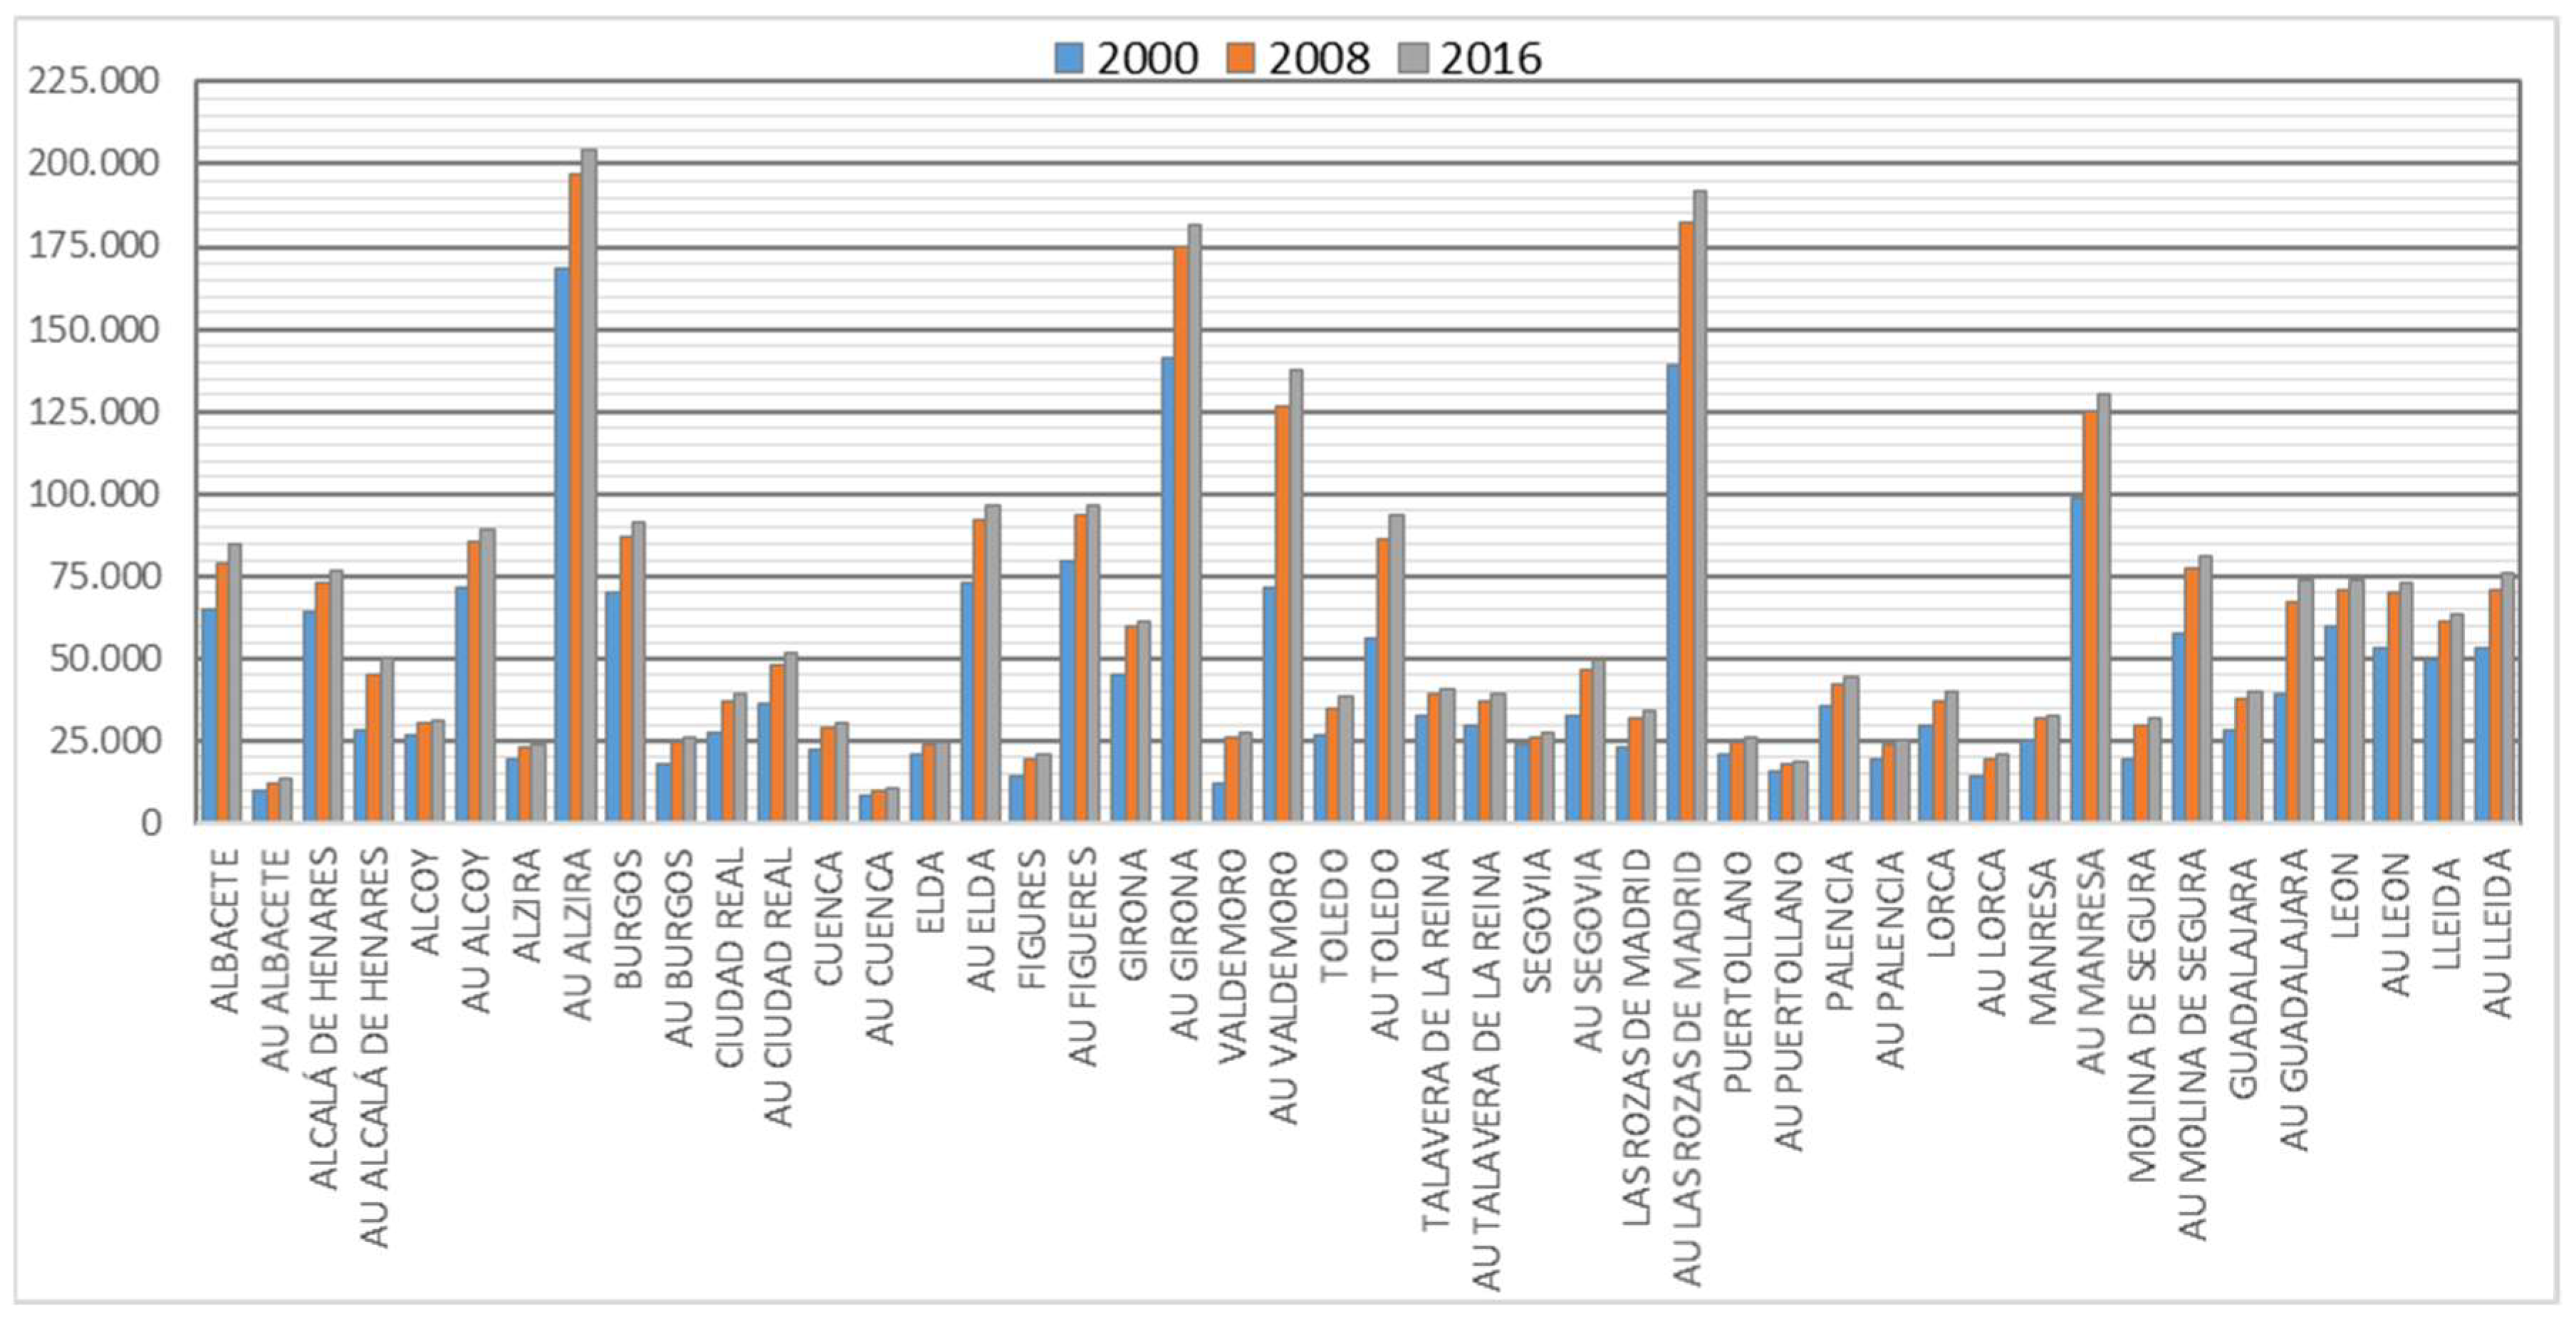
For the built-up area, there are also distinct territorial and temporal realities. From a spatial point of view, the most relevant absolute values appear in the UAs of Las Rozas, Gerona (above 8000 hectares); Valdemoro, Manresa, Alzira, or Toledo (over 4000 hectares). On the other hand, it is the largest area in almost all of the urban areas by comparison with the central cities. Only in three cases (Albacete, Cuenca, and Lorca) do the cities have a greater size than the crowns in the built areas (it must be taken into account that these municipalities have large surface areas) (
Figure 8).
In terms of the timescale of operated changes, the significant thing to notice is that in practically all of them, a much more dynamic behaviour between 2000–08 (Lorca, Guadalajara, Molina, and Albacete) was produced compared to what happened between 2009–2016, where at a general level, substantially lower dynamics are observed, and nuances have appeared because of improved behaviour over the first period analysed (Talavera, Royal Toledo, Lleida, or Puertollano) in the UAs.
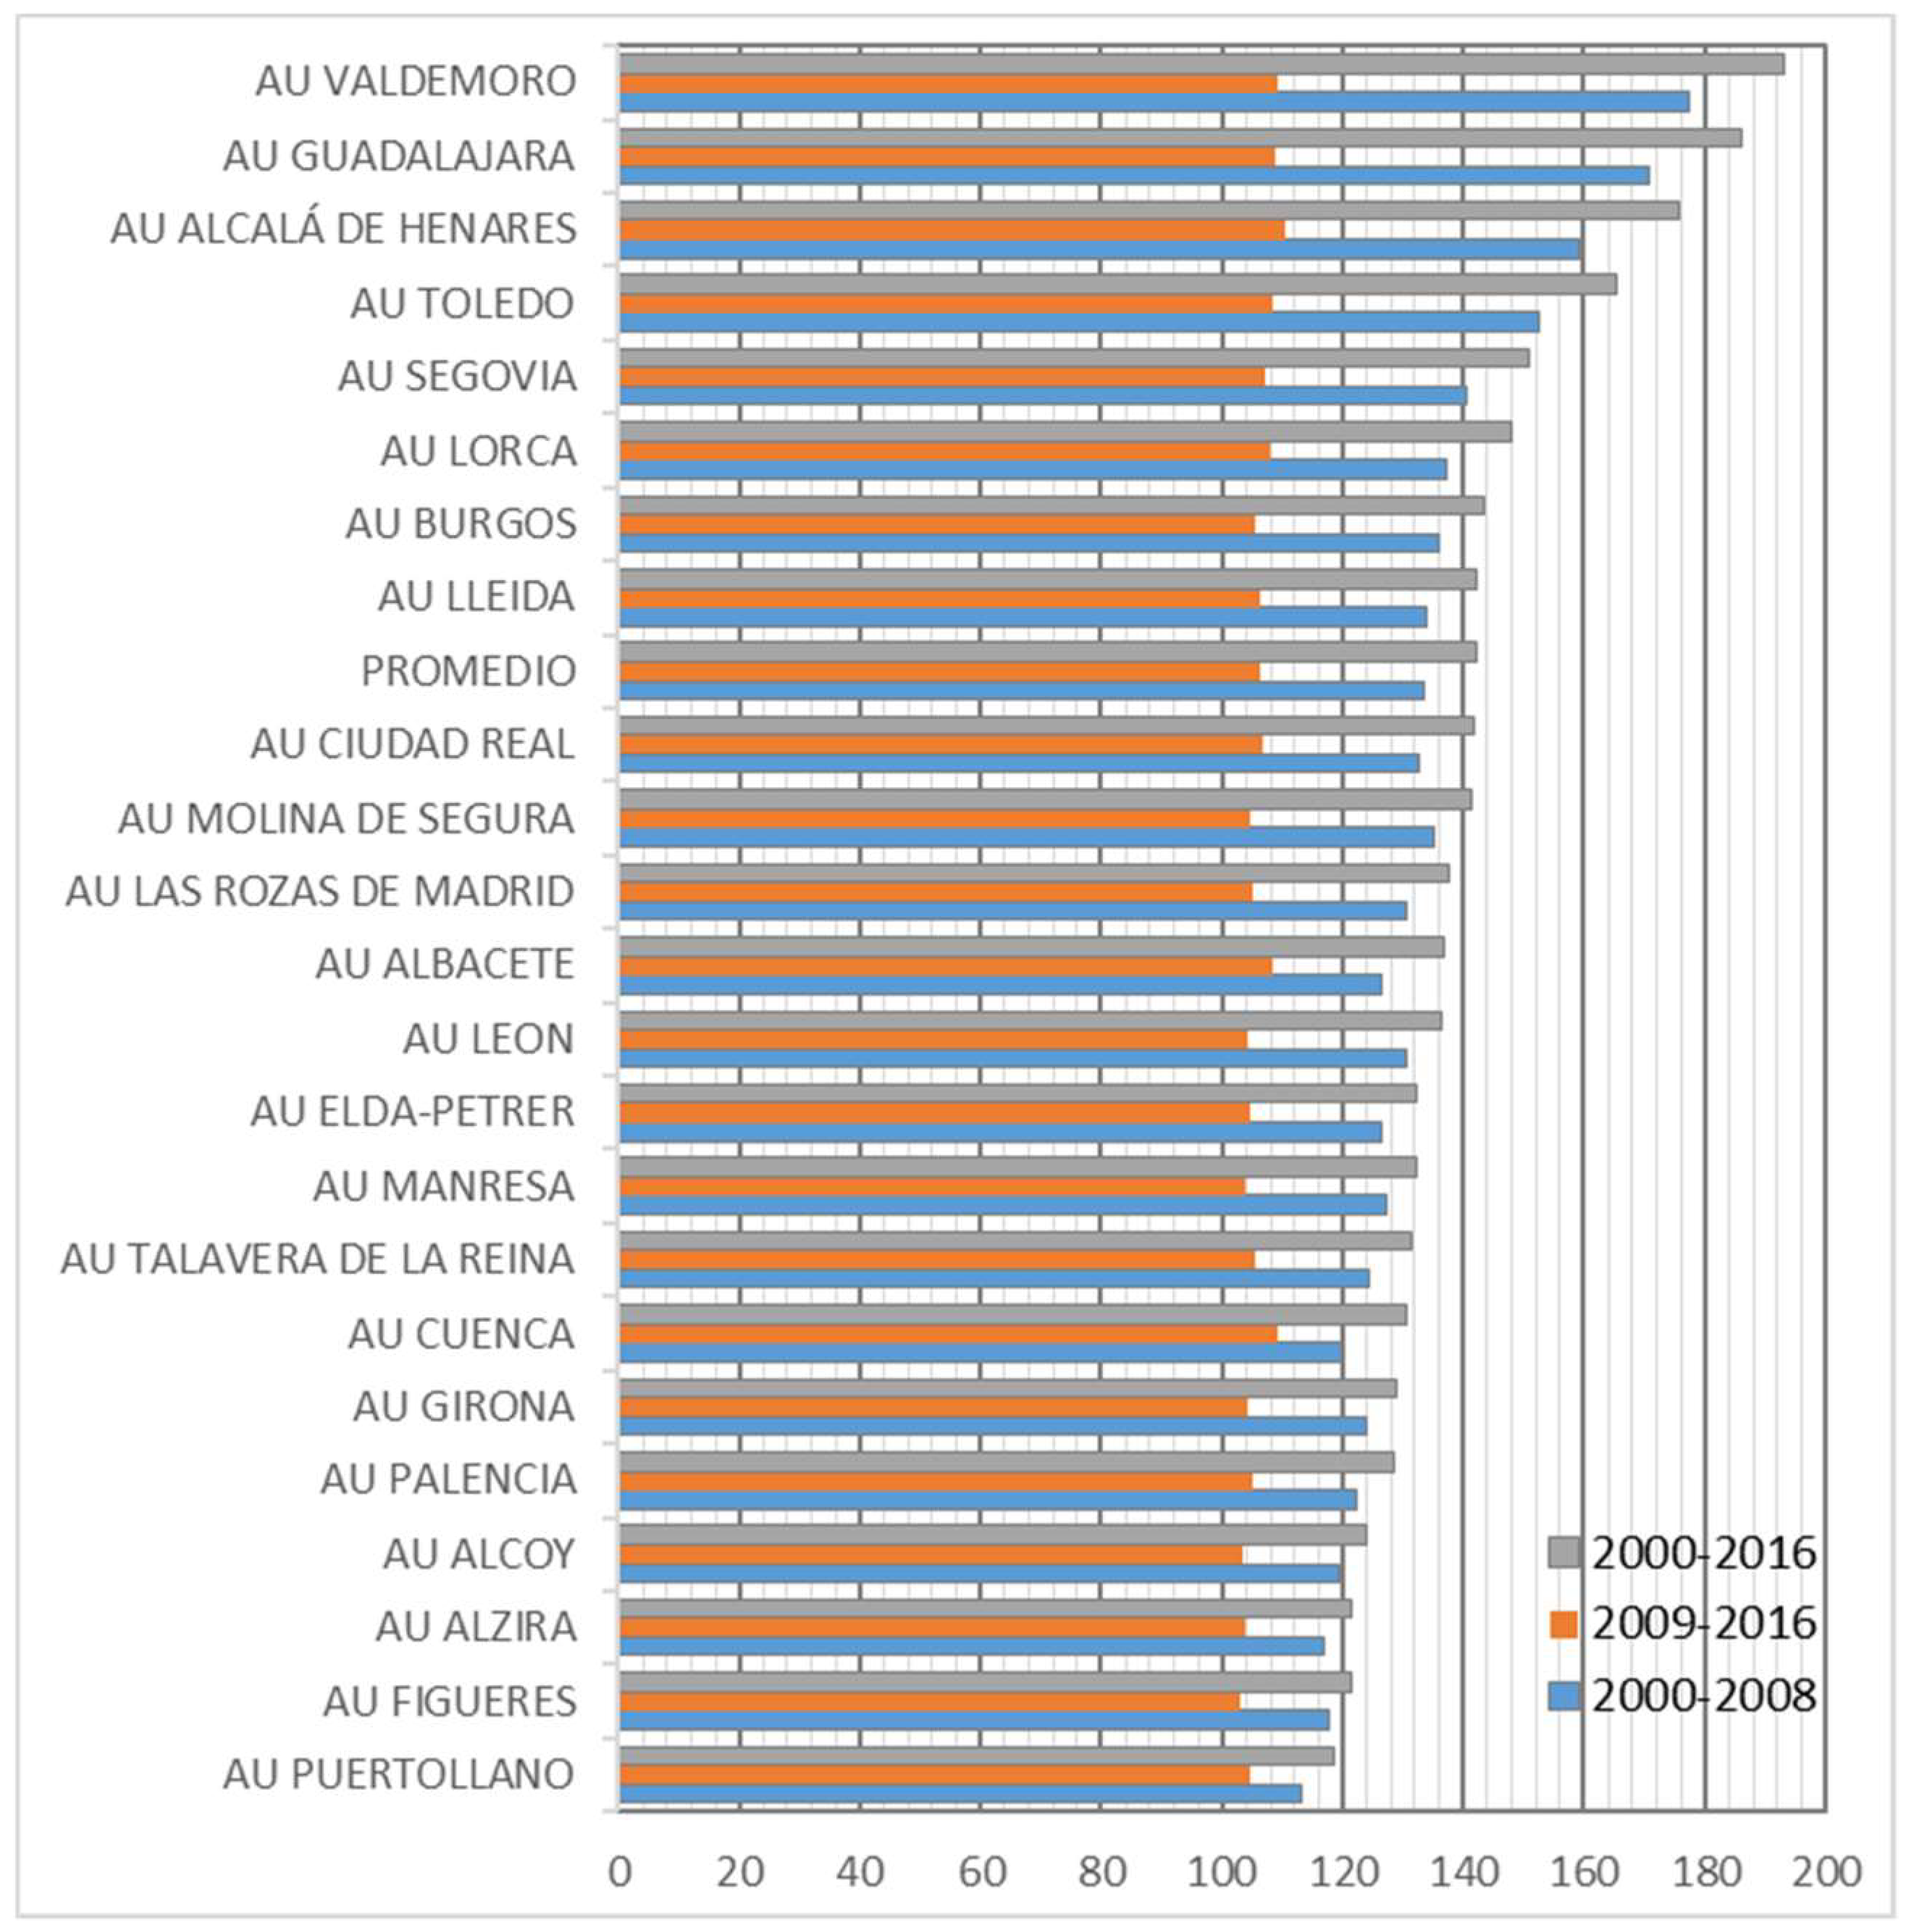
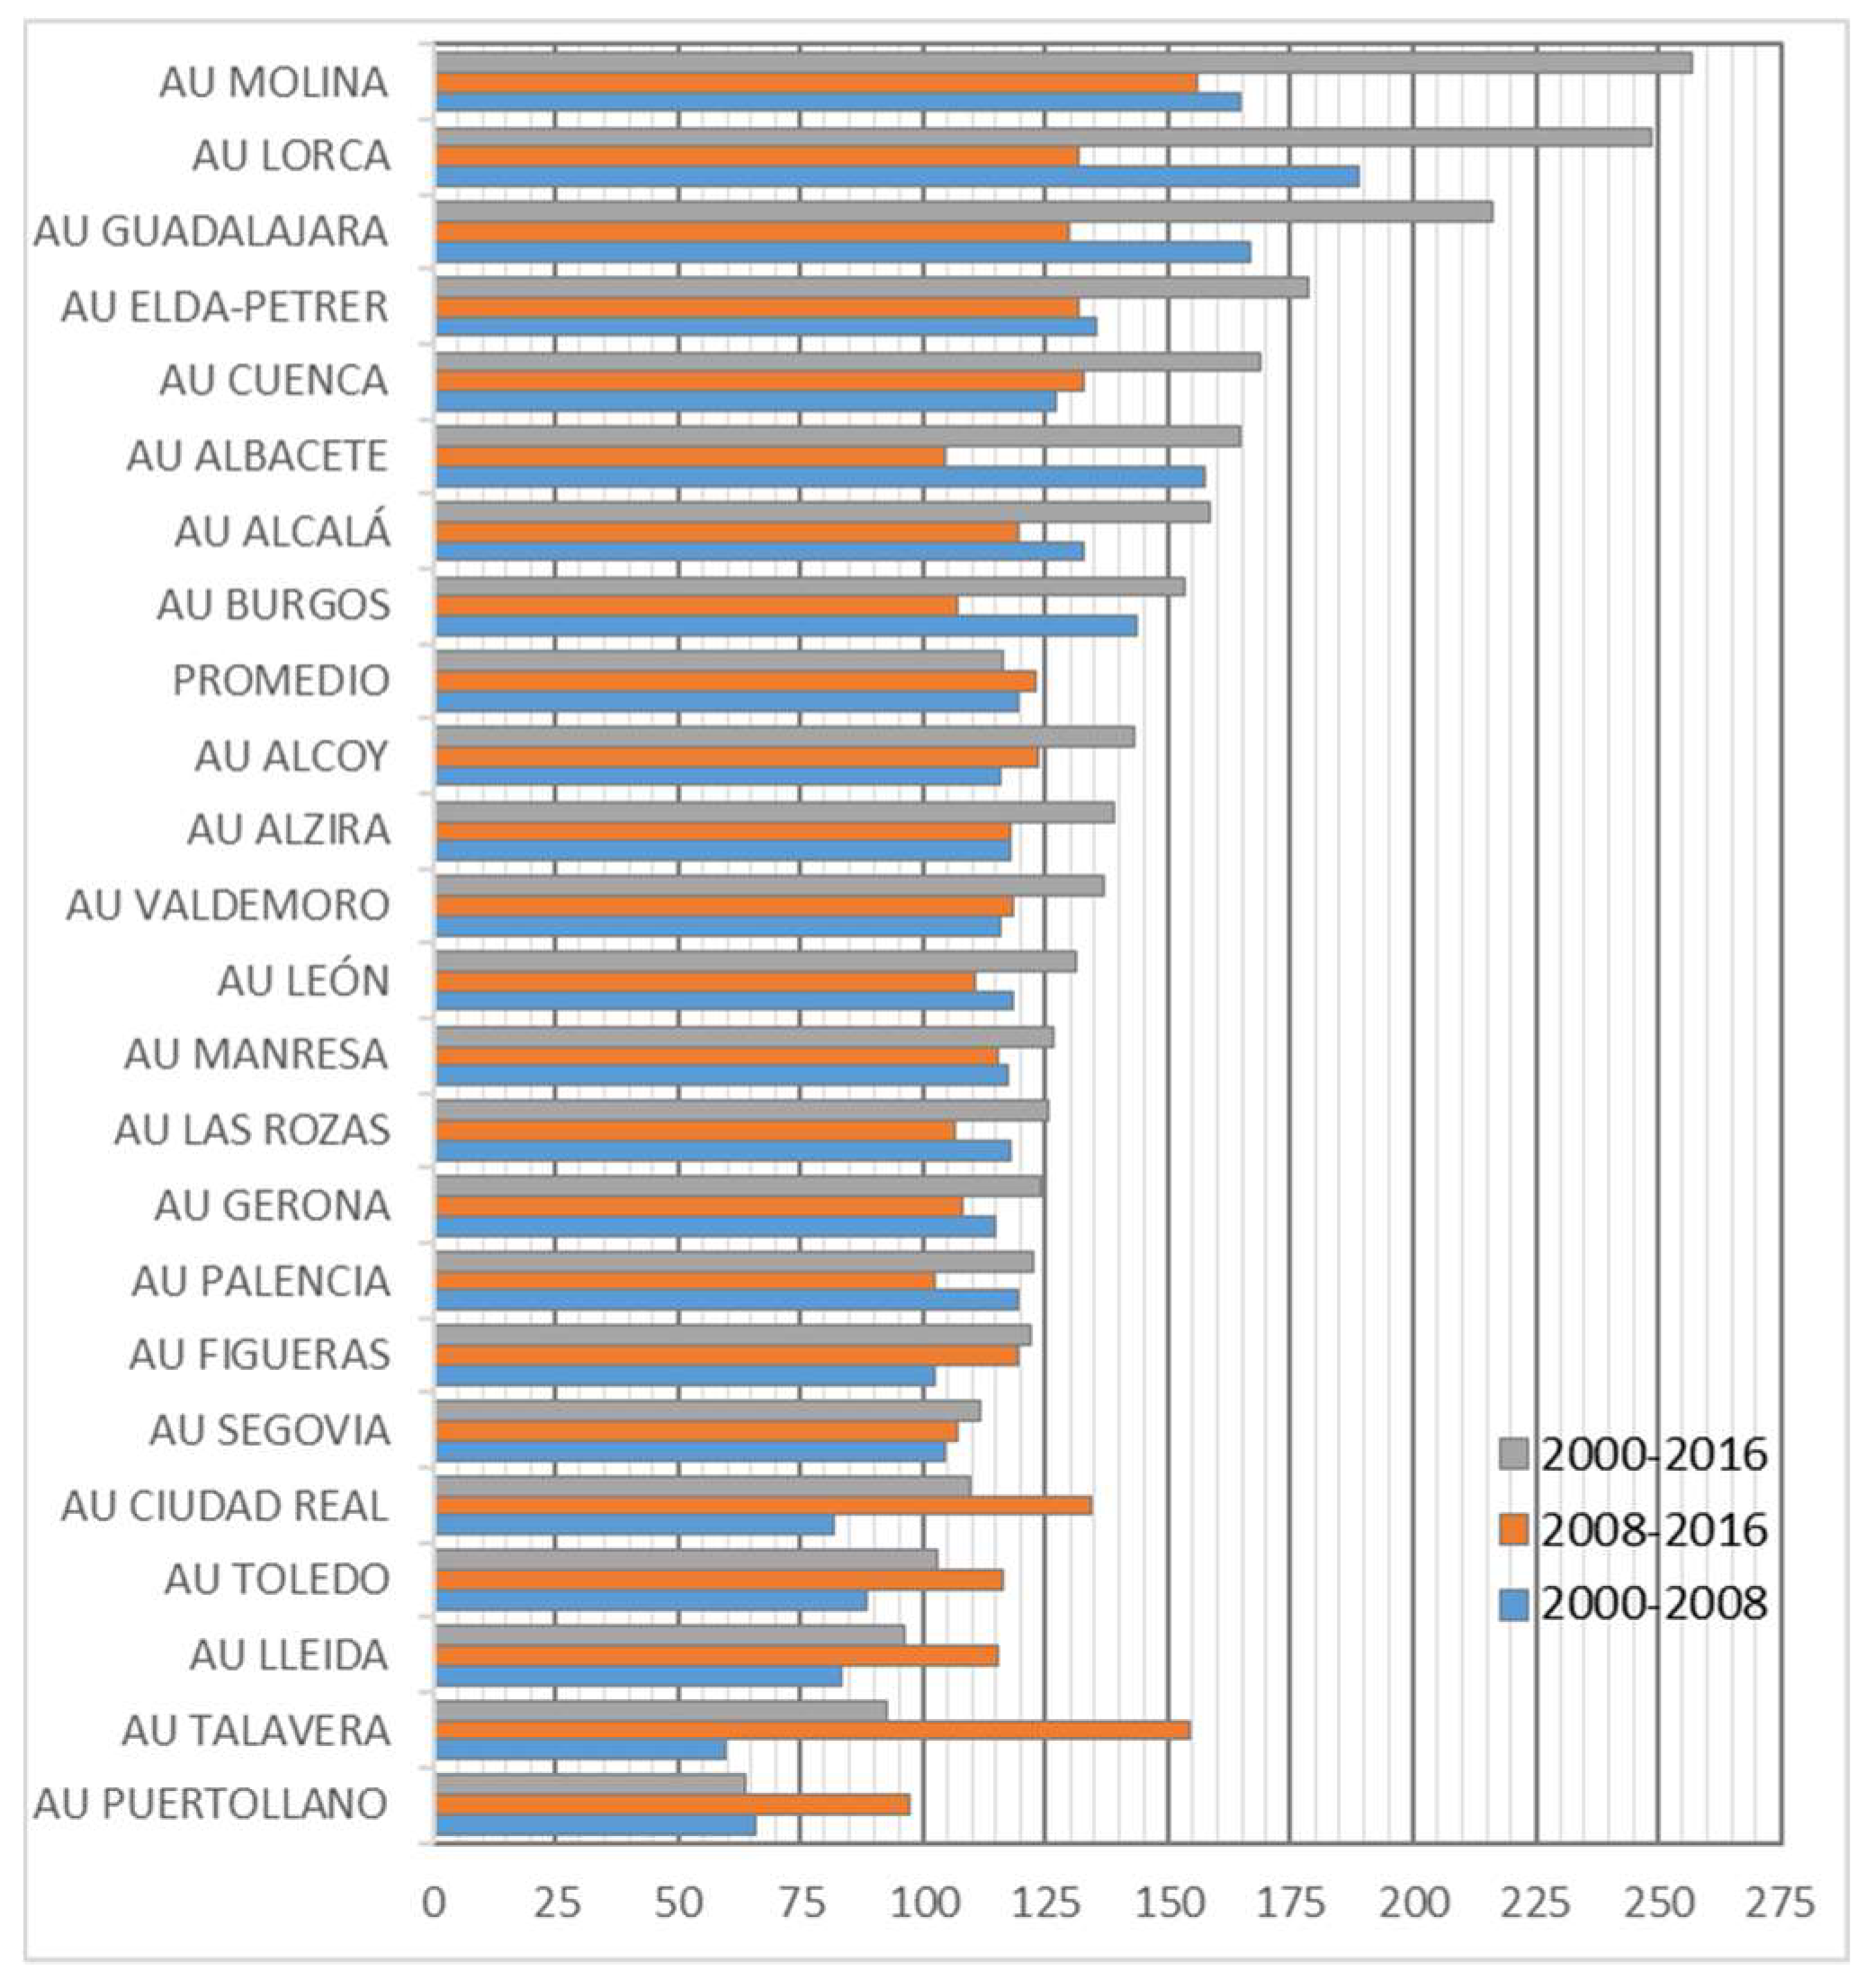
When ordering urban areas by quartiles, different situations also appeared to those previously considered (
Figure 9). In Category I (quartile I), we can see growths of 168–257% between 2000–2016, and hence we include Molina del Segura, Lorca, Guadalajara, Elda-Petrer, and Cuenca in this category. In Category II (second quartile), with rates ranging between 136–164%, we have Albacete, Alcalá, Burgos, Alcoy, Alzira, and Valdemoro. In Category III (quartile III), growth rates were between 131–111%, including Leon (medium-sized), Manresa, Las Rozas, Gerona, Palencia, Figueras, and Segovia. Finally, the last group (with growth rates ranging between 134–97%) included Ciudad Real, Toledo, Lleida, Talavera, and Puertollano.
4.4. Evolution in the Number of Housing
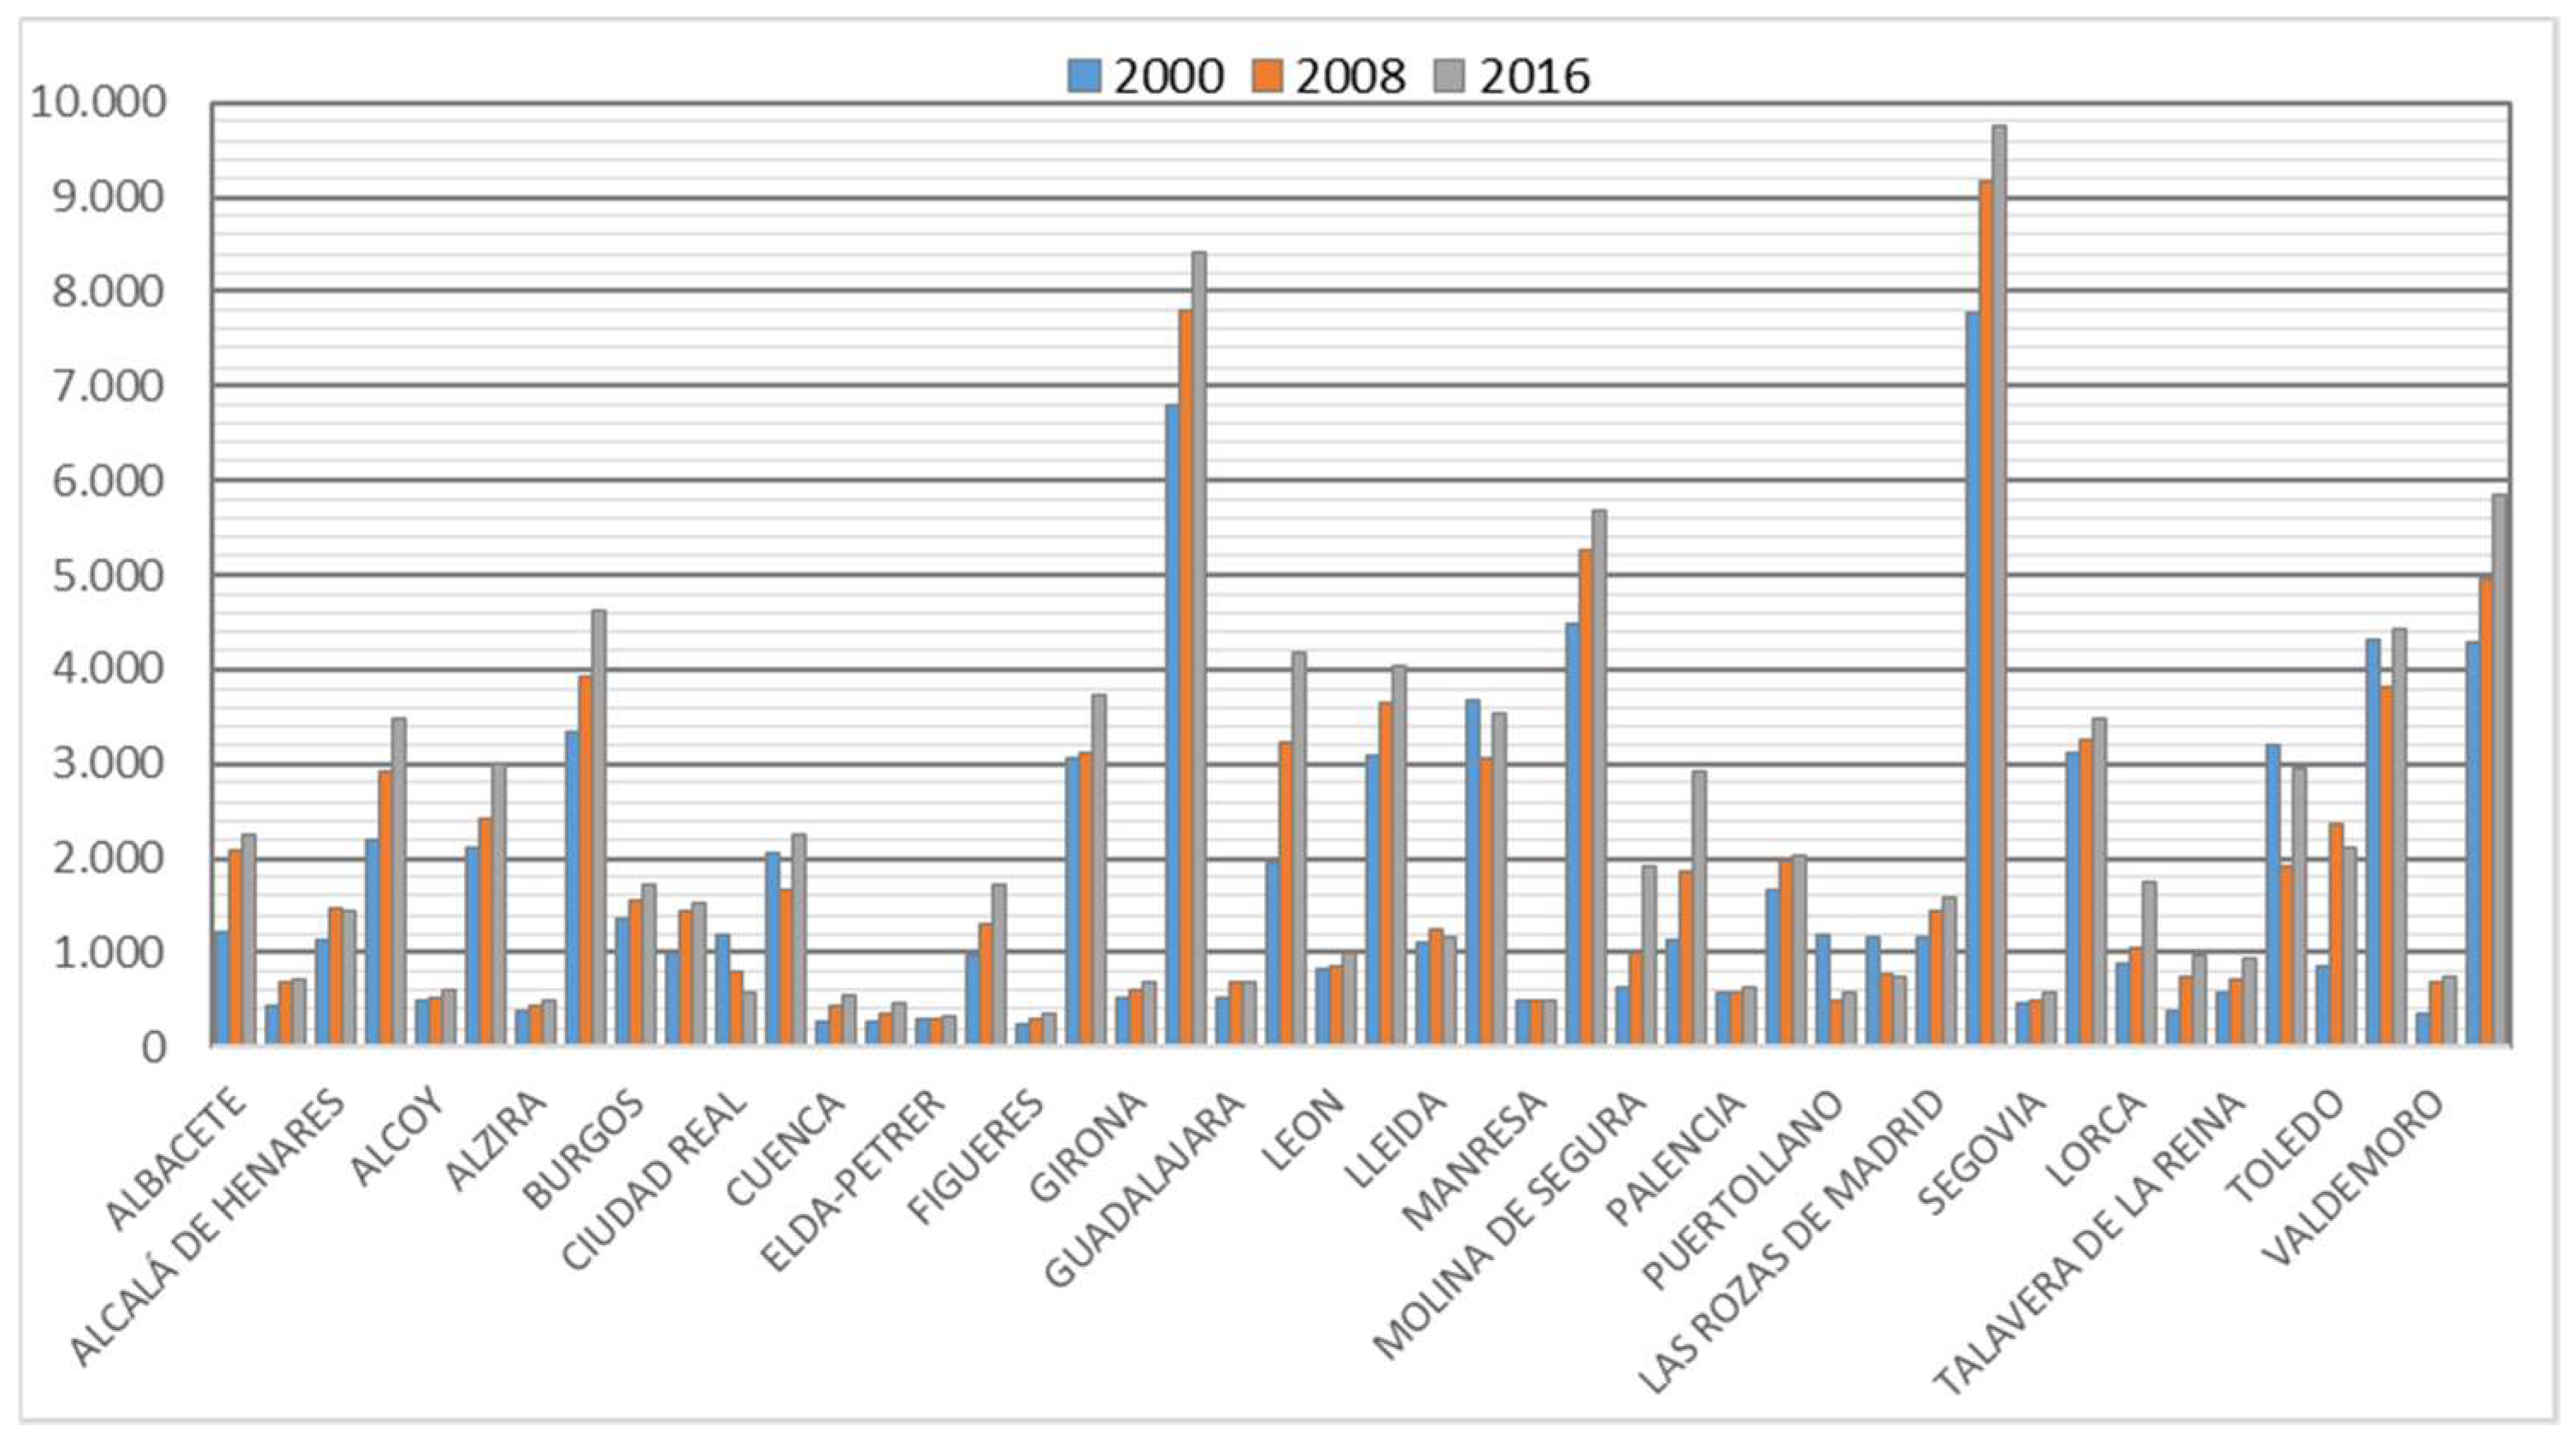
The number of housing presents diverse situations between the cities and respective metropolitan areas. The urban areas of 23 cases, except in seven (Albacete, Alcalá, Burgos, Cuenca, Puertollano, Palencia, and Lorca), have more homes than their central cities. They had greater relevance in the UAs of Alzira, Las Rozas, Gerona, Valdemoro, and Manresa (
Figure 10).
From an evolutionary point of view, it is clear how the widespread behaviour has been intense between 2000–2008; in most of the cases, the urban areas have remained, with superior trends over the city (
Figure 11).
Especially striking are the dynamics of the UAs of Valdemoro, Guadalajara, Alcalá de Henares, Toledo, or Segovia. These five urban areas appear in the first category (first quartile), where there has been a growth of more than 50% within those years. The second group (second quartile) includes Lorca, Burgos, Lleida, Ciudad Real, Molina, and Las Rozas (between 137–150% increase). Within the third category, we have Albacete, León, Elda-Petrer, Manresa, Talavera de la Reina, and Cuenca (with percentages of increase ranging from 136–148%). Finally, in the last group, we have those with less than 128% dynamics. The really remarkable thing here is that there was particularly intense behaviour between 2000–2008; in contrast, the dynamics were very contained between 2009–2016.
Possibly the best illustration of the process is the relationship, in absolute values, between the variations of population and housing. In some cases, this highlights the situation of housing deficit (when there is an increase of more than two inhabitants per built housing), as it happens in the cities located in the surroundings of Madrid, Barcelona, or some especially dynamic nuclei in which the trend has not slowed since 2000. Compared to these cases, we can see how the proportion decreases substantially in most of the analysed urban areas such as in León, Palencia, Segovia, Toledo, Figueras, Elda, Cuenca, Ciudad Real, Burgos, Alzira, Alcoy, and Albacete (where the ratio is one housing per capita). In these cases, it is reasonable to think that there has been a considerable stock of housing, inherited from the expansive cycle, that has not been absorbed by the market or that has been built under some unrealistic expectations of population growth and real need for housing (
Figure 12).
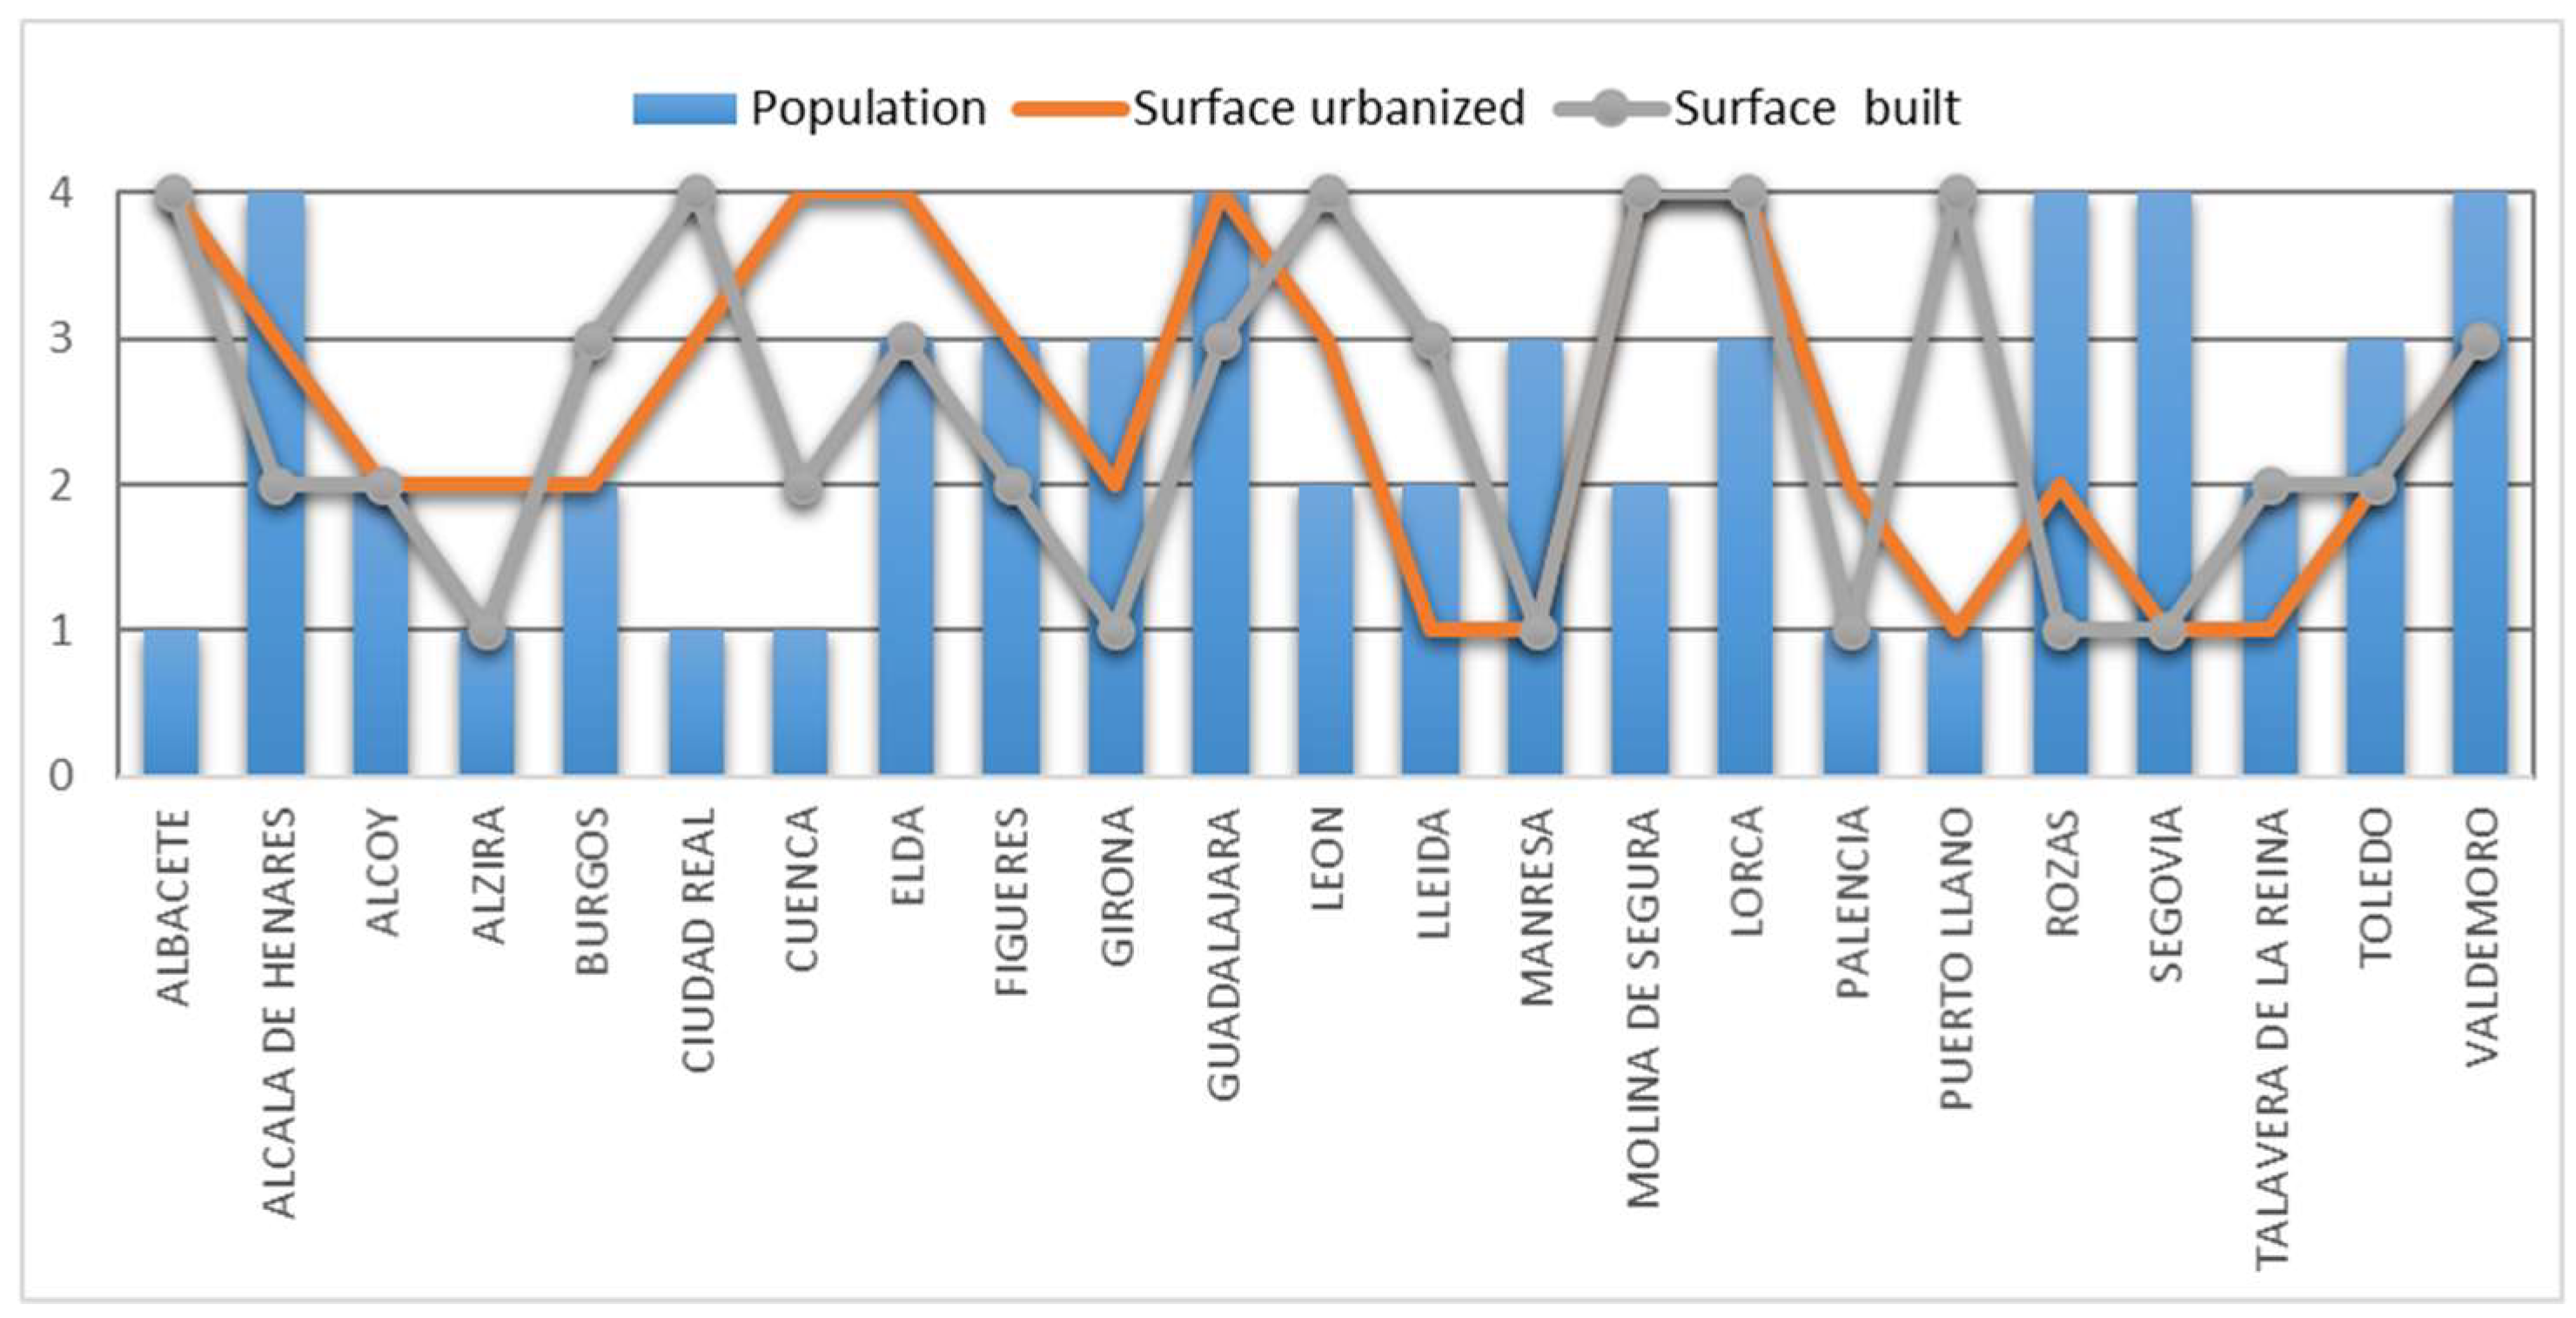
5. Classification of Urban Areas Based on Its Dynamics
Grouping the behaviour of the UAs depending on the quartiles (to produce the grouping, values between one and four have been assigned to the
Figure 13), six categories have been established (
Table 1):
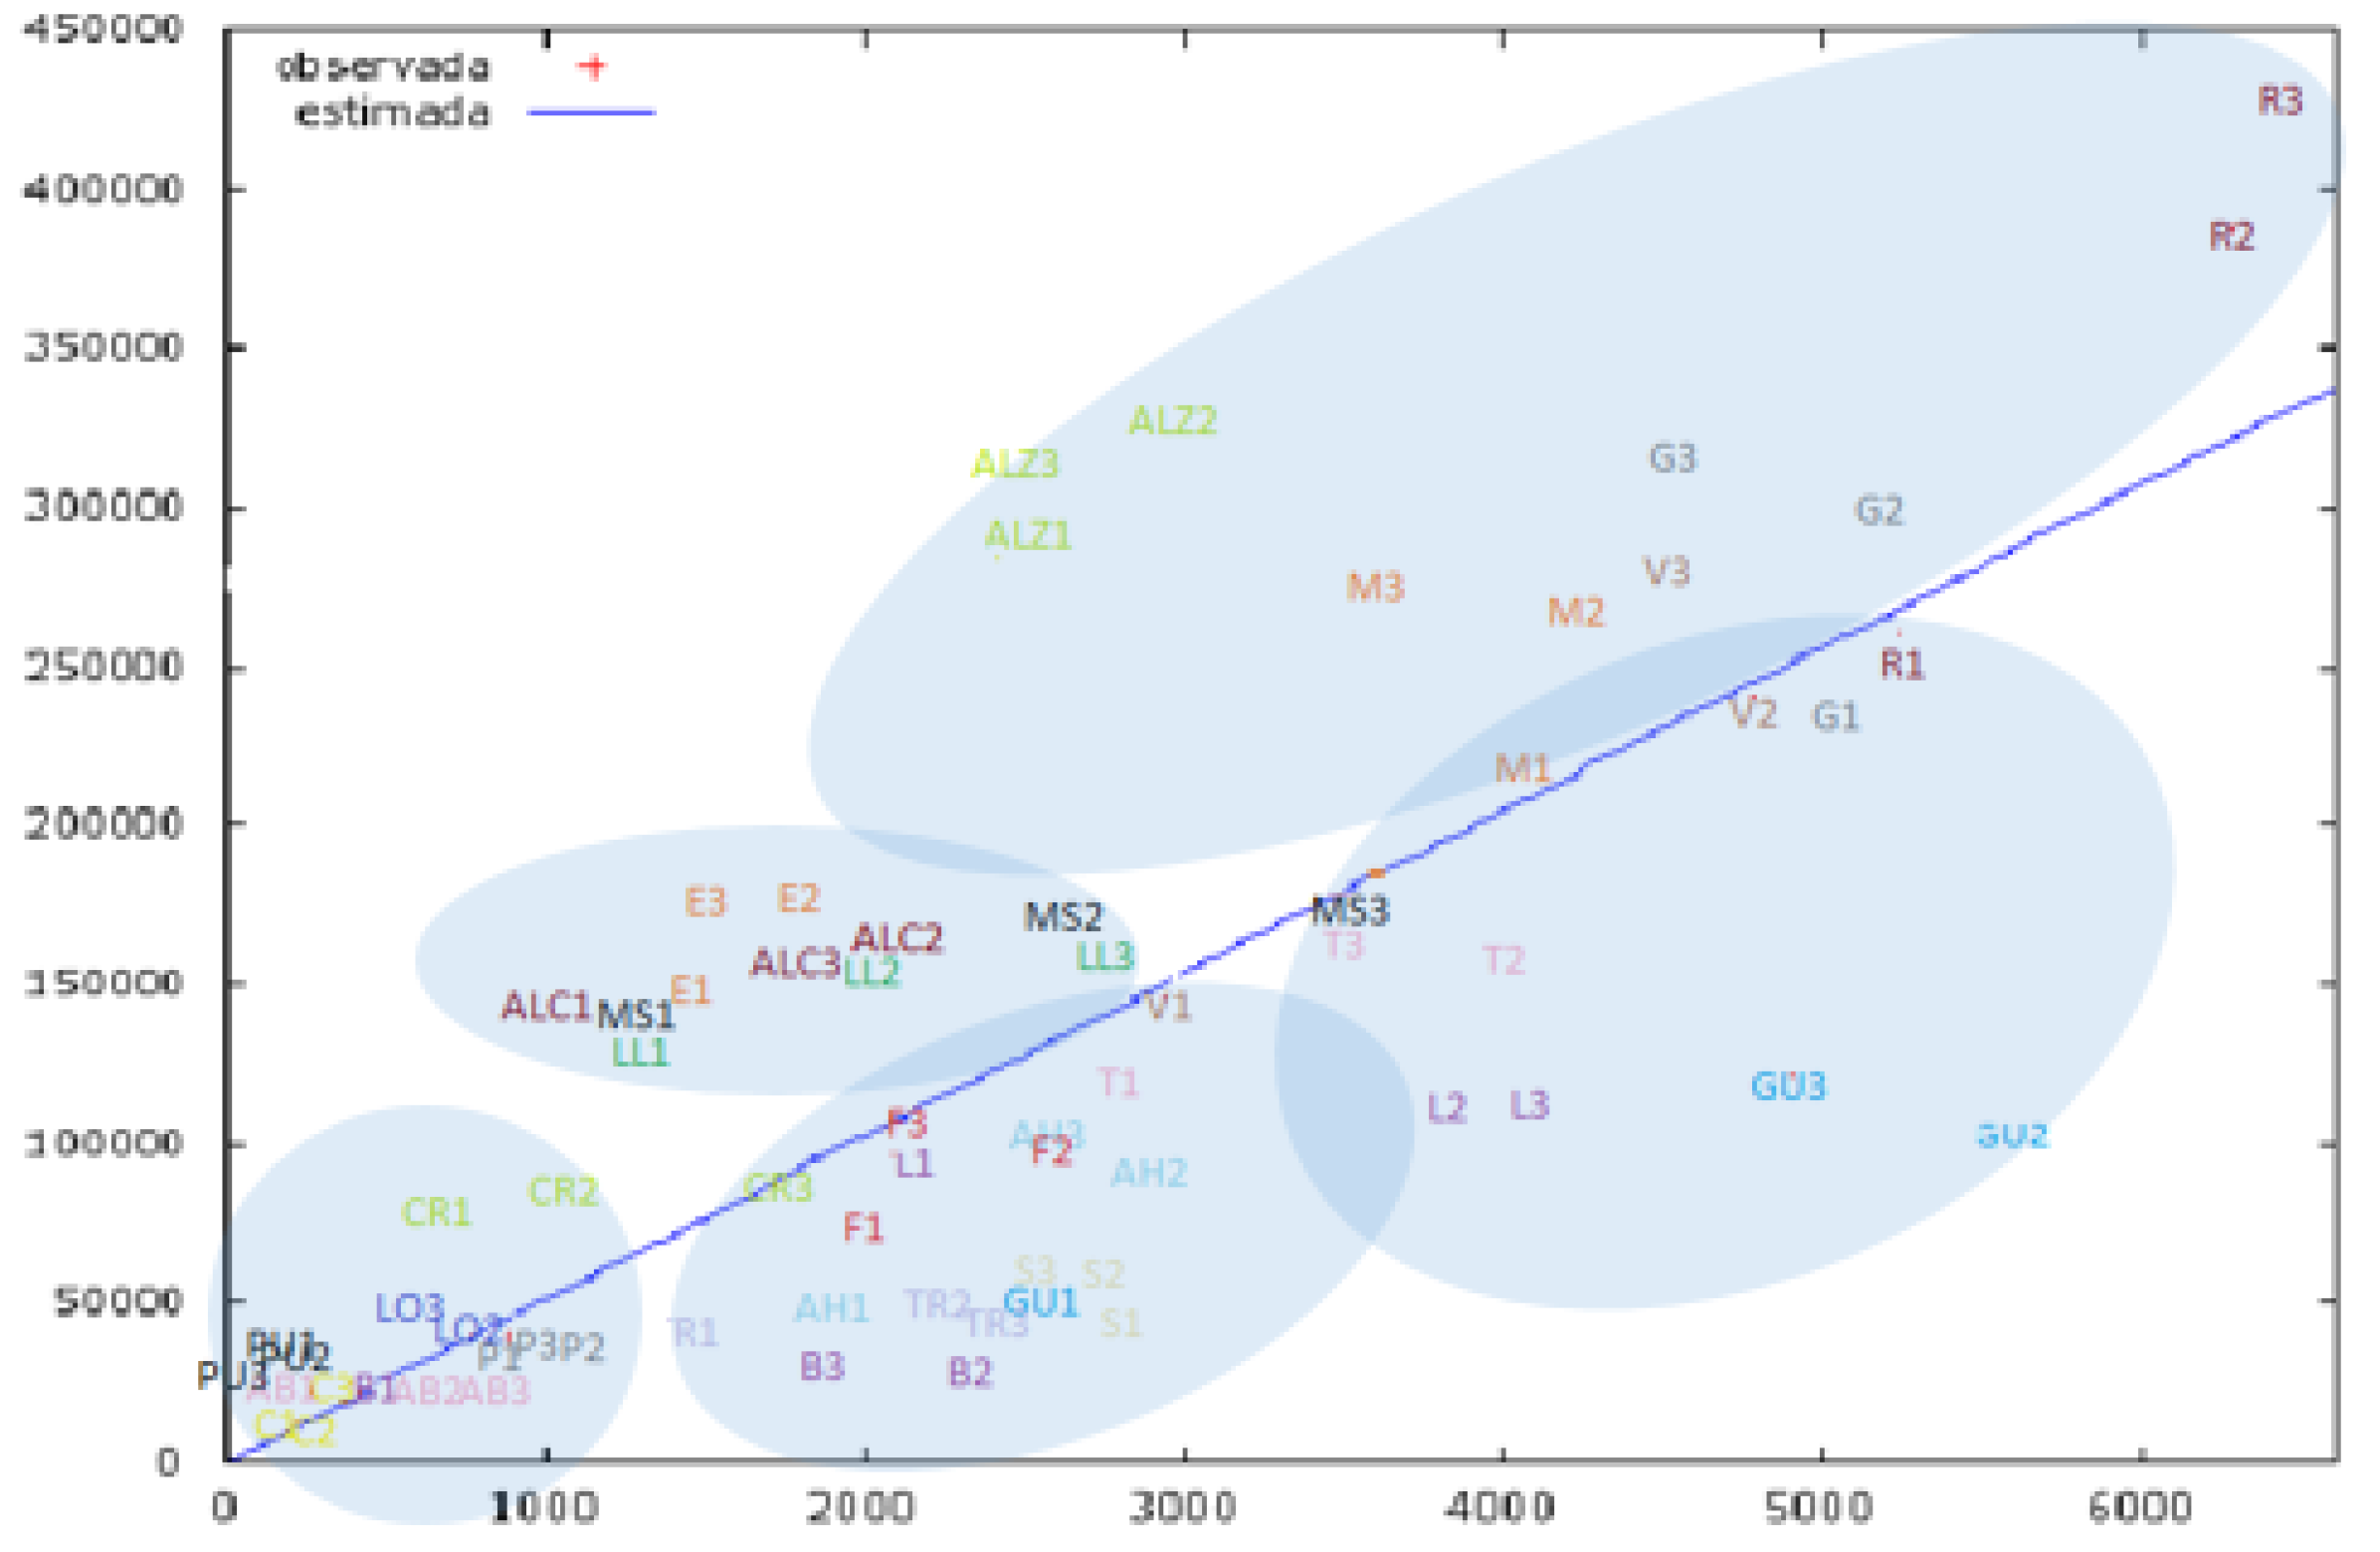
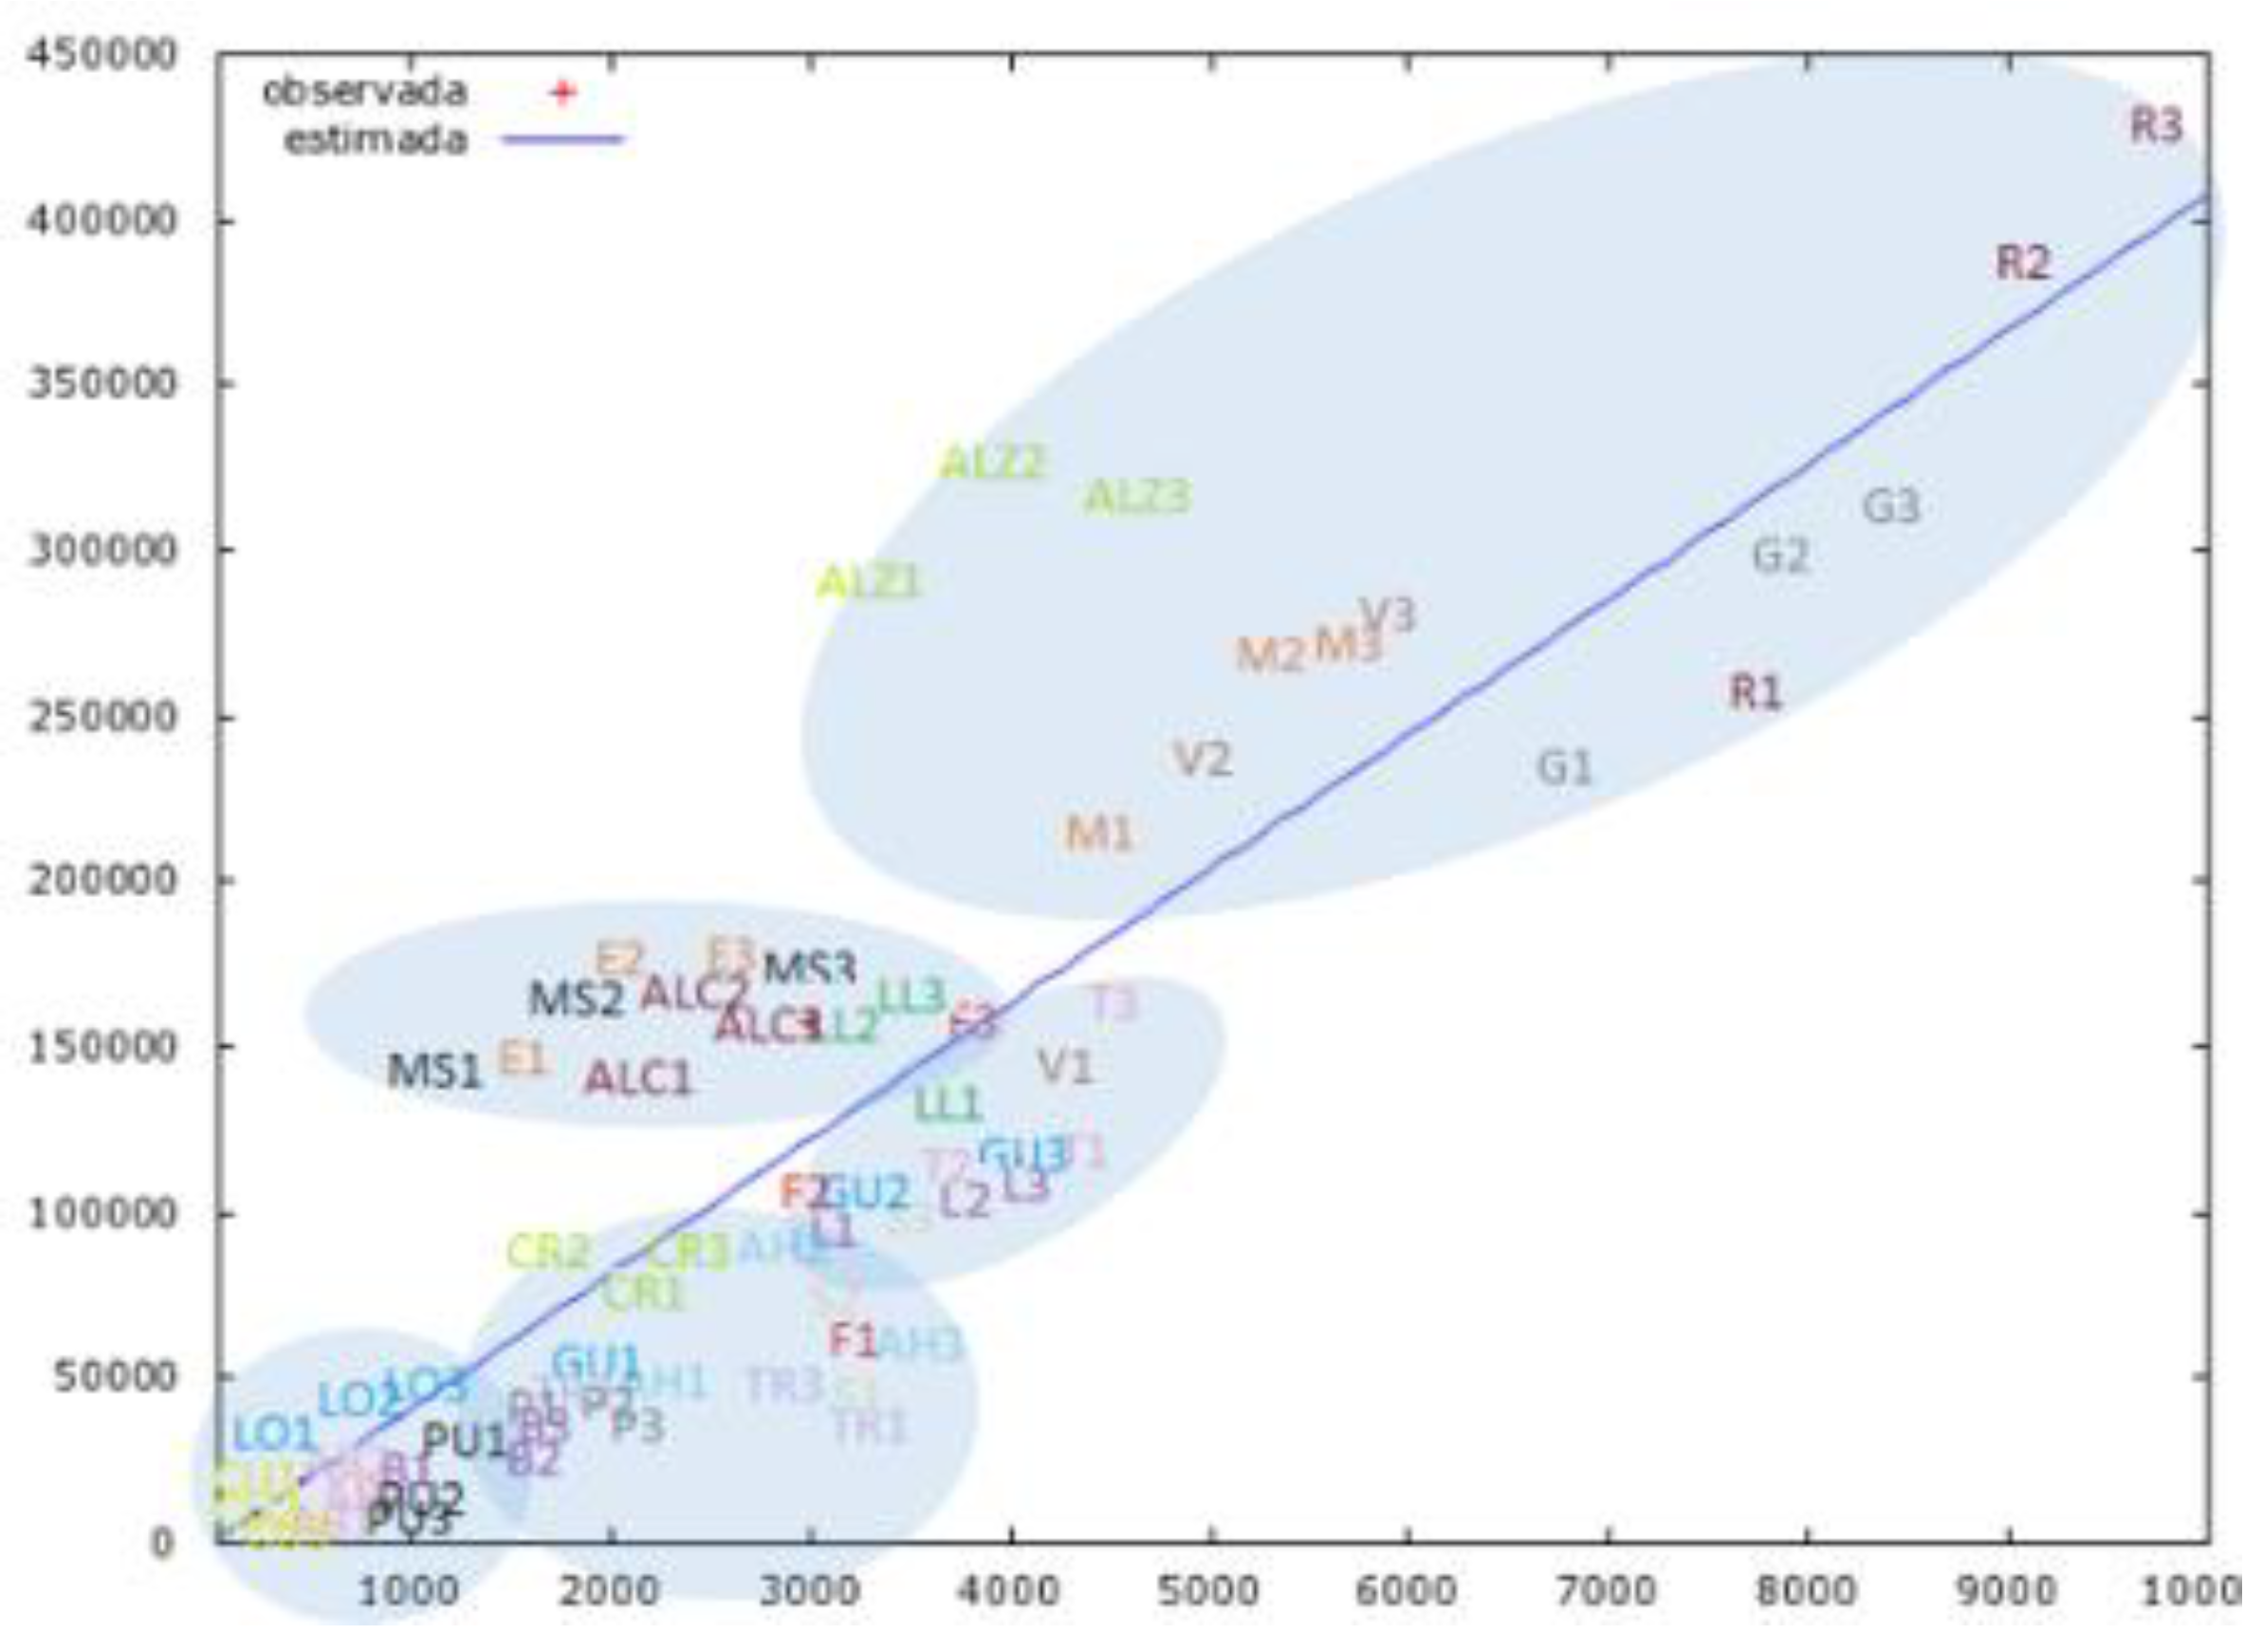
To establish the relationship (using regression) between the population and surface urbanised on the one hand, and the population and surface built on the other, the situation in which each urban area in relation to the rest is shown, as well as the changes that have operated over the time considered. The figures supplied (
Figure 14 and
Figure 15) show how widespread an increase there has been in the three criteria (population, urban land, and built-up area), but with unequal intensity.
If we compare the population and built-up area, the regression from the values used leaves on balance an increase in all the crowns, which has been especially pointed between 2000–2008. This evolution is perceived especially in Las Rozas, Guadalajara, Valdemoro, Toledo, or León. It can also be seen that between 2008–2016 (a temporary cycle marked by crisis), there was a considerable brake on construction and new building sites. Despite this, there have been changes at lower intensity, although in some cases, these have been barely perceptible.
The graphic showing the ratio of site surface and population allows us to identify five categories of urban areas: (1) Las Rozas, Girona, Manresa, Valdemoro, and Alzira, which are urban areas with a high level of population and site surface; (2) Guadalajara, León, Toledo, and Manresa, which have average population levels, but high site surface; (3) average and moderate population weight areas such as Alcoy, Elda, Lérida, and Molina del Segura; (4) low and moderate population areas such as Figueras, Alcalá de Henares, Ciudad Real, and Burgos; and lastly, (5) cases with low dynamics in both criteria, such as Palencia, Lorca, Puertollano, and Albacete.
If we take into consideration the relationship between population and built-up area (i.e., what has been actually built until 2016), we can see how significant the changes appear. If we apply the same criteria of classification, we would have (1) a group of areas with a high presence of population and built-up areas, consisting of Las Rozas, Manresa, and Alzira; these cases could be added to that of Gerona; (2) areas with an average and low weight of population in housing, including Alcoy, Lerida, Molina del Segura, and Elda; (3) a third category including areas with an average weight in housing areas and low weight in population, as we can see in León, Guadalajara, Toledo, Figueras, or Alcalá de Henares; and finally, we have (4) the areas with a low presence of population and building, such as the cases of Puertollano, Lorca, Burgos, Palencia, and Albacete.
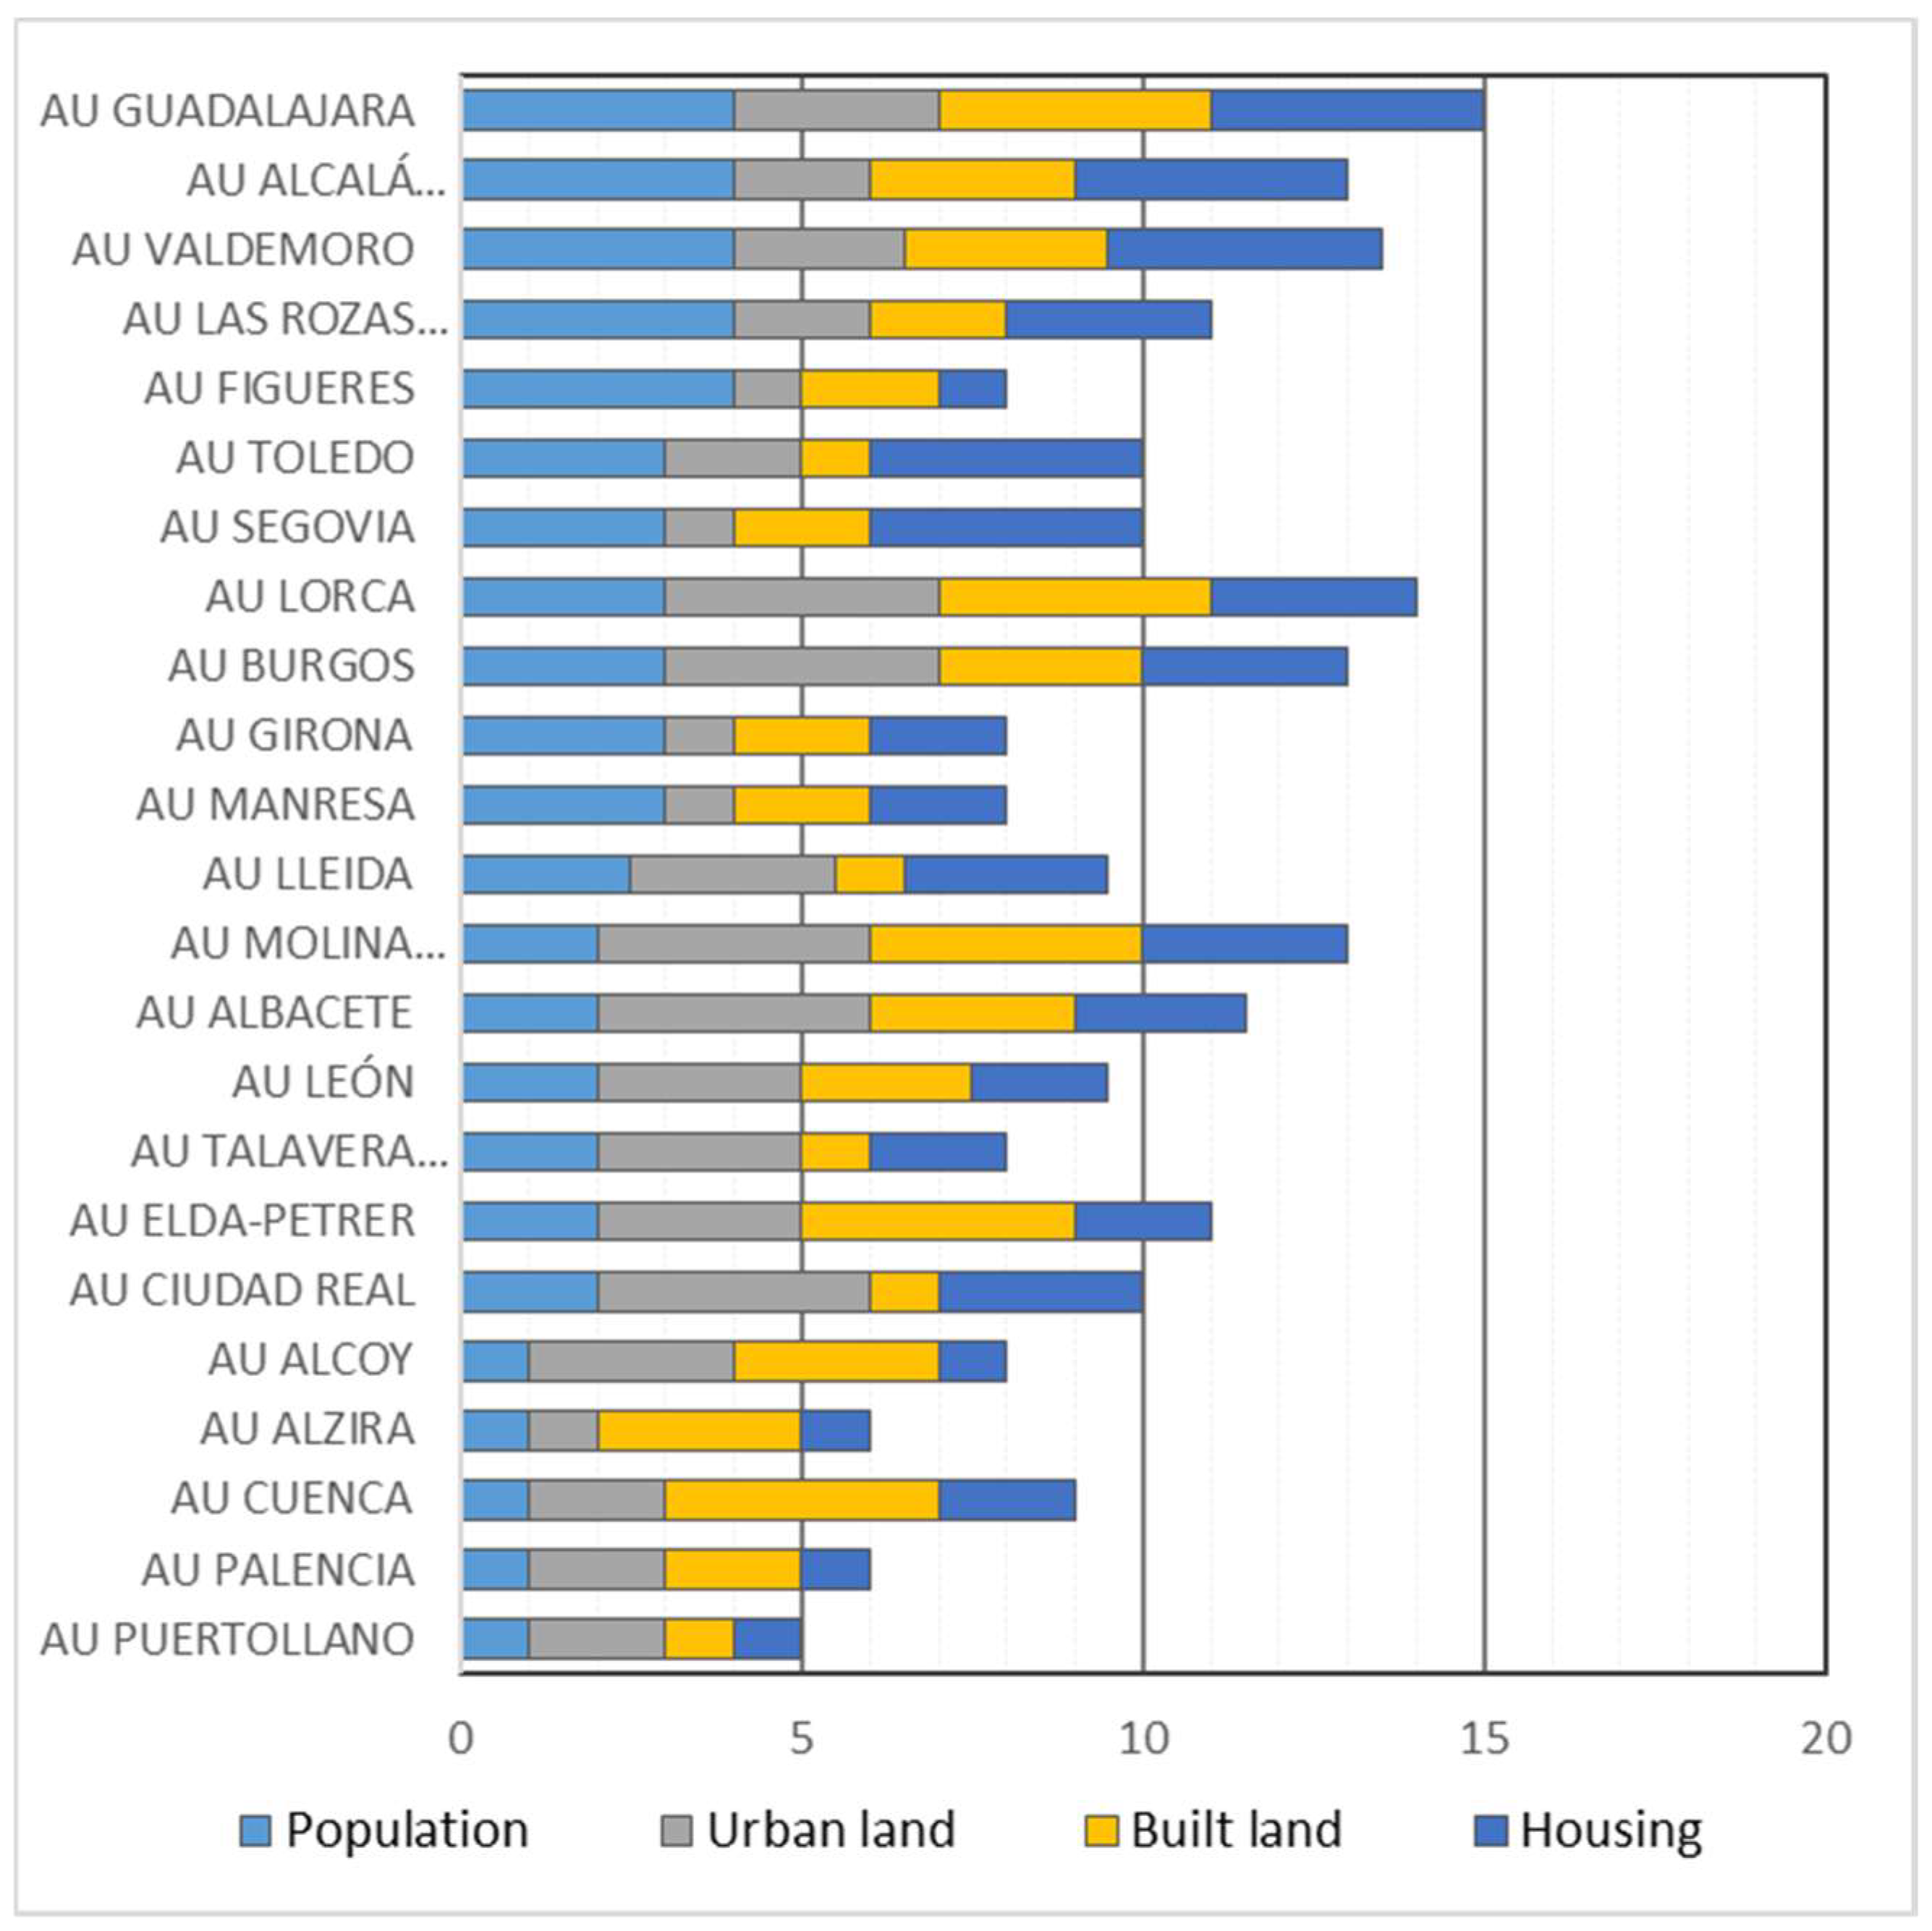
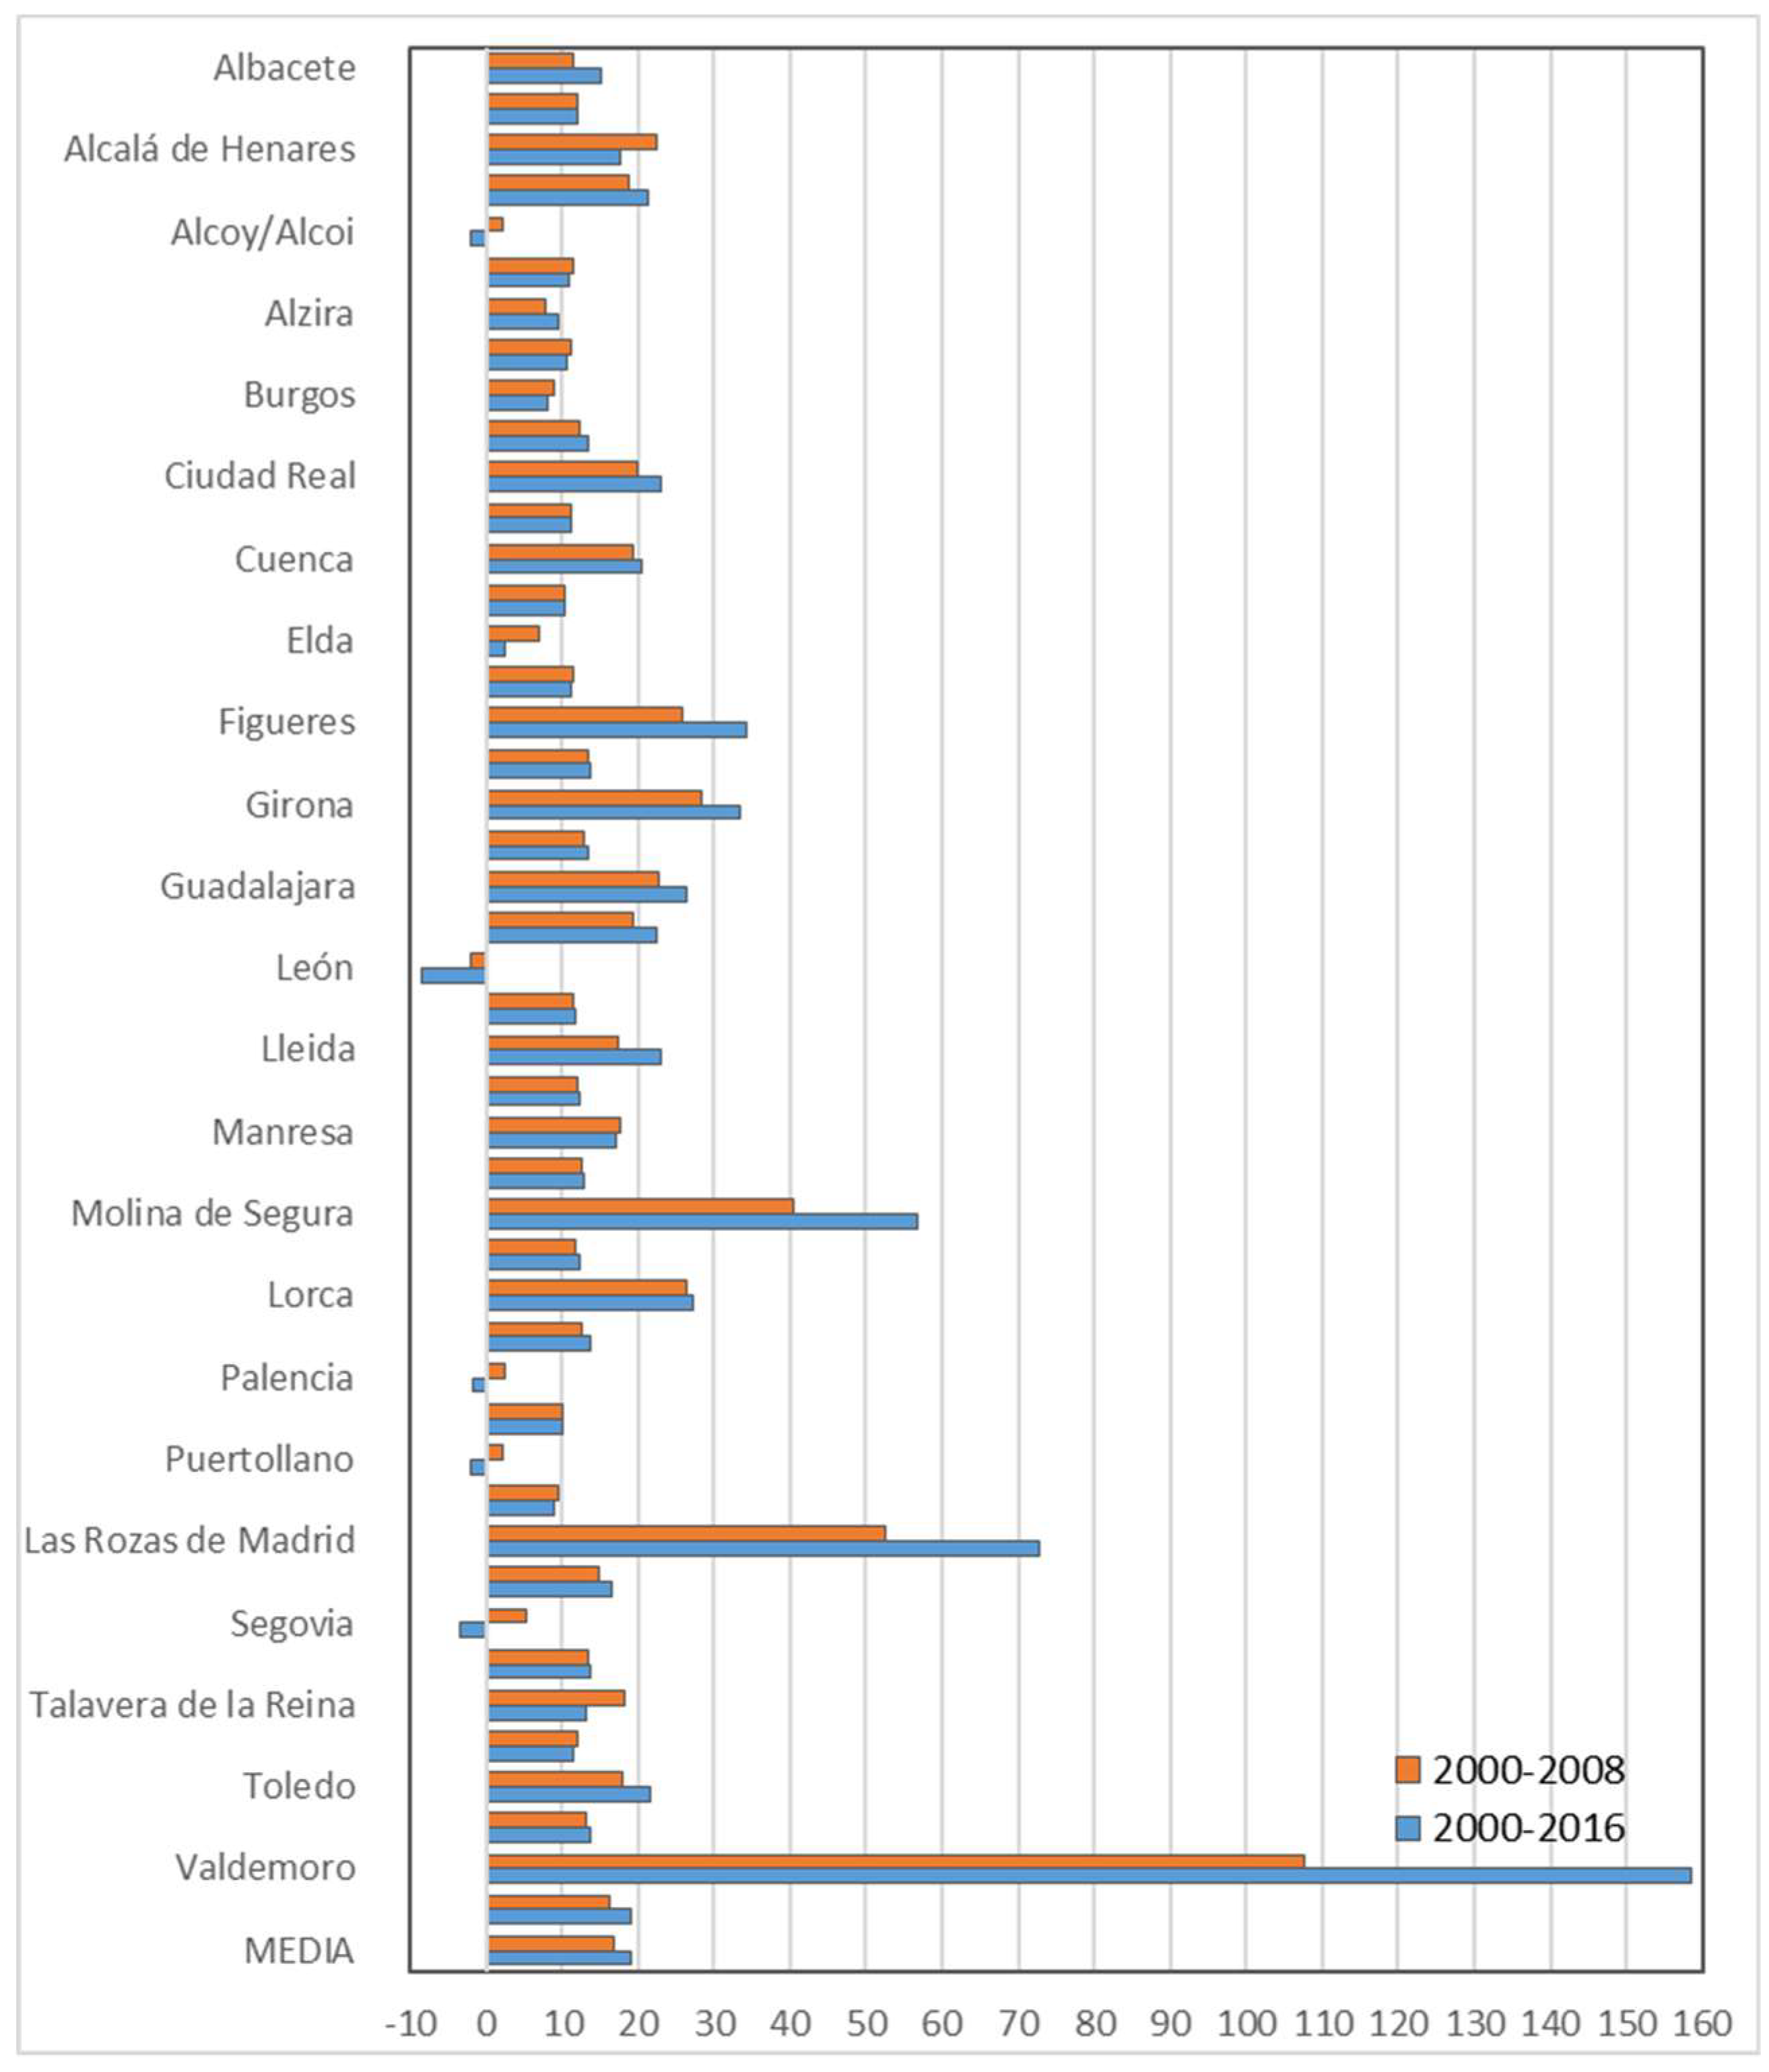
The integration of the three criteria, through the use of variation rates for the period 2000–2016, from the geometric averages weighted (2016 population) (
Figure 16) leaves an illustrative situation of the differential behavior among them, with urban areas in which the population has increased above the urbanised and built ground (Alcalá de Henares, Las Rozas, Valdemoro, or Segovia). Others have done so with a predominance of urbanised population area (Ciudad Real, Puertollano, Albacete, Leon, Lerida, Burgos, Lorca, or Molina del Segura). In other cases, there has been a clear dominance of the built-up surface area over the population (such as Cuenca, Ciudad Real and Elda, and cases added such as Albacete). In Guadalajara in contrast, there have been strong dynamics, which have simultaneously affected the population, built-up area, and land.
6. Conclusions
In conclusion, it can be pointed out that the process of urban sprawl, in the cases and in the analysed periods, has been marked by very different territorial and temporal behaviours. On the one hand, we highlight the increase in dispersion that is associated with the context of economic growth in the first decade of the century. In those years, strong dynamics with different territorial intensities have appeared in the periphery. This can be seen in the significant increase of the population, the surface of unbuilt plots (where the change has been most intense), the surface of built-up plots, and the number of homes in some nearby towns, especially the border with the central city.
Dispersion dynamics have been bigger in the inserted medium-size cities with polynuclear metropolitan areas, such as is the case of Madrid. Meanwhile, the areas that are farther away from big cities tend to keep the trends that are more associated with the will of growth than a real need for it. In the latter, the demographic dynamics have been soft, while the processes of reclassification of land and house construction have been well above the real needs.
Subsequently, from 2009, the trend has slowed down sharply. The dynamics of population growth, along with the processes of urbanisation and the morphological and functional transformation of the peripheries, have stalled.
This growth has created changes in the location of the residential units and the type of housing, sometimes due to the interests of the peripheral municipalities, to join the dynamics of urban areas. What remains is a process of change for the city model that is associated with an economic context of growth. As a result, we also have a considerable reserve of land for future actions in urban peripheries. Finally, a stock of built-up areas and very important housing appears for which there is a clear solution, since the expectations of growth from 2009 have stalled in peri-urban areas. There is an open debate on the future strategies of many urban areas regarding a change of look, which now is mainly focussed on the consolidated city.


