Segregated in the City, Separated in the School. The Reproduction of Social Inequality through the School System

Abstract
:1. Introduction
2. Residential Segregation and School Segregation in Catalonia
3. Hypothesis, Materials, and Methods
4. Analysis and Results: Segregation and Educational Paths
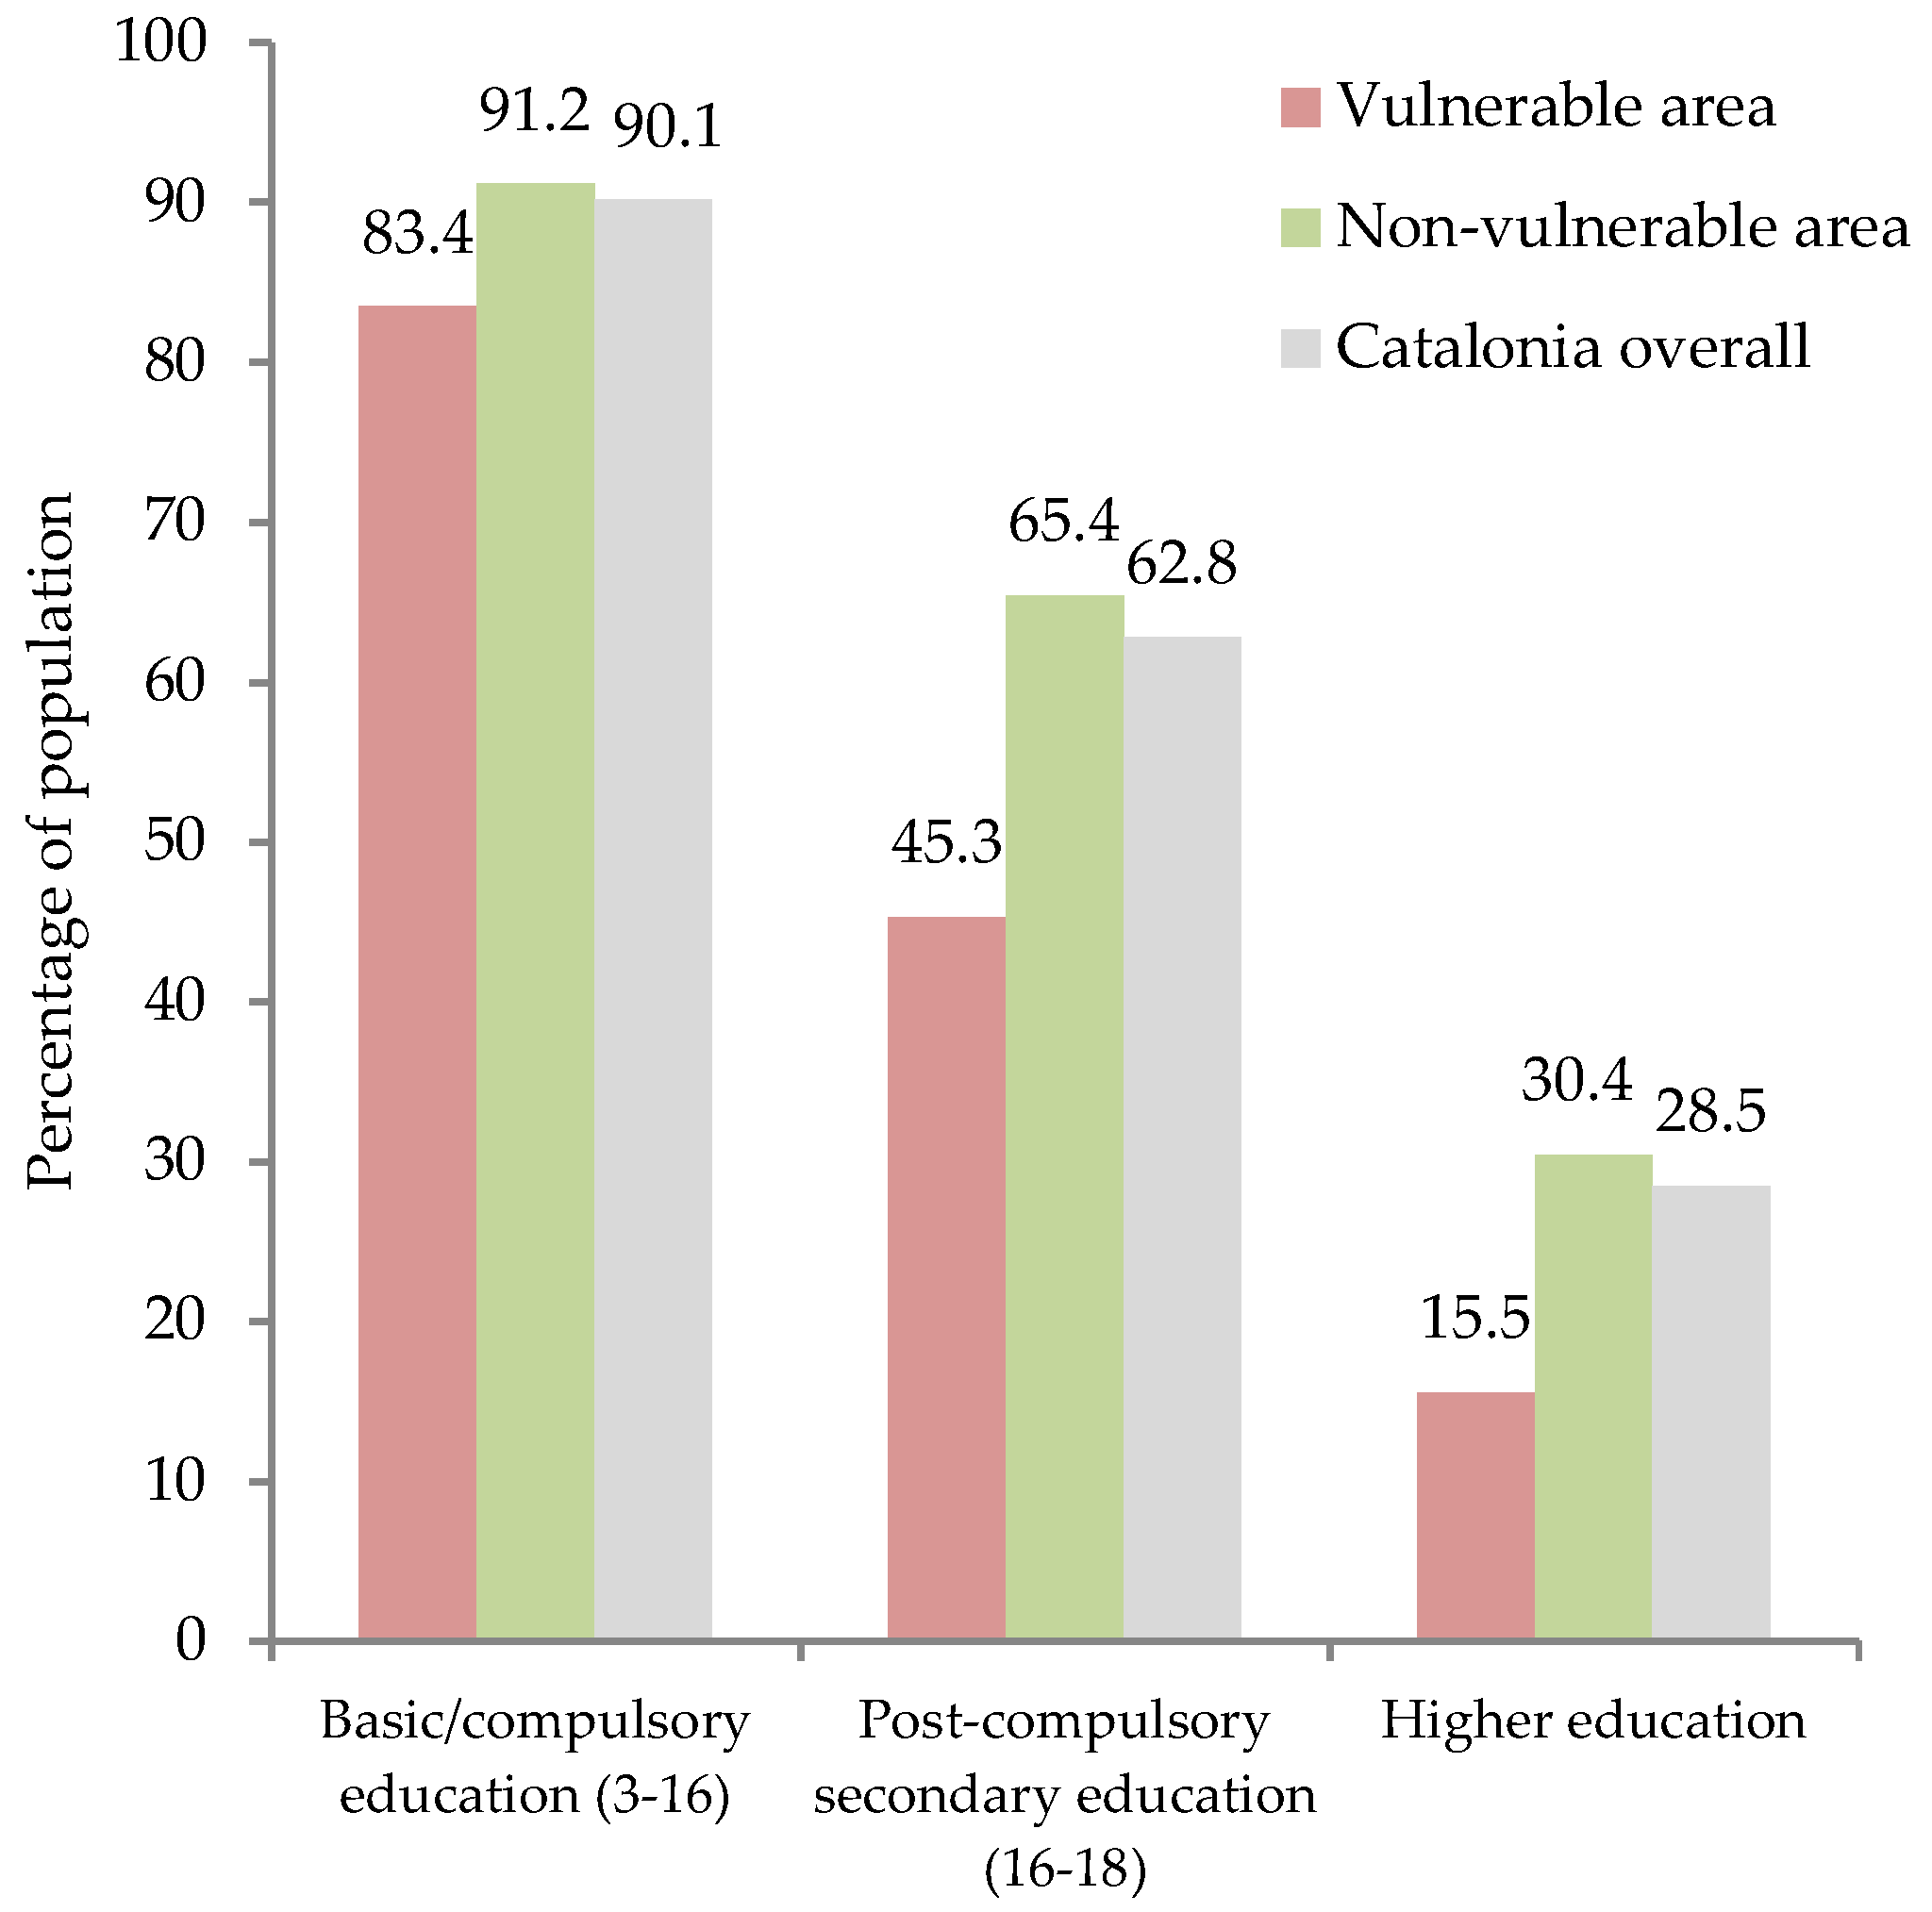
4.1. Residential Segregation and Educational Paths in Catalonia
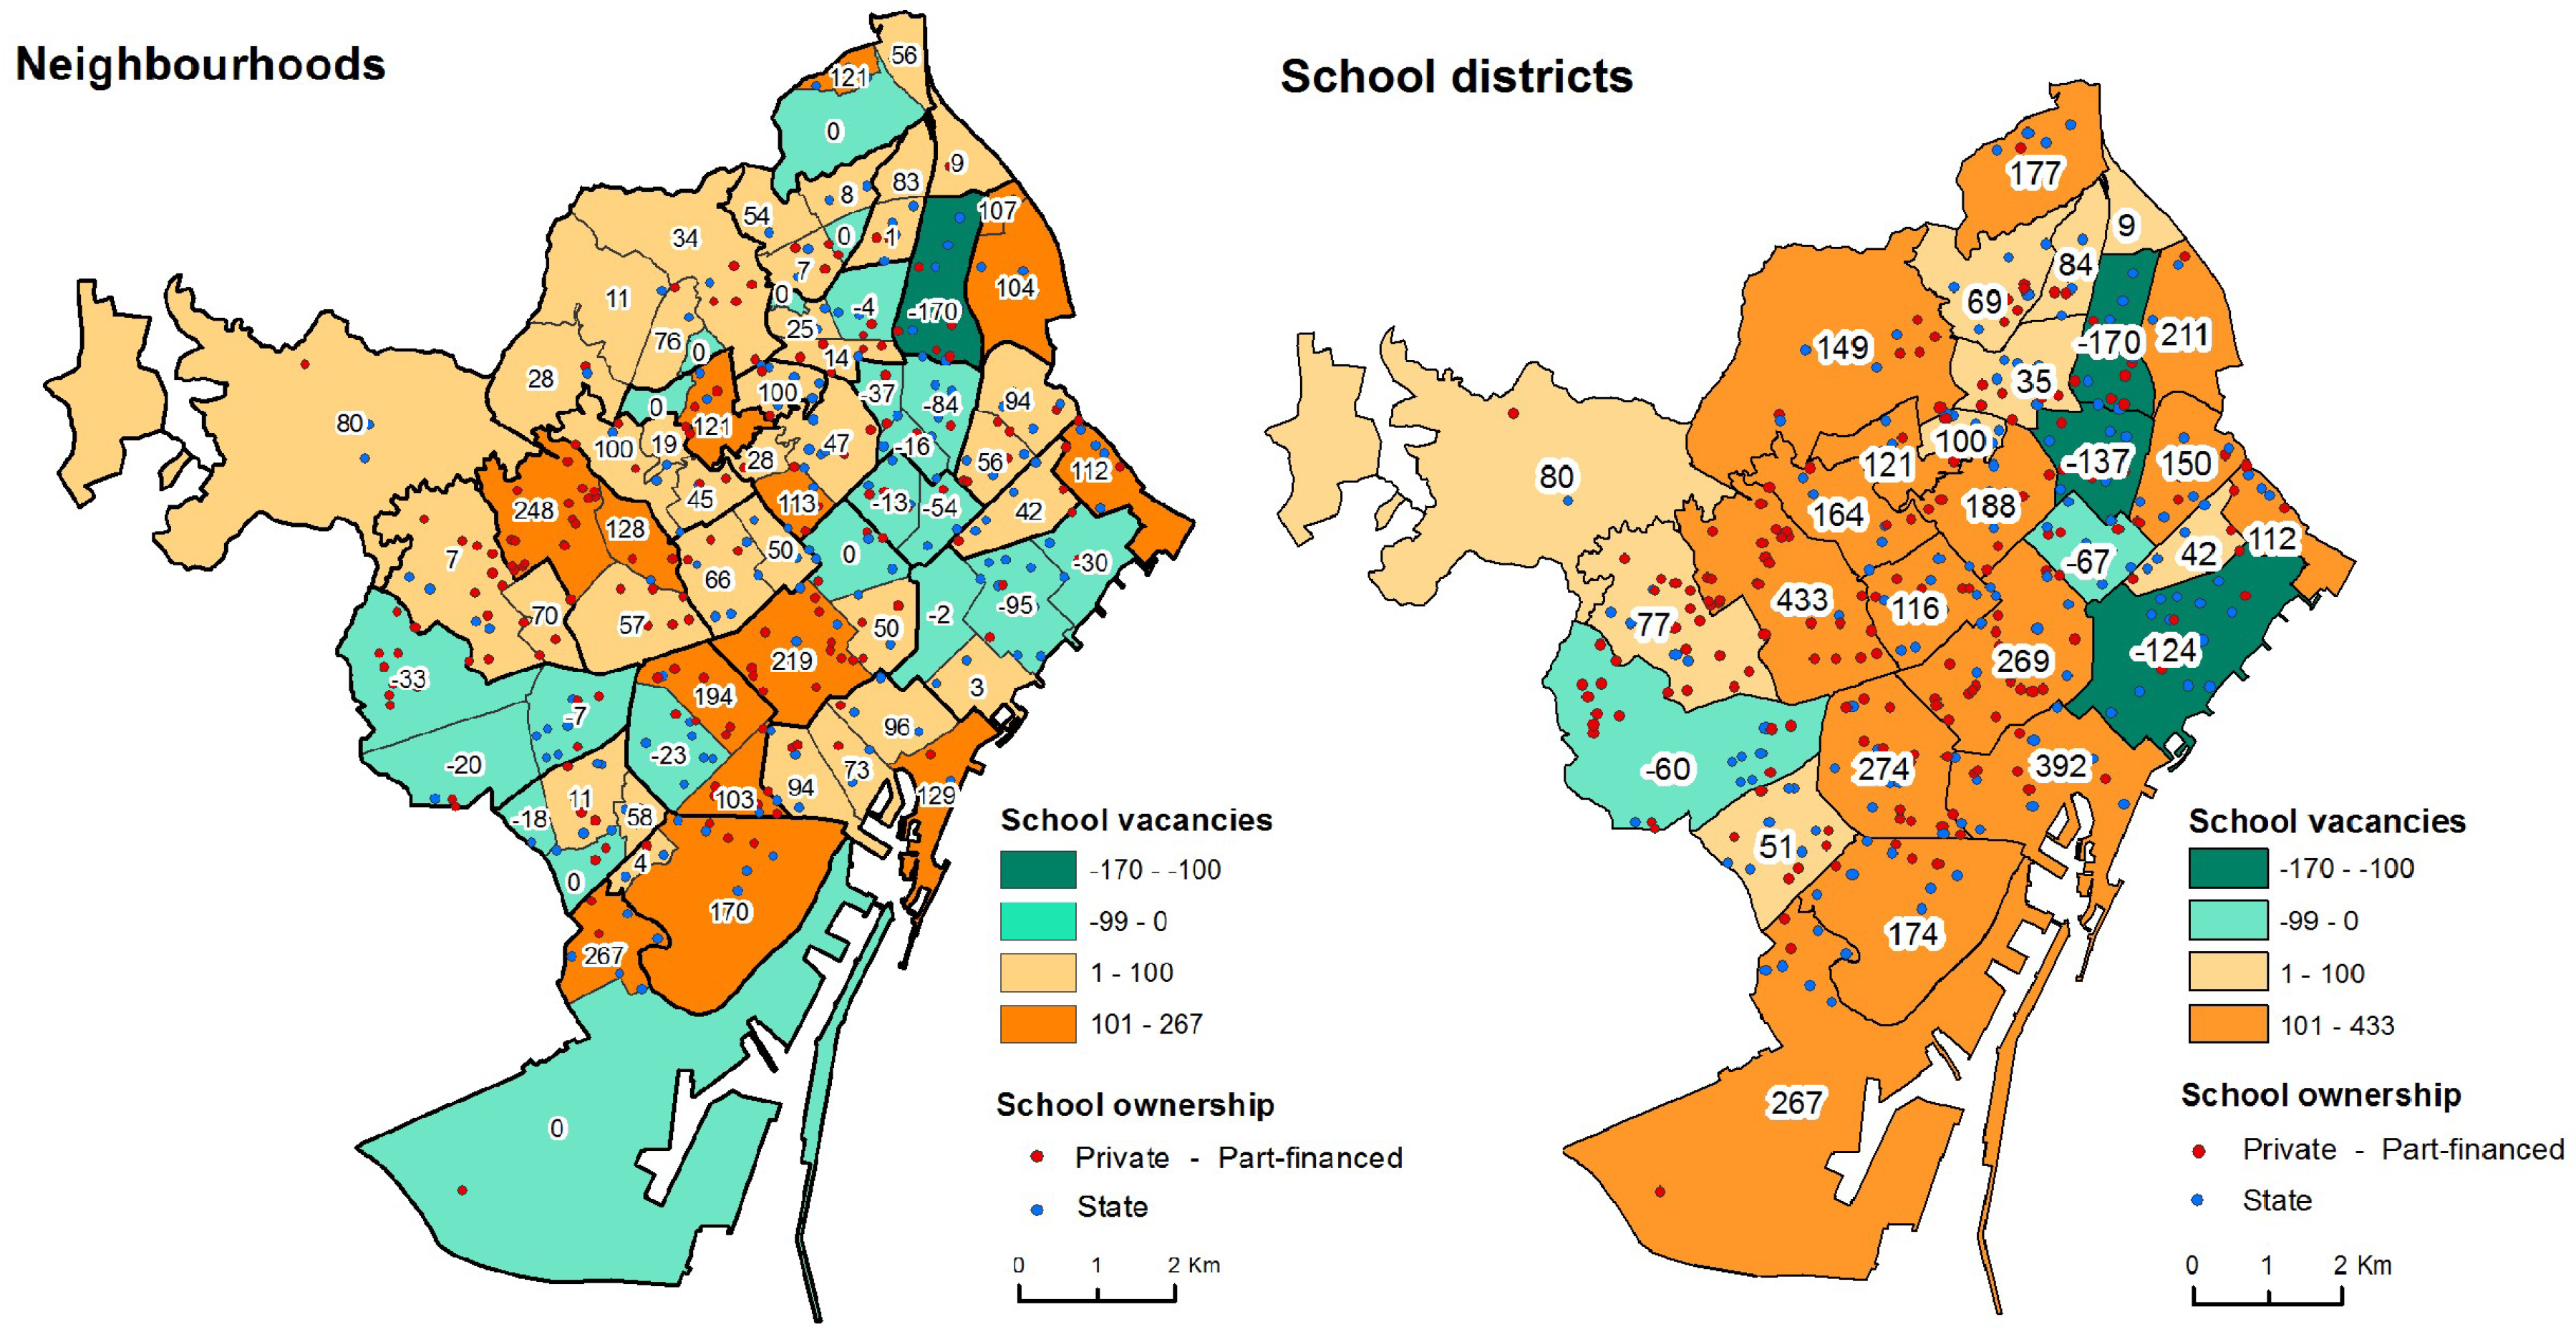
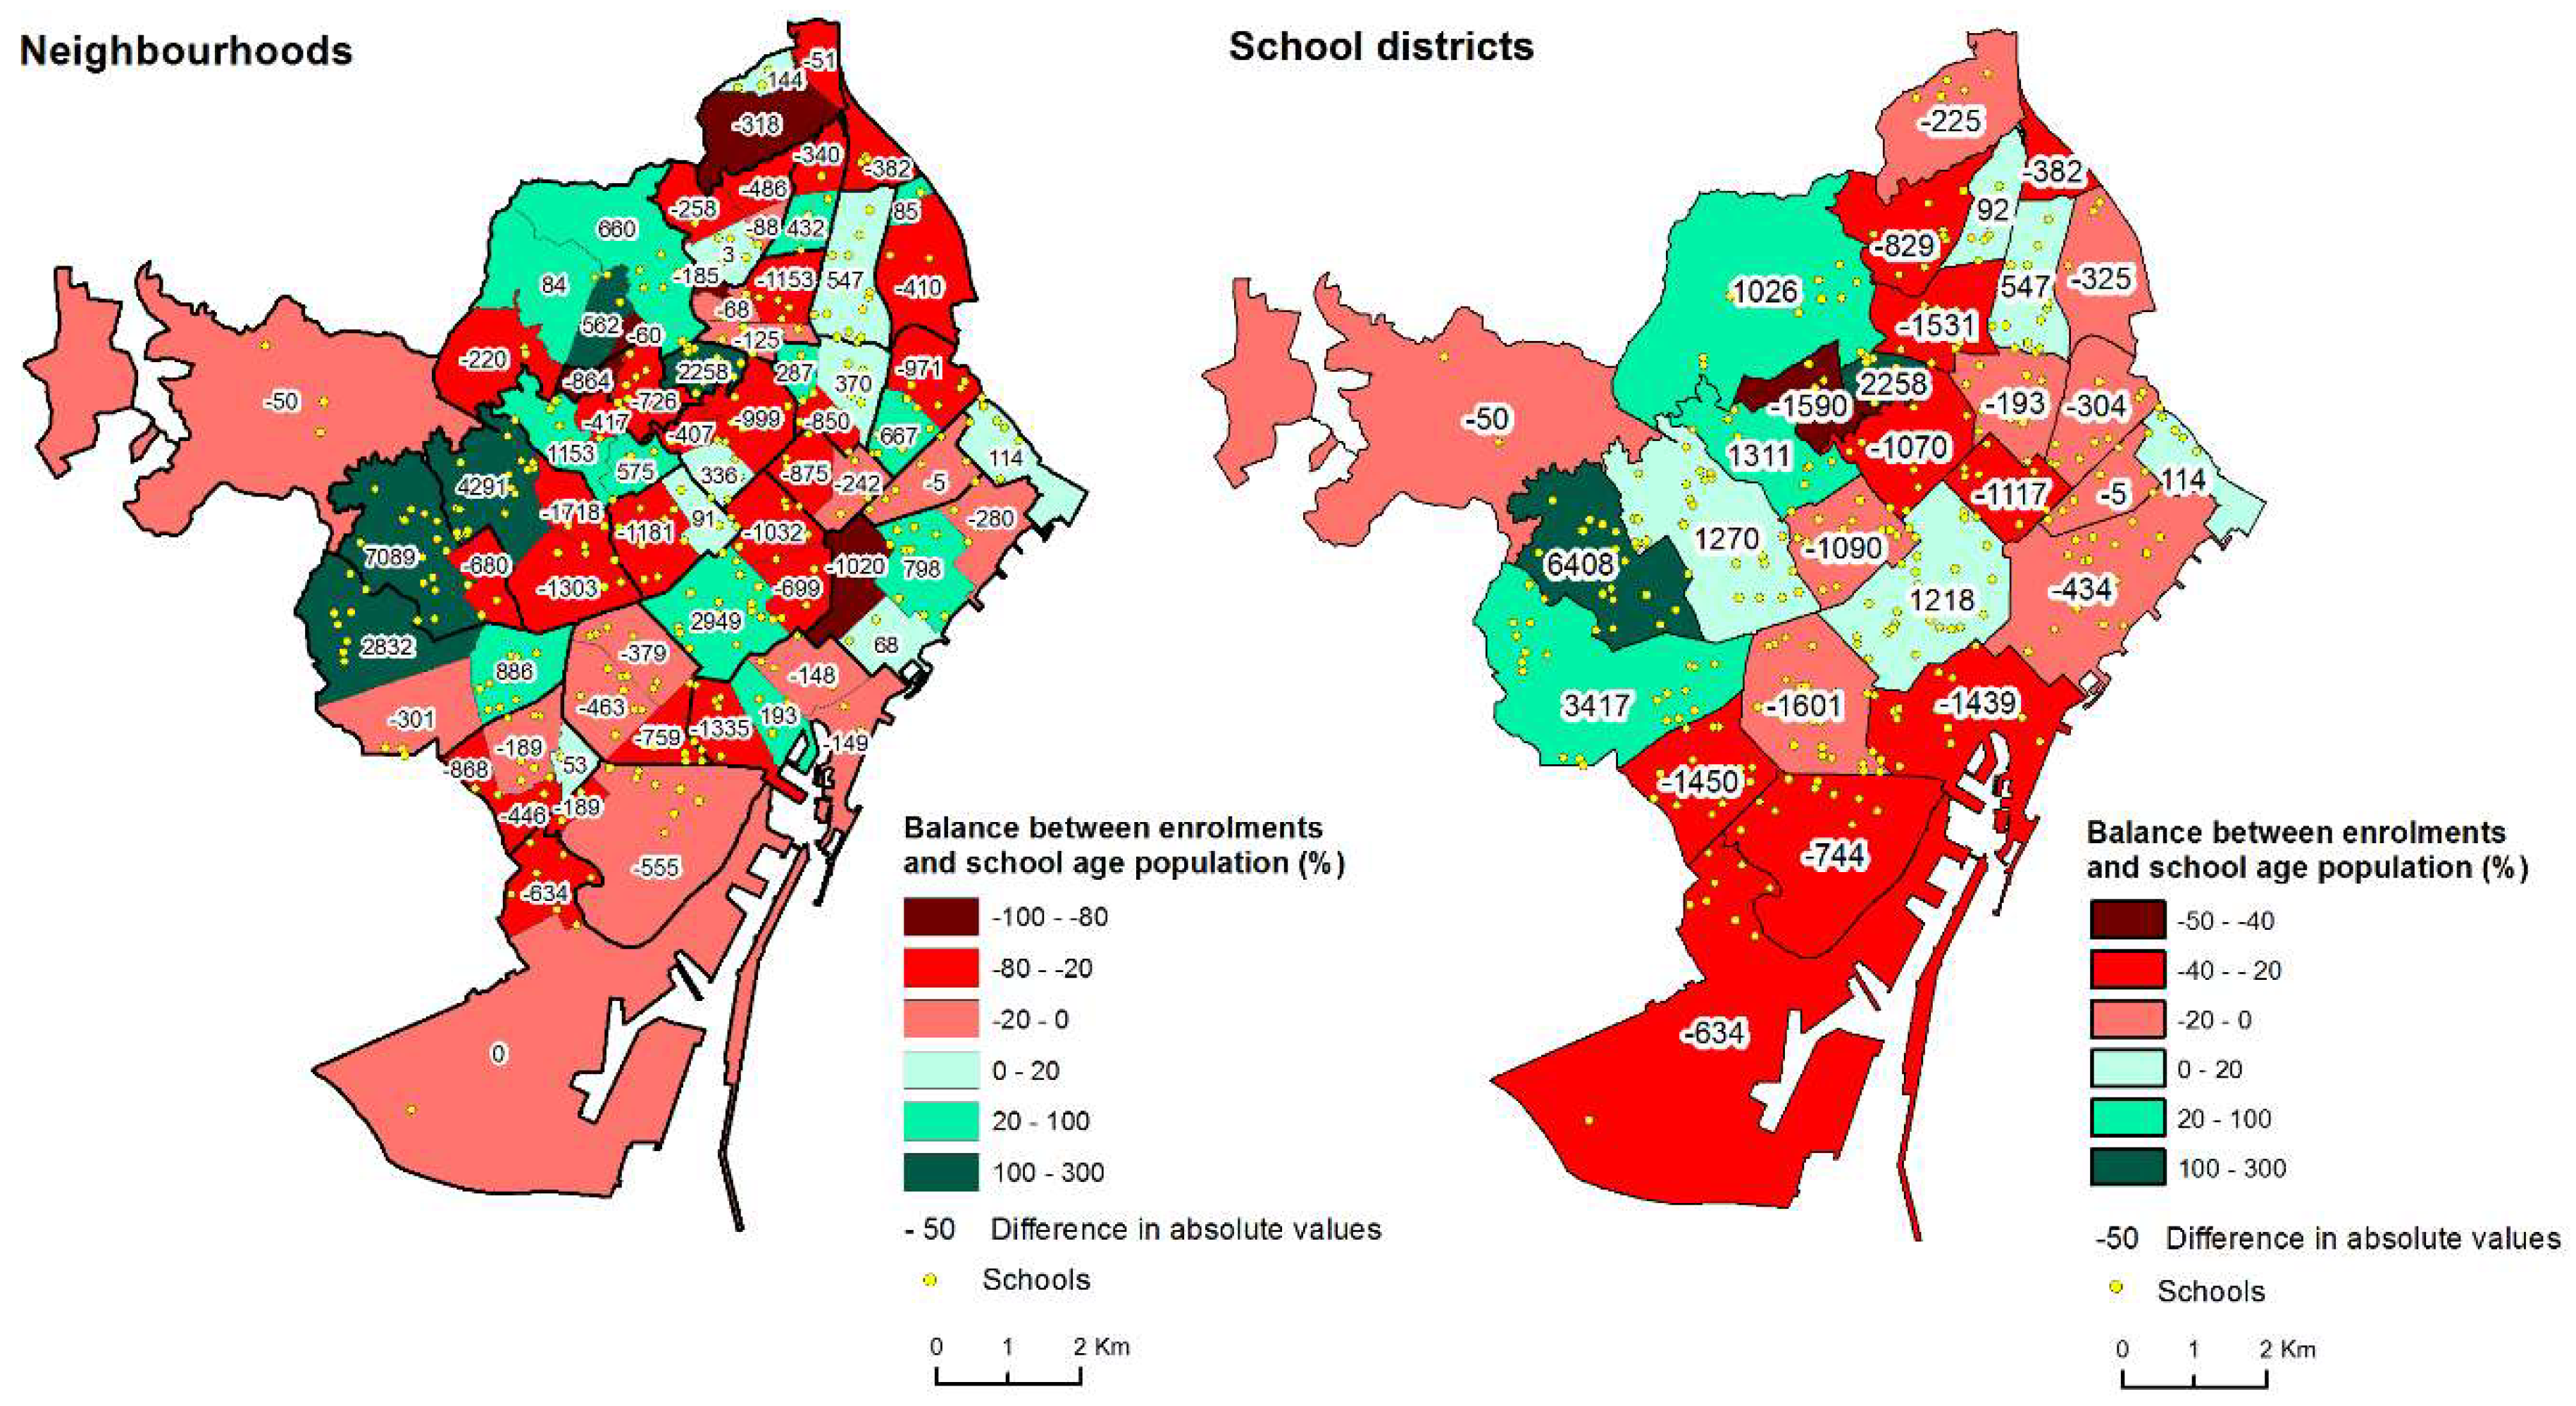
4.2. Choosing Schools in Barcelona
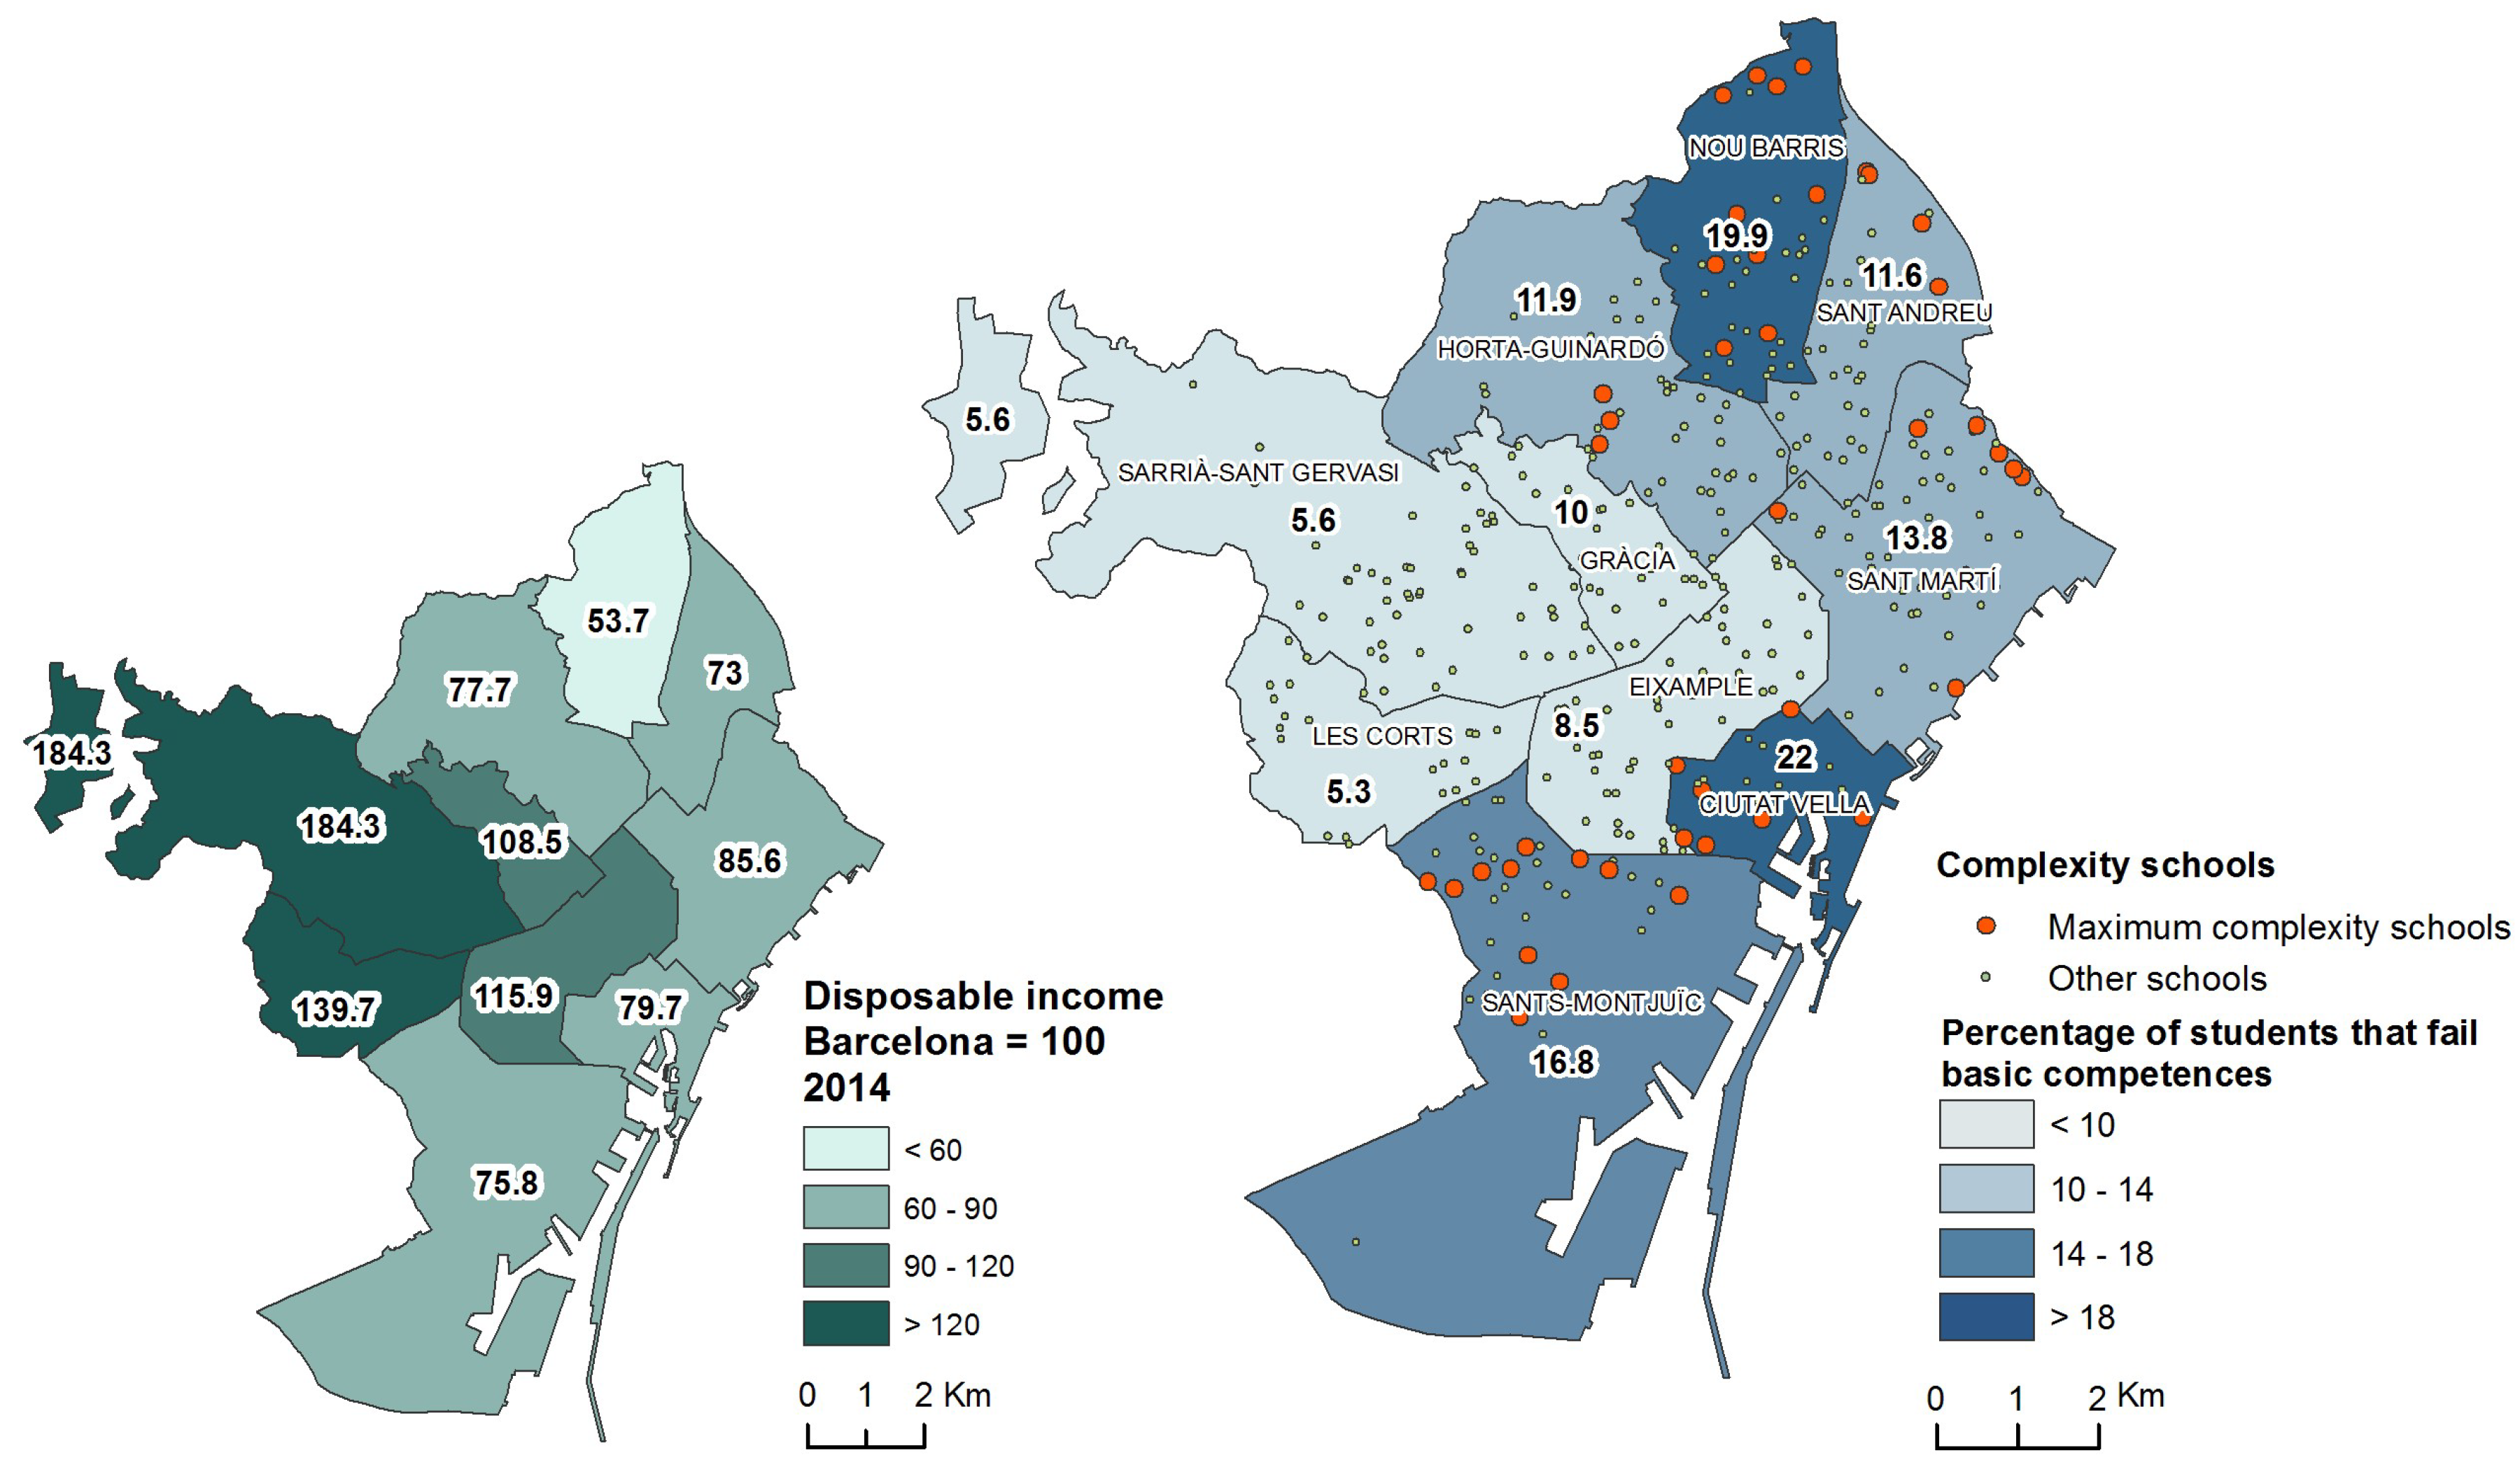
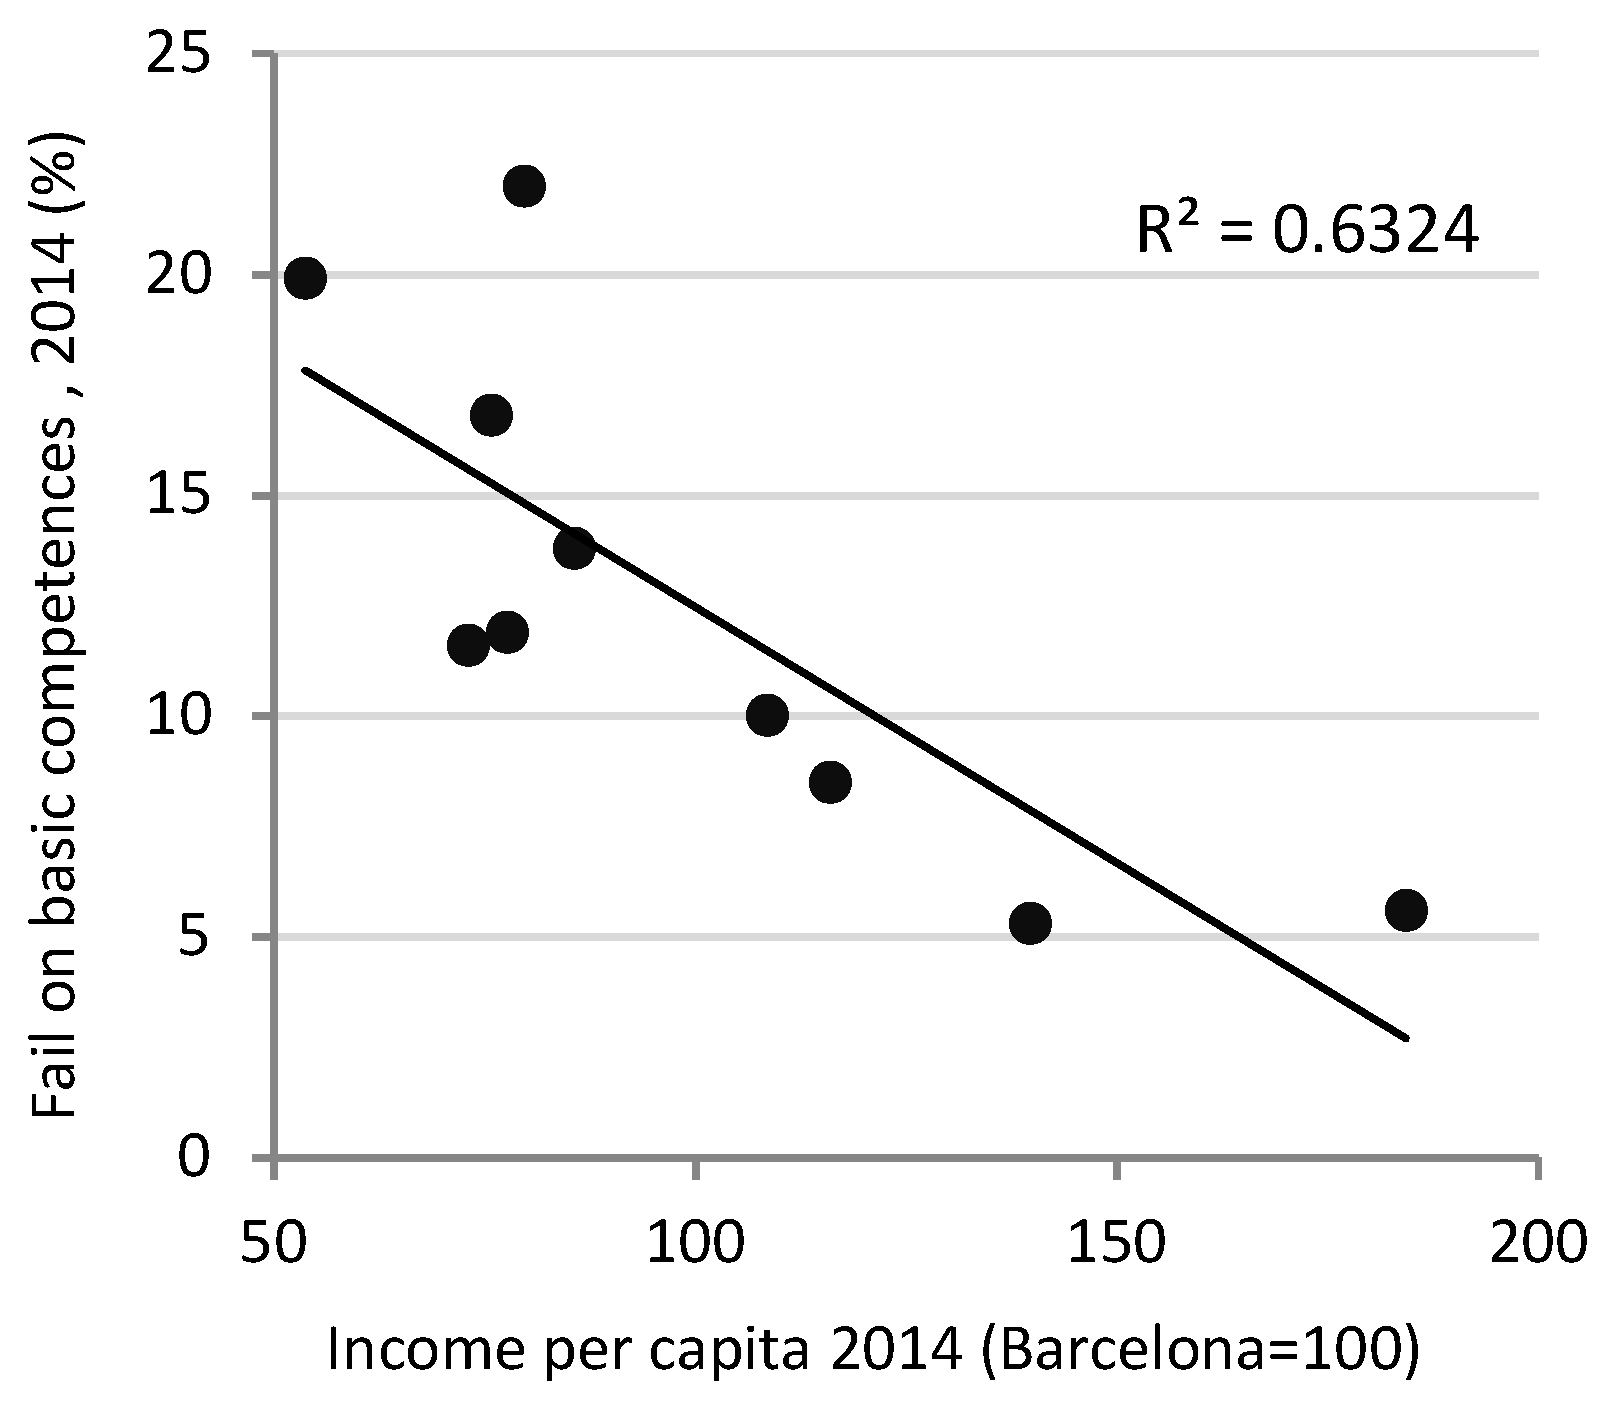
4.3. Inequalities in School Performance
5. Conclusions
Author Contributions
Funding
Conflicts of Interest
References
- Nel·lo, O.; López, J. El procés d’urbanització. In Raó de Catalunya. La Societat Catalana al Segle XXI; Giner, S., Homs, O., Eds.; Institut d’Estudis Catalans i Enciclopèdia Catalana: Barcelona, Spain, 2016; pp. 119–148. [Google Scholar]
- Indovina, F. La Ciudad de Baja Densidad: Lógicas, Gestión y Contención; Diputació de Barcelona: Barcelona, Spain, 2007. [Google Scholar]
- Soja, E.W. Seeking Spatial Justice; Univeristy of Minnesota Press: Minneapolis, MN, USA, 2010. [Google Scholar]
- Tammaru, T.; Marcinczak, S.; Van Ham, M.; Musterd, S. Socio-Economic Segregation in European Capital Citites. East Meets West; Routledge: London, UK, 2016. [Google Scholar]
- Secchi, B. La Città dei Ricchi e la Città dei Poveri; Laterza: Bari, Italy, 2013. [Google Scholar]
- Atkinson, R.; Kintrea, K. Disentangling Area Effects: Evidence from Deprived and Non-deprived Neighbourhoods. Urban Stud. 2001, 38, 2277–2298. [Google Scholar] [CrossRef]
- Galster, G.; Anderson, R.; Mustered, S. Who is affected by neighbourhood income mix? Gender, age, family, employment and income differences. Urban Stud. 2010, 47, 2915–2944. [Google Scholar] [CrossRef]
- Slatter, T. Your Life Chances Affect Where You Live: A critique of the ‘Cottage Industry’ of Neighbourhood Effects Research. Int. J. Urban Reg. Res. 2013, 37, 367–387. [Google Scholar] [CrossRef]
- Cheshire, P. Segregated Neighbourhoods and Mixed Communities. A Critical Analisys; Joseph Rowntree Foundation: York, UK, 2007. [Google Scholar]
- Bonal, X. La política educativa ante el reto de la segregación escolar en Cataluña. Int. Inst. Educ. Plan. 2018, 7–17. Available online: http://unesdoc.unesco.org/images/0026/002614/261471s.pdf (accessed on 4 April 2018).
- Sikkink, D.; Emerson, M.O. School schoice and racial segregation in US schools: The role of parents’ education. Ethnic Racial Stud. 2008, 31, 267–293. [Google Scholar] [CrossRef]
- Bagley, C. Black and white unite or flight? The racialised dimension of schooling and parental choice. Br. Educ. Res. J. 1996, 22, 569–580. [Google Scholar] [CrossRef]
- Burgess, S.; McConnell, B.; Propper, C.; Wilson, D. The impact of school choice on shorting by ability and socioeconomic factors in English secondary education. In Schools and the Equal Opportunity Problem; Wössmann, L., Peterson, P.E., Eds.; MIT Press: Cambridge, UK, 2007. [Google Scholar]
- Cullen, J.B.; Jacob, B.A.; Levitt, S.D. The impact of school choice on studemt outcomes: An analysis of the Chicago public schools. J. Public Econ. 2005, 85, 729–760. [Google Scholar] [CrossRef]
- Gewirtz, S.; Ball, S.; Bowe, R. Markets, Choice and Equity in Education; Univerisity Press: Buckingham, UK, 1995. [Google Scholar]
- Bonal, X.; Zancajo, A. Educació, pobresa i desigualtats en un context de crisi. Nota d’economia 2016, 103, 91–103. [Google Scholar]
- Méndez, R.; Abad, L.D.; Echaves, C. Atlas de la crisis. In Impactos Socioeconómicos y Territorios Vulnerables en España; Tirant lo Blanch: Valencia, Spain, 2014. [Google Scholar]
- Nel·lo, O.; Donat, C. Los efectos territoriales de la crisis en la región metropolitana de Barcelona. In Geografía de la Crisis Económica en España; Albertos, J.M., Sánchez, J.L., Eds.; Publicaciones de la Universitat de València: Valencia, Spain, 2014; pp. 565–608. [Google Scholar]
- Sarasa, S.; Porcel, S.; Navarro-Varas, L. L’impacte social de la crisi a l’Àrea Metropolitana de Barcelona i a Catalunya. Papers 2013, 56, 10–87. [Google Scholar]
- Blanco, I.; Nello, O. Barrios y Crisis. Crisis Económica, Segregación Urbana e Innovación Social en Catalunya; Tirant lo Blanch: Valencia, Spain, 2018. [Google Scholar]
- Nel·lo, O. Desigualdad social y segregación urbana en la región urbana de Barcelona. In Estudios de Geografía Urbana en Tiempos de Crisis. Territorios Inconclusos y Sociedades Rotas en España; Brandis, D., del Río, I., Morales, G., Eds.; Biblioteca Nueva: Madrid, Spain, 2016. [Google Scholar]
- Benito, R.; Gonález, I. Processos de segregació escolar a Catalunya. Fundació Jaume Bofill 2007, 59, 11–155. Available online: http://www.fbofill.cat/sites/default/files/464.pdf (accessed on 6 April 2018).
- Síndic de Greuges. La segregació escolar a Catalunya. Informe Extraordinari. Síndic de Greuges 2008, 5–131. Available online: https://www.sindic.cat/site/files/docs/60_INFORME%20SEGREGACIO%20ESCOLAR.pdf (accessed on 6 April 2018).
- García-Castaño, F.J.; Olmos alcaraz, A. Segregaciones y Construcción de la Diferencia en la Escuela; Trotta: Madrid, Spain, 2012. [Google Scholar]
- Martínez, M.; Albaigés, B. L’estat de l’educació a Catalunya. Anuari 2013. Fundació Jaume Bofill 2013, 80, 13–563. Available online: http://www.fbofill.cat/sites/default/files/582.pdf (accessed on 6 April 2018).
- Síndic de Greuges. La segregación escolar en Cataluña (I): La gestión del proceso de admisión del alumnado. Síndic de Greuges 2016. Available online: http://www.sindic.cat/site/unitFiles/4155/Informe%20segregacion%20escolar_I_gestionprocesoadmision_castellano_def.pdf (accessed on 7 April 2018).
- Síndic de Greuges. La segregación escolar en Cataluña (II): Condiciones de escolarización. Síndic de Greuges 2016. Available online: http://www.sindic.cat/site/unitFiles/4227/Informe%20segregacio%20escolar_II_condicions_escolaritzacio_cast_ok.pdf (accessed on 7 April 2018).
- Alegre, M.A. Polítiques de tria i assignació d’escola: Quins efectes tenen sobre la segregació escolar? Què Funciona en Educació 2017, 1–41. Available online: http://www.fbofill.cat/sites/default/files/Que_funciona_07_segregracioescolar_301017.pdf (accessed on 7 April 2018).
- Bonal, X.; Tarabini-Castellani, A.; Verger, A. La nova política educativa i les desigualtats. Nous Horitzons 2015, 209, 16–21. Available online: http://www.noushoritzons.cat/sites/default/files/la_nova_politica_educativa_i_les_desigualtats.pdf (accessed on 7 April 2018).
- Alegre, M.A.; Benito, R.; Chela, X.; Gonález, S. Les famílies davant l’elecció escolar. Dilemes i desigualtats en la tria de centres a la ciutat de Barcelona. Fundació Jaume Bofill 2010, 72, 11–304. Available online: http://www.fbofill.cat/sites/default/files/528.pdf (accessed on 7 April 2018).
- Nel·lo, O.; Gomà, A. Territori. Diversitat espacial en els hàbits i condicions de vida juvenils: El paper clau de la segregació residencial. In Enquesta de Joventut de Catalunya; Serracant, P., Ed.; Generalitat de Catalunya: Barcelona, Spain, 2018. [Google Scholar]
- Departament d’Estadística, Ajuntament de Barcelona. Available online: http://www.bcn.cat/estadistica/catala/index.htm (accessed on 5 December 2017).
- Departament d’Ensenyament, Generalitat de Catalunya. Available online: http://ensenyament.gencat.cat/ca/inici (accessed on 31 January 2018).
- Consorci d’Educació de Barcelona, CEB. Available online: http://edubcn.cat/ca/ (accessed on 11 December 2017).


| District | Disposable Income per Capita 2014 (Barcelona = 100) | Failed on Basic Competences in 6th Grade, 2014 (%) | No. Maximum Complexity Schools |
|---|---|---|---|
| 1. Ciutat Vella | 79.7 | 22 | 7 |
| 2. Eixample | 115.9 | 8.5 | 0 |
| 3. Sants-Montjuïc | 75.8 | 16.8 | 11 |
| 4. Les Corts | 139.7 | 5.3 | 0 |
| 5. Sarrià-St Gervasi | 184.3 | 5.6 | 0 |
| 6. Gràcia | 108.5 | 10 | 0 |
| 7. Horta-Guinardó | 77.7 | 11.9 | 3 |
| 8. Nou Barris | 53.7 | 19.9 | 10 |
| 9. Sant Andreu | 73 | 11.6 | 4 |
| 10. Sant Martí | 85.6 | 13.8 | 7 |
© 2018 by the authors. Licensee MDPI, Basel, Switzerland. This article is an open access article distributed under the terms and conditions of the Creative Commons Attribution (CC BY) license (http://creativecommons.org/licenses/by/4.0/).
Share and Cite
Gomà Garcia, A.; Muñoz Aranda, J. Segregated in the City, Separated in the School. The Reproduction of Social Inequality through the School System. Urban Sci. 2018, 2, 112. https://doi.org/10.3390/urbansci2040112
Gomà Garcia A, Muñoz Aranda J. Segregated in the City, Separated in the School. The Reproduction of Social Inequality through the School System. Urban Science. 2018; 2(4):112. https://doi.org/10.3390/urbansci2040112
Chicago/Turabian StyleGomà Garcia, Aina, and Joel Muñoz Aranda. 2018. "Segregated in the City, Separated in the School. The Reproduction of Social Inequality through the School System" Urban Science 2, no. 4: 112. https://doi.org/10.3390/urbansci2040112
APA StyleGomà Garcia, A., & Muñoz Aranda, J. (2018). Segregated in the City, Separated in the School. The Reproduction of Social Inequality through the School System. Urban Science, 2(4), 112. https://doi.org/10.3390/urbansci2040112