1. Introduction
A sustainable urban community requires the involvement of stakeholders in the early expansion phases of the urbanization process, as their contribution is key to the creation of innovative, viable urban development. Land use policies that preserve agricultural and other green spaces are increasingly important to respond to a city’s increasing densification and improve the quality of life of its residents and users.
The revitalization of brownfields indicates the willingness of cities to densify and give them a specific increase in property assessment values while allowing for the preservation of agricultural land and simultaneously minimizing commuting distances.
The United States Environmental Protection Agency (US EPA) [
1] estimates that there are about 450,000 brownfields in the US, while the US Conference of Mayors (2006) puts the figure at 600,000. In Canada, there are about 35,000 contaminated sites according to the National Round Table on the Environment and the Economy (NRTEE) [
2]. Most of these sites are located in the urban centers of Montréal, Toronto, and Vancouver [
3]. The redevelopment of these areas is complex and the current development initiatives are mostly oriented towards investments to improve them in terms of their environmental aspects.
Awareness of the potential revitalization of brownfields and the contextualization of these areas in relation to the rest of the city is very recent. The first studies on brownfields only date from the early 1990s. These are areas that have been neglected over time, most often due to the presence of soil contamination. Different theories focus on the concept of location in making decisions on the revitalization of a contaminated site, such as the real estate market, location, community, use, and accessibility [
4]. As in land use theory, an emphasis is given to location as the main reason for creating enterprises, followed by market demand and the availability of human resources [
5]. Given that many brownfields are located near city centers, the competitive advantage theory emphasizes the importance of local government support to attract investors [
1]. New industrial and entrepreneurial zones are being created in accordance with policies to attract private investment, with incentives for small and medium enterprises [
3]. The reluctance to fully revitalize these areas is related to the inertia of federal and local governments to initiate the redevelopment process, which, in turn, is due to the low level of understanding and of accepting the incorporation of the participatory and collaborative approaches required for the management of complex projects [
6]. These sites could be cleaned up to meet current environmental standards and be processed for reuse according to the expectations of citizens and for use in new economies, including for housing and the improvement of the quality of life for future residents [
3,
7,
8]. Some approaches address the efficient use of land and improved modes of transportation, such as allowing increased accessibility and travel options [
9,
10,
11,
12]. Other approaches address the smart city concept, focusing on accessibility and the capacity of a city to offer its citizens goods, services, and activities according to their expressed desires [
5,
13,
14]. A common feature of all of these approaches is the transformation of the current neighborhood development process by the redevelopment of existing sites [
15,
16] and by designing new urban neighborhoods [
17]. Many of these approaches are based on generic principles that are considered to be equally applicable to different situations [
5,
10,
14]. The general assumption underlying these principles is that sustainable urban organization increases the long-term benefits for residents, businesses, developers, and governments (Hernández-Moreno and De Hoyos-Martínez (2010) cited by Luederitz (2013)) [
12].
The involvement of stakeholders is essential for defining strategies to revitalize brownfields and to reconcile these strategies with the city [
18]. The most commonly used assessment tools (LEED CASBEE, BREEAM and SBTool [
19,
20,
21] have a complex structure and do not provide the desired results for the analysis of brownfield projects. They do not include the involvement of all stakeholders, their indicators are not equally divided between the three dimensions of sustainable development [
22] and they do not take into account the local context and expectations [
23]. A rigorous approach and the use of appropriate indicators have proven to be a necessity to improve the success of such projects [
24].
The objective of this case study is to estimate the objectives of the Lachine-Turcot-Petite Bourgogne—an urban redevelopment project for an industrial brownfield in Montréal—and compare them with the socio-economic benefits after 14 years of implementation. This evaluation demonstrates the need for an effective evaluation tool for all project phases if local objectives and expectations are to be met. It also proposes an ontology of the elements required for effective decision making, as well as indicators related to environmental and socioeconomic components that should be incorporated into this assessment tool and the need to evaluate the project during its development to focus the initial objectives of the project.
This article is structured as follows: (1) An overview of the revitalization of brownfields based on theoretical knowledge and practical experience (Context); (2) an analysis of the most commonly used brownfield redevelopment approaches (Literature review); (3) the methodology and case study of the industrial site canal Lachine-Turcot-Petite Bourgogne in Montréal; and (4) the results and conclusions, including recommendations and possible research directions.
2. Brownfields: Theoretical Knowledge and Practical Experience
According to literature review studies, urban revitalization interventions are not focused on poverty and improving urban services, but on creating a mix of income (2003) This research shows that poverty is not supported and that it is rather the territorial concentration of poverty that is attenuated by the influx of wealthier populations [
25]. Other research, thus, shows an instrumentalization of disadvantaged areas because they are metaphors of poverty and that urban revitalization becomes a symbol of discourse and political action [
26].
Although our object of study does not focus on the gentrification and the increase of the land values, it remains essential to approach this phenomenon, to understand the transformations underway in the brownfield Lachine-Turcot-Petite Bourgogne. In studies conducted by Préfontaine (2008) [
25] the concept of gentrification is often synonymous with gentrification or at least a change in social composition through displacement or replacement of the community. This displacement refers to the departure of traditional populations, as a consequence of changing market conditions; the replacement of the population is by the arrival of new people, which changes the social composition of the neighborhood to such an extent that it results in a loss of sense of home or feeling of community. This carries a higher cultural or economic capital [
26].
The economic orientation of development aims to stimulate the land and real estate market as well as to attract new customers to a neighborhood. The influx of new residents or new businesses is intended to fund the expansion of public services that will improve transit supply. The public actor then gives importance to the economic actors by participating in the effervescence of the land and real estate market through gestures of developments affecting the public space or by adapting the regulations according to the needs of the promoters.
In an urban rehabilitation process, as in other development processes, the use of a well-structured model is important to integrate these areas with the rest of the city while taking into account the needs of the local community and the objectives of public and private actors. The structure of these models must be supported by a decision-making process. The first steps in such a process should involve the participation of all stakeholders and the selection of indicators to measure the effectiveness of the project. In many cases, the models used to date have been flawed due to a lack of stakeholder involvement and the selection of local indicators to identify revitalization issues.
A number of decision analysis tools have been developed for brownfields redevelopment. Of the many tools that are available, some are intended almost exclusively for the evaluation and restoration of the environment, while others are designed to assist in interpreting life cycle analyses [
27]. In the 1990s, an assessment tool to support the sustainability of cities was implemented in the United States: The Green Building Council in Energy and Environmental Design [
21] developed the LEED New Development, which offers guidelines and certification as an important instrument for reducing the environmental impacts of the construction industry [
28]. In recent years LEED has made an effort to adapt this certification at the neighborhood level [
21] LEED ND (Neighborhood Development). This effort makes it clear that it is at the neighborhood level where economic gains and efficiencies are most significant. These can be achieved through the integrated planning of land, transport, and infrastructure which easily adapt themselves to the concept of intelligent growth and sustainable building principles [
29]. These tools focus mainly on building construction and financial returns; they do not deal with issues of livability and social diversity [
22]. In addition, most of the indicators that attempt to measure progress are focused on global, regional, or municipal issues and, thus, cannot be site-specific [
7]. Indicators for assessing brownfield redevelopment should include several features, such as interconnectivity with other areas and accessibility. An indicator must serve the objectives of the project and be able to define the entity it is intended to measure. For example, reducing the need to demolish the existing buildings serves multiple objectives: It avoids losing the identity of the context (cultural dimension), preserves natural resources, and reduces waste (environmental dimension) while decreasing management costs by avoiding unnecessary new construction (economic dimension). In addition, as De Sousa (2006) [
7] states, indicators are needed for the built environment, particularly for brownfield sites. Other authors mention several methods for measuring the efficiency of regeneration projects in urban areas, but, as they say, these methods only give partial results because the measures undertaken focus very little on contaminated sites, and their methods for allocating points are unclear and not very intuitive [
13]. This is the case for Greenberg (2000) [
9], who conducted important research on brownfield redevelopment projects, but their studies have not provided an ex-post assessment tool. Meanwhile, other work by Bacot and O’Dell (2006) cited by De Sousa (2006) [
7] suggests some indicators (such as the amount of affordable housing, the number of hectares of contaminated land, and the types of transportation) for measuring the viability of brownfields according to environmental and economic factors. What results from these studies is that the indicators are very limited for assessing brownfield redevelopment impacts (e.g., no discussion of habitability, social diversity, or green building design). More importantly, their methods do not take into account a project’s success (ex-post evaluation). Other methods have been designed to assess the degree of success in brownfield redevelopment, but they do not provide a means for measuring the success or impact of a project in relation to other areas of interest [
30], nor do they offer any way to determine if the project objectives have been achieved.
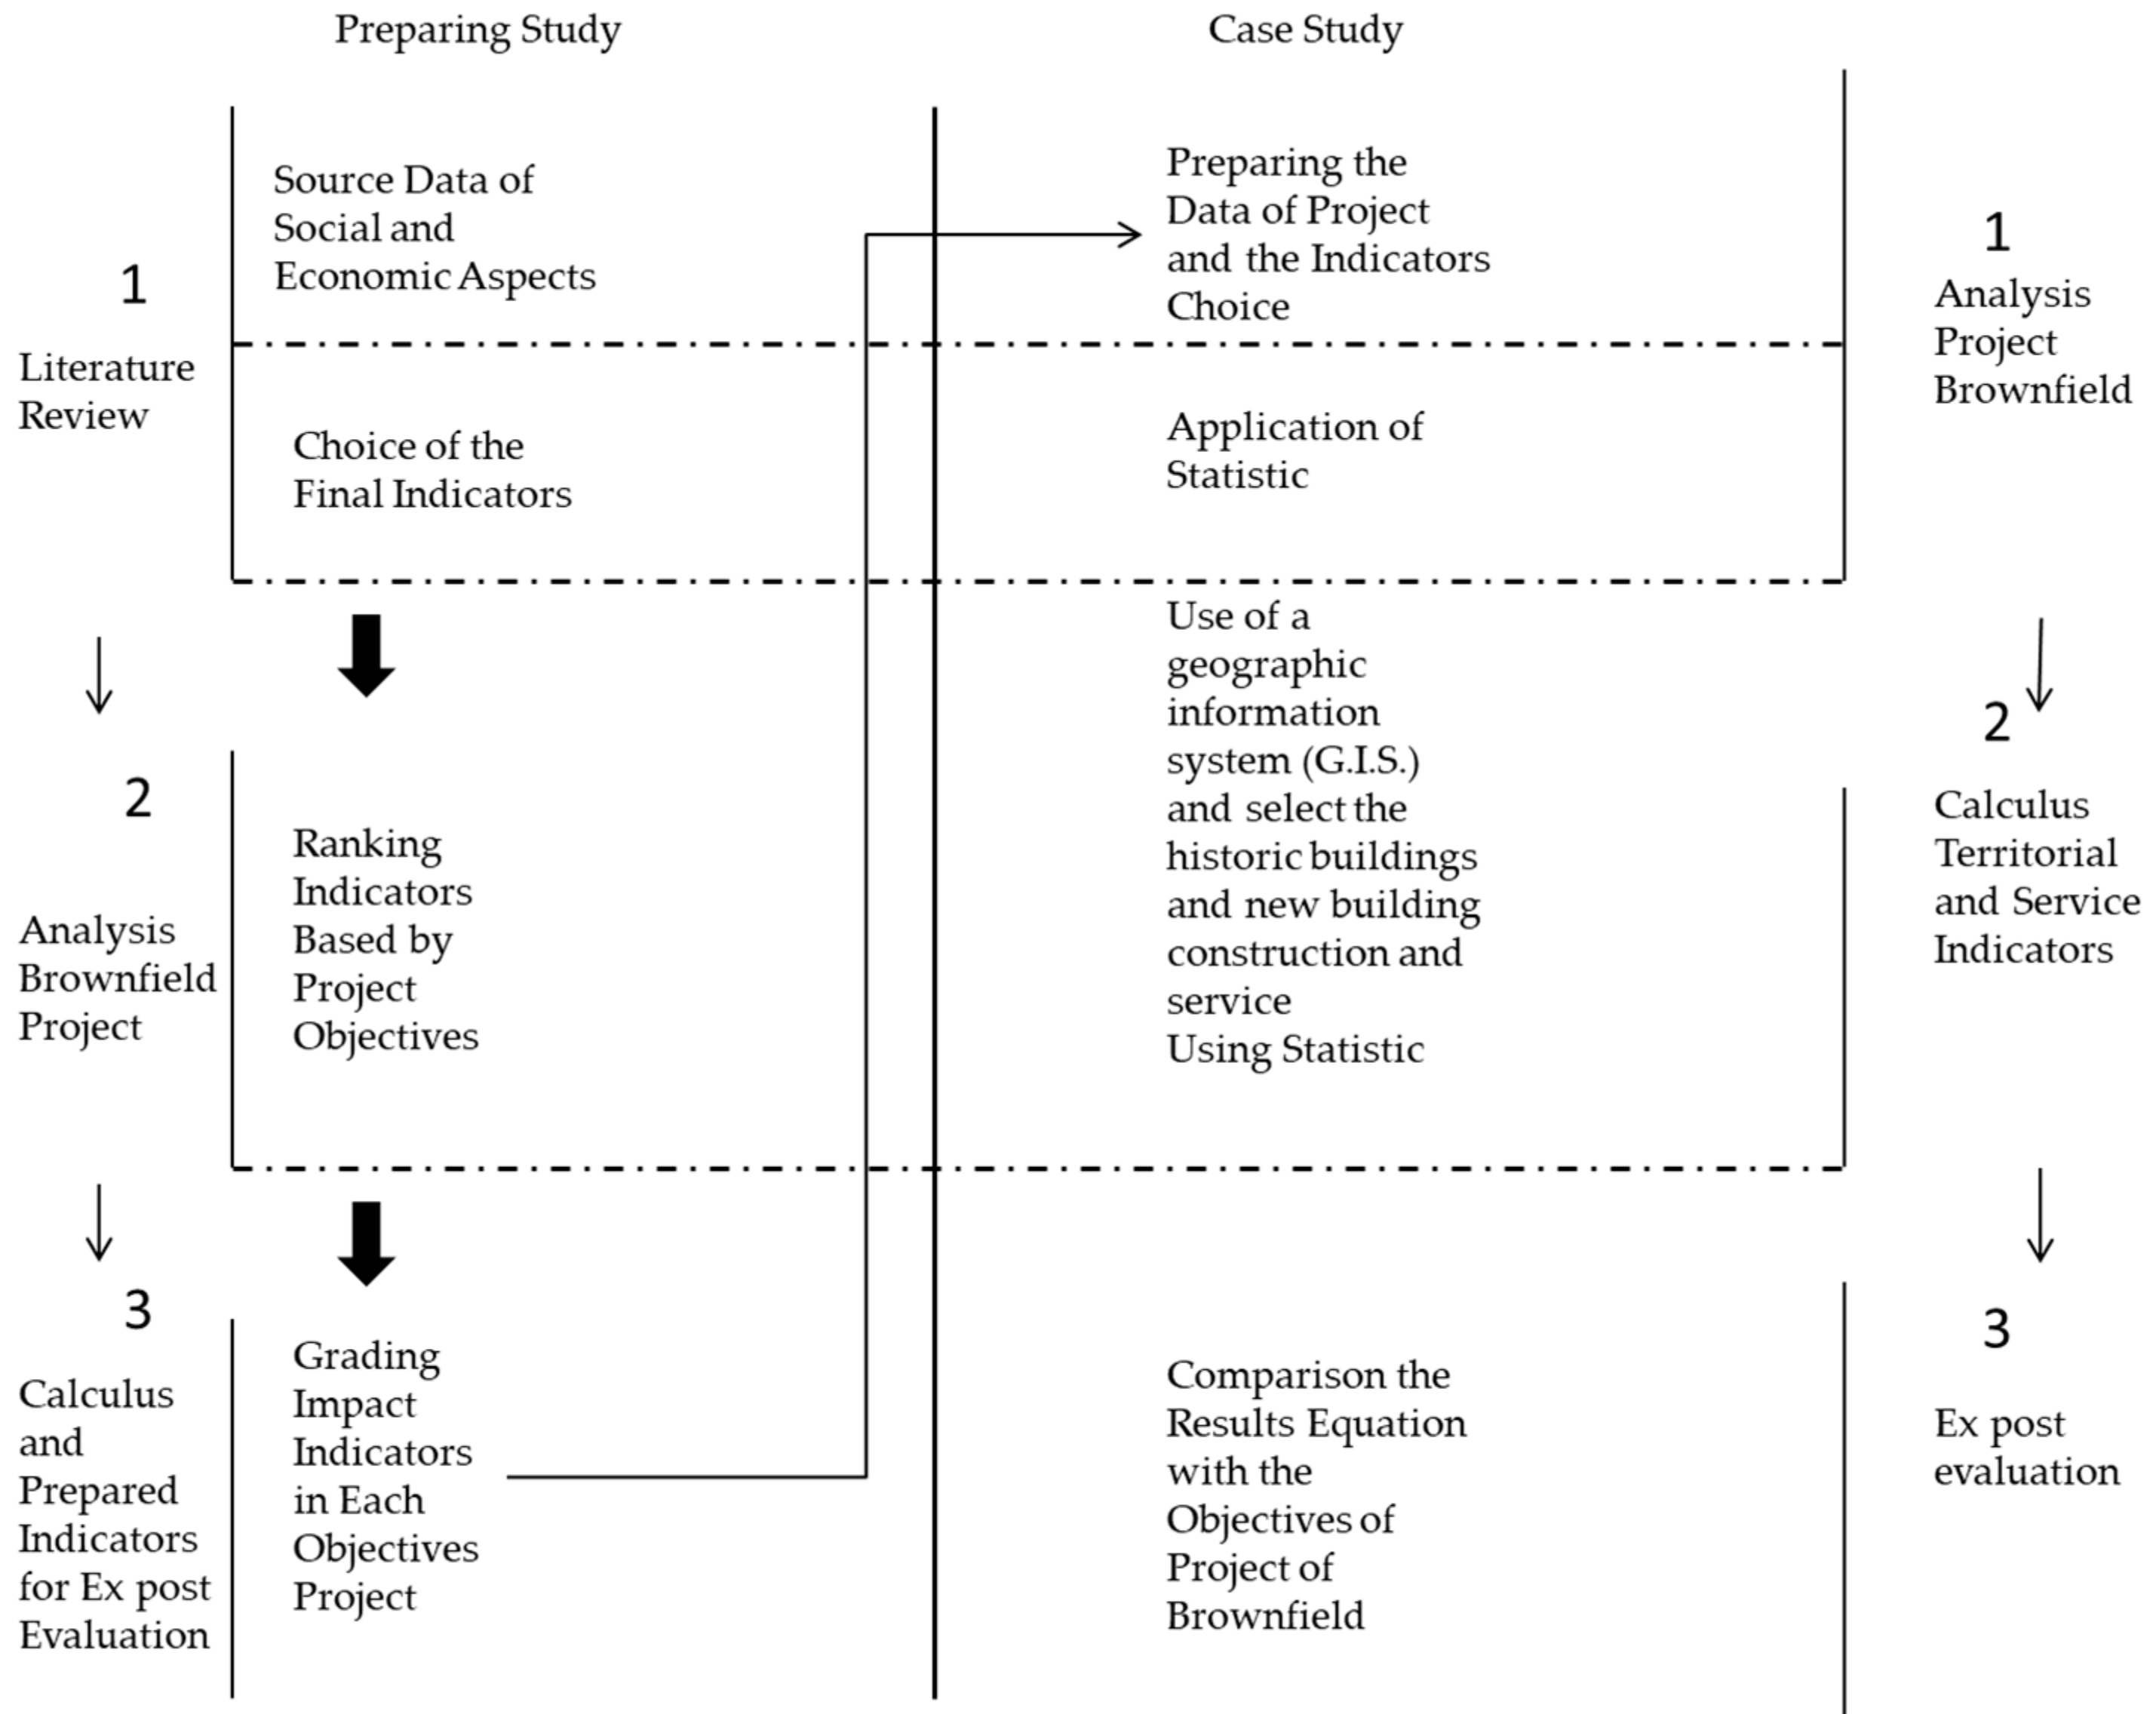
3. Methodology
This case study uses a strategy based on the use of indicators to measure the performance of a revitalization project in an industrial wasteland. The goal is to make an ex-post analysis of the project to determine whether the project’s objectives have been achieved. The methodology consists of three steps, which are outlined in
Figure 1 and described below.
The first step consists of choosing the socioeconomic indicators and collecting the data associated with each indicator that will allow us to select the variables (dependent and independent) with which to measure the indicators for each dimension. The indicators, their sources, and the time series are indicated in
Table 1.
The decision to use these indicators is made, firstly for the ease of retrieving the data, but also because they give a very clear perspective of the actual situation after the revitalization project. The variable of the gross rent (average) gives us an outlook of the level of gentrification and also gives us the opportunity to understand which people have decided to settle in the former wasteland area and their income level. This explains the link between the rent variable and the total family income. The third variable (tenure) provides data to evaluate the project’s performance on housing affordability. The fourth variable (resale price of houses) gives us the opportunity to understand the effect of gentrification and the economic benefits provided to the real estate market.
The second step is devoted to the use of a geographic information system (G.I.S.) that will allow us to trace the project’s boundaries (the selected brownfield) and select the historic buildings and new building construction pertinent to the revitalization project. This identification step makes it possible to determine the magnitude of the project as well as its interconnection with other contexts and/or neighborhoods. The selection and detailed measurement of the areas of each building’s floor space is also conducted here, in order to categorize and note the intended use of each space. This step allows us to fully ascertain the total built space and their characteristics (type and use), as well as to identify the total area available for housing and services.
The third step is the analysis and evaluation of the project. In the analysis stage, we examine the information we have collected (comparing it with neighboring neighborhoods) to better understand the relationships between neighborhoods that share the same characteristics. This step ensures that the information is complete, valid and understandable. After collecting all the data and knowing the results of the analysis in order to make a decision, in the evaluation stage we present the information in both qualitative and quantitative formats. Using the data accumulated in step one and local demographic statistics (see the Formulas (1) and (2)), we will be able to calculate the percentage rental income and the average for each year of our indicators.
In the same step, using an outcome evaluation, we will also describe the progress in achieving our indicators in selected time series. This assessment will indicate whether the project’s objectives have been met, and to what level; for example, determining if the social diversity and the relocation of low-income families planned in the objectives have been achieved.
4. Case Study: Industrial Wasteland of Canal Lachine-Turcot-Petite Bourgogne (Montréal, Quebec, Canada)
The Southwest borough is located south of the island of Montréal. From an architectural point of view, the two urban contexts have similar characteristics to other boroughs. If we consider the different historical stages of development of the City of Montréal and the Southwest borough, we can note that in the borough there is a marked presence of single-family dwellings and buildings (duplex and triplex) which do not exceed the three floors. These buildings were built during the 1850s in the period of pre-industrialization. They are now mixed with buildings built during the industrialization period. This sector has been a catalyst for Montréal’s urbanization and an inseparable part of the identity of the Southwest.
In this last period, in the Canal Lachine-Turcot-Petite Bourgogne sector, there was a strong presence of housing where the architectural features are simple and away from the characteristics of the rest of the City of Montréal and the Southwest borough by the presence of a number of industrial buildings. After the closure of most factories in this area in 1970, there was a migration of residents and the area was abandoned. Until the end of 1990, the sector suffered from a decline in population and economic decay. Household income prior to the brownfield rehabilitation was the lowest in the city and borough (Statistics Canada, 2000) [
31]. A key element of Southwest socio-economic data is the cost of housing. Indeed, the rehabilitation of land can make new housing available, but it is important to ask questions about the impacts of the construction of new housing according to their type and price. A characteristic of people living in the borough is the high mobility of individuals. The borough’s mobility rate is 52% of residents who change housing (Southwest Development Plan 2002) [
32,
33,
35]. This rate is slightly higher than the average for Greater Montréal. Of these moves, only one-third remained in another borough. The Southwest is, therefore, characterized by high mobility within its territory. The average income of the Southwest population is lower than the average income of the island. The average income of a family before the rehabilitation of the brownfield Canal Lachine-Turcot-Petite Bourgogne was
$45,044 and the average household income was
$36,683, both below the Montréal average (Statistics Canada, 2000) [
31]. In addition, the borough ranked third among Montréal boroughs for the lowest household incomes. Finally, nearly 41% of the borough’s population lives below the low-income threshold, the second highest rate in Montréal boroughs. The three main sectors of activity for residents are sales and services with 26.9% of jobs, business, finance, and administration with 21.5%, as well as trades, transportation, and machinery with 12% (Statistics Canada, 2011) [
31]. Compared to the Montréal average, the proportion of the first two sectors of activity is slightly higher at the borough level. Most jobs in the borough’s industrial sector are in manufacturing. They represent 24.2% of borough jobs. The second largest industrial sector in the borough is transportation and warehousing, accounting for 10.5% of jobs, or 3040 jobs (Southwest Development Plan, 2002) [
35].
The Lachine canal industrial wasteland is located in the Southwest borough of Montréal. It has an area of over 1,176,900 m
2 and experienced significant industrial growth beginning in the late 1800s. Since the 1990s, municipalities have realized the opportunities made possible by better managing a city’s transformation. In some cases, cities have implemented laws and regulations to give private companies the opportunity to develop brownfield sites while meeting the requirements of planned urban development. For example, in Quebec (Canada), these powers are granted under the Act respecting municipal industrial real estate (LIIM) of the law on planning and development (LAU) and the Municipal Skills Act (LCM, art. 32, 33, 34, 35, 36) (Ministry of Municipal Affairs, Regions and Land occupancy [
31], and with the orientations of Strategic Plan 2009–2013). The “Affaires municipales et Occupation du territoire” MAMOT [
36] is responsible for supporting the municipalities and promoting a sustainable and integrated approach for the benefit of citizens.
The Government of Canada has put in place other programs for the rehabilitation of contaminated sites. For example, in May 2002, the National Assembly passed Bill 72 (National Assembly – Québec Official Publisher, 2002, chapter 11), the Act to amend the Environment Quality Act Land and other legislative provisions relating to protection and rehabilitation, and, in February 2003, the Council of Ministers adopted The Land Protection and Rehabilitation Regulation [
37]. Recently, the Ministry (March 2017) has set up ClimatSol, a program to help rehabilitate contaminated land in Quebec municipalities [
33].
This brownfield covers a very large area, as it extends for the entire 14 km length of the navigable section of the Lachine Canal. The revitalization project is only concerned with a part of this total area, between Wellington Street (in Griffintown) (located about 750 m from the Old Port) and the Cote Saint-Paul locks, a length of about 4811 m. The Lachine Canal, inaugurated in 1825, opened the upper Saint-Lawrence to navigation and played an important role in the development of Western Canada (source: Parks Canada and the City of Montréal). The first canal rehabilitation was carried out by the Department of Public Works Canada, which built a bicycle path in 1977 as part of “ACTION 77” to create an urban recreational park. The management of part of the canal by Parks Canada in 1978 helped to rehabilitate and save the environment around the canal. The revitalization of this industrial site is not yet finished, but the major work has been done. There are still vacant and contaminated areas in this neighborhood, posing several problems for the local government and the community. However, the Lachine Canal is also one of the most strategic locations for future development and economic revival in the borough. The indicators selected to evaluate this case study: gross rent, total household income, housing tenure, and resale price of houses, were chosen because they are interconnected with other dimensions such as the interconnection of indicators.
Project sponsors included: Parks Canada, the City of Montréal and several private partners. Initially, the project cost more than
$120 million. The Government of Canada, the City of Montréal and the City of Lachine have invested
$100 million in a variety of revitalization works which will transform the landscape of the Lachine Canal and surrounding area. These public funds generated private investment of about
$250 million (Government of Canada—Parks Canada) [
33].
In
Table 2 the project objectives and indicators used associated with each orientation are described.
The initial objectives of the project (derived from the Montreal City—Southwest District Development Plan, 2002 and the Montréal Master Plan—Synthèse des orientations Mars 2011) [
35] were as follows: (1) To allow the residents (low-income) of the borough to settle in industrial wastelands; (2) improve the existing built environment; (3) conserve and revitalize historic buildings and convert them; (4) increase affordable and social housing; (5) improve the economic situation of the neighborhoods surrounding brownfields; (6) improve inclusion and the social mix. As shown in
Table 3, these indicators generally measure economic factors, but these factors are also interconnected with social aspects. This list is not comprehensive enough for a complete ex-post evaluation, but it is sufficient to determine some responses about the project objectives and to assess its performance from a socio-economic perspective.
The selected indicators also include the neighborhoods bordering the industrial wasteland, in order to understand the differences between the territories that were not involved in the revitalization project. In this context, we also included the adjacent boroughs and municipalities on Montréal Island (
Table 4).
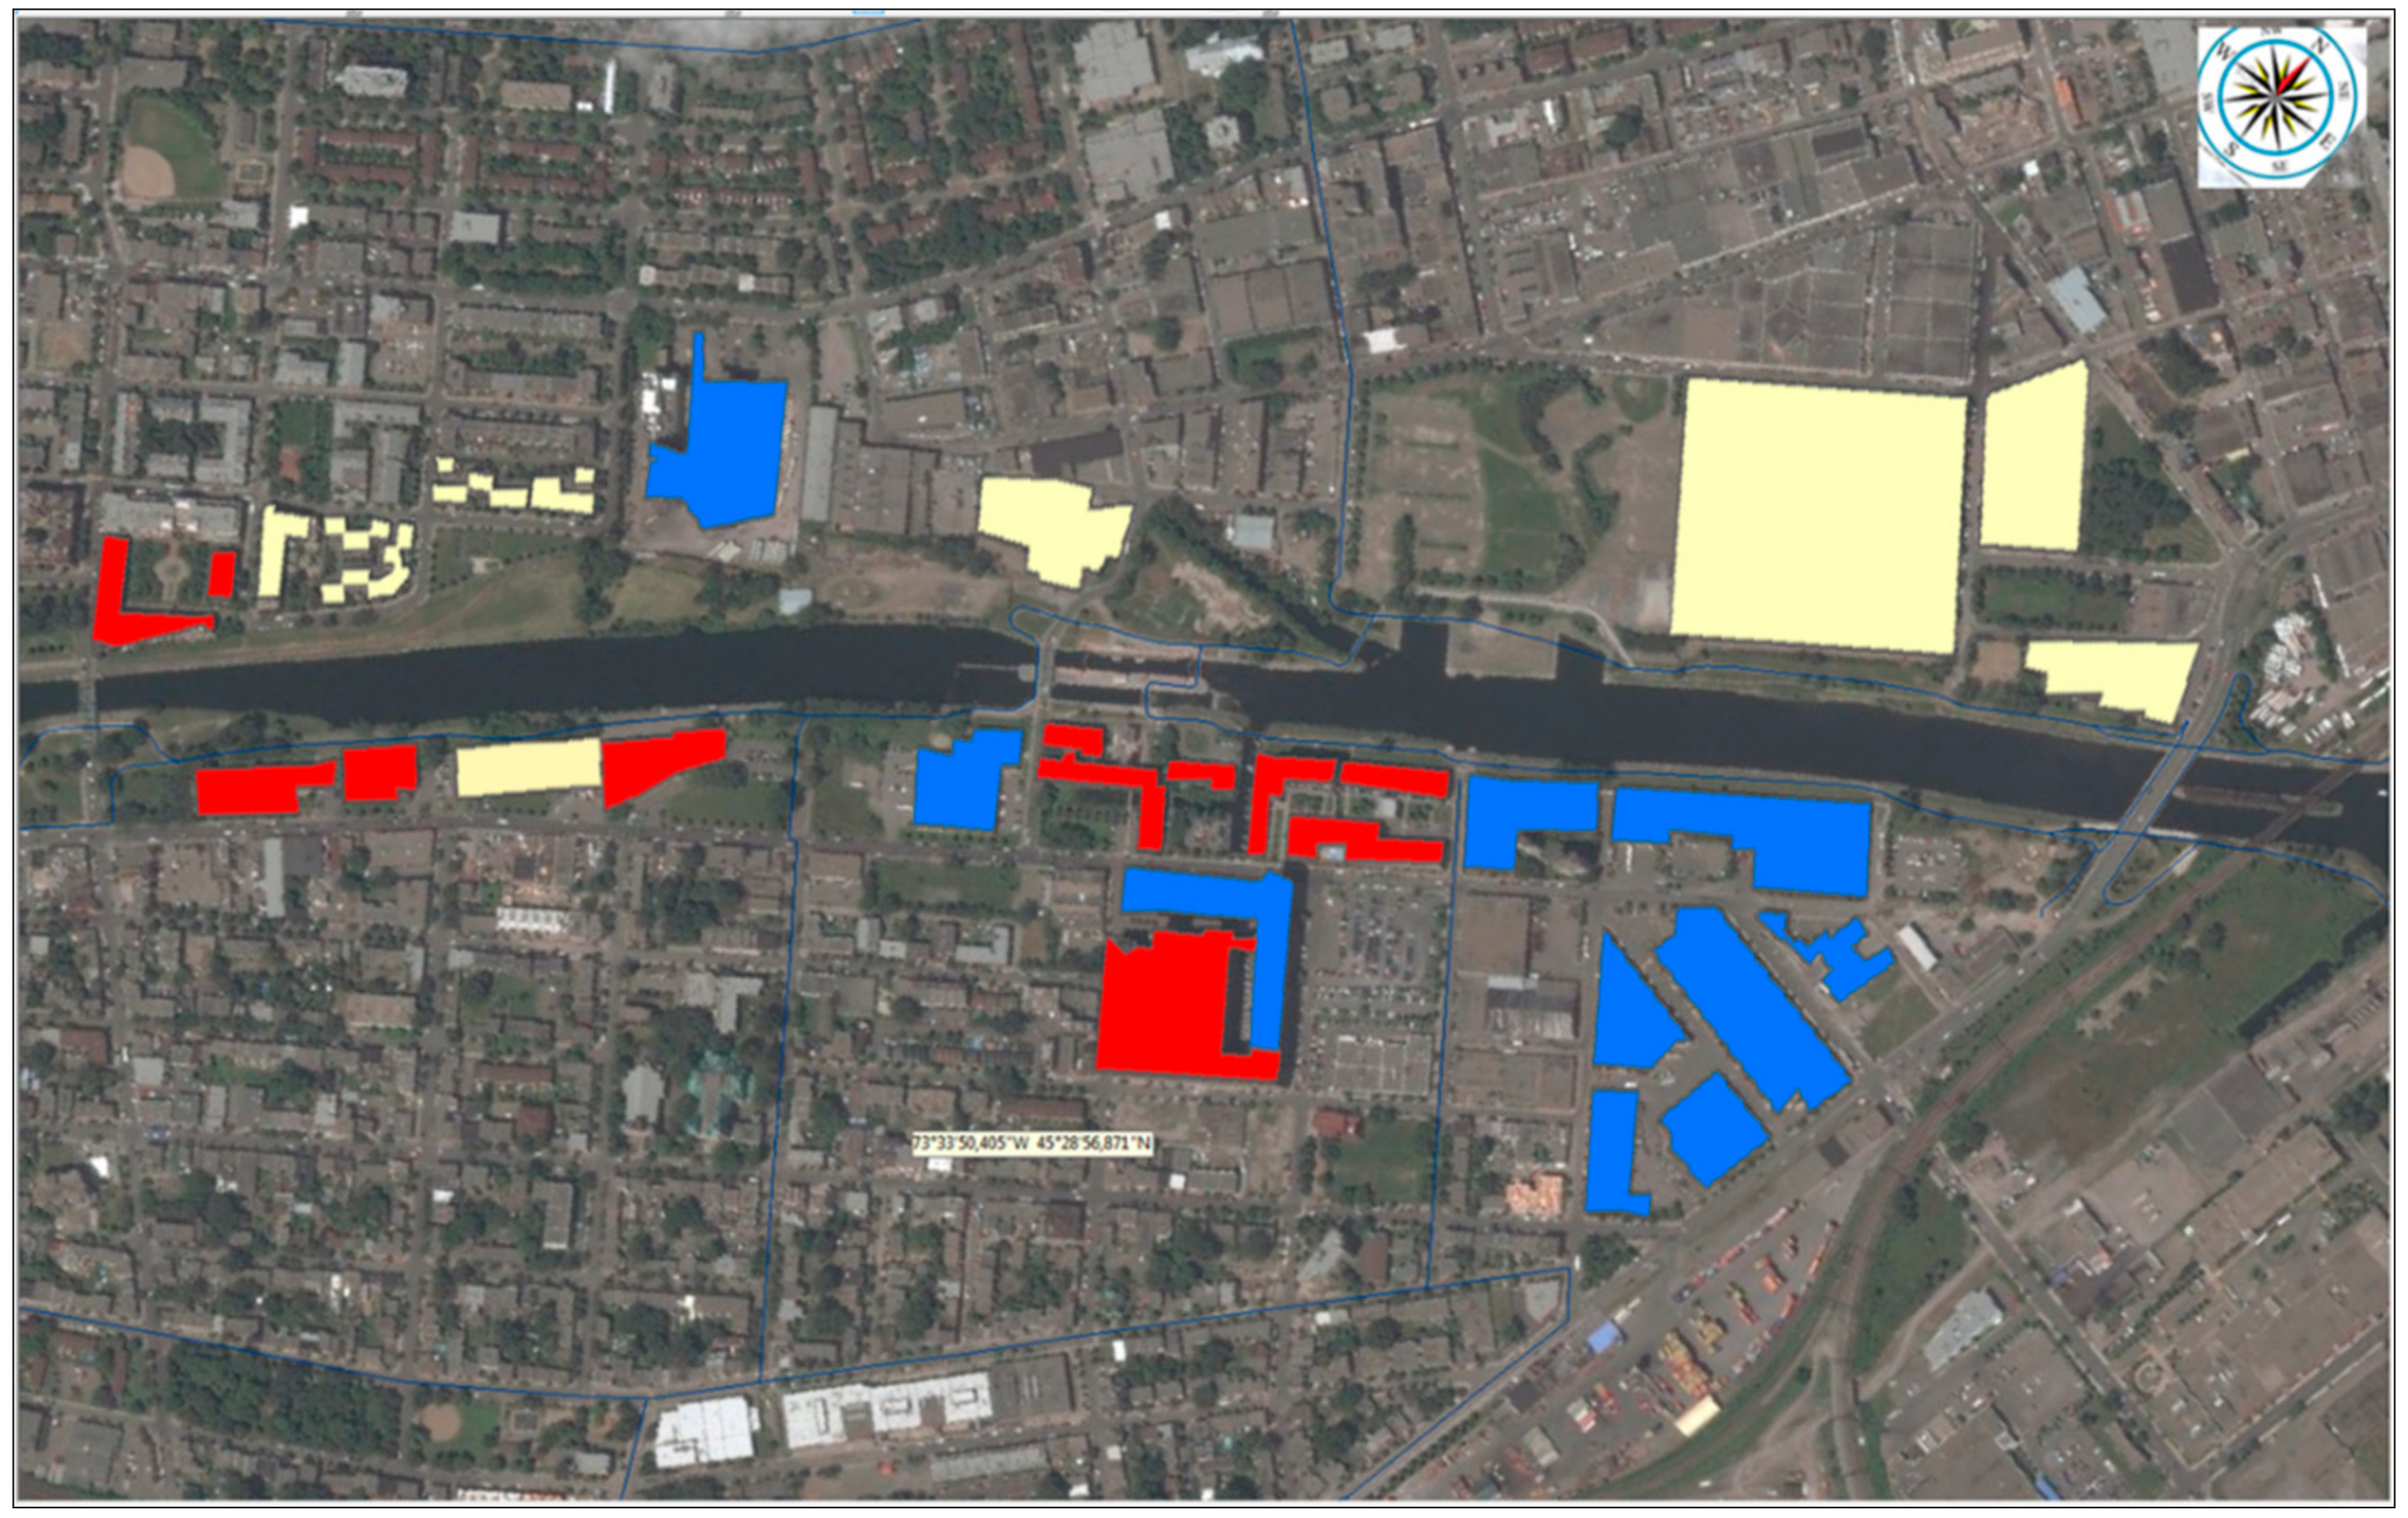
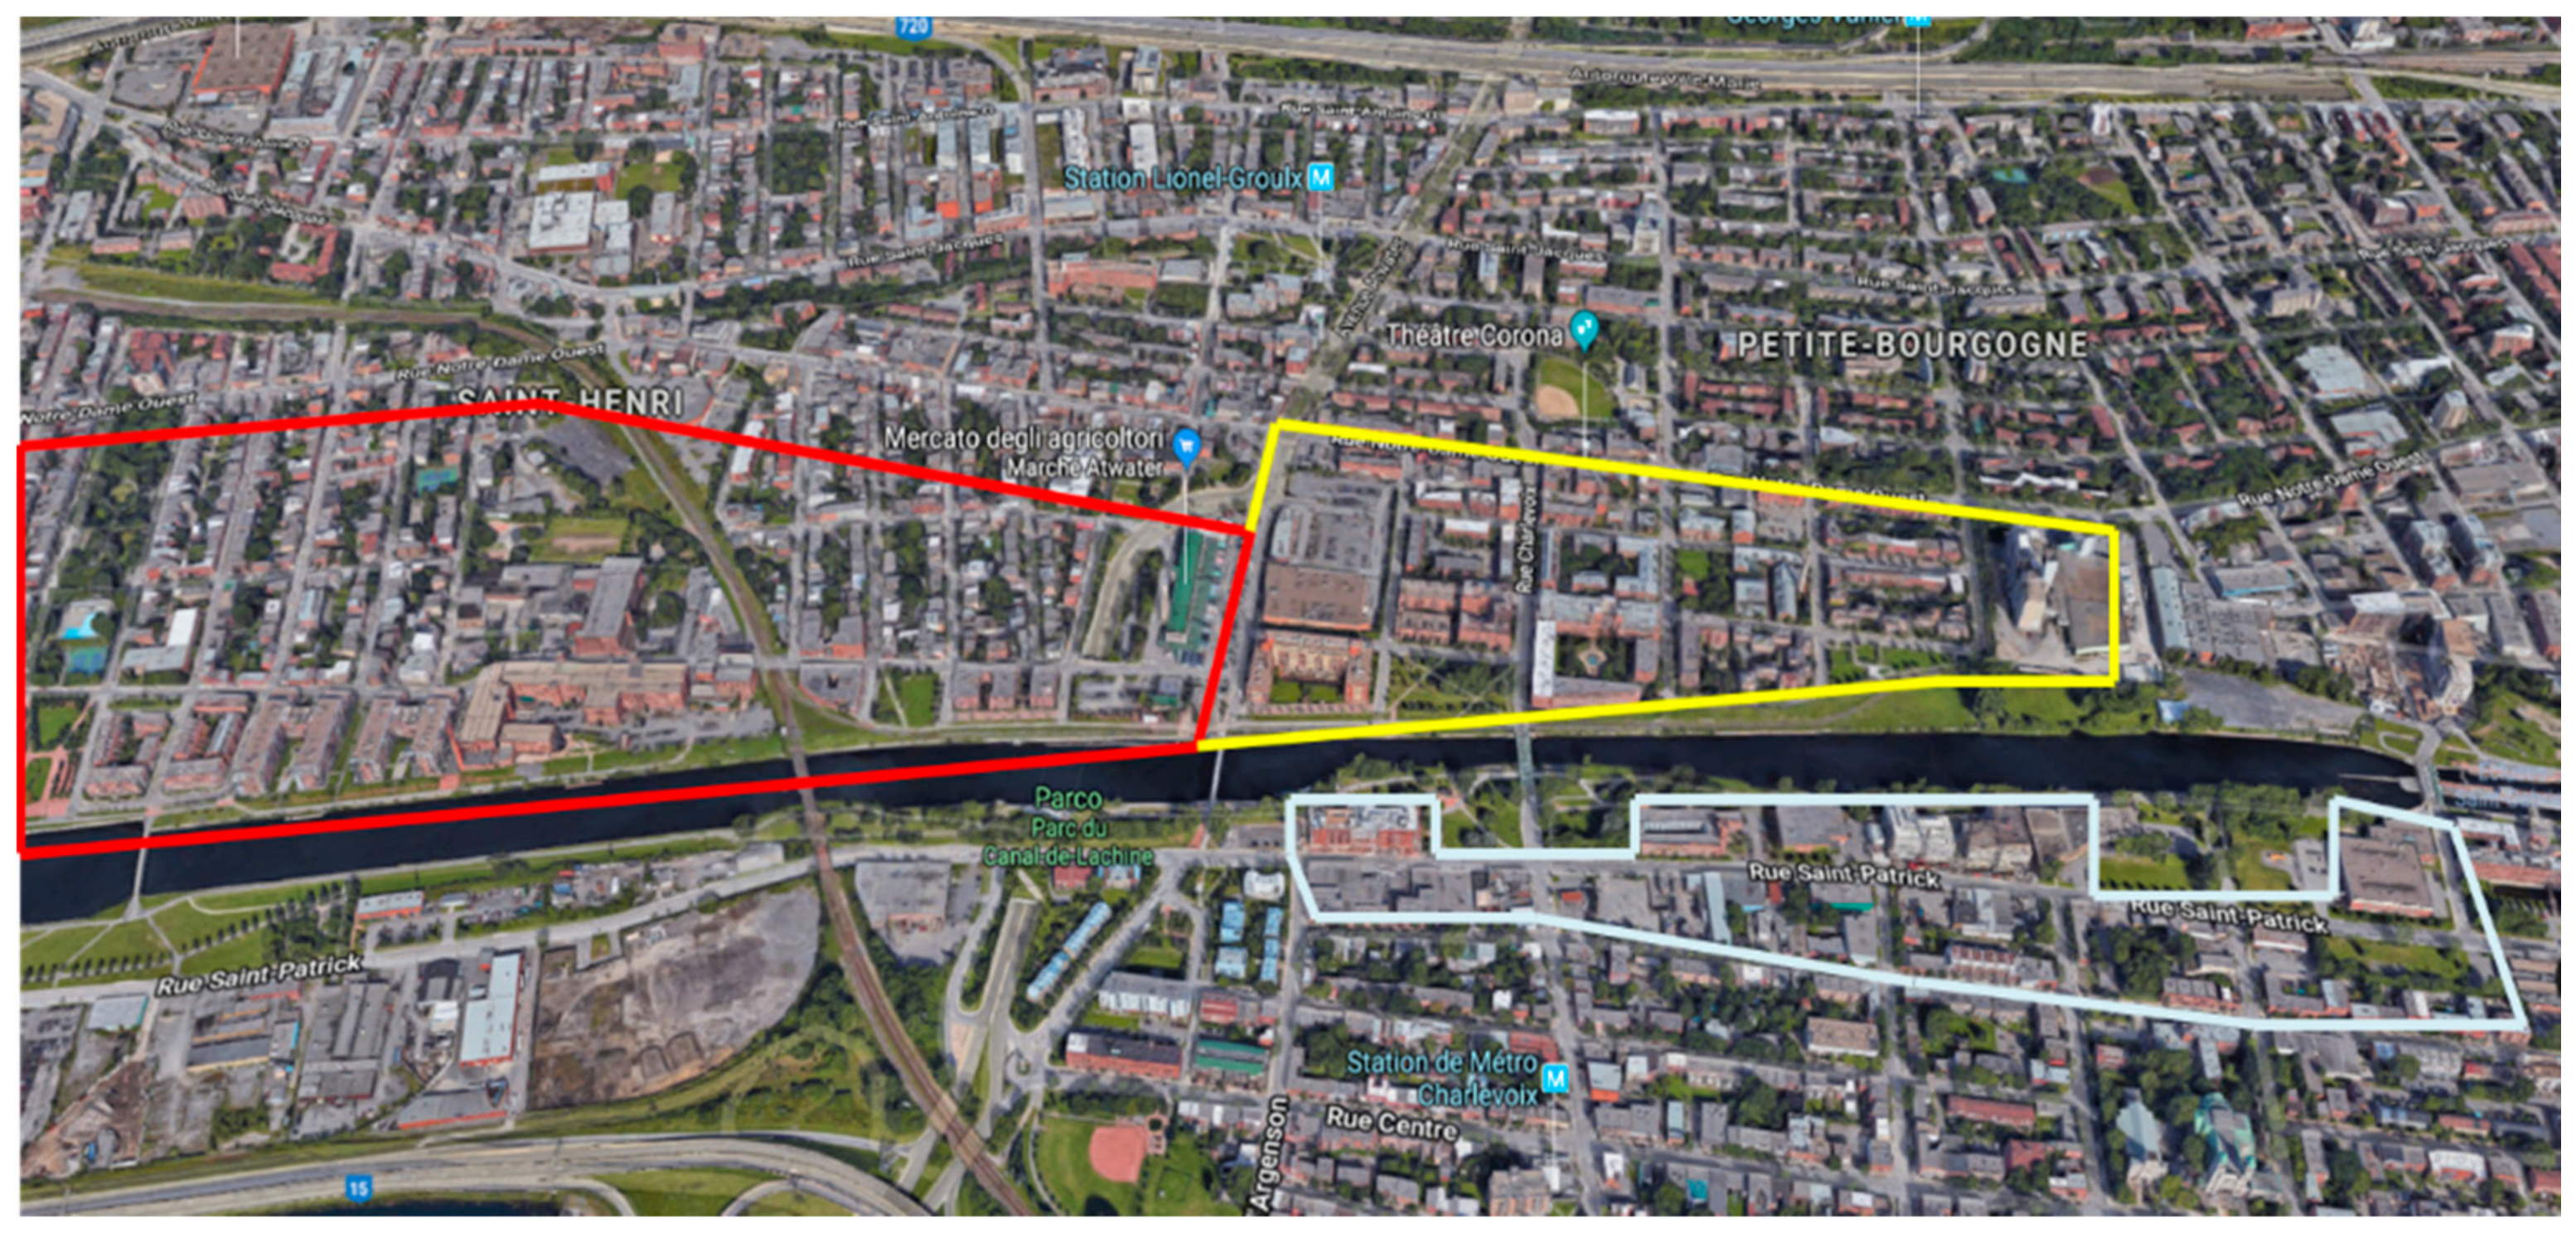
In the second step, with the use of G.I.S., we selected the territorial dimensions associated with the brownfield and identified the buildings located in the industrial brownfield. The purpose of this step is to classify the historical buildings that were involved in the revitalization, the newly-constructed buildings and their purpose, and any non-abandoned factories that are still in operation (
Figure 2).
Figure 2 shows a part of the industrial site in which all of the buildings have been identified according to their category and indicated with different colors. Historic buildings that are still used for industrial purposes are in blue. Only one historic building remains, that of Canadian Bag (Canadian Bag, 1913), a company that manufactured jute and cotton bags. In 1989, it was converted into a housing cooperative for low-income families (this is indicated in red). The restored buildings that are intended for commercial and residential purposes are in red, newly-built buildings intended for commercial and residential use are in yellow, and buildings designated for affordable housing are in green (the last is indicated in
Table 5). As demonstrated in
Table 4, with the use of G.I.S., the interior areas were calculated for each category of building.
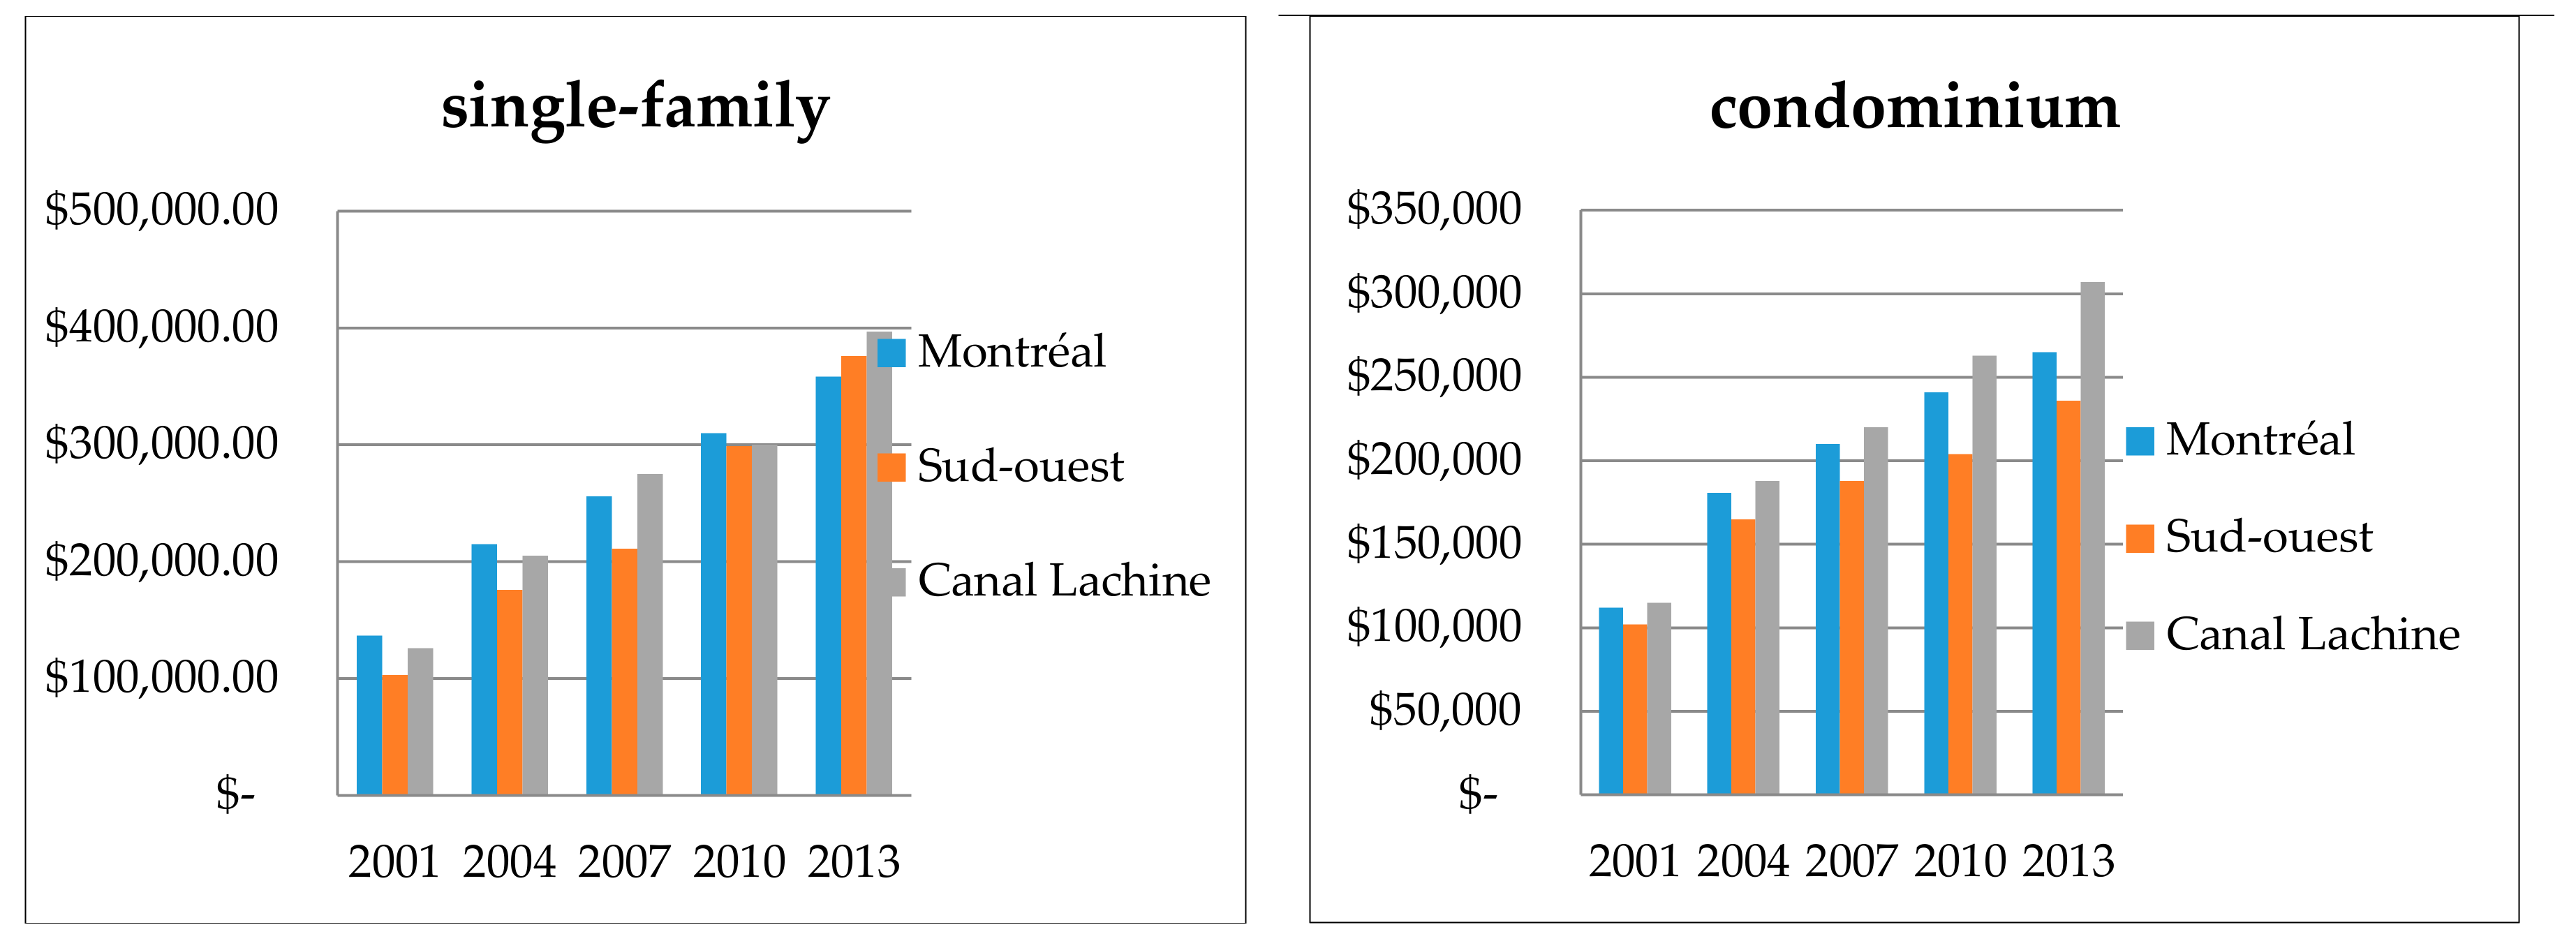
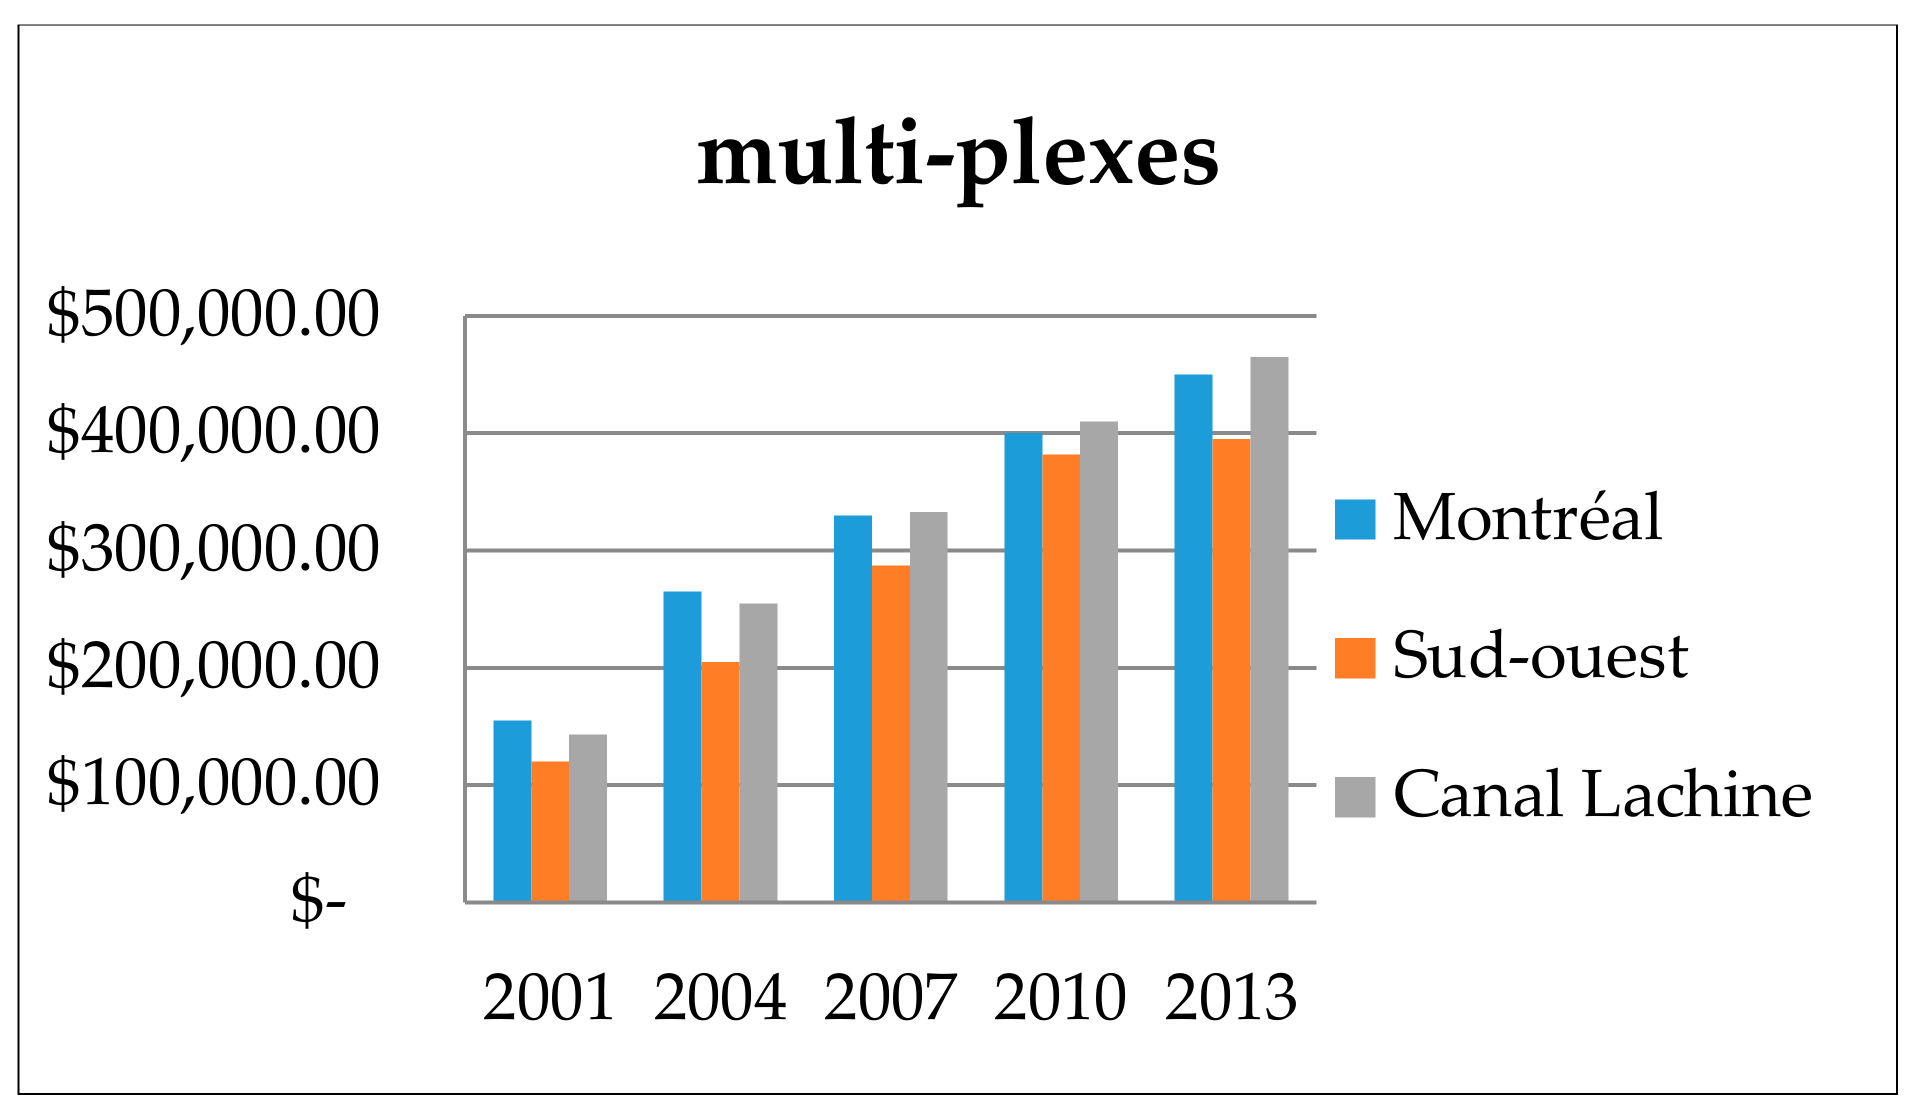
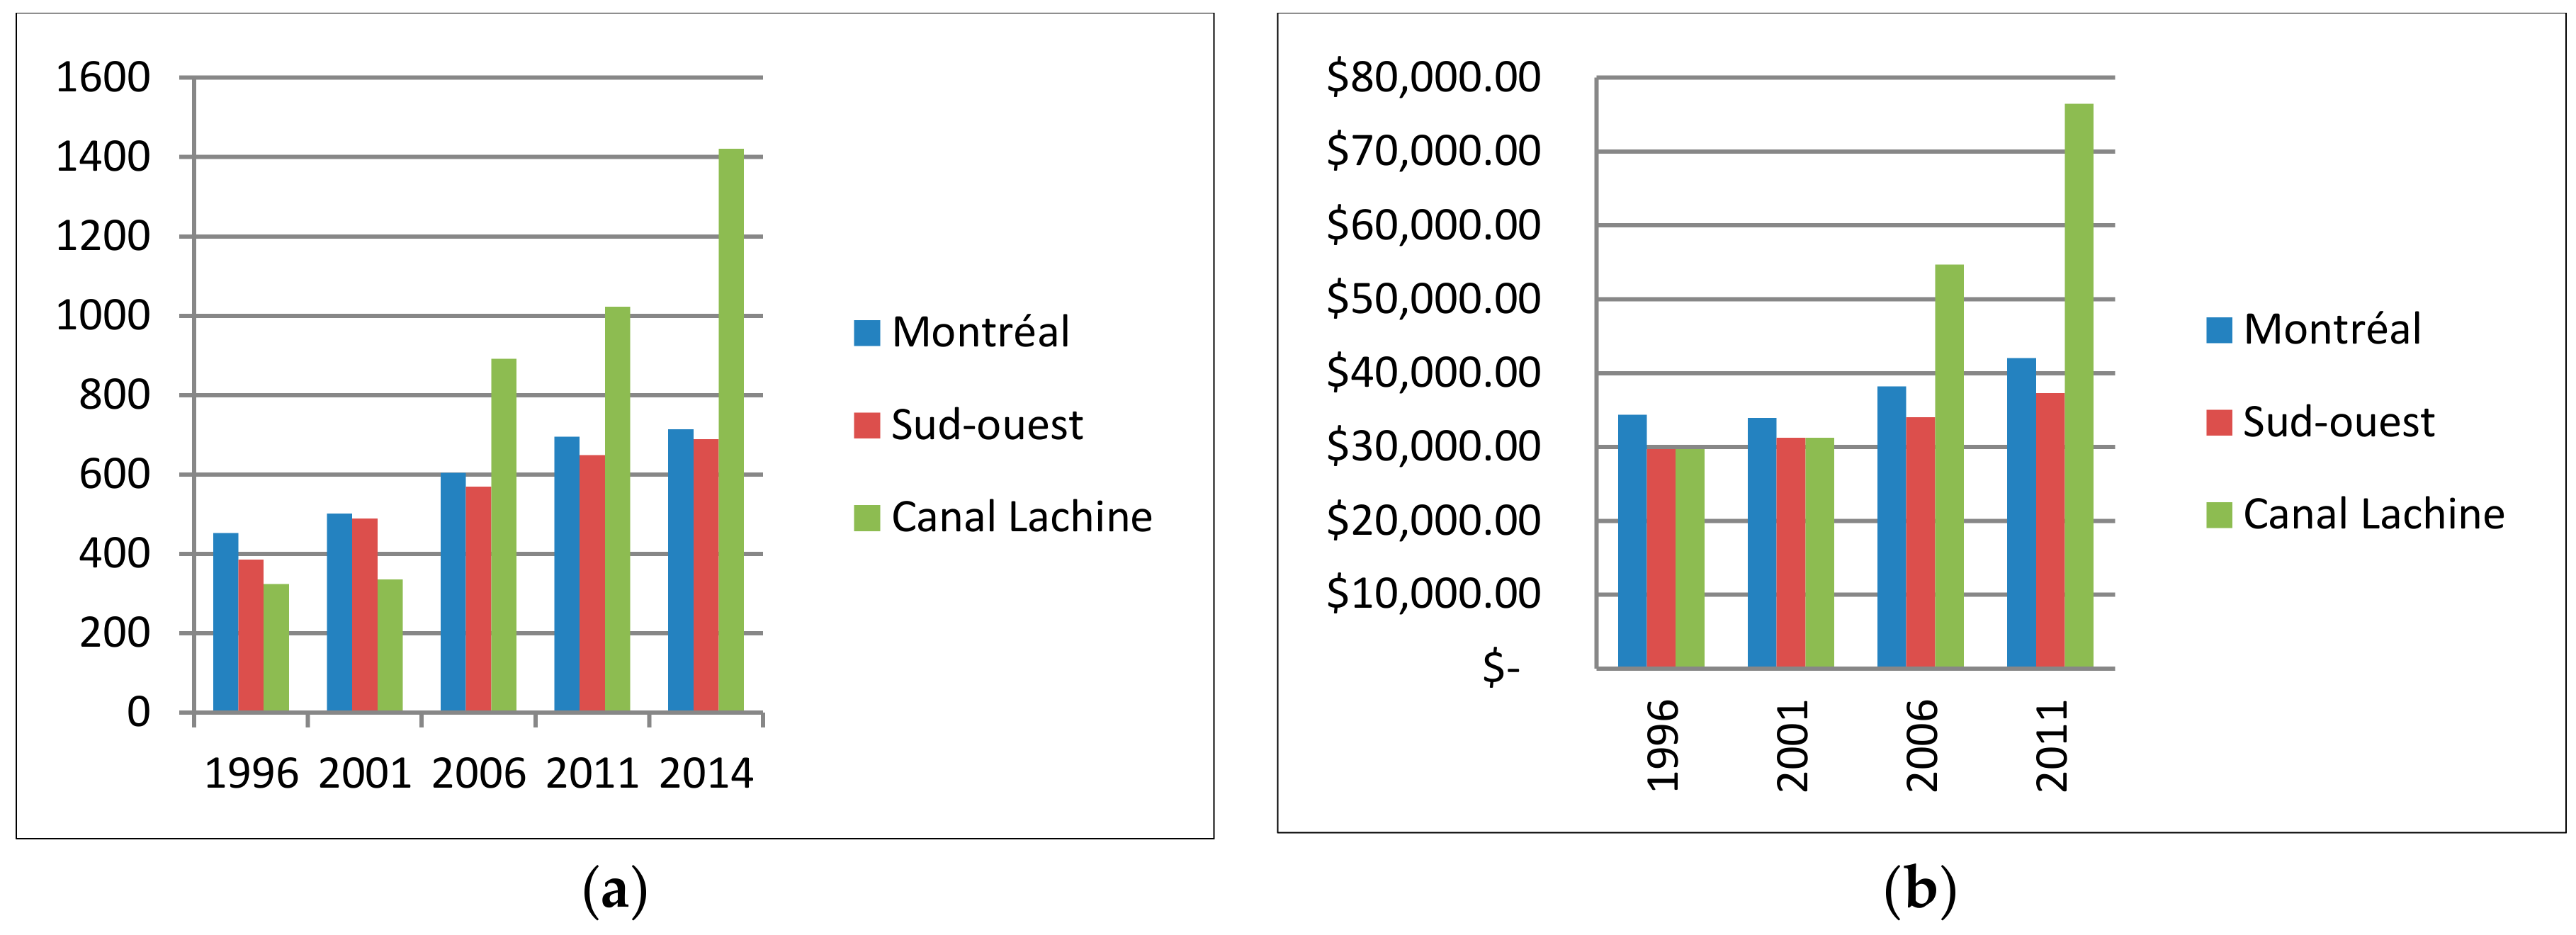
Next, as shown in
Figure 3 and
Figure 4, using municipal statistics and RESO (2002) data, we compared the resale data of three types of dwellings (single-family, condominium, and duplex). We have taken into consideration the Southwest, brownfield canal Lachine, and the City of Montréal data as they relate to the period 2001–2013 in order to observe their trends.
The second part of the second stage is devoted to the construction of graphs for each indicator and their association with neighboring districts. This last step allows the brownfield zone to be compared to other boroughs around the brownfields, as they have the same characteristics of constructions and in the past they were also influenced by the industrial park. The final phase of the case study (third stage) is a comparison of the results with the project goals to assess its performance. First, we calculate the socio-economic indicators using a calculation equation and our analysis of the collected data. We then analyze the results and compare these results with the objectives of the revitalization project. This assessment allows us to verify which objectives were attained and which were not, and to what degree. As
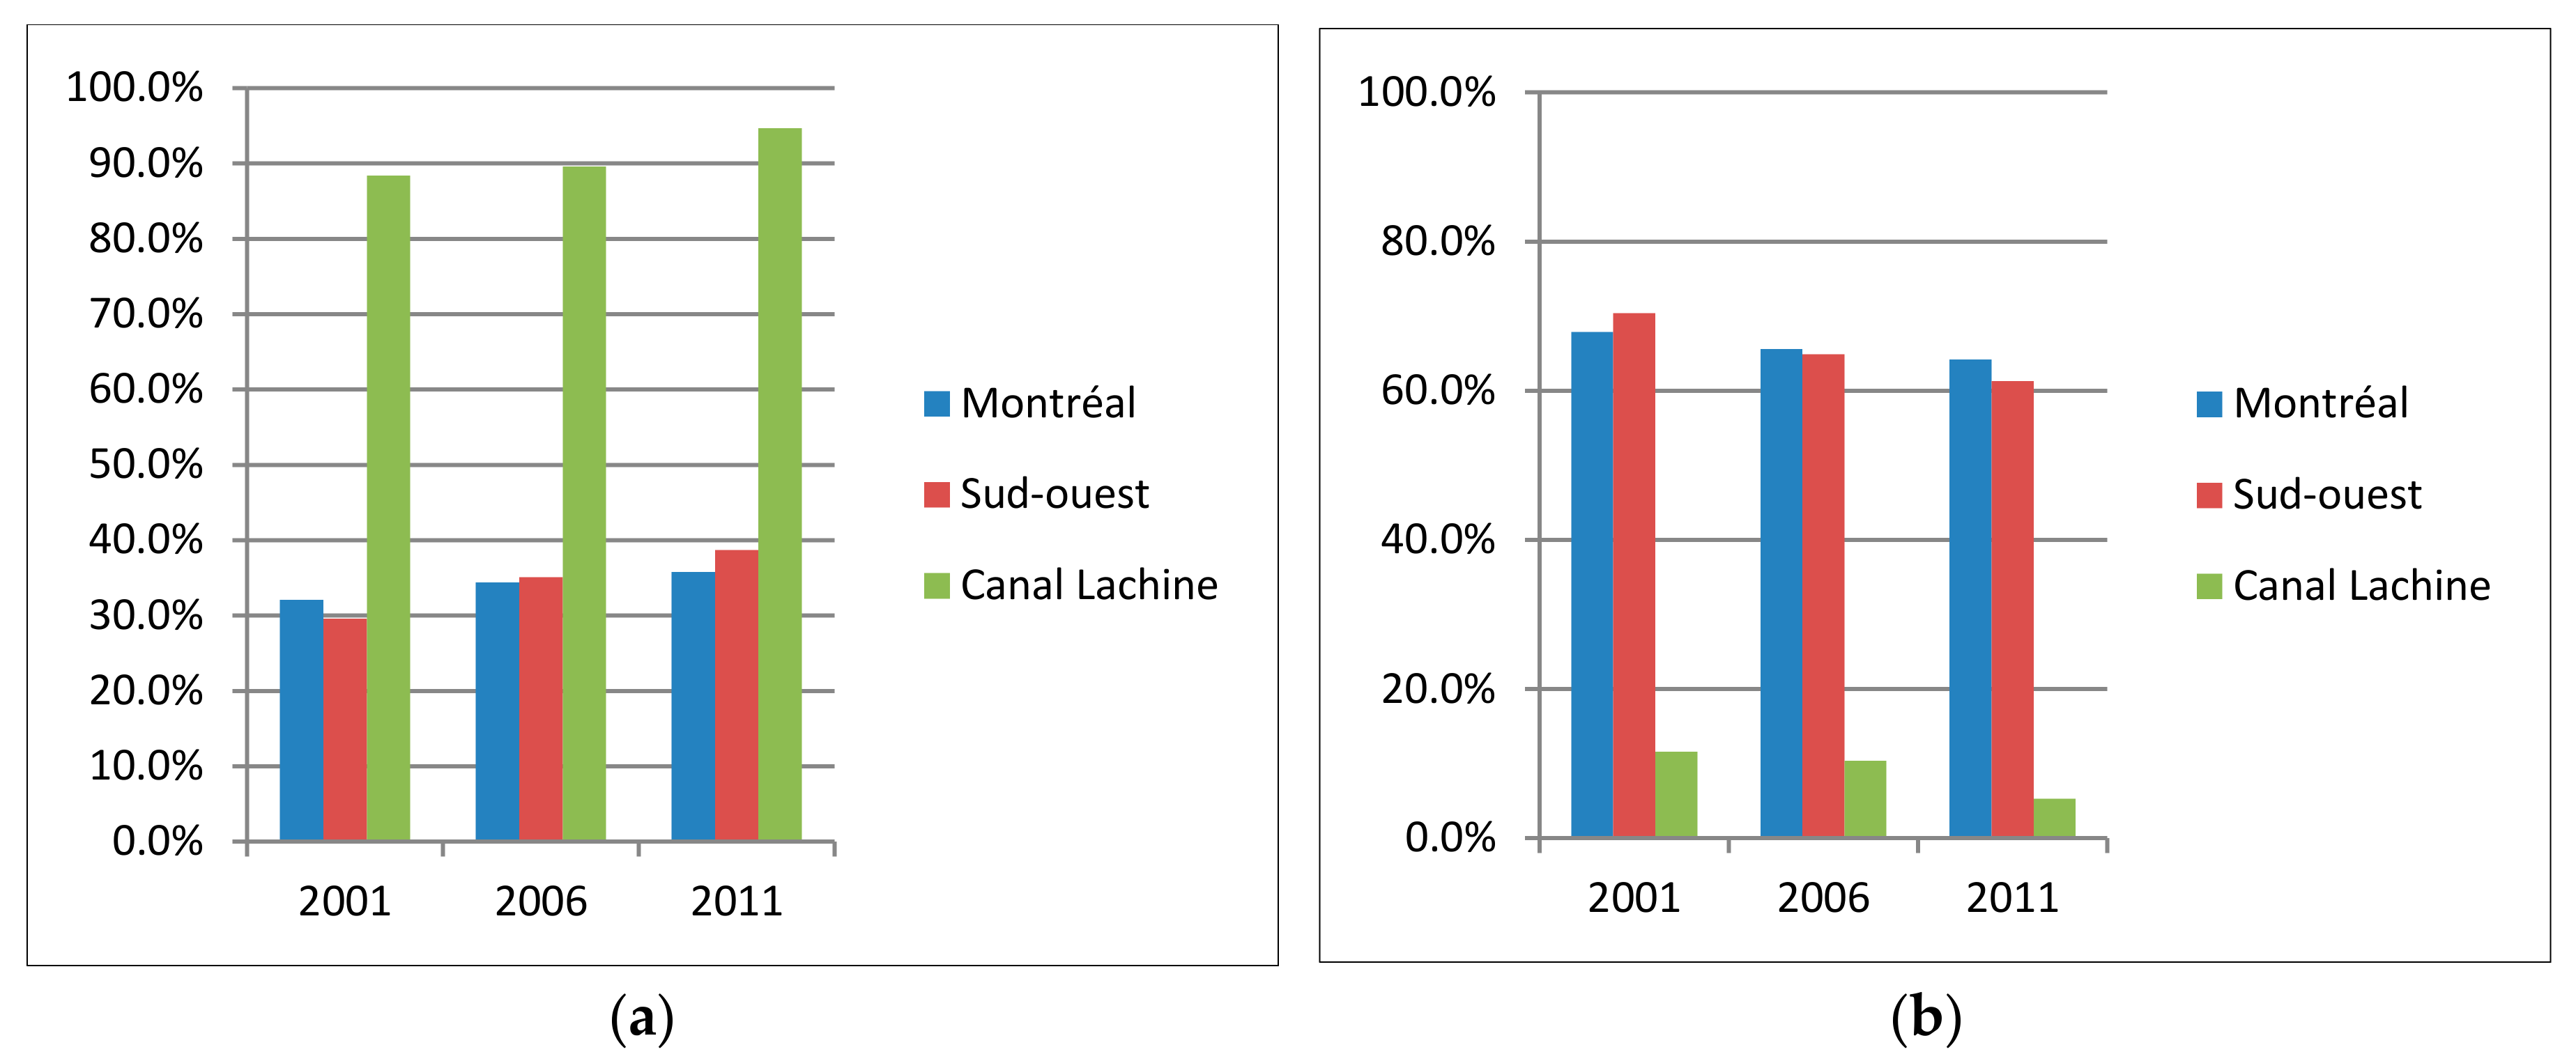
Figure 5 shows, the average rent increased significantly four years after completion of the first phase of this housing project. The major increase was 165.47%, which occurred between 2001 and 2006, when the average percentage increase in the borough was only 16.35% for the same period, similar to the increase in the city of Montréal (16.88%).
This very high rent increase explains why there are few average-income families in the newly developed site, whereas the objectives (socio-economic benefits, Southwest District Development Plan, 2002—City of Montréal) included finding new solutions for these families. Similarly, we can see that the percentage of owners who live within the former industrial site rose from 89% to about 95% within 10 years.
The desired social diversity was clearly not met; not even medium-income people or families had access to a home in this project. In the rest of the Southwest, the rent increases are in line with those of other Canadian cities and especially with the city of Montréal. Rents did not increase significantly in the period 2006–2011, in fact, the 14.68% rent increase in this brownfield development was in line with the borough’s 14% (
Figure 6). However, for the period 2011–2014, the rents increased dramatically in the Canal Lachine post-industrial area, while the percentage of rent increase in the borough was comparably much lower at 6.16% (
$1421.00 in the Canal Lachine area compared to
$689.00 in the borough overall). In addition, from 2011–2014, the percentage of home ownership has been consistently much higher in this development than in the rest of the district and in the city of Montréal.
6. Conclusions
As part of this study, we had the opportunity to have occasional information on the rehabilitation project and compare it to the scale of the entire borough and to the city. Given the major interventions that were undertaken, we wanted to better understand the improvements made and also to determine if the initial objectives that were the basis of these transformations were achieved. We focused the urban rehabilitation analysis on four indicators that gave us an opportunity to assess these improvements in the built environment, in community life, and in the opportunities for citizens, even those with low incomes, to settle in the community. In each of the indicators, the effect on the wasteland was studied and compared to the corresponding objectives. Based on census and statistical data at several scales, we used an ex-post evaluation that allowed us to make interesting comparisons. Our analysis has concentrated on these qualitative analyses and spatial analysis tools. Using our four indicators, we noticed three weak points in the decision-making processes and in the effort to improve brownfields. These three points are (1) the lack of the use of local indicators to measure the benefits to the community; (2) the difficulty of integrating the participation of all stakeholders in the decision-making process; and (3) the lack of the use of an effective methodology that persists in all phases of the project for decision-making and to achieve pre-set objectives.
We have seen, from the statistical data, that the redevelopment project has had a direct influence on the value of the buildings and, therefore, on the rental and sale prices and, thus, the arrival of high-income households. However, we cannot observe that wasteland rehabilitation has had the same effects close to the site. Socio-economic variables have shown that they change exponentially, but each of the variables is primarily characterized by its connection with other characteristics of the brownfield (environment) as well as by its location (downtown). We also observed that gentrification had a significant effect that is related to the indicators studied. From the results of this case study, we are able to say that brownfield remediation has enormous potential for revitalizing and improving community life and opens up opportunities for thoughtful city planning. However, to have a positive overall impact, brownfield development must be planned with the use of local indicators (contextualization) and the participation of all stakeholders. It is also essential that each actor must intervene in the project phases concerned and throughout its development. Effective methodology and evaluation tools can help all stakeholders in decision-making.
Applied to the Canal Lachine-Turcot-Petite Bourgogne case study, the proposed approach makes it possible to highlight the evolution of the socio-economic characteristics of the revitalization of a brownfield from indicators accessible from the public statistics data. Therefore, the approach can be used in other places or countries because it takes into account the context of the site and the use of local indicators.
In any research related to the quality of the urban environment, it would be interesting to study more sites in order to draw general conclusions. It would also be useful to study in more detail the transformations of the built environment, which makes it possible to better characterize the transformations of an environment. In another order of ideas, it would also be interesting to study certain environmental aspects related to the concept of sustainable development, such as changes to access to services in the most isolated parts of a neighborhood.
In addition, examples of future practical work include the development of a methodological approach that takes into account project objectives and local expectations, using local indicators. The future practical application of the methodological approach needs to be further developed, tested, and driven by research. The scope of the study could be expanded to include other innovative approaches to project evaluation by using appropriate indicators. A methodology similar to the one presented here could be used to support the analysis of urban improvements.


