1. Introduction
Transformations in the agri-food system in Mali, as in other sub-Saharan African countries, are occurring in response to demographic and socioeconomic changes. Over 40% of the Malian population now lives in cities and per capita income is increasing by 4.5% a year [
1]. The increasingly urbanized Malian population, combined with the growth in disposable income, is bringing major changes in lifestyle and diet. There is an unprecedented demand for diversified and easy-to-prepare foods. In the region, urban consumers are shifting away from unprocessed staples (e.g., roots and tubers) and towards processed rice and wheat-based products (e.g., noodles, pasta, and bread) [
2]. Income increases are also associated with growth in foods with high-income elasticities of demand, such as meat, dairy products, and fruits and vegetables [
3]. These changes have important implications not only for food and nutrition security but also in terms of employment opportunities, notably in the processing and retailing segments of the agri-food system [
4]. Processed foods have played a central role in diet transformation in Eastern and Southern Africa [
5] as well as in agricultural value chains and retailing modernization in Asia and Latin America [
6]. Yet, little is known about the diversity, country of origin, availability, and affordability of processed food items in Mali, or even in the entire West African Sahelian region.
Only a handful of studies have inventoried processed foods in the retailing segment of sub-Saharan Africa, including in Tanzania, Ghana, and Nigeria [
7,
8,
9,
10]. Product diversity and country of origin for diverse processed food categories—analyzed across retail outlets—were at the core of these studies. One common finding is that imports remain prevalent for some categories of processed foods. However, the categories, in which imports appear to outshine locally-processed foods, vary from one country to another. This may suggest that countries are more likely to process the commodities that they produce the most, which raises the need for more cross-country comparisons.
Building on these recent studies, we conducted a city retail outlet inventory of processed dairy and grain products in four major cities of Mali in 2016 in order to examine the scope and scale of the ongoing agri-food system transformations. The inventory focused on these groups, since cereal grains remain the principal component of the Malian diet and demand for dairy products is growing fast. In fact, Zhou and Staatz [
3] estimated a large trade deficit for dairy product in the region, due to the combination of rising income with high income elasticities of demand and slow growth of local production. This study contributes to the sparse literature by documenting the diversity and country of origin of processed food products in a land-locked sub-Saharan African country that is characterized by a high level of poverty. We are able to address important questions, such as whether supermarkets carry local processed foods.
Our study also includes methodological enhancements that enable a deeper analysis of the state of retailing of processed foods in Mali. First, we inventoried all product types within the grain and dairy categories. In contrast, the inventory in Tanzania focused on selected grain and dairy product types only [
7,
8]. Second, the inventory included information on product size and price and was conducted across retail outlets located in low-, medium-, and high-income neighborhoods of the four largest cities of Mali. This allows us to additionally compare the pricing of processed dairy and grain products across retail outlets (e.g., modern supermarket versus open-air market), cities (e.g., the capital versus secondary cities), and neighborhoods (e.g., open-air market in a high-income versus open-air market in a low-income neighborhood of the same city), while controlling for several product characteristics using hedonic regression. To our knowledge, very few studies have used similar methods to investigate urban consumer prices in Africa. Among the exceptions are Assefa et al. [
11] and Minten and Reardon [
12], who examined urban food retailing prices in East and Southern Africa. Second, in addition to prices, information on product ingredients, packaging materials, and labeling (e.g., the presence of barcodes and date stamps) was collected, allowing us to examine aspects related to food safety, healthfulness, and competitiveness. Until now, those aspects have received little attention.
2. What Does “Processed Food” Mean?
The retailing of processed foods is an important indicator of agri-food system transformations, since it is one of the first food categories to be adopted by modern retailers and widely demanded by urban consumers. Compared to fresh food, processed foods are low-risk for retailers due to their low perishability and are highly valued by consumers for their shelf life, consistent quality, and ease of preparation and consumption. The International Standard Industrial Classification (ISIC) [
13] classifies processed foods into seven top-level categories: (1) processed meats; (2) processed fish, crustaceans, and mollusks; (3) processed fruits and vegetables; (4) manufactured dairy products; (5) manufactured grain mill products; (6) other manufactured foods; and (7) animal feed. A processed food category is composed of different types of processed food products.
A processed food is defined as “a retail item derived from a covered commodity that has undergone specific processing resulting in a change in the character of the covered commodity, or that has been combined with at least one other covered commodity or other substantive food component” [
14]. Cooking, chopping, pasteurizing, fermenting, curing, smoking, drying, milling, and packaging are examples of processing activities that change the character of a commodity. Processed foods range on a spectrum from minimally processed (e.g., fresh milk) to heavily processed (e.g., powdered milk). Examples of grain product types include wheat flour, maize-based breakfast cereals, and maize semolina. Examples of product types within the dairy category include pasteurized milk, powdered milk, butter, and yogurt. Within a product type, additional distinctions can be made between flavors, nutritional enhancements, or other key commercial gradations. For instance, yogurt can have many flavors based on secondary ingredients (e.g., peach, strawberry, and plain) and grains can be ground coarsely or finely.
In the food retailing systems of developed economies, the Universal Product Code (UPC) is used to identify unique retail items across retail outlets and represents the most detailed standardized unit of analysis for food products. Given that most processed food items in Mali do not carry UPCs, we approximate this “product” unit of analysis by distinguishing each non-repeating observation with regards to four attributes: (i) product type; (ii) manufacturing company; (iii) product name, and (iv) product size. The inventoried product names most often capture second-order commercial gradations as described above.
3. Data Sampling and Strategy
The inventory focused on processed food products within the grain and dairy categories due to their importance in domestic commodity production, processing, and consumption. Both categories are also pivotal to food and nutrition security, as grains are the main staple and dairy products are a major source of animal protein [
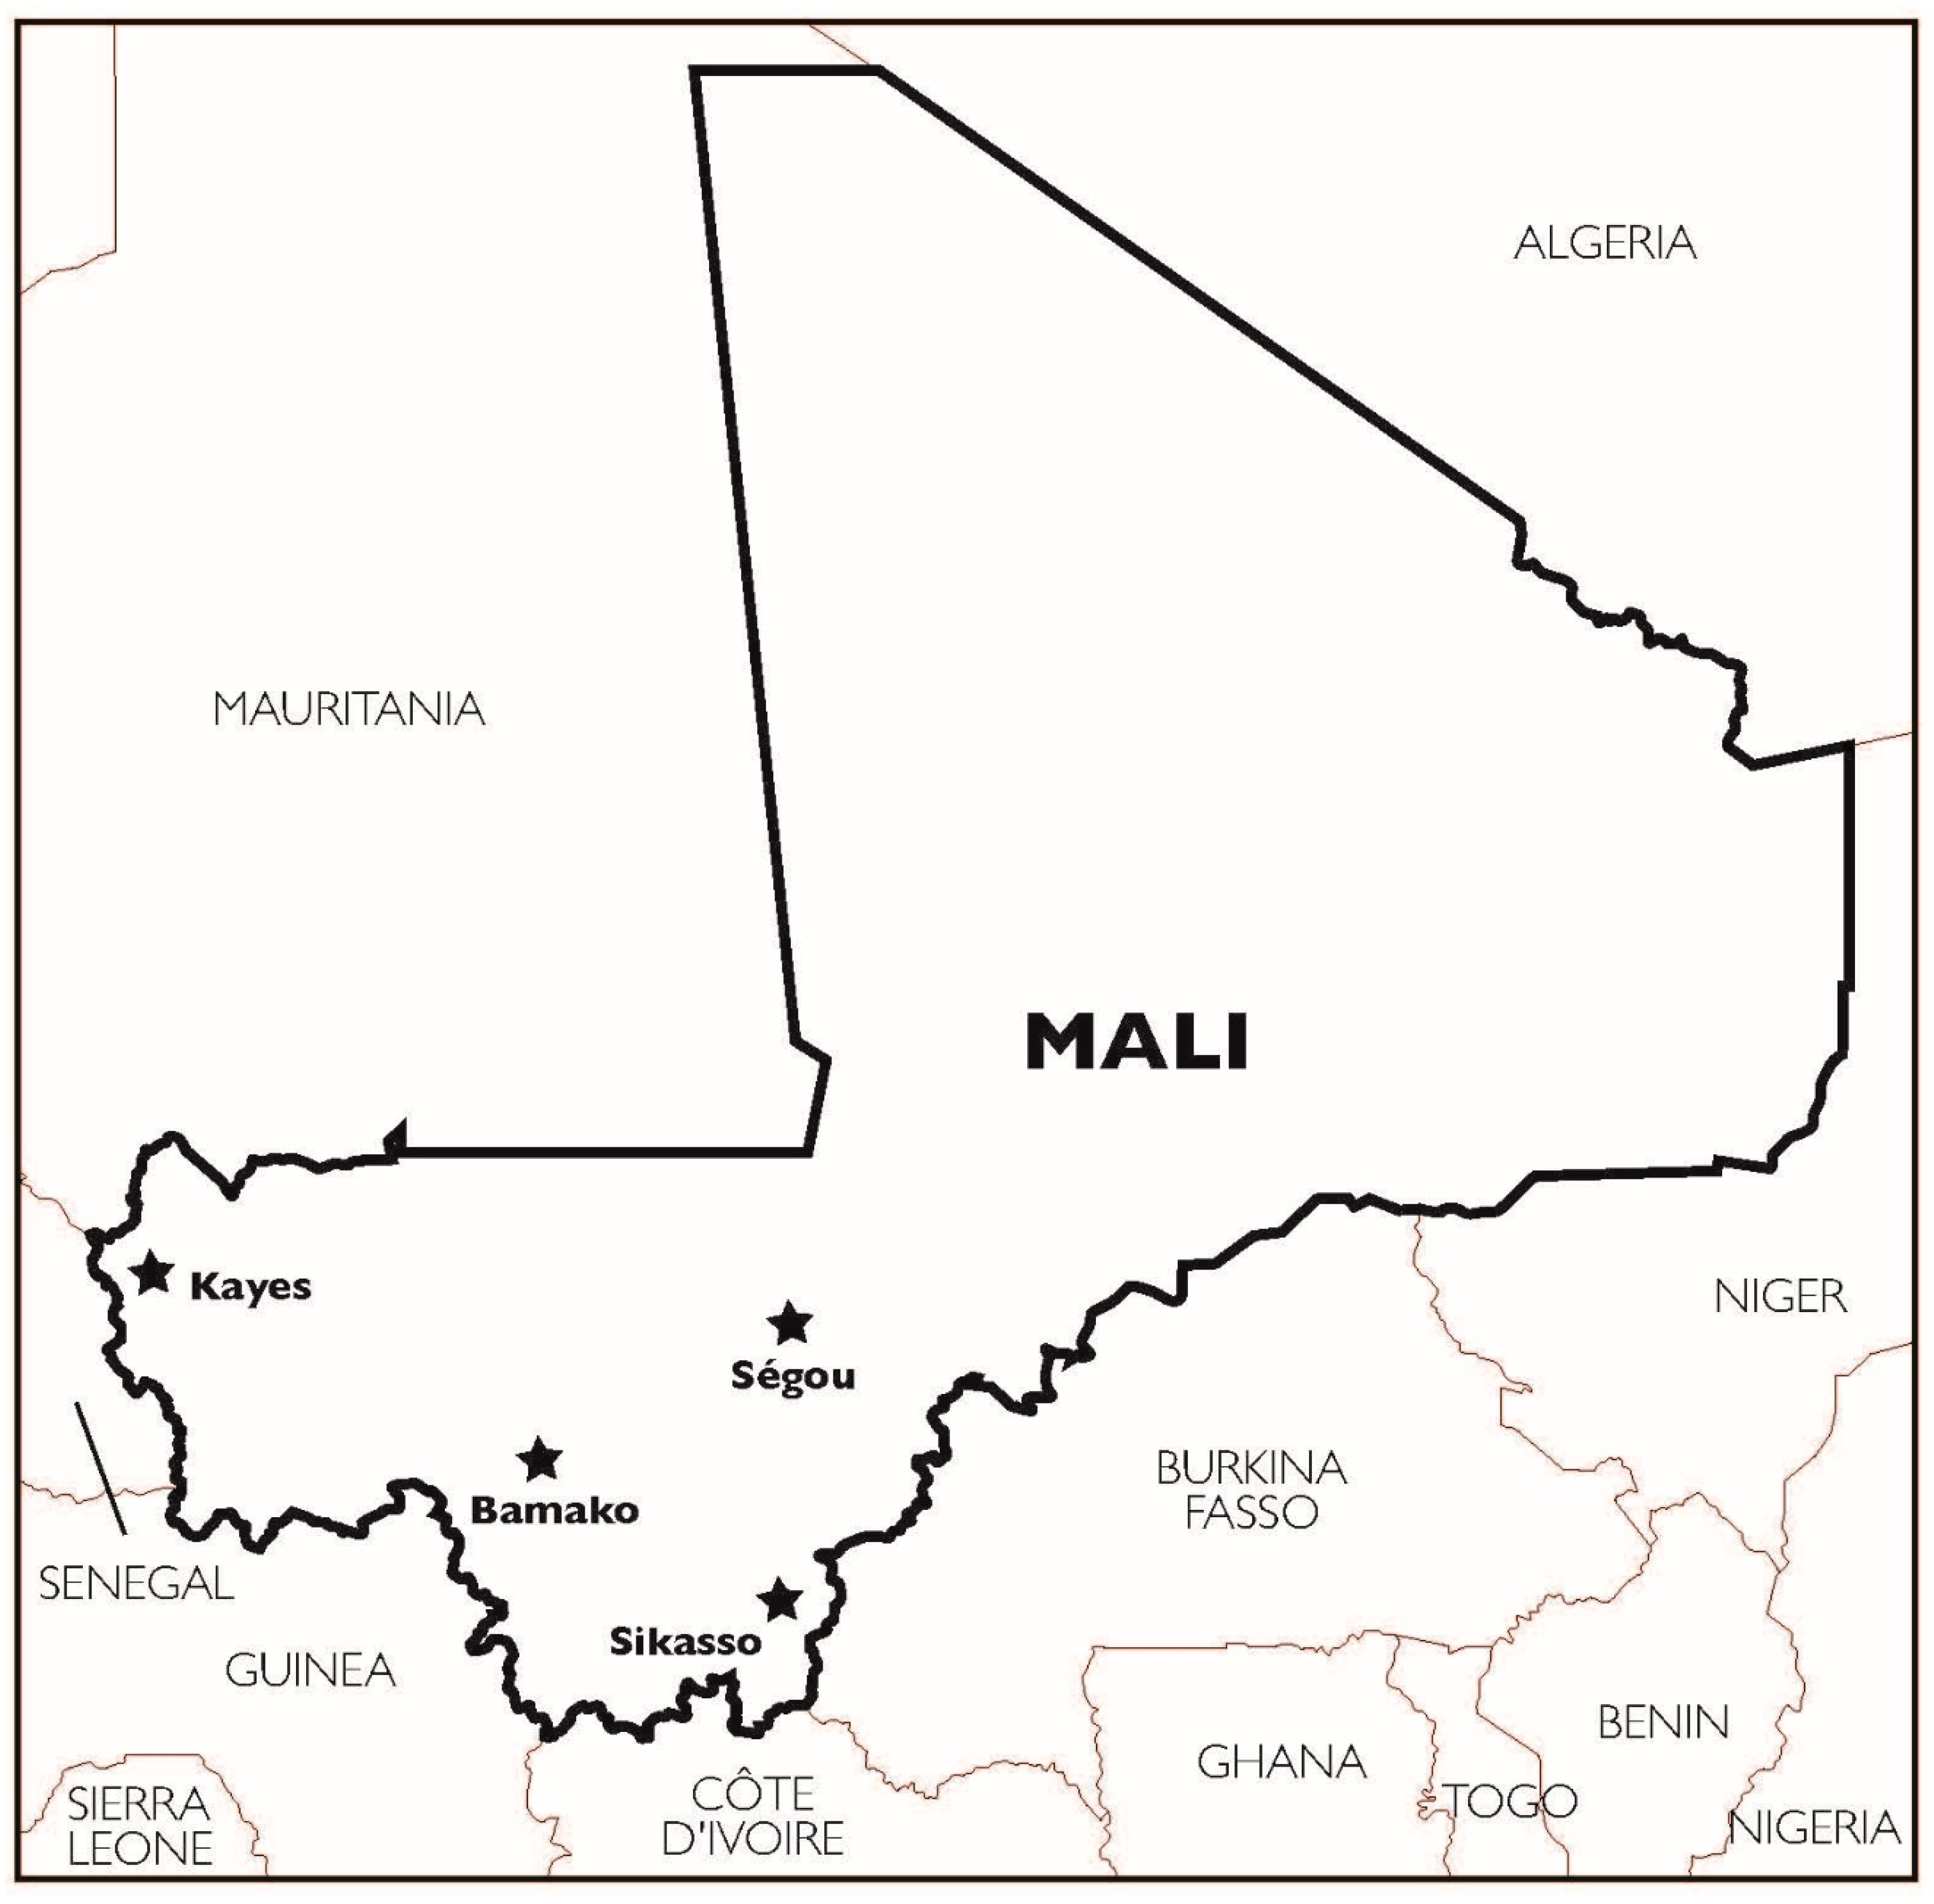
2]. The data for this study were collected in July and August 2016 across a range of retail outlets and neighborhoods in Mali’s four largest urban cities: Bamako, Sikasso, Kayes, and Segou (see
Figure 1).
The capital, Bamako, is the largest city of Mali, with a population of over 1.8 million [
15]. Bamako is the country’s administrative center and a major trading hub. The country’s commodity trade, including agricultural products, tends to move along the Ouagadougou–Bamako, Dakar–Bamako, and Abidjan–Bamako corridors. The second-largest city is Sikasso, with a population of ~427,000 [
15]. Located in the southernmost part of Mali, the Sikasso region receives over 800 mm of rainfall per year and holds the reputation of being the breadbasket of Mali [
16]. The cropping systems in Sikasso are quite diversified, with coarse grains (such as millet, sorghum, maize, and rainfed lowland rice) cultivated alongside fruits, vegetables, and cotton. Sikasso is also a crossroad point between Ouagadougou, Abidjan and Bamako. The city of Kayes is located in the northwest part of the country, near the Senegalese border, and has a population of ~278,000 [
15], which makes it the third-largest city in Mali. Since the 2000s, the Kayes region has experienced a boom in its industrial and artisanal gold mining activities [
17]. With a population of ~200,000, Segou City, which is located approximately 200 km northeast of Bamako, is the fourth-largest city of Mali [
15]. The region of Segou is well known for its irrigated rice production zone in the
Office du Niger. Although livestock rearing is widespread in each of these regions, milk production and consumption have traditionally been most common in the northern regions of the country. However, the peri-urban production, processing, and distribution of milk around Bamako and the other three major cities have been growing in recent years.
There are five types of retail outlets in Mali: modern supermarkets, grocery stores, traditional shops, neighborhood markets, and central markets. First, supermarkets (
supermarchés) are large and integrated retail spaces that are staffed by more than one employee and equipped with more than one cash register. They offer an improved shopping ambiance, in terms of space, air-conditioning, and cleanliness [
2]. Supermarkets are known to offer a wide selection of fresh and processed foods, including refrigerated and frozen foods. There exist few supermarkets in Mali and all of them are local chains situated in Bamako. Second, grocery stores (
alimentations) are small self-service stores that mostly carry processed foods, including cold products, and are equipped with one cash register. Within a city, some neighborhoods have multiple grocery stores whereas others have none. Third, traditional shops (
boutiques) are small non-self-service shops that sell various non-food goods (e.g., soaps, batteries) along with a limited selection of processed foods, displayed behind a counter. Some traditional shops are equipped with one or two refrigerators, which vary widely in quality and make available a limited selection of cold beverages. Traditional shops are much more common than grocery stores. Fourth, neighborhood markets (
marchés de quartiers) are relatively small open-aired markets containing multiple vendors selling mostly fresh produces but also some processed foods from stalls. Fifth, central markets (
marchés centraux) differ from the neighborhood markets by their larger size as well as the higher volume of traded goods. Central markets are the main source of supply of vendors from neighborhood markets and traditional shops. Consumers can also buy food products from stalls at central markets.
Mixed methods sampling strategies were used to collect the data. The combination of purposive and probability sampling techniques provided us with information that has both depth and breadth [
18] regarding the scale and scope of the ongoing agri-food system transformations in Mali. In the first stage, we stratified each city into communes (where relevant), then into neighborhoods. Afterward, each neighborhood was classified as low-, medium-, or high-income. Given that no official information exists on average household incomes by neighborhood, we classified each into one of three income categories based on research and the enumerator team’s knowledge of the neighborhood in terms of housing conditions (e.g., access to electricity), infrastructure (e.g., paved roads), and other socioeconomic indicators (e.g., where expatriates reside). The income classification of neighborhoods for Sikasso, Segou, and Kayes was done in collaboration with local agents from the Market Information System. (The agents from the Marketing Information System visit each neighborhood and central markets weekly to collect information on prices. As such, they have a good knowledge of the neighborhood characteristics in their respective cities.) Next, we randomly selected one neighborhood per income level for Sikasso, Segou, and Kayes, for a total of three neighborhoods per city. A total of nine neighborhoods were visited across the three secondary cities. For Bamako, we randomly selected one income-level neighborhood for each of the six communes. However, given that two communes do not have neighborhoods in all three income levels, we ended up with 16 neighborhoods instead of 18. (See
Table A1 in the
Appendix for a list of selected neighborhoods, and their associated level of income, for all four cities.)
In the second stage, we purposively selected the retail outlets to inventory. For each selected neighborhood across the three secondary cities—Segou, Sikasso, and Kayes—two traditional shops, two grocery stores, and the neighborhood market were visited. In Bamako, one traditional shop and one grocery store were visited along with the neighborhood market. Within every neighborhood, the team was careful to select retail outlets that were a few blocks away from each other, as verified by the GPS coordinates of each outlet, to control for geographic variation within the neighborhood. Across the four cities, a total of 30 grocery stores, 36 traditional shops, and 22 neighborhood markets were surveyed. (There was no grocery store in three sampled neighborhoods of Bamako. In those three neighborhoods, two traditional shops were visited instead. No traditional shop was visited in one neighborhood of Kayes. The randomly-selected neighborhood of Medine in Sikasso holds a central market. As such, no neighborhood market was listed for Medine. There was no neighborhood market in two neighborhoods of Bamako.) Three central markets (
marchés centraux) were visited in Bamako and one each in Kayes, Segou, and Sikasso. We visited all six supermarkets (
supermarchés) located in Bamako. In contrast, Ijumba et al. [
8] estimated the number of supermarkets at over 30 in Tanzania’s capital. At the time of the field work, there was no supermarket in the other Malian secondary cities.
A comprehensive inventory of all unique processed cereal and dairy products was conducted at each supermarket, neighborhood store, and grocery store, even if the same product was previously documented at another location. At central and neighborhood markets, different stalls were visited until the inventory reached saturation, meaning no new product was inventoried after visiting three additional stalls. For each retail outlet and processed food product, the following information was recorded on computer tablets: (i) type, location, and GPS coordinates of the retail outlet; (ii) product information (product category, type, name, top three leading ingredients); (iii) price; (iv) packaging and label characteristics (size, material, nutritional information; whether there was a barcode, a manufactured date, and a product expiration date); and (v) information on the manufacturer and distributor (names, addresses).
The data were analyzed through descriptive statistics, including coefficients of determination and mean comparison tests and regression models using the software Stata 13.1 (StataCorp, College Station, TX, USA). Specifically, the diversity and availability of products, prevalence of imports, level of competition, as well as types of packaging and ingredients used were examined through descriptive statistics. A hedonic pricing model was used to investigate the attributes and prices of different processed dairy and grain products across retail outlets located in four cities of Mali.
4. The Retailing of Processed Dairy and Grain Products
4.1. Diversity
Table 1 shows the range of grain and cereal product types inventoried across all retail outlets. Our inventory revealed a total of 36 and 15 different processed grain and dairy product types, respectively. Few to no observations were inventoried for two important grain product types in Mali: bread and beer. These products are typically not sold in the four visited types of retail outlets but in bakeries and
maquis (i.e., bars/restaurants), respectively. The relatively limited number of different grain and dairy product types highlights the overlap of products across retail outlets. Together, pasta and cookies/crackers account for over 20% of the observations in the grain category, whereas powdered milk makes up about 20% of inventoried dairy products.
Taking into account product types, names, manufacturing company, and product size, we estimate 1240 unique grain products and 537 unique dairy products (
Table 1). The most product diversity is found for wheat-based cookies/crackers, for which 365 unique products were inventoried, followed by pasta (193 products) and milk powder (182 products). A substantial number of unique products exist for several traditional food types; we inventoried 24
dégué, 19
djouka, 12 milled fonio, and 11
monikourou products. (
Dégué is a dessert made of fermented milk and millet semolina.
Djouka is a particular kind of precooked fonio.
Monikourou is a grain-based dough rolled into balls.) These counts do not include inventoried food products, both imported and local, which are unlabeled. In several instances, powdered milk and pasta have been inventoried with no labels, suggesting the incidence of repackaging activities (i.e., probably in smaller size denominations) for retail in Mali.
The inventory indicates the coexistence of modernity and tradition. Traditional dairy products, such as fermented milk,
sirimé, and
féné exist alongside modern ones, such as yogurt and powdered milk. (
Sirimé is a liquid butter, similar to ghee, obtained through traditional processing methods;
féné is full cream milk that has been fermented. It differs from locally made yogurts, which are commonly made from skimmed local milk and/or powdered milk, and with a commercial fermenter. [
19]). Likewise, both traditional (e.g.,
monikourou,
bachi djalan (
Bachi djalan is a parboiled grain-based flour)) and modern (e.g., cookies/crackers, breakfast and infant cereals) grain products are inventoried. However, traditional grain and dairy products account for very few of the observations. On the one hand, this may suggest that modern foods are increasingly replacing traditional foods, as has been observed in neighboring countries. For instance, Hollinger and Staatz [2:17]) argue that “the demand for speed and convenience is resulting in a gradual departure from traditional cooking and eating habits.” On the other hand, it may suggest that traditional processed foods are still at an early stage of penetration into the retailing segment.
4.2. Availability by Region, Neighborhood, and Retail Outlet
The number of different processed grain and dairy products available in Bamako is about twice in Kayes and Sikasso and 1.5 times the number in Segou. There are also 1.5 times more grain products available in Bamako than in the other major cities. For instance, maize-based products, such as maize flour and cornmeal, are only found in Bamako. The regional differences in product availability are even more striking for dairy. The number of dairy products available in Bamako is about threefold and twofold the amount in Kayes/Sikasso and Segou, respectively. Most cheese, butter, and ice cream products are only available in Bamako.
As seen in
Table 2, availability differs significantly across neighborhoods, with a greater choice of products in high-income neighborhoods. The coefficients of determination indicate that product availability in high-income neighborhoods is explained by retail outlet type. Several staple grains, imported wheat products (e.g., pasta and couscous), and non-perishable dairy products (e.g., powdered and evaporated milk) are widely available across all neighborhood types. In contrast, some dairy products and “quick-preparation” grains are less available in low-income neighborhoods compared to higher-income neighborhoods. The limited access may prevent consumers from low-income neighborhoods from consuming dairy products. This is potentially significant given recent findings that urban consumption patterns are affected by households’ physical access to foods [
2].
The availability of processed grain and dairy products not only differs significantly across cities and neighborhoods but also across retail outlets (
Table 2). More products tend to be available at grocery stores and supermarkets, even though they do not carry sorghum-based products, which are largely found in central and neighborhood markets. However, supermarkets are the only outlets to sell hard cheeses and some flavored yogurts and milk. Once flavors, nutritional enhancement, and other key commercial gradations are taken into account, more food items are available at the supermarkets than at any other retail outlets. This is consistent with previous findings that modern retailers offer a wider selection of processed foods compared to traditional retailers as a way to attract consumers [
20,
21]. The small number of supermarkets in Mali suggests that modern retailing has not penetrated the mass markets yet, and therefore that the transformation of the agri-food system is at an early stage [
2]. However, anecdotal evidence suggests that the supermarket retailing segment is growing: within a year of the 2016 inventory, the authors noted at least two new supermarkets in the Bamako area.
4.3. Prevalence of Imports
Little is known about the ability of locally-processed foods to compete with imported products in modern retailing. Although some supermarkets in Eastern and Southern Africa have sourced the bulk of processed foods domestically, it may not be the case for the less-developed agri-food system of West Africa. As pointed out by Hollinger and Staatz [
2], West African food import chains have shortened over time and many large modern retail outlets, such as supermarkets, are owned by foreigners, who are also operating as importers. As such, modern retail outlets may be more likely to favor imported foods. The overall prevalence of imported grain and dairy products serves as a rough indicator of the country’s dependence on imports.
As seen in
Table 3, about one-quarter of all inventoried food items are manufactured locally, or within Mali. This suggests that locally-processed foods have not been fully able to compete with imported modern retailing in Mali, at least within product types where imports dominate. In comparison, approximately 30% of processed dairy and cereal products inventoried in urban areas of Ghana were locally manufactured [
9]. In Tanzania, the number of locally manufactured grain products exceeded imports, whereas the opposite held true for selected dairy products [
8]. In Nigeria, less than half of dairy products were locally manufactured, while imported products dominated for grains [
10]. Those are rough comparisons since the methodology, choice of products, and unit of analysis differ across studies.
Three key points emerge. First, Europe, and in particular France, is a major exporter of processed dairy and grain products to Mali, which might be expected given the importance of the agri-food sector in France and the long history between the two countries. Highly processed dairy products, such as yogurts, cheeses, and butter, as well as powdered, concentrated, and sterilized milk, are imported from Europe (France) along with grain-based products, such as breakfast and infant cereals, couscous, and pasta. Second, some of the locally processed dairy and grain products have been minimally processed (e.g., bachi djalan), while others have been heavily processed (yogurt). This suggests that the Malian processing sector has been developing and has the potential to be further developed. Third, local processing is mostly occurring on agricultural commodities that can be locally sourced, which has important implications for employment in the agri-food sector. Processed sorghum products are exclusively from Mali, while millet and fonio-based products are almost entirely locally manufactured, with very few imports from Burkina Faso and Ivory Coast. Over half of maize-based products come from Mali, followed by imports from Europe and neighboring African countries. Asia dominates for rice-based products, followed by Mali. Further developing the processing segment of sorghum, millet, and fonio products and, to some extent, of processed maize and rice products, could contribute to increase demand for raw agricultural commodities and, thereby, generate employment opportunities on- and off-farm.
Table 3 also reports the region of manufacturing of processed grain and dairy products by retail outlet. Imports from Europe dominate in supermarkets, accounting for approximately 65% and 75% of inventoried processed grain and dairy products. In comparison, locally-processed grain and dairy products account for less than 20% of the supermarket inventory. In Ghana, about 60% to 80% of grain and dairy products in supermarkets are imported [
9]. Imported dairy products from Europe remain relatively important across the other retail outlets, accounting for 30% of the inventory.
Local dairy products are found across supermarkets, grocery stores, and markets. These include modern dairy products such as yogurts, as well as traditional dairy products such as féné. Yet, most of the dairy products sold in supermarkets are imported from Europe. In contrast to supermarkets, the largest share of processed grain products sold in traditional stores and markets are from Mali, followed by African countries (e.g., Algeria, Ghana, Ivory Coast, and Tunisia). Imported processed grain products from Asia are less common in supermarkets than in other retail outlets.
The high prevalence of imported processed dairy and grain products suggests that the Malian processing sector has great potential to grow. In order for locally-processed products to capture market share from imports, they must increase their product availability across retail outlets in all major cities.
4.4. Competition
To get a sense of the level of competition for processed grain and dairy products, we look at the number of manufacturing companies by product types (
Table 1). The number of different manufacturing firms is relatively high for condensed (34), powdered (32), and sterilized (27) milk. There are 122 firms manufacturing cookies and crackers, 76 for pasta, and 35 for couscous. There is also a notable number of manufacturing companies for more traditional foods, such as
djouka (15),
monikourou (nine), and
degue djalan (11).
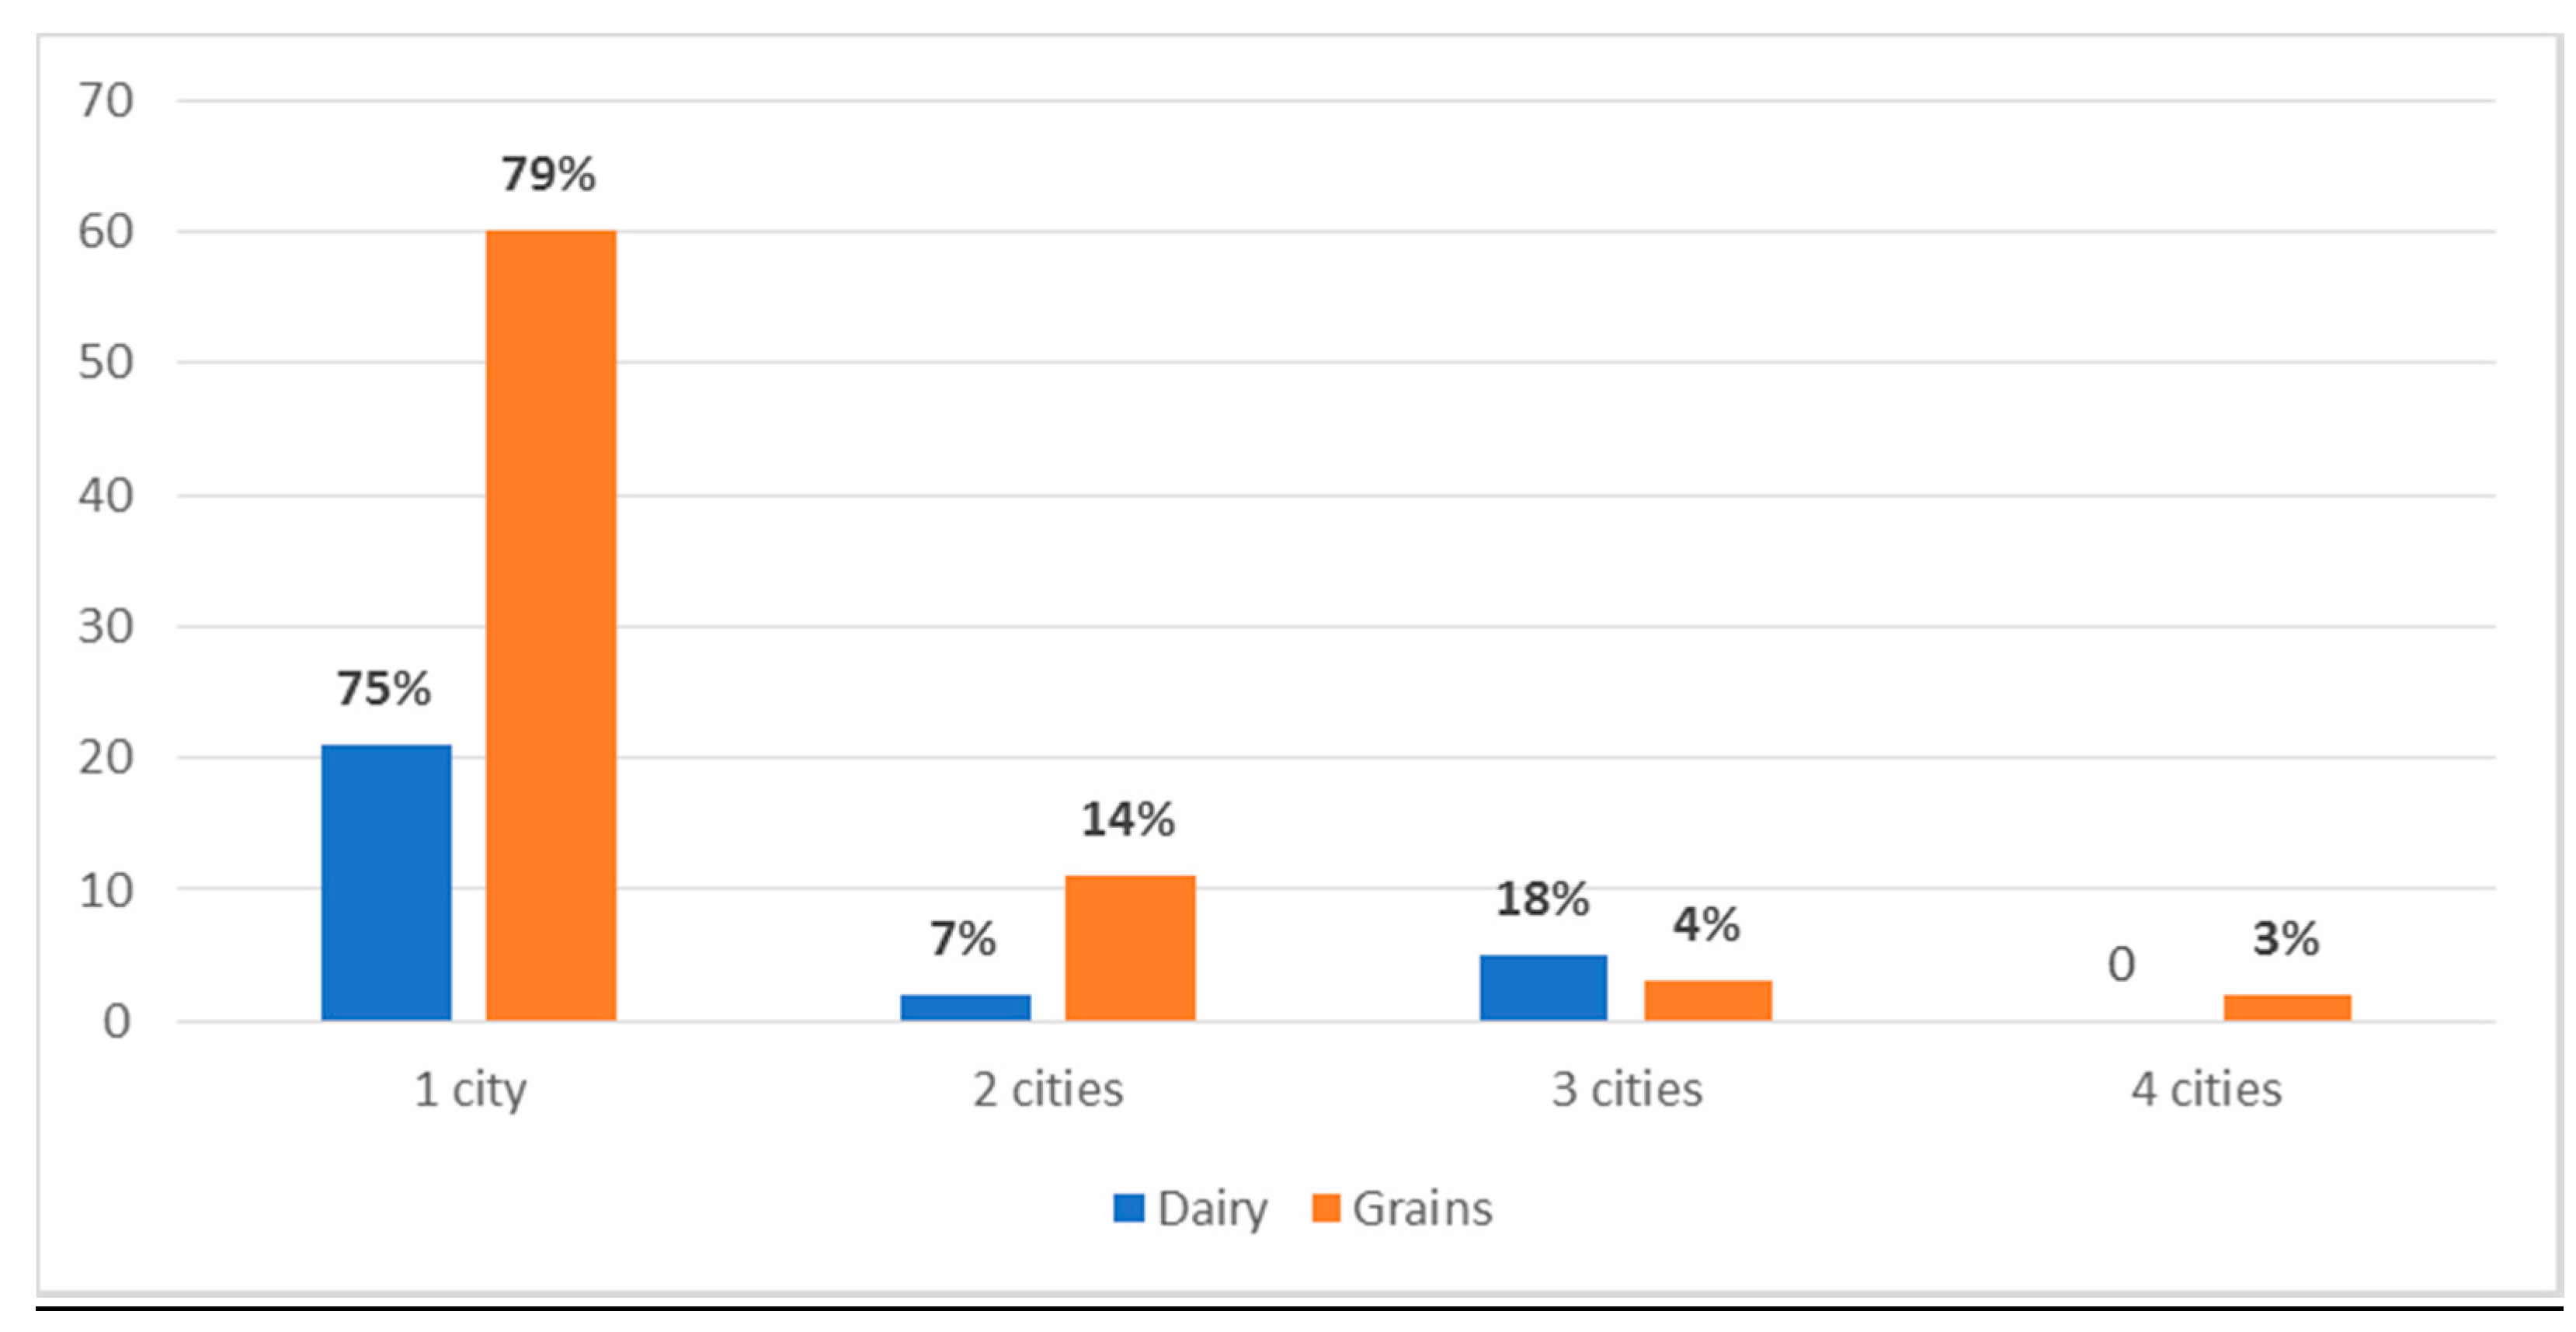
Within a country, the agri-food system transformation is considered to be at advanced stages when local manufacturing firms distribute their products widely across urban centers (Reardon 2015). To explore the geographic extent of value chains in Mali, we examine the presence of local manufacturing firms across its four major cities (
Figure 2).
The inventory registered a total of 103 different manufacturing firms operating in Mali that market grain products (76 firms) and dairy products (28 firms). Fewer than 25% of these grain and dairy firms have a presence in more than one city, and only two grain processors operating in Mali have a presence in all four cities. Likewise, very few Tanzanian manufacturing firms are present in more than one of the three cities inventoried [
8]. Of the number of products with distribution limited to one city, approximately two-thirds are confined to Bamako. This indicates that the bulk of domestic processing takes place in the capital. Approximately 30% of the single-city firms are in Sikasso and Segou, suggesting the presence of a more active processing sector in these secondary cities, while only two single-city firms (both processing cereals) are located in Kayes. Markets remain geographically fragmented, especially for locally processed foods, reflecting the limited scale of local firms to compete nationwide. As highlighted by Hollinger and Staatz [
2], constraints related to the high cost structure of local production and to inadequate marketing and transport infrastructure would have to be overcome for locally-processed products to become more competitive.
4.5. Packaging
Packaging is a key product attribute since it influences consumers’ perception of product quality, and, thereby, consumers’ purchasing decisions [
22,
23]. From the inventory, plastic is the most common packaging material across retail outlets, accounting for over two-thirds of observations. Whether flexible (e.g., bags and wrappers) or rigid (e.g., bottles and containers), plastic packaging of various sizes and colors (including transparent) is widely used to package processed foods. Specifically, plastic bags dominate over any other type of packaging. This can be explained by their wide availability and low cost, especially for local processors. In contrast, plastic containers, metal cans, and cartons must be either imported or manufactured on-site by local manufacturers. Combined, these rigid packaging types constitute almost half of products inventoried in supermarkets (and about one-third overall), suggesting that the use of more sophisticated packaging may be necessary for local manufacturing to compete with imports and gain shelf space in modern retailing outlets. Ijumba et al. [
8] and Andam et al. [
9] documented a similar dependence on plastic sack packaging in Tanzania and Ghana.
The presence of barcodes on processed food packaging allows for faster and more reliable cash handling and facilitates inventory management in modern outlets. In contrast to imports, most locally processed foods do not have bar codes. According to our data, about 80% of inventoried products sold in supermarkets and grocery stores have barcodes, compared to 60% in traditional retail outlets. This suggests that most manufacturers keep the needs of modern retail outlets in mind when designing packaging, even if their products are distributed to a wide range of retail outlets. However, these rates fall below the 90% rate of products carrying barcodes in Nigerian urban retail outlets [
10].
Manufacture and expiration/best by dates provide information to retailers and consumers on shelf life, and may be indicators of food quality and safety. Approximately 65% and 75% of grain and dairy products have manufacture dates, while 80% and 95% of grain and dairy products have expiration dates. The generally broad use of date stamps may be explained by the low cost of their incorporation into packaging, while the higher frequency of stamps on dairy may reflect the relatively shorter shelf life of these products.
4.6. Ingredients
On the one hand, the transformation of the agri-food system has the potential to increase food and nutrition security by improving the availability and affordability of foods that are rich in macro- and micronutrients [
24]. On the other hand, the increasing availability and cheapness of some ingredients used in processed foods, such as sugar and solid fats, can increase consumer risks for obesity, hypertension, and other chronic diseases [
24]. As explicitly stated by Miller and Welch [
25], food processing “can be detrimental to nutritional quality when it manufactures foods that are high in added sugar, fats, and sodium or when it removes nutrient dense fractions from whole foods as is often the case in cereal milling operations.” In light of these concerns, we look at the extent to which added sugars and vegetable fats are listed as a primary ingredient in processed grain and dairy foods. Almost all inventoried products (95%) provide a list of at least their primary ingredients. Approximately 30% and 15% of dairy and grain products contain sugar as an additive top-three ingredient, respectively, and about 30% of both dairy and grain products contain some vegetable fat as an additive top-three ingredient. About 70% of cookies and crackers, infant formulas, ice creams, yogurts, fermented milk products, milk-based drinks, and condensed milk contain sugar as a top-three ingredient. Over 25% of dairy products (butter and cream; powdered, evaporated, and sterilized milk) contain vegetable fat as a top-three ingredient, possibly as a replacement for milk cream, which is often extracted to be used in other products. Traditional grain and dairy products are less likely to include sugar and/or fats in their key ingredients.
4.7. Pricing
The hedonic pricing model is based on the premise that consumers’ utility is derived from the attributes of a product, rather than from the entire product itself [
26]. Differences in quality attributes differentiate one product from another. Although we cannot directly observe attribute prices, we do observe the equilibrium market price of a product, P
i, which is a function of its attributes. Since the seminal theoretical work of Lancaster [
27] on hedonic utility and Rosen [
28] on hedonic pricing, many studies have empirically examined the relationship between product attributes and prices for a wide range of food commodities. For instance, hedonic pricing models have been used in Mali to examine consumer preferences for quality attributes in cowpeas [
29], cattle [
30], and fonio [
31]. Yet, to our knowledge, little research has analyzed the retail prices of processed foods across retail outlets in Mali, or in sub-Saharan Africa in general, through hedonic models. Two exceptions are Asseffa et al. [
11] and Minten and Reardon [
12], who investigated the prices of cereals, produce, or meat in Ethiopia and Madagascar, respectively.
Let us assume that the observed market price of food item
i is a function of
n attributes,
, as follows:
where the partial derivative of
P(•), with respect to the
kth attribute, represents consumers’ marginal willingness to pay for attribute
k. We hypothesize that prices of product
i are determined by the following attributes: packaging size, the presence of an expiration date stamp, and key commercial gradations—depending on the product types- manufacturing region, as well as the city, neighborhood, and retail outlet types where the item is sold. A linear functional form is chosen to empirically examine the relationship between prices and product attributes. A semi-log functional form was also used to check the robustness of our findings. Overall, they remain similar across both alternatives (see
Table A2 in the
Appendix). The empirical model is:
where
β is a vector of coefficient parameters,
X are product attributes affecting
P, and
is a random error term. Many covariates are dummy variables.
Table 4 shows the OLS results of the hedonic pricing model for key processed dairy and grain product types in our inventory: powdered and sterilized milk, pasta, rice, and cookies/crackers. Dummy variables for the cities and neighborhood types are also included to account for spatial effects. Clustered standard errors are used, since they are robust to heteroscedasticity of the errors and allow errors to be correlated within clusters, which in this case are neighborhoods.
Results from the hedonic model show that some product attributes are highly significant. Four findings are especially striking. First, the coefficient estimate of size is negative for most products. Consumers who purchase larger package sizes pay significantly less per kilogram. Second, processed foods in more sophisticated packaging (e.g., cans and cartons) are significantly more expensive. Third, dairy and grain products that are manufactured in Europe tend to cost more, while no price premium is paid for any food item that is locally manufactured. Price premiums are paid when powdered milk is manufactured, first, in Europe and, secondly, by a well-reputed multinational company that is based in Europe, Nestlé, under the Nido brand. Nestlé also has a popular brand of baby formula—Cerelac—that is manufactured in Ghana. This explains the statistically significant coefficient for baby formulas manufactured in “other African country.” (When the baby formula hedonic model is run without the manufacturing region variable, the Nestle variable becomes highly significant.) This is consistent with previous findings that show consumers’ willingness to pay premium prices for milk products and baby formulas that are HACCP-certified, which are seen as safer to consume [
32] and for internationally branded products because consumers trust the quality of these products more than local alternatives [
2].
Fourth, after controlling for diverse product attributes, prices at supermarkets remain significantly higher than at other retail outlets. This may indicate that modern retailers are targeting the higher end of the market, which is often the case in developing countries [
33]. Our results can also be seen as an indication that the agri-food system transformation has not fully taken off in Mali [
12,
34]. Otherwise, supermarkets would be selling processed foods at competitive prices with traditional retailers, not at mark-up prices. Take for instance, India, where basic food products are sold at the same or lower prices in modern retail outlets than in traditional ones [
20].
5. Conclusions
As in many sub-Saharan African countries, Mali is experiencing an unprecedented rate of urbanization and, with it, changes in its agri-food system. As more people live in urban areas, the demand for processed food has been increasing rapidly. Urban consumers are seeking food that is easy-to-prepare and ready-to-eat. Yet, little is known about these ongoing transformations in Mali, or in the West African region as a whole. In 2016, we conducted a city retail outlet inventory of processed dairy and grain products in four major Malian cities in order to examine the scope and scale of processed food retailing. Retail outlets, including central and neighborhood markets, traditional and grocery stores, as well as supermarkets, located in low-, medium-, and high-income neighborhoods of Bamako, Segou, Sikasso, and Kayes were visited.
Our results show that there are 36 and 15 different processed grain and dairy product types, respectively, sold in retail outlets in the largest urban cities of Mali. Once product name, manufacturing company, and product size are taken into account, we estimate that there are 1240 and 537 unique grain and dairy products, respectively. The relatively small presence of traditional food products in the inventory suggests that they have not fully penetrated this segment of the agri-food system yet. The availability of processed grain and dairy products differs across cities, neighborhoods, and retail outlets. More processed grain and dairy products are available in the capital, Bamako, than in other cities. Some dairy products and “quick-preparation” grains are also more available in high-income neighborhoods compared to lower-income neighborhoods. Supermarkets have a wider selection of processed foods compared to traditional retailers, especially once flavors, nutritional enhancements, and other key commercial gradations are taken into account. The relatively small number of supermarkets in Mali, all located in Bamako, suggests that modern retailing has not yet penetrated the mass markets. The prevalence of imported processed foods is relatively high, especially in supermarkets, where approximately 65% and 75% of those products come from Europe. Additionally, hedonic price analysis on several product types shows that higher prices are paid for items that are manufactured in Europe and sold in supermarkets. More local processing is occurring on commodities that are locally available.
Our study also highlights some interesting patterns at the product attribute level. First, some imported products do not have a brand label, indicating some level of repackaging in the retailing segment. Second, the geographic reach of local value chains is quite limited, with only 30% of local manufacturing firms distributing in more than one of the inventoried cities. Third, plastic is the most common packaging material for both imported and local food products, with local products relying almost entirely upon this packaging material. However, hedonic analysis shows that consumers are willing to pay more for improved packaging. The packaging of local products also less frequently features barcodes and food date labels. Fourth, ingredients are listed on most food packages, with sugars and vegetable fats being the main ingredients in up to 30% of processed products.
Overall, our results indicate that the transformation in the processed and retailing segments of the Malian agri-food system is still at an early stage. The expected benefits of lower prices and a greater selection of processed products for the mass market from the expansion of modern retailing have not been fully realized. Yet, the Malian agri-food system has the potential to be vibrant, especially in the manufacturing of processed foods made from locally-available agricultural commodities, such as maize, millet, sorghum, rice, fonio, and fresh milk.
Continued growth in the demand for processed foods in the coming years will create economic opportunities for Malian grain and dairy value chain stakeholders. There is room for the Malian processing segment to capture market share if it can deliver quality products at competitive prices relative to imports. There are three opportunities that appear especially promising. First, the local processing food segment should tap into the high growth potential for healthier foods. Traditional processed foods, especially, tend to contain less fat and sugar than modern ones and, therefore, are more attractive to health-conscious urban consumers. Second, local processors should expand their market reach to other cities, but particularly to low-income neighborhoods that currently remain underserved. Third, investments in modern packaging can help local firms to differentiate their products from those of competitors, protect foods over long distances, and signal quality to consumers. Finally, the ability of the local food processing segment to compete in modern retailing depends, to some extent, on the country’s ability to reduce barriers to investment and domestic trade, including improved infrastructure and policy enhancements.


