1. Introduction
1.1. Ageing, Loneliness and Public Space
Population ageing, climate change and the growing recognition of public space as a determinant of healthy ageing are placing new demands on urban design. For older adults, outdoor environments are not only settings for mobility and recreation but also essential infrastructures that support everyday wellbeing, social participation and independent living. Their environmental and spatial quality may therefore influence whether older adults can comfortably access, use and remain in public spaces as part of their everyday routines.
Within this broader context, loneliness and social isolation have become major public-health concerns, particularly among older adults. Approximately one in six people globally experience loneliness, which has been associated with significant negative health outcomes and increased mortality [
1]. In Europe, 13% of the population report feeling lonely always or almost always, while 35% experience loneliness at least occasionally [
2]. In Spain, loneliness particularly affects older age groups, with prevalence increasing significantly after the age of 65 [
3,
4].
Demographic ageing further increases the relevance of these challenges. In 2024, people aged 65 years and over represented 21.6% of the European population, and this proportion is expected to continue increasing over the coming decades [
5]. In this context, promoting healthy and active ageing has become a major social and urban challenge. This requires neighbourhood environments that support mobility, rest, outdoor activity, everyday encounters and continued participation in community life.
Public spaces are increasingly recognised as key forms of “social infrastructure” that support everyday interaction, inclusion and well-being. The World Health Organization and recent European policy frameworks emphasise the importance of accessible and welcoming neighbourhood environments in helping to reduce social isolation and strengthen social connection [
1,
6]. Consequently, urban planning and public-space design are gaining relevance as tools to support social interaction and community cohesion [
7]. However, the capacity of public spaces to support these processes depends not only on their availability or accessibility, but also on whether their environmental conditions allow people to use them comfortably throughout the year.
Previous studies have explored the relationship between neighbourhood characteristics, green spaces and loneliness [
8,
9,
10,
11]. However, studies explicitly addressing loneliness and social interaction among older adults from the perspective of public space environmental conditions remain limited [
7,
12]. In this context, environmental comfort—particularly outdoor thermal comfort plays a key role in shaping the usability and perceived quality of urban public spaces [
13]. Environmental comfort should therefore be regarded as one of several conditions that may facilitate public-space use and opportunities for encounter, rather than as a direct determinant of social interaction.
In addition to thermal conditions, previous studies have highlighted the influence of vegetation, shading, acoustic perception, spatial configuration and environmental quality on the attractiveness and sociability of public spaces, particularly among older adults [
7,
14,
15,
16,
17]. These environmental and spatial attributes may affect the perceived pleasantness, accessibility and usability of a place, thereby shaping the conditions under which everyday activities and informal encounters occur.
1.2. Outdoor Thermal Comfort and Ageing Populations
Outdoor thermal comfort (OTC) strongly influences the usability and attractiveness of urban public spaces, particularly for older adults and other thermally vulnerable groups. Previous field studies have demonstrated the adaptive and context-dependent nature of outdoor thermal perception, highlighting the importance of behavioural, environmental, and psychological factors in shaping thermal responses in real urban environments. Accordingly, assessing outdoor comfort requires combining physical environmental conditions with users’ subjective responses and adaptive behaviour.
Despite the growing body of research on OTC, studies specifically focused on older adults remain relatively limited [
18,
19,
20]. Most thermal comfort models are still based on the characteristics of a standard adult subject and do not adequately account for the physiological and behavioural differences associated with ageing [
18,
21,
22]. These age-related differences are associated with physiological changes affecting thermoregulation, metabolic activity, and thermal sensitivity, which may alter thermal perception and adaptive capacity in outdoor environments [
22,
23].
Several authors have reported that older adults generally tolerate a wider range of outdoor temperatures than indoor ones [
18,
24], although important differences in thermal perception emerge with age. Research conducted in different climatic contexts indicates that older adults tend to prefer warmer conditions and exhibit lower thermal sensitivity than younger populations [
25,
26]. Studies conducted in temperate oceanic climates similar to the context of this research further indicate that ageing is commonly associated with higher clothing insulation levels, lower activity levels, and a greater reliance on adaptive behaviour [
23]. Evidence specifically focused on older adults in temperate Atlantic public spaces nevertheless remains limited.
Behavioural and contextual factors also play an important role in shaping outdoor thermal perception among older adults. Evidence suggests that adaptive strategies vary according to sex, activity patterns, lifestyle, and environmental exposure [
27,
28]. These findings highlight the complexity of outdoor thermal perception and the importance of integrating physiological, behavioural and environmental dimensions in outdoor comfort assessments.
In the context of climate change and increasing urban heat exposure, understanding how outdoor environmental conditions may affect the everyday use and perceived usability of public spaces among older adults has become an increasingly relevant research topic [
11,
29,
30]. Recent interdisciplinary studies have highlighted the need to integrate urban microclimate, environmental perception, and social well-being in order to support age-friendly and climate-resilient urban environments [
7,
12,
31]. This integrated perspective is particularly relevant because thermal conditions may not correspond directly with users’ reported sensations, preferences or patterns of adaptation.
In parallel, microclimatic simulation tools such as ENVI-met have been increasingly applied to evaluate outdoor thermal comfort in urban public spaces [
32,
33,
34]. Several works have demonstrated the influence of urban morphology, vegetation density, tree-canopy configuration, shading continuity, and surface materials on pedestrian-level thermal conditions and PET distribution [
35,
36]. These simulation-based approaches have been widely used to assess heat mitigation strategies, seasonal thermal variability, and the climatic performance of public spaces under different urban and environmental conditions [
32,
33,
35]. In particular, vegetation and shaded areas have consistently been identified as key factors in reducing radiative thermal stress during warm periods [
15,
36,
37]. However, most simulation studies focus primarily on the physical assessment of thermal conditions, while fewer studies explicitly examine how microclimatic conditions may relate to patterns of use, sociability, and social interaction among older adults [
22,
30,
31]. Moreover, simulation outputs are not always analysed alongside season-specific field surveys and user-centred assessments capable of identifying discrepancies between modelled thermal stress and subjective thermal perception.
1.3. Research Gap, Novelty and Objectives
Despite the growing body of research on outdoor thermal comfort and ageing, three related limitations remain. First, relatively few studies focus specifically on adults aged 55 years and over across contrasting seasonal conditions. Second, subjective thermal perception, multisensory environmental appraisal and microclimatic simulation are frequently examined separately rather than within an integrated research framework. Third, the relationship between modelled thermal exposure, reported patterns of public-space use and perceived sociability remains insufficiently understood, particularly in temperate Atlantic urban contexts [
22,
30,
31].
This study was motivated by the opportunity to integrate research into the evidence-informed redevelopment of a real urban public space through the KALELAGUN project. The planned transformation of the Barrendain intervention area (Beasain, Spain) enabled the research team to undertake a baseline assessment of environmental conditions, users’ perceptions and reported public-space use before the implementation of the proposed design. This real urban transformation process provided the opportunity to investigate how objective microclimatic conditions and subjective environmental perception jointly relate to the everyday use and perceived sociability of public spaces among older adults, while directly informing the subsequent design process.
The originality of the present study lies in the integration of four complementary components within a single case-study framework: (i) seasonal field surveys involving adults aged 55 years and over; (ii) assessment of thermal, acoustic and visual perception together with reported public-space use; (iii) ENVI-met/BIO-met simulations using elderly user profiles differentiated by sex and posture; and (iv) translation of the combined findings into design implications for an ongoing public-space redevelopment process. By integrating objective environmental assessments with users’ subjective perceptions within a real urban regeneration process, the proposed framework provides a comprehensive diagnostic approach capable of supporting evidence-informed, climate-responsive and age-friendly public-space design. The study does not seek to demonstrate a direct causal relationship between thermal comfort and social interaction; rather, it examines environmental comfort as one of the conditions that may support public-space usability and opportunities for everyday encounter.
The overall aim of this study is to characterise the baseline environmental conditions, thermal adaptation and reported public-space use among adults aged 55 years and over within the Barrendain intervention area, by integrating seasonal field surveys with ENVI-met/BIO-met simulations to support evidence-informed urban redevelopment.
The specific objectives of the study are:
to characterise seasonal differences in thermal sensation, thermal comfort, thermal preference and multisensory environmental perception among adults aged 55 years and over;
to analyse the association of selected personal, behavioural and contextual variables with reported thermal sensation;
to characterise the spatial and seasonal distribution of PET within the Barrendain intervention area and identify the environmental features associated with exposed and thermally moderated areas;
to compare simulated PET classifications with users’ reported thermal sensations and examine possible discrepancies between modelled exposure and subjective perception;
to derive design implications for age-friendly and climate-responsive public spaces, while treating environmental comfort as an enabling condition for use and encounter rather than as a direct predictor of social interaction.
Accordingly, the study addresses the following research questions:
RQ1. How do thermal sensation, comfort and preference among adults aged 55 years and over vary across seasonal field campaigns?
RQ2. Which personal, behavioural and contextual variables are associated with reported thermal sensation within the study sample?
RQ3. What spatial and seasonal PET patterns occur within the Barrendain intervention area, and which microclimatic processes and urban features primarily explain these patterns?
RQ4. To what extent do simulated PET classifications correspond with users’ reported thermal sensations across the seasonal campaigns?
RQ5. What reported patterns of public-space use and perceived sociability emerge from the survey, and what design implications can be derived without assuming a direct causal relationship between environmental comfort and social interaction?
2. Materials and Methods
The study is part of the KALELAGUN (meaning “
friendly street” in Basque) research project lead by the University of the Basque Country, a multidisciplinary initiative aimed at developing evidence-based design strategies for age-friendly public spaces through the integration of environmental assessment, microclimatic simulation and participatory processes. The methodological framework is described in detail in the KALELAGUN Design Guide [
12]. The framework adopts an open-innovation approach that combines environmental, spatial and social analysis with participatory co-creation.
Within this framework, the present study adopts a mixed-method case-study approach combining environmental measurements, thermal comfort assessment, microclimatic simulations, and field surveys. The objective is to examine the relationship between thermal conditions, environmental perception, and patterns of use among older adults in public space.
2.1. Study Area and Research Context
The study was conducted within the Barrendain intervention area, located in the municipality of Beasain (Gipuzkoa, Basque Country, northern Spain), one of the pilot sites of the KALELAGUN project. The project is promoted by the ADINBERRI Foundation, the Gipuzkoa Provincial Council and participating municipalities within the framework of the Gipuzkoa Strategy on Loneliness (HARIAK). It has also been recognised as a good practice within the KORALE project (Interreg Europe).
The selection of Barrendain Square emerged from an ongoing process of collaboration between the research team and the Municipality of Beasain. The team had previously collaborated with the municipality through the ETXELAGUN project and, subsequently, within the KALELAGUN project, developed in partnership with the municipalities of Beasain, Donostia-San Sebastián and Arrasate under the Gipuzkoa Strategy on Loneliness (HARIAK). During the initial stages of KALELAGUN, Beasain identified Barrendain Square as a priority site for redevelopment, with a municipal intervention already planned and funded. This provided an opportunity to integrate the research into a real urban transformation process and to generate evidence capable of informing the ongoing design proposal.
In addition, the intervention area presented several characteristics that made it particularly suitable for this research, including its central location within the municipality, its role in everyday pedestrian mobility, its frequent use by older residents, the coexistence of transit and staying activities, and the presence of contrasting microclimatic conditions associated with vegetation, paved surfaces and surrounding buildings.
For clarity, the term “Barrendain intervention area” is used throughout this paper to refer to the full pre-redevelopment urban area considered in the municipal project, including the existing playground, the roundabout, the intervening roadway, Avenida de Navarra and the adjacent pedestrian spaces. At the time of the study, these elements did not constitute a consolidated public square. The existing place commonly referred to as Barrendain Square corresponded primarily to the playground area, while most everyday pedestrian activity was concentrated along Avenida de Navarra and the surrounding routes. The surveys and the reported PET analyses therefore characterise the pre-intervention conditions of the wider redevelopment area rather than the performance of an already consolidated square.
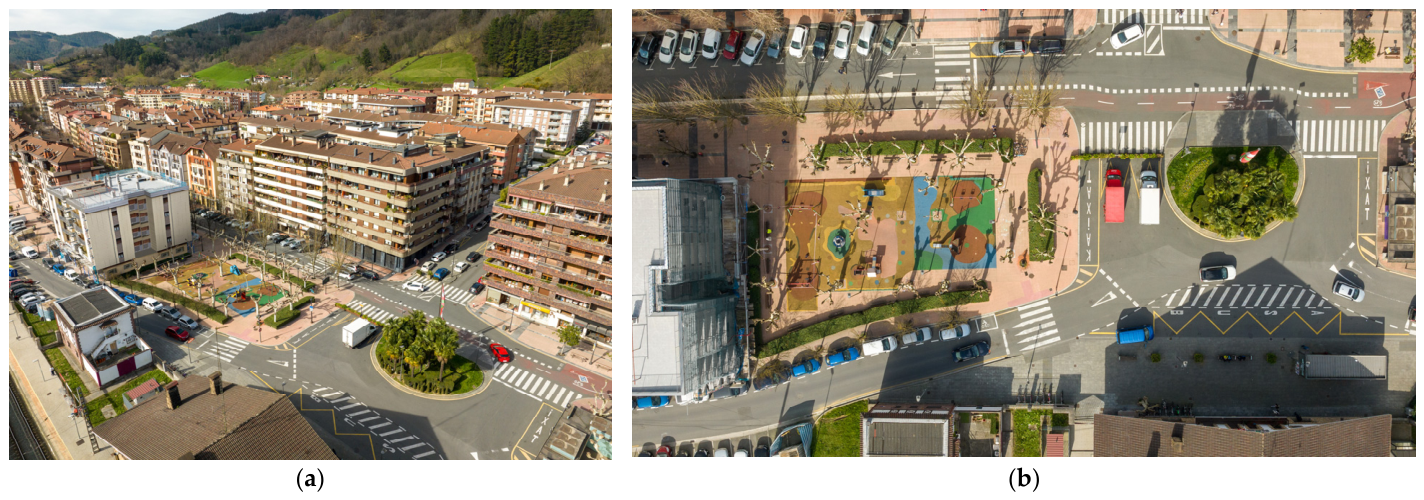
At the time of the study, the municipal project aimed to transform the fragmented, traffic-dominated intervention area into a continuous, inclusive and accessible public space by integrating the existing playground, roundabout, roadway and adjacent pedestrian areas (
Figure 1). The surveys, measurements and simulations reported in this paper characterise the pre-intervention configuration and provide baseline diagnostic evidence for the design process. The analysis was used to identify thermally exposed and protected areas, assess the role of the existing tree canopy and inform decisions concerning seating, climatic protection and spatial continuity. The proposed redevelopment itself was not simulated, and its thermal performance should therefore not be regarded as validated by the present results.
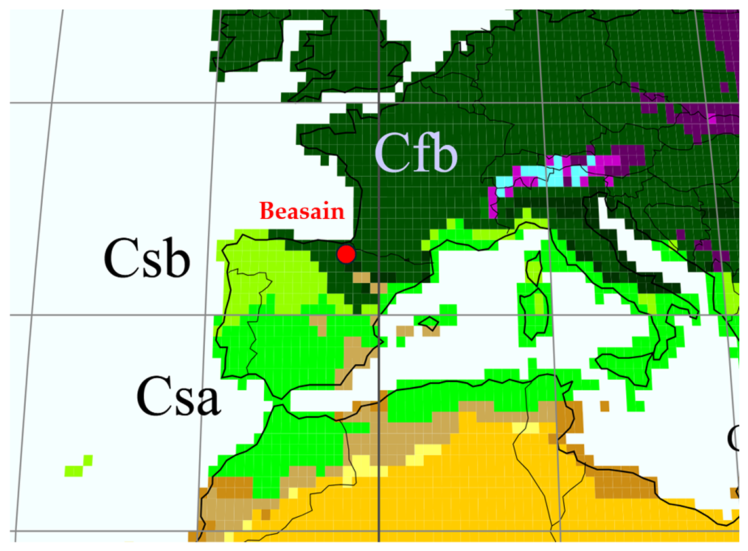
Beasain is a medium-sized municipality at an altitude of 159 m above sea level and characterised by a temperate Atlantic climate (Cfb according to the Köppen–Geiger classification) (
Figure 2). This climate is defined by mild temperatures, high humidity, and abundant precipitation throughout the year. The annual mean temperature is 12.3 °C, with average minimum and maximum temperatures of 7.9 °C and 16.8 °C, respectively. These characteristics make Beasain relevant for examining seasonal thermal adaptation in a temperate Atlantic context, where outdoor use is shaped not only by summer heat exposure but also by rainfall, humidity, wind and access to winter solar radiation [
38].
Beasain has a population of 13,915 inhabitants (6984 men and 6931 women), of whom 39.7% are aged 55 years or older (2635 men and 2896 women) [
40]. This demographic structure is particularly relevant for the present study, given its focus on older adults and their use of public space. Moreover, 953 people over 55 years live alone in Beasain (339 men and 614 women) (EUSTAT 2022). Living alone has been associated with an increased likelihood of loneliness compared to living with others [
41], highlighting the importance of social environments that support interaction and reduce isolation.
Women constitute a higher proportion of the older population, particularly from the age of 75 onwards (746 men and 1054 women). This sex imbalance is relevant for interpreting patterns of space use, perception, and social interaction among older adults (
Table 1).
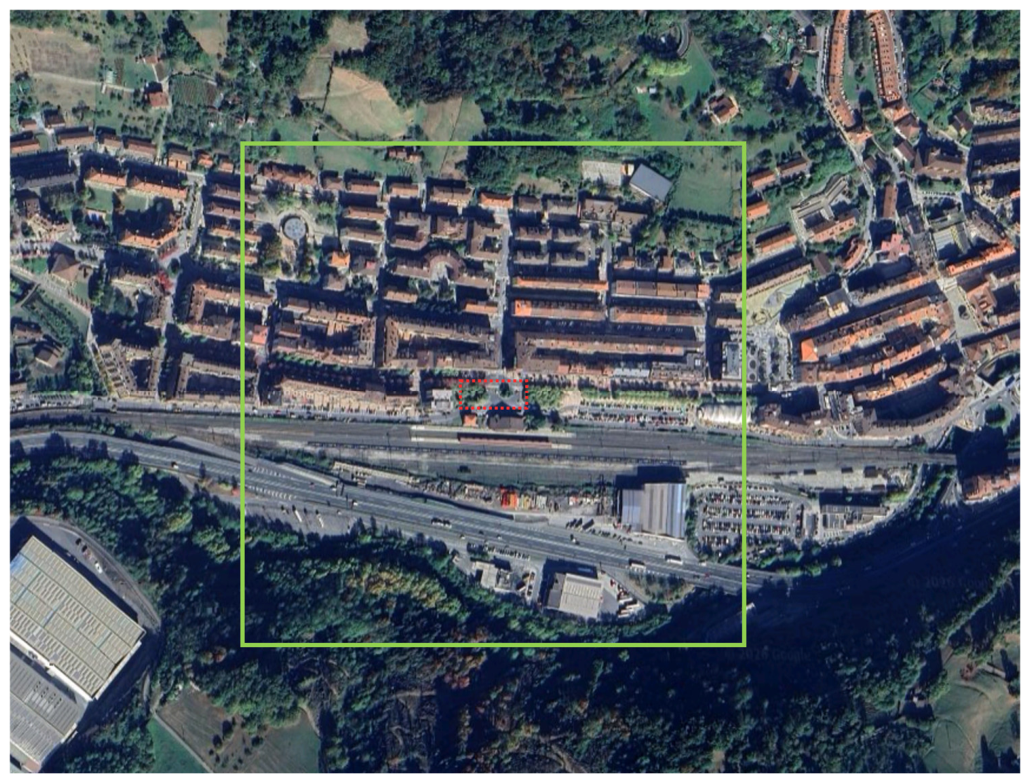
The Barrendain intervention area covers approximately 5500 m
2 in the centre of Beasain (
Figure 3). Older adults constitute one of the principal user groups considered in the KALELAGUN framework, although the planned public space is intended for the wider population.
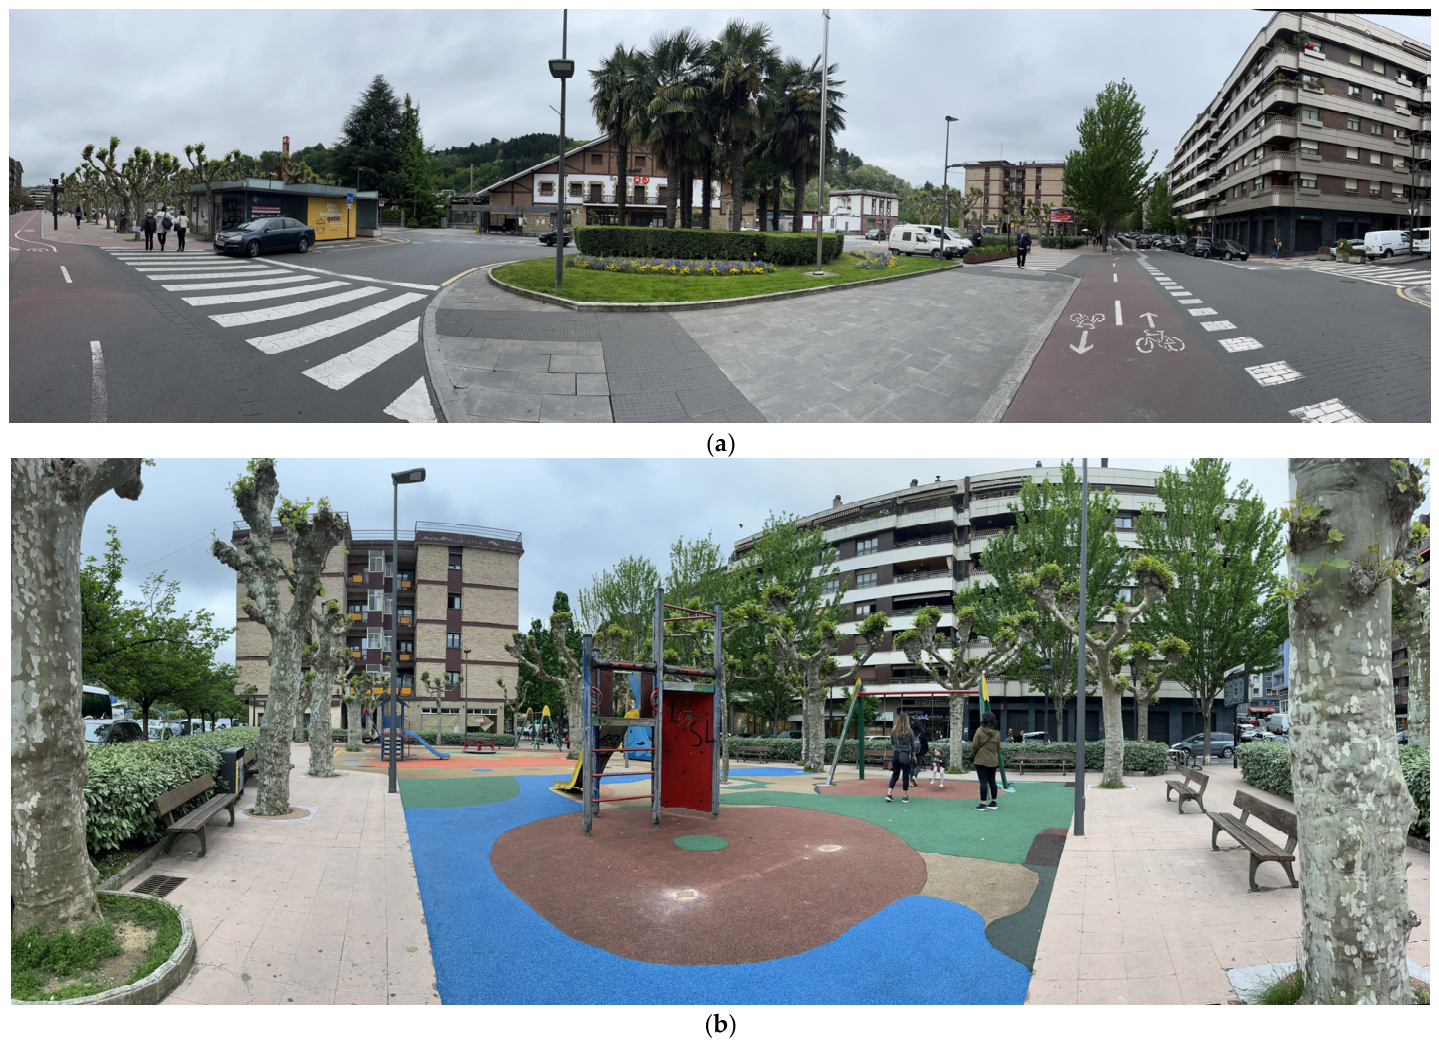
The site occupies a strategic position within the urban fabric, connecting key mobility flows and everyday-use spaces. To the south, the train station and a high-traffic road generate a constant flow of pedestrians, while to the north it borders Avenida de Navarra, one of the municipality’s main pedestrian axes (
Figure 4). The project integrates the existing roundabout with the adjacent playground, creating a continuous public space that supports both movement and stay. On the eastern side, the “Pergolas” area—frequently used by local residents, including older adults—reinforces the role of the site as a setting for everyday activity and informal encounter.
The proposed redevelopment incorporates areas for rest and leisure, children’s play, vegetation, multifunctional uses, pedestrian and cycling routes, new seating and climatic-protection measures. These design intentions are described only to establish the applied context of the research; their environmental and post-occupancy performance is outside the scope of the present baseline study.
2.2. Survey Campaign
At the time of the field campaigns, the Barrendain redevelopment had not yet been implemented and the future square did not exist as a consolidated public space. The survey location was selected pragmatically to intercept actual users of the pre-intervention area, since pedestrian activity was concentrated along Avenida de Navarra and very limited use was observed within the existing playground. This approach ensured that the survey captured the perceptions of regular users of the intervention area under pre-intervention conditions, providing the baseline information required for the subsequent redesign process.
A non-probability intercept sampling approach was adopted because the objective was to characterise environmental perception under real-use conditions rather than to estimate population prevalence. Consequently, the sampling strategy prioritised contextual diversity across seasons and weather conditions over statistical representativeness.
Only participants aged 55 years and over were included in the final sample. This age threshold was adopted because the KALELAGUN project was developed within the ADINBERRI and HARIAK strategies, which identify adults aged 55 years and over as the target population for promoting healthy ageing, preventing loneliness and supporting age-friendly environments [
42,
43]. Rather than focusing exclusively on older age, this approach adopts a preventive life-course perspective, recognising that physiological, behavioural and social changes relevant to everyday environmental perception may begin before the conventional threshold of 65 years. The inclusion of adults from 55 years onwards therefore enabled the study to capture a broader range of ageing trajectories, consistent with the strategic framework in which the project was developed.
Potential participants were initially approached on the basis of their apparent age and subsequently invited to participate. Eligibility (≥55 years) was confirmed before administering the questionnaire.
Fieldwork was conducted during four two-week seasonal campaigns in 2024: 29 January–11 February, 15–28 April, 1–14 July, and 23 September–6 October. Surveys were carried out on alternating days and at three different times of day: 9:00–10:00, 12:00–13:00, and 16:00–17:00, selected to capture different patterns of public-space use throughout the day.
A structured questionnaire was designed to assess environmental perception and social interaction within the study area. The instrument was organised into four main thematic sections addressing: (i) personal and behavioural characteristics; (ii) thermal perception; (iii) reported public-space use and perceived sociability; and (iv) multisensory environmental perception. Although additional socio-demographic and contextual information was collected, the present study focuses on the variables directly related to environmental perception, thermal comfort, reported public-space use and perceived sociability, as these correspond to the objectives of the study and the statistical analyses presented in the results section.
Table 2 summarises the main questionnaire sections and variables considered in the analysis. The complete questionnaire is provided in
Supplementary Materials.
Questions concerning activities undertaken in the study area and perceived facilitators of social interaction allowed multiple responses. Consequently, percentages reported for these variables may exceed 100%.
The first part recorded age, sex, place of birth, clothing insulation level, qualitative body-build category, posture or activity level (seated or standing), accompaniment, and living situation. In addition, contextual environmental conditions such as sun exposure, cloudiness, wind, and noise presence were recorded during the survey.
The second part of the questionnaire focused on thermal perception using structured subjective scales. Thermal sensation vote (TSV) was assessed using a five-point scale ranging from −2 (cold) to +2 (hot), adapted from the ASHRAE framework and ISO 10551 (2019) [
44] in order to improve usability and response reliability under field conditions, particularly among older adults [
45,
46].
Thermal comfort was evaluated using a five-point scale (1. comfortable; 2. quite comfortable; 3. slightly uncomfortable; 4. very uncomfortable; 5. extremely uncomfortable), adapted from ISO 10551 (2019), allowing respondents to assess perceived comfort under real outdoor conditions [
45,
46].
Thermal preference (TP) was assessed using a five-point scale (1. much warmer; 2. warmer; 3. no change; 4. cooler; 5. much cooler), based on the preference categories defined in ISO 10551 (2019) and commonly used in outdoor thermal comfort studies [
47,
48].
Humidity perception was evaluated using a three-point scale (1. humid; 2. neutral; 3. dry), while humidity preference was assessed through a corresponding three-point scale (1. more humid; 2. no change; 3. drier), following approaches commonly used in outdoor comfort [
24,
49].
Wind perception was assessed using a five-point scale (1. no wind; 2. light wind; 3. moderate wind; 4. strong wind; 5. very strong wind), consistent with descriptors commonly used in outdoor thermal comfort research [
47,
50].
Overall, the selected scales were adapted from international frameworks including ISO 10551 and the ASHRAE thermal sensation model, while being simplified to facilitate comprehension and usability under real outdoor survey conditions among older adults [
45,
51].
The third part addressed patterns of social interaction, including living arrangements (living alone versus living with others), companionship at the time of the survey (alone vs. accompanied), primary activities performed in the space, seasonal attendance (winter and summer), and perceived sociability, defined as the ease of interacting with others.
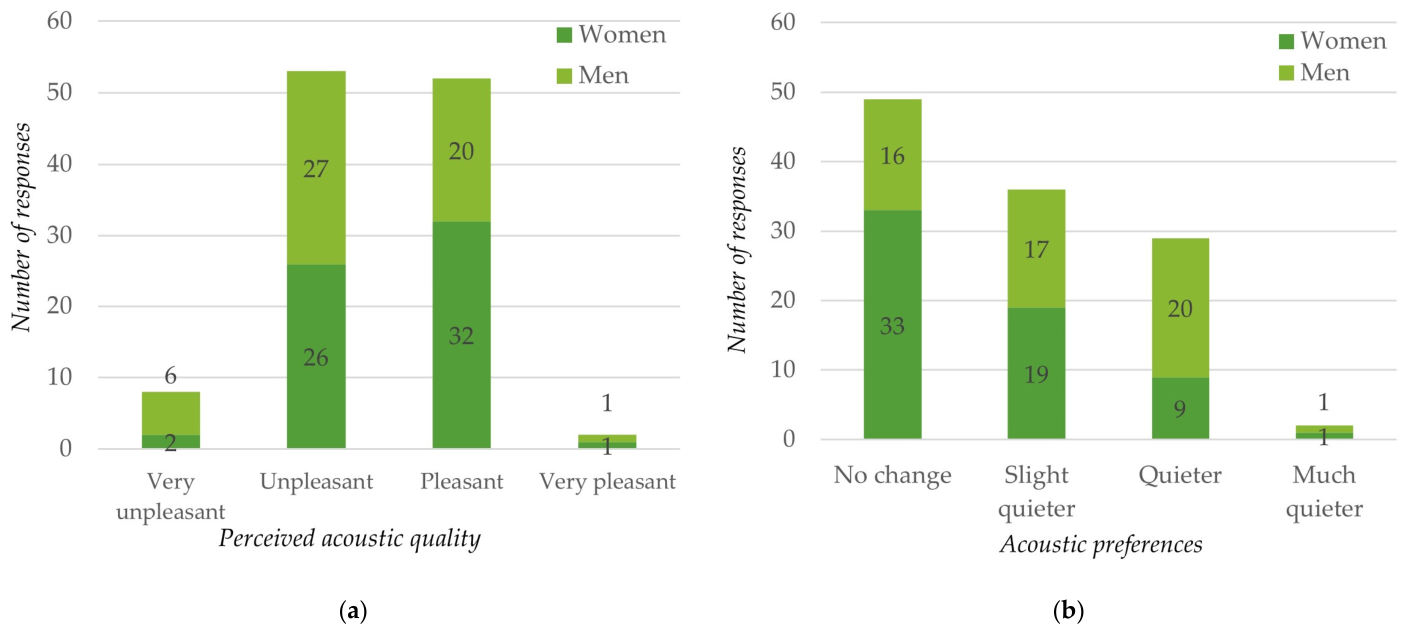
The fourth part of the questionnaire addressed the multisensory perception of the space. This section included the assessment of perceived acoustic quality using a four-point scale (1. very unpleasant; 2. unpleasant; 3. pleasant; 4. very pleasant), based on a semantic differential approach consistent with ISO 10551 adapted to the acoustic domain. The use of an even-numbered scale avoids a neutral midpoint, encouraging respondents to express a clear evaluative tendency [
16,
52].
Acoustic preferences were measured through a four-point scale indicating desired changes in sound conditions (1. no change; 2. slightly quieter; 3. quieter; 4, much quieter). This directional preference approach is consistent with methodologies used in soundscape research and aligns conceptually with thermal preference scales, allowing the identification of desired environmental adjustments rather than static evaluations (ISO 12913-2, 2018) [
53].
This section also examined visual perception of colour within the space and incorporated open-ended questions to identify users’ suggestions for spatial improvement. The inclusion of qualitative responses complements structured scales by capturing contextual, cognitive, and experiential aspects of environmental perception. This mixed-method approach is widely recommended in soundscape and environmental perception research to better understand the interaction between physical stimuli and subjective appraisal [
53,
54].
2.3. Environmental Measurements
Environmental data were acquired from an official meteorological station located near the study site [
55]. The environmental conditions presented correspond to the meteorological data recorded during the periods in which the surveys were conducted in each season (
Table 3). Mean air temperature ranged from 11.27 °C in winter to 20.81 °C in summer, with maximum and minimum values of 28.0 °C and 3.3 °C, respectively. Relative humidity showed mean values between 72.48 and 77.47 across seasons. Mean wind speed ranged from 0.24 m/s to 0.96 m/s, and solar radiation varied from 95.47 W/m
2 in winter to 501.47 W/m
2 in summer.
2.4. Thermal Perception Analysis
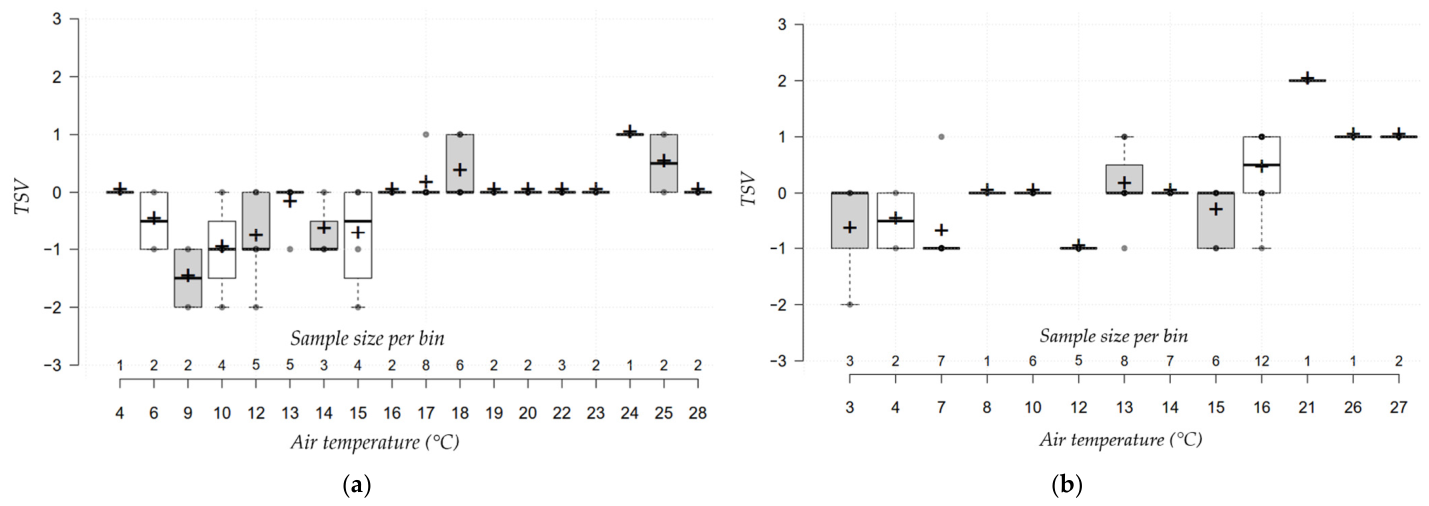
The relationship between air temperature and thermal sensation was analysed, with particular attention to campaign-specific neutral temperatures, the role of behavioural and contextual variables, and the limitations of simplified Ta-based approaches.
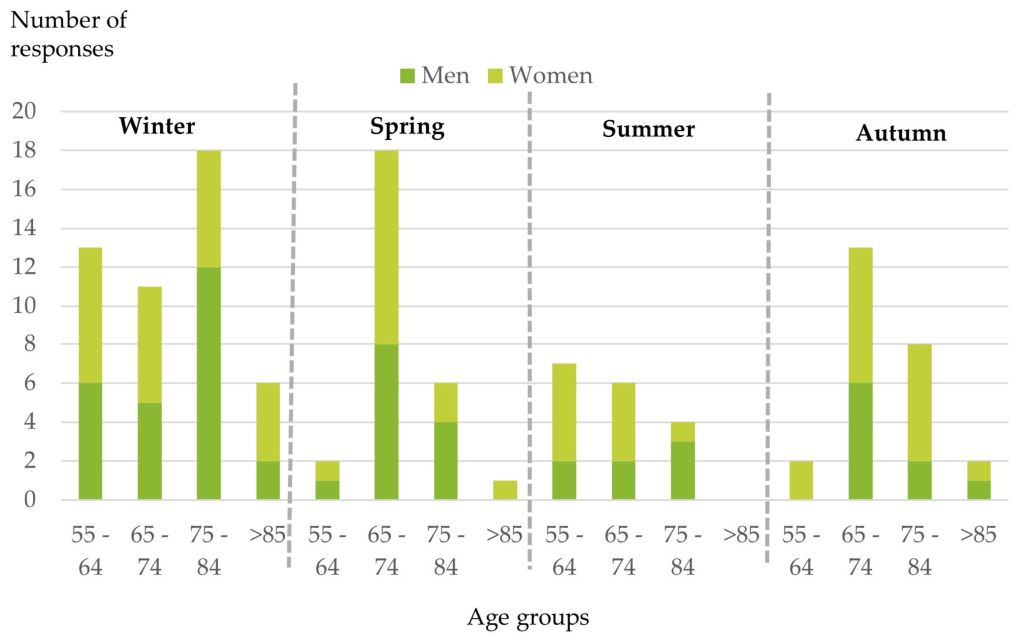
Survey data were grouped into two campaign-based periods: a cold-period campaign (January, February, and October; n = 61) and a warm-period campaign (April, July, and September; n = 56) (
Table 4). The cold- and warm-period groupings reflect the organisation of the survey campaigns rather than strict climatological seasons, acknowledging the influence of behavioural adaptation and seasonal expectations on outdoor thermal perception. In outdoor contexts, thermal sensation is influenced not only by instantaneous conditions but also by expectations, prior exposure, clothing habits, and everyday practices [
32,
33,
45,
49,
56]. The terms “cold-period” and “warm-period” should therefore be interpreted as campaign labels rather than homogeneous thermal categories.
For each interview, the dataset included air temperature (Ta), relative humidity, solar radiation and wind speed, together with contextual descriptors such as sun exposure, cloudiness and perceived wind. Personal variables included clothing, posture, body-build category, age and sex. Thermal sensation was reported through a five-point TSV scale from −2 (very cold) to +2 (very warm).
This analysis focuses on variables consistently available across paired survey-measurement records. Body-build category was assessed qualitatively and should not be interpreted as a direct anthropometric measure. Although wind speed was recorded, it was not treated as a primary explanatory variable due to insufficiently stable distributions across the campaign datasets.
2.5. Data Processing and Statistical Analysis
To reduce variability in field TSV data, mean thermal sensation vote (MTSV) values were calculated using 1 °C air-temperature bins, a common approach in outdoor thermal comfort studies that clarifies central tendencies without removing individual variability [
32,
33,
49,
56].
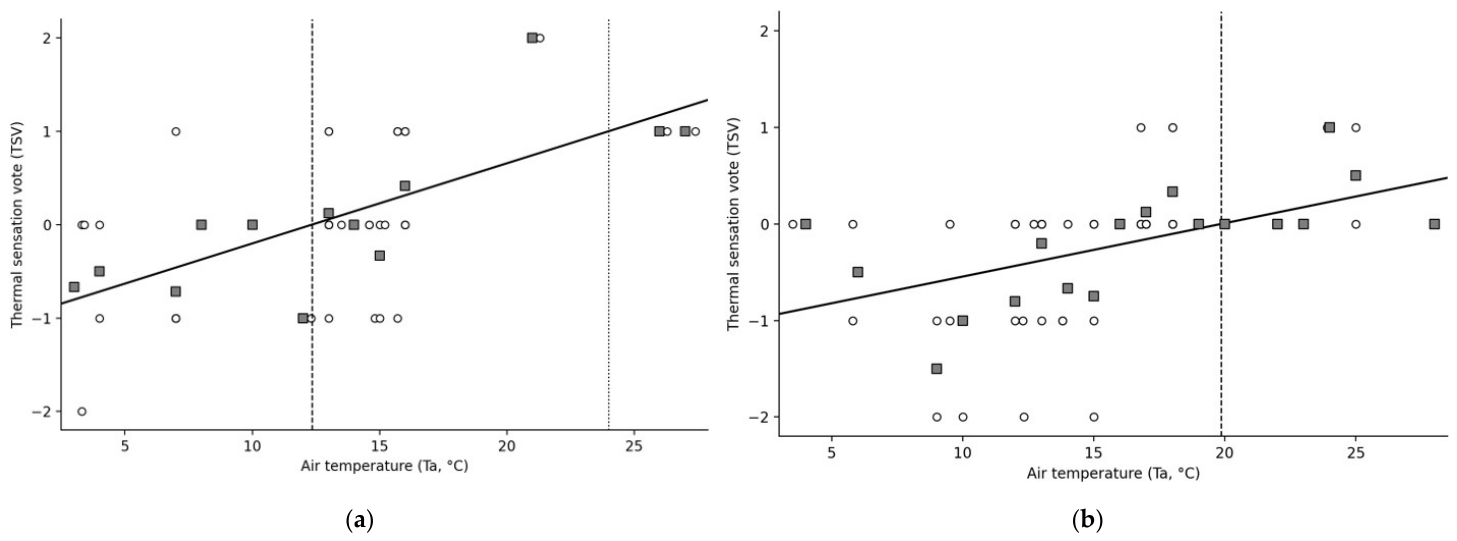
For each campaign, a linear regression was fitted to the MTSV-Ta relationship to estimate neutral temperature (Tn) at MTSV = 0. Values corresponding to MTSV = −1 and +1 were also derived but were interpreted as model outputs rather than observed comfort limits.
Given the ordinal nature of TSVs and the presence of small or unbalanced subgroups, non-parametric tests were applied. Kruskal–Wallis tests were used for multiple-group comparisons, Mann–Whitney U tests for binary contrasts, and Spearman rank correlations for monotonic relationships with continuous variables. The statistical analyses were designed to identify associations between environmental variables, subjective perception and reported public-space use. Given the observational and cross-sectional design of the study, the reported relationships should be interpreted as statistical associations rather than evidence of causal relationships. Accordingly, the results were interpreted as exploratory rather than confirmatory.
2.6. Microclimatic Simulations
2.6.1. Simulation Objectives
The main objective of the simulations was to characterise the spatial and seasonal distribution of outdoor thermal conditions within the study area and to provide an independent model-based assessment of the microclimatic environment experienced by older users.
The simulations were used to complement the field surveys by enabling the comparisons between modelled environmental conditions and users’ subjective thermal responses. This combined approach made it possible to examine the extent to which thermal sensation, comfort and thermal preference were associated with the microclimatic conditions simulated for different locations within the intervention area and different periods of the year.
In addition, the simulations supported the decision-making process associated with the ongoing redesign of Barrendain Square. The spatial analysis of thermal conditions at specific locations within the intervention area helped identify areas requiring environmental improvement and informed decisions regarding the distribution of seating areas, the incorporation of vegetation, and the location of shaded and protected spaces. In this way, the simulations provided both an analytical framework for interpreting users’ perceptions and a practical basis for climate-responsive design interventions. Thermal comfort conditions were evaluated using the physiological equivalent temperature (PET) index calculated through the BIO-met module integrated within ENVI-met.
2.6.2. Model Domain and Intervention Area
The study area was analysed together with its immediate built and environmental surroundings (
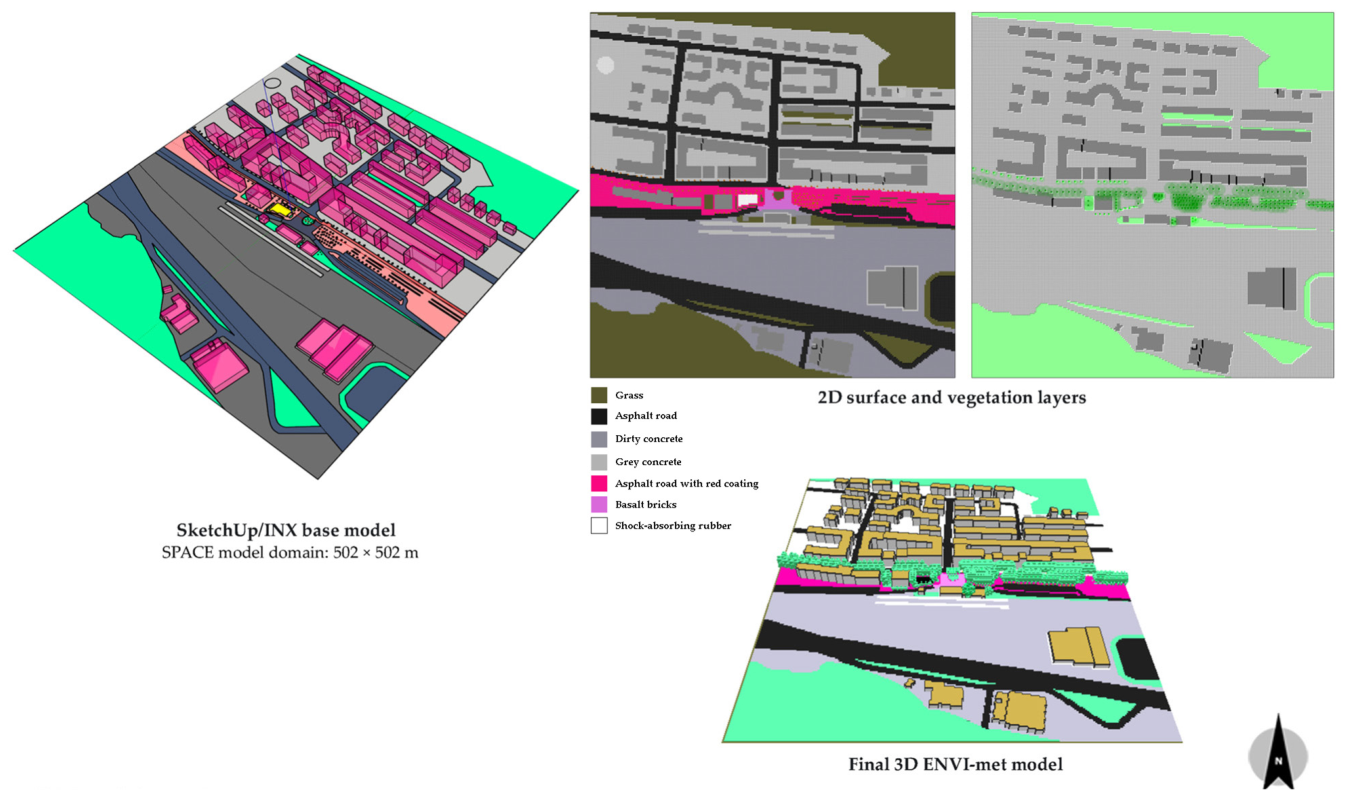
Figure 3). The three-dimensional urban model was developed in SketchUp 2026 through the ENVI-met/INX workflow and subsequently configured for ENVI-met 5.9 Science (
Figure 5 and
Table 5). The model reproduced the main physical elements affecting pedestrian-level microclimatic conditions within the study area, including building volumes, paved surfaces, natural soil areas, grass surfaces, and tree vegetation. In CFD-based urban studies, domain size and the distance between the area of interest and the model boundaries are recognised as critical factors affecting numerical robustness and the interpretation of pedestrian-level conditions [
34].
The computational domain was defined as an equidistant grid composed of 251 × 251 × 26 cells, with a uniform spatial resolution of 2.0 m in the X, Y, and Z directions. This resulted in an approximate physical domain of 502 m × 502 m × 52 m. The tallest building represented in the model was approximately 22 m high; therefore, the vertical domain extended to approximately 2.4 times the maximum building height, providing sufficient atmospheric space above the built volumes for near-ground microclimatic simulation.
The Barrendain intervention area was positioned in the central part of the computational domain and surrounded by an urban buffer in order to reduce the influence of lateral boundary conditions on the analysis area. The grid rotation angle was set to 0.0°. The use of an equidistant grid ensured a constant spatial resolution across the model and facilitated direct comparison among the different simulation outputs.
2.6.3. Material and Vegetation Parameterisation
Material and vegetation parameterisation was based on the correspondence between the physical elements observed in Barrendain Square and the closest available entries in the ENVI-met database (
Table 6). Standard materials already included in the database, such as walls, roofs, asphalt, concrete pavements, loamy soil, grass, and standard vegetation elements, retained the default thermophysical or biophysical parameters provided by ENVI-met. This choice ensured consistency between the assigned material codes and the internal properties used by the model.
The shock-absorbing rubber surface present in the square was introduced as a custom material because it was not adequately represented by the standard ENVI-met material classes. For this type of playground safety surfacing, the available technical documentation generally focusses on impact attenuation and safety performance rather than radiative properties such as albedo or solar reflectance index (SRI). In the absence of product-specific optical measurements or declared radiative data, a representative mean albedo value was assigned on the basis of the dominant surface colour in order to approximate its radiative behaviour. This parameterisation is explicitly treated as a source of modelling uncertainty.
Tree vegetation was defined from the official planting plan for Barrendain Square and assigned to the corresponding or closest available entries in the ENVI-met plant database. The model therefore represented vegetation according to the documented botanical composition of the site, rather than as a generic green layer.
Table 6 summarises the material codes, sources, and parameterisation criteria adopted in the ENVI-met model.
2.6.4. Climatic Forcing and Simulation Protocol
Meteorological input data were derived from records of the Beasain meteorological station. The station dataset was processed into a dedicated CSV file for the selected field-survey dates and imported into ENVI-met through the Advanced Meteorology module as a full-forcing meteorological file. Before running the simulations, ENVI-guide was used to verify that the forcing file covered the complete simulation period.
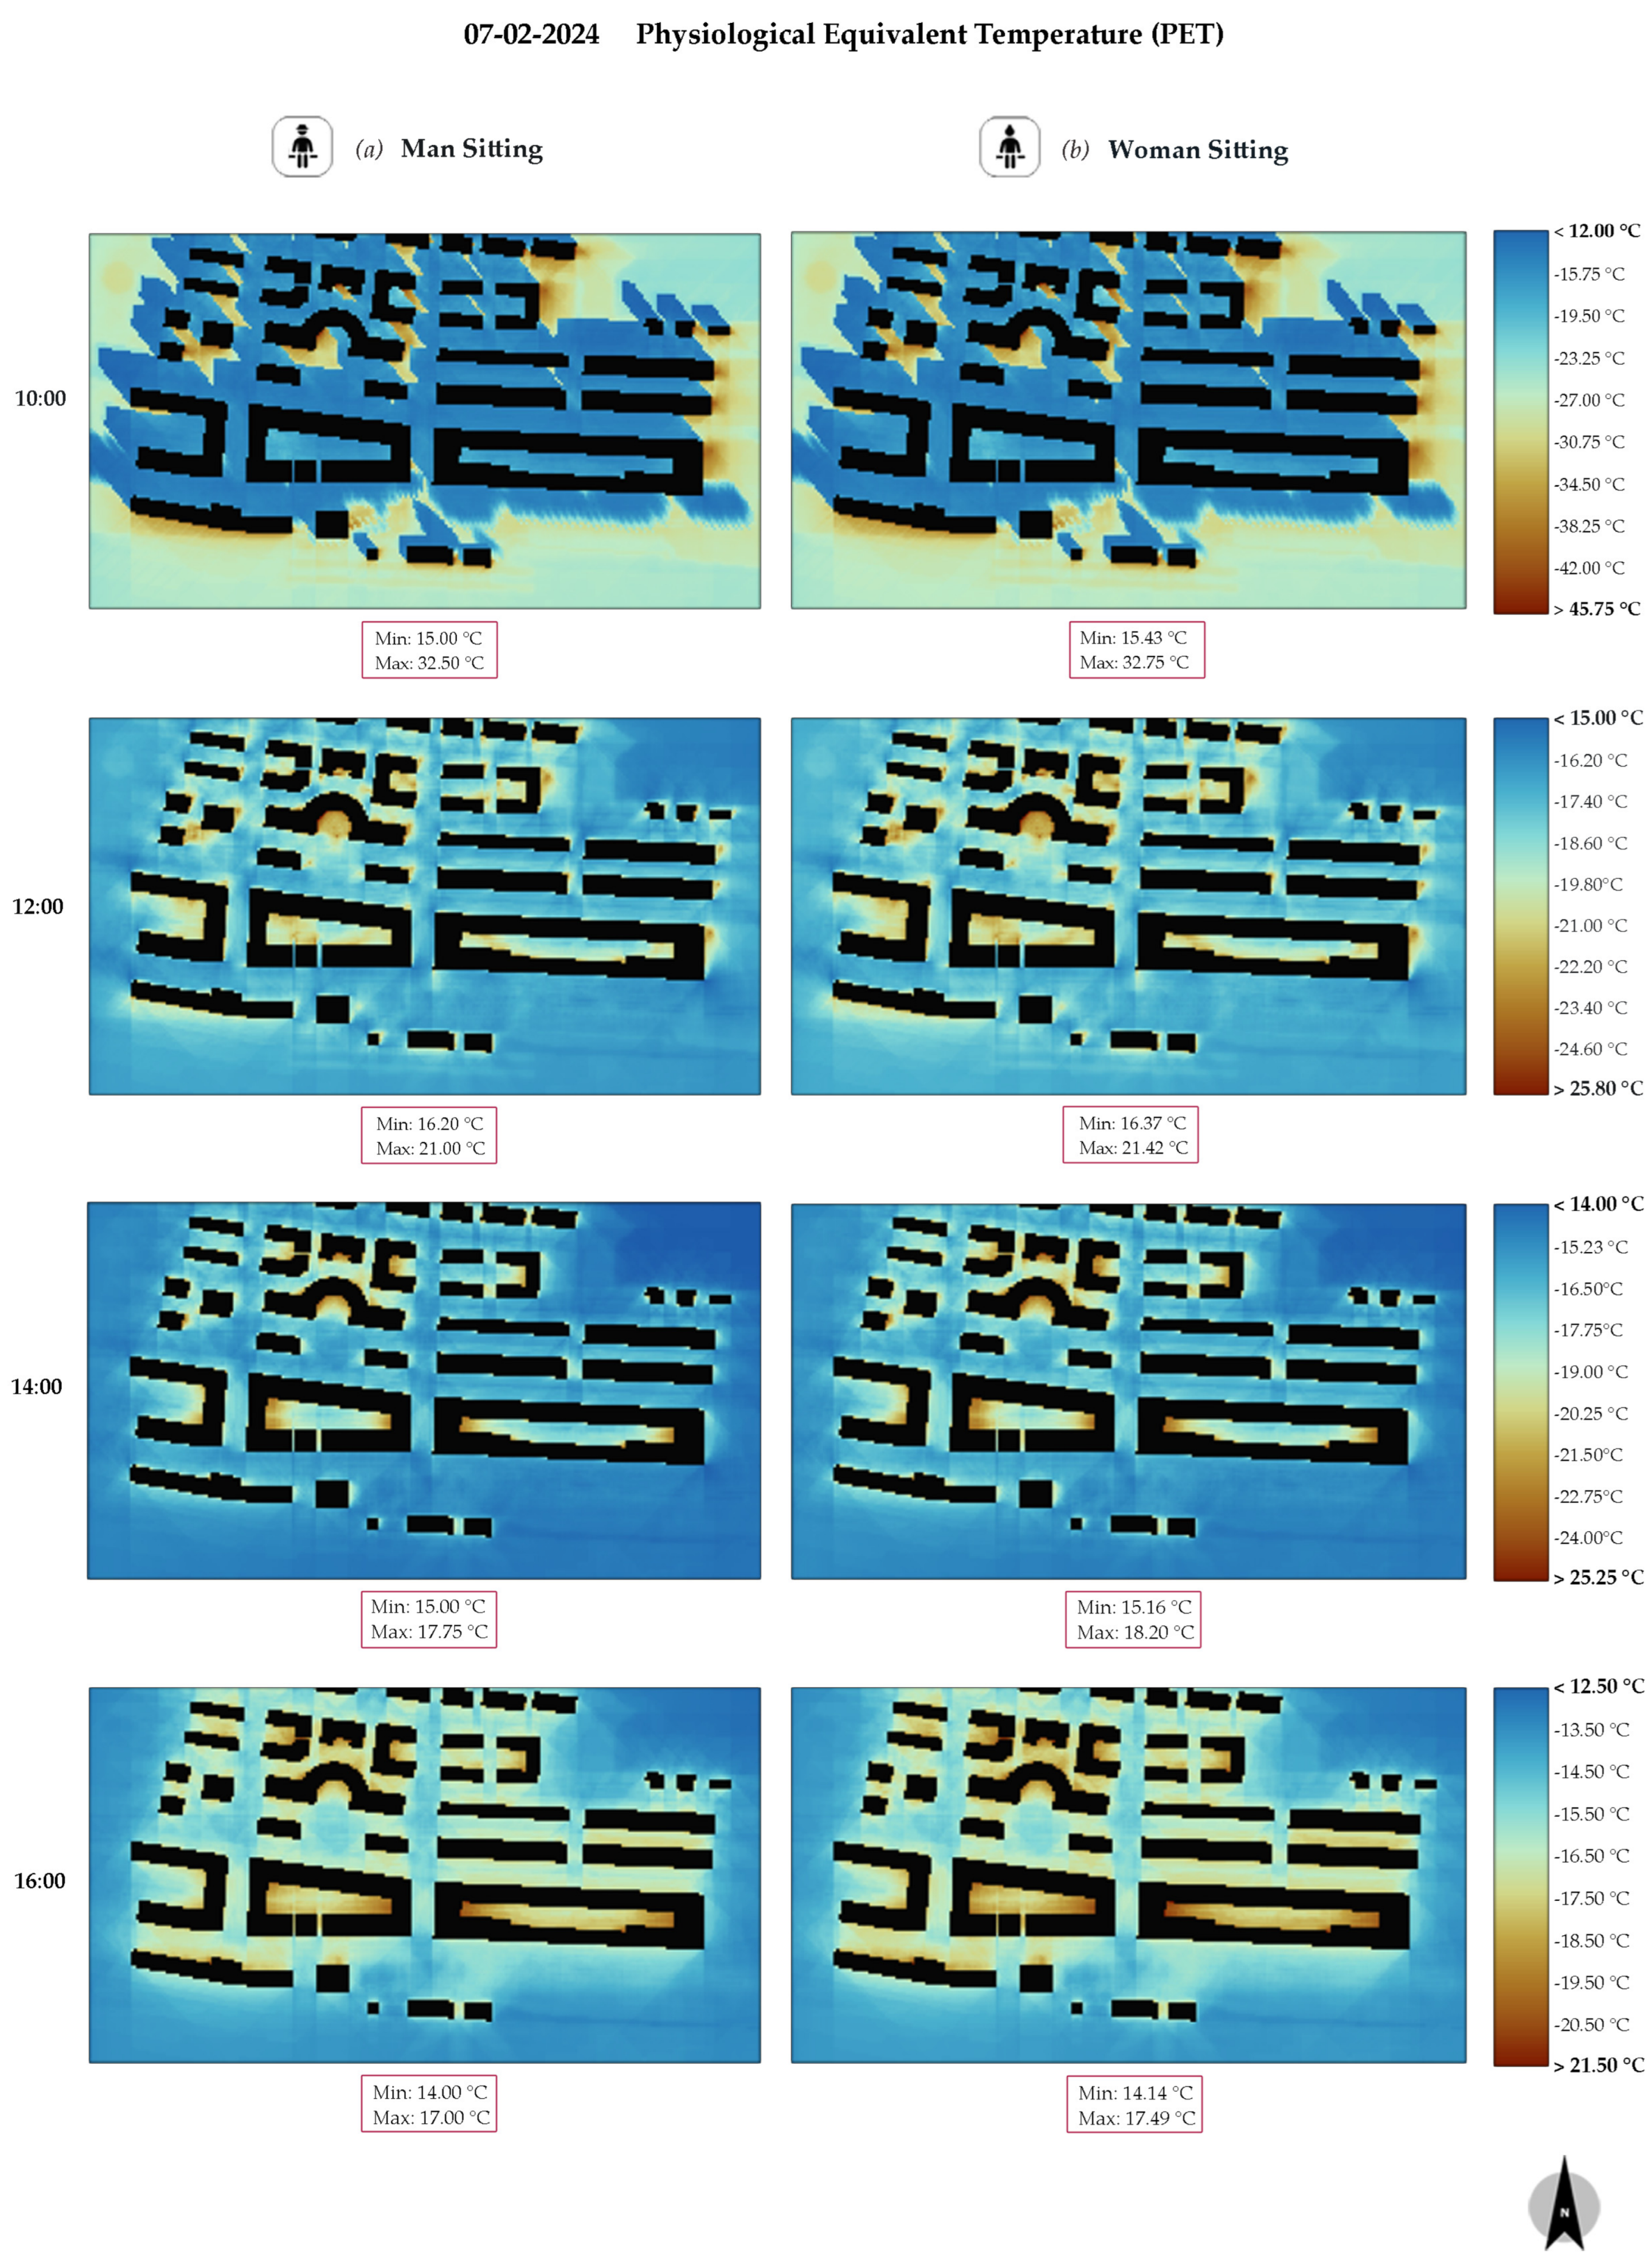
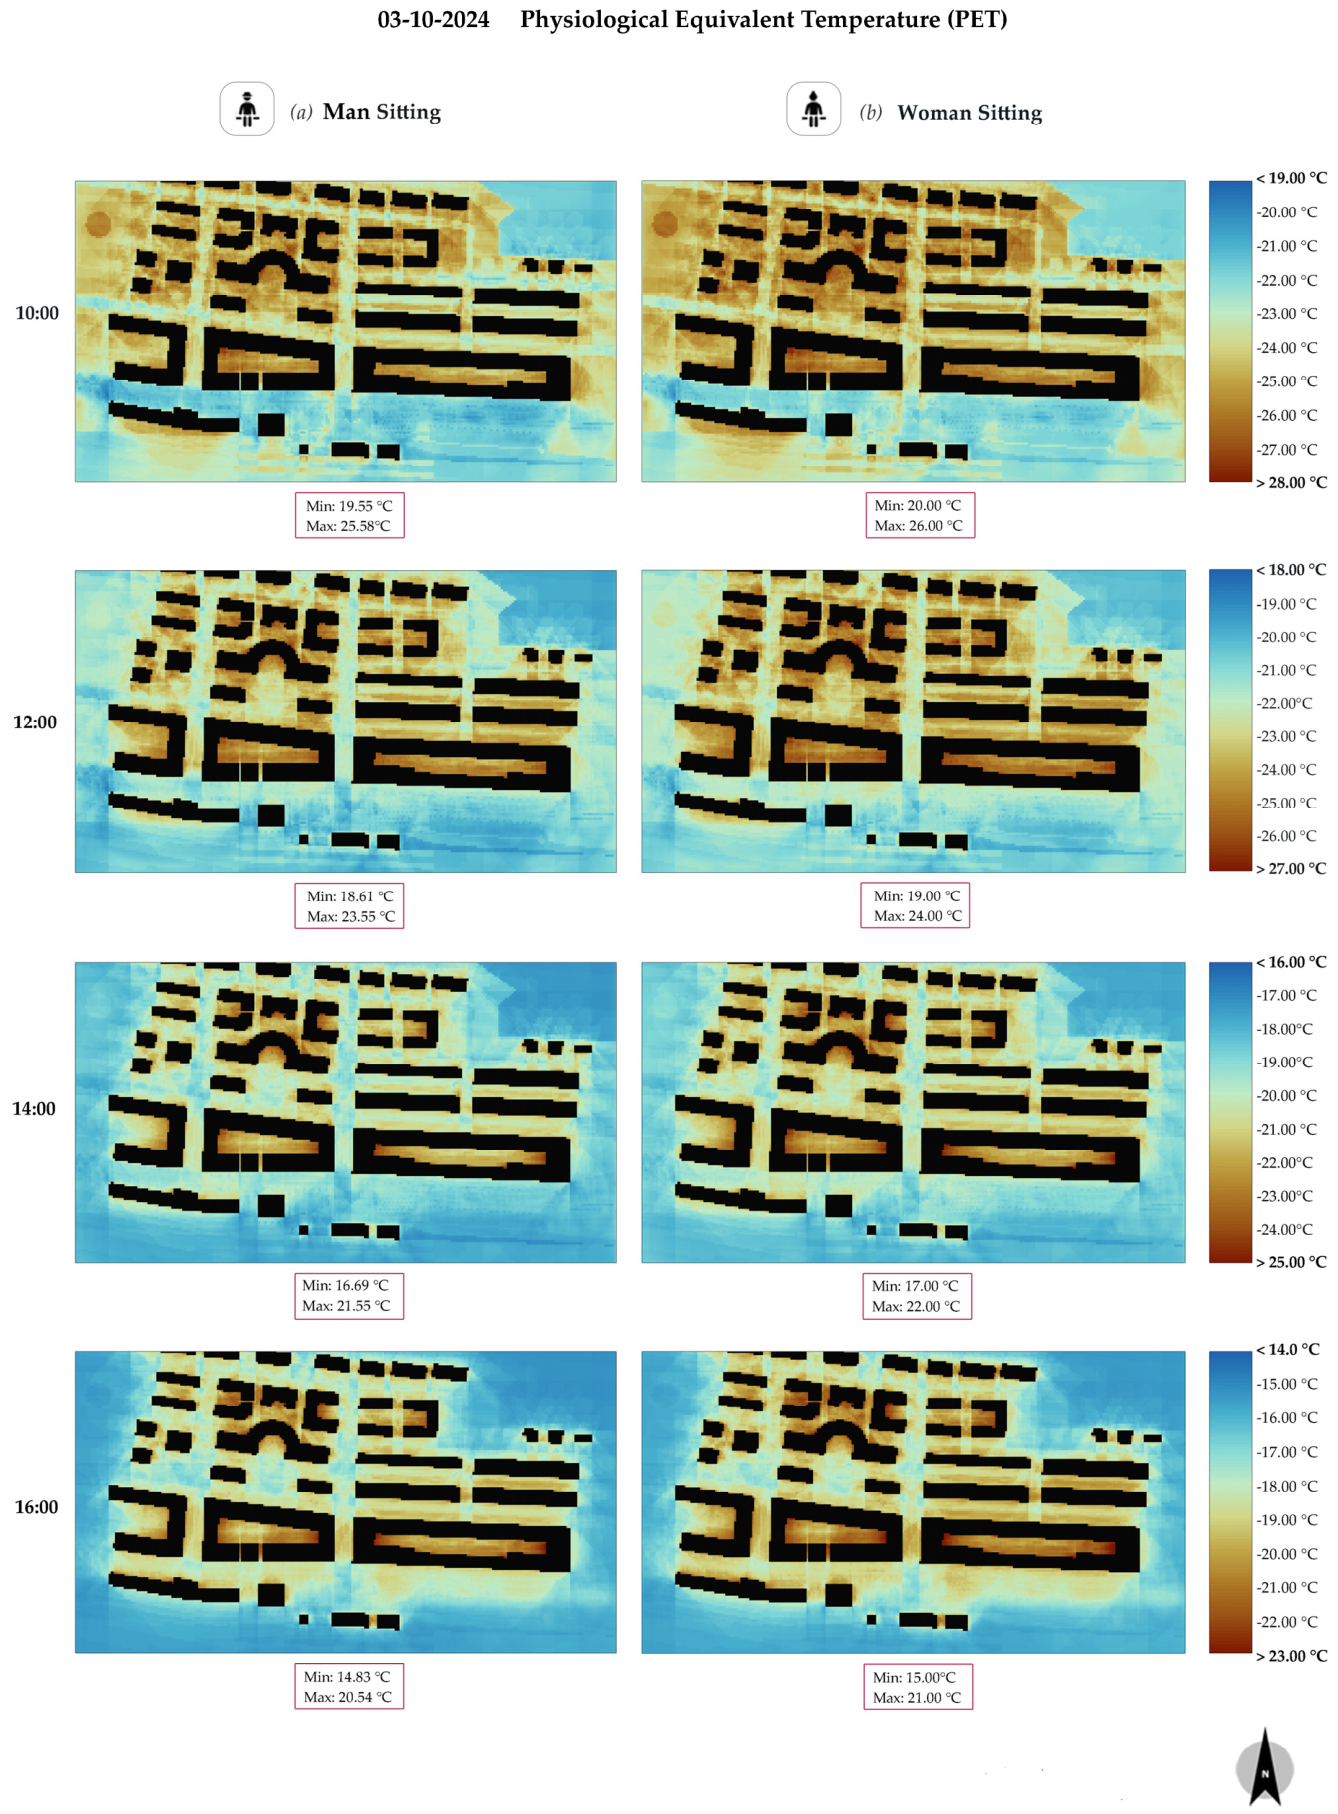
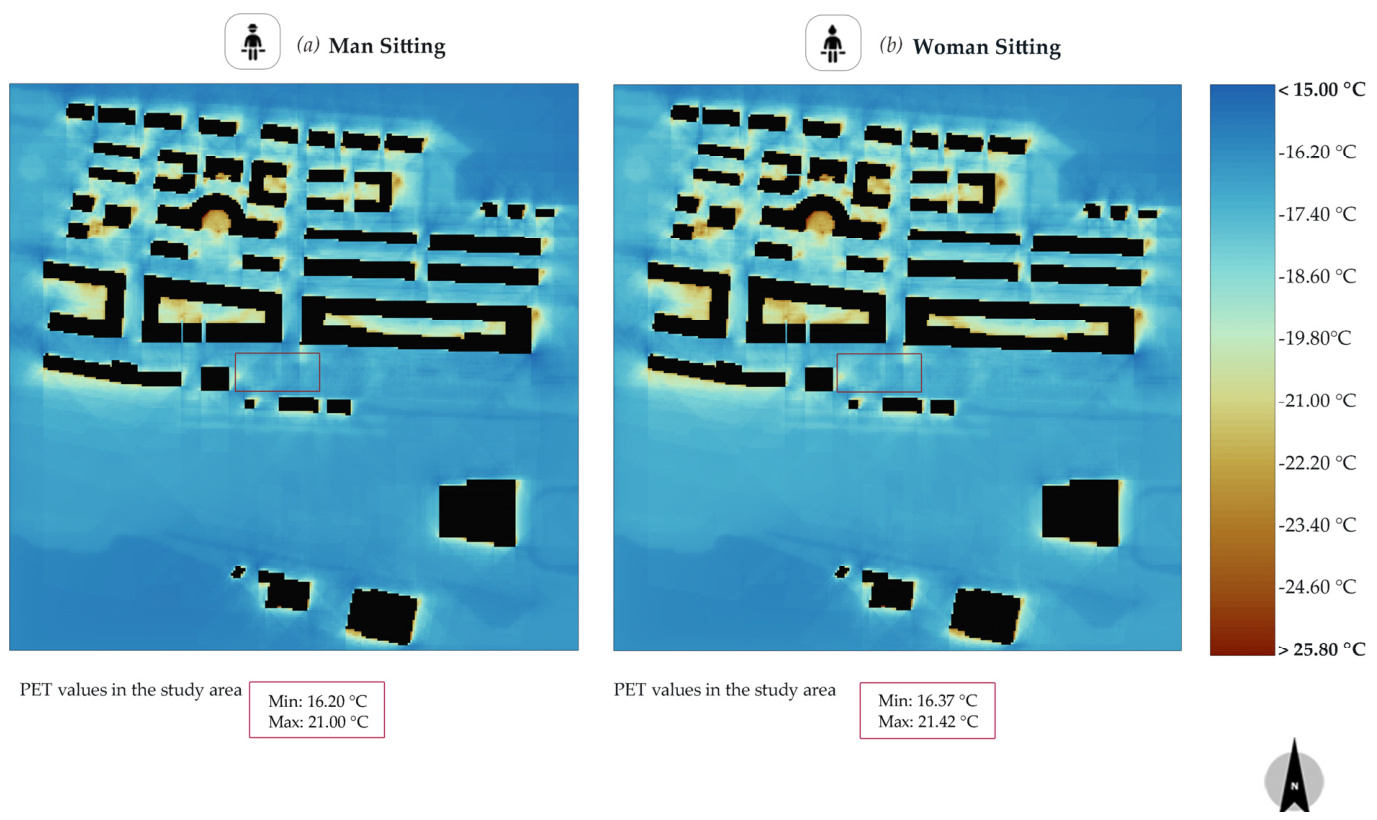
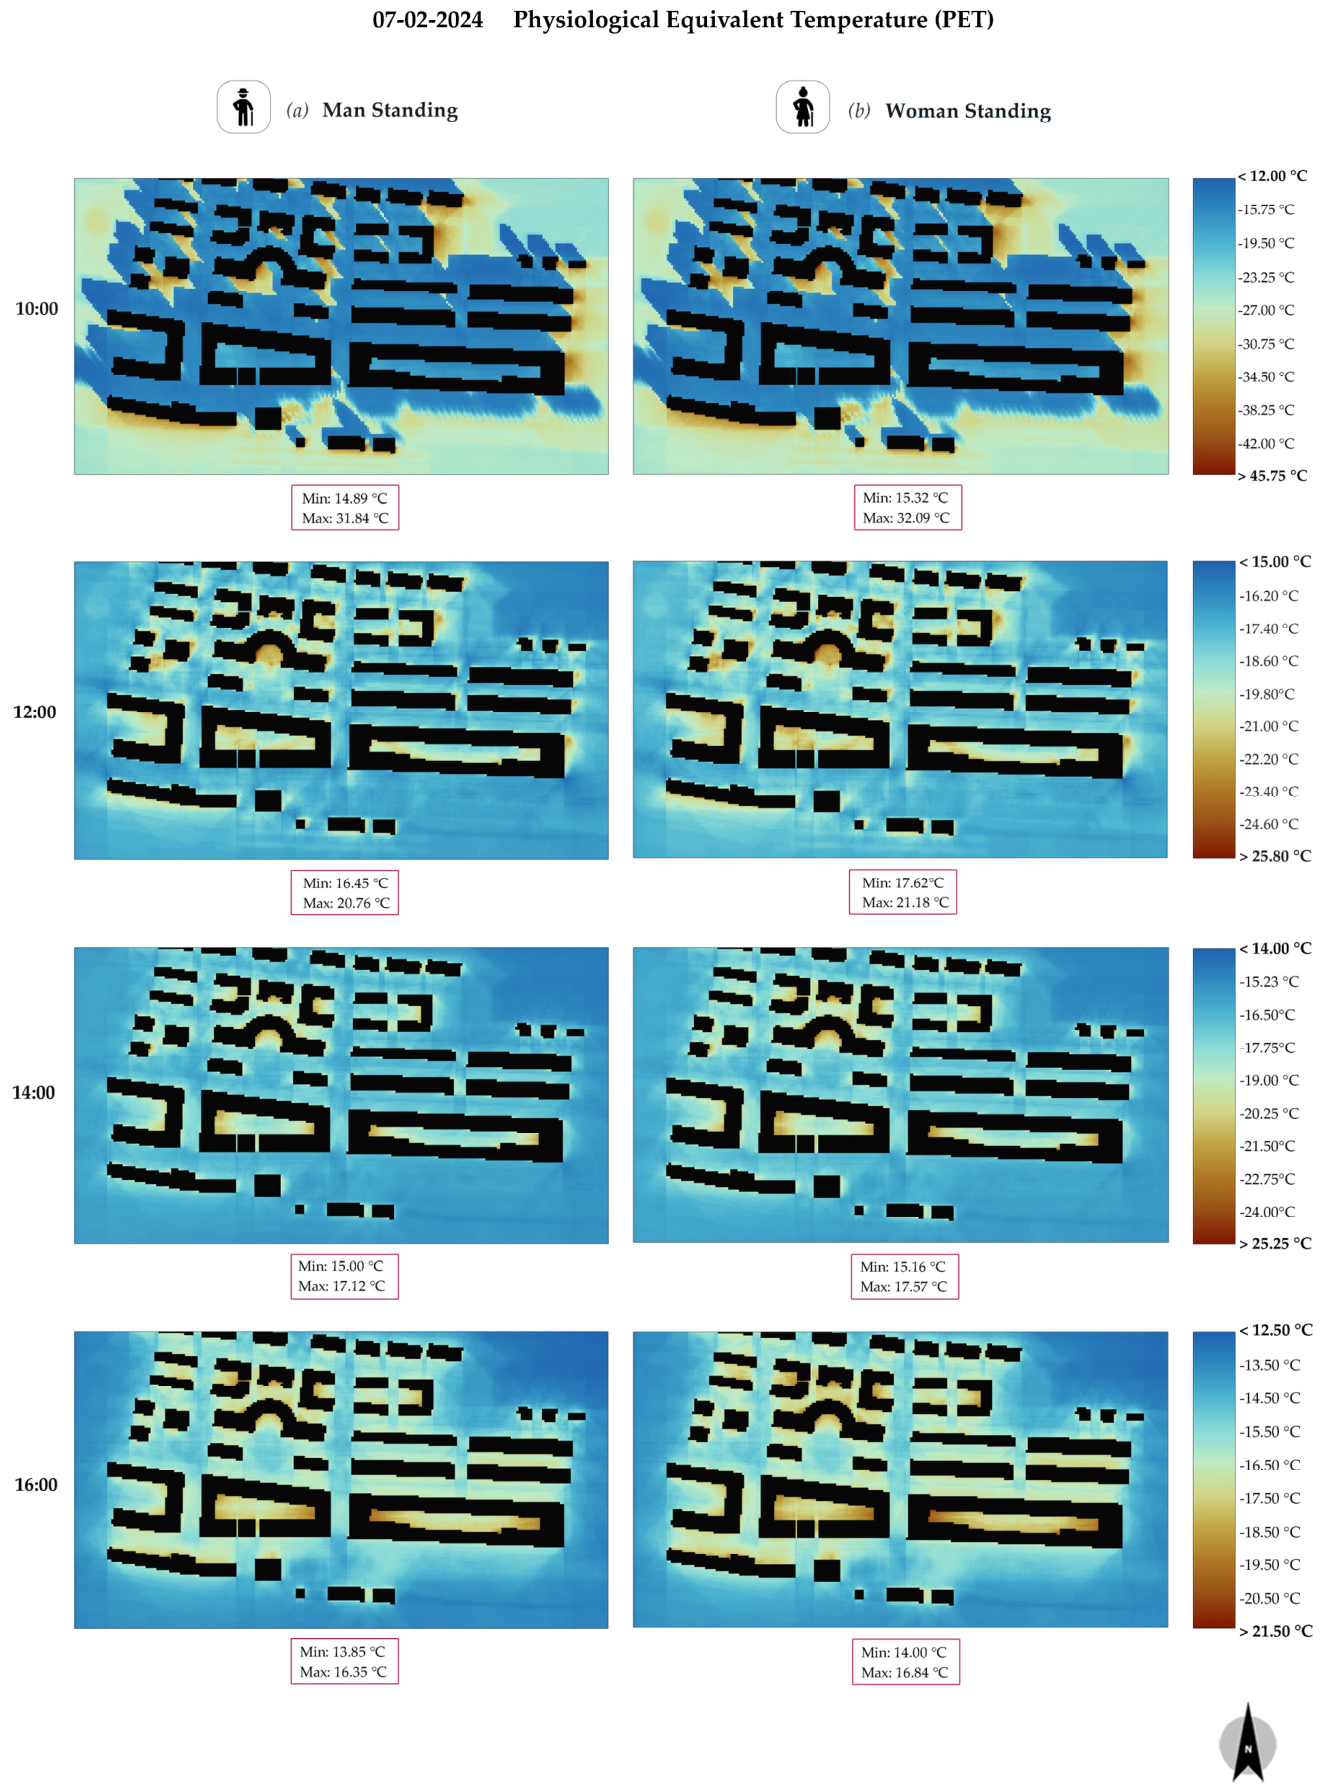
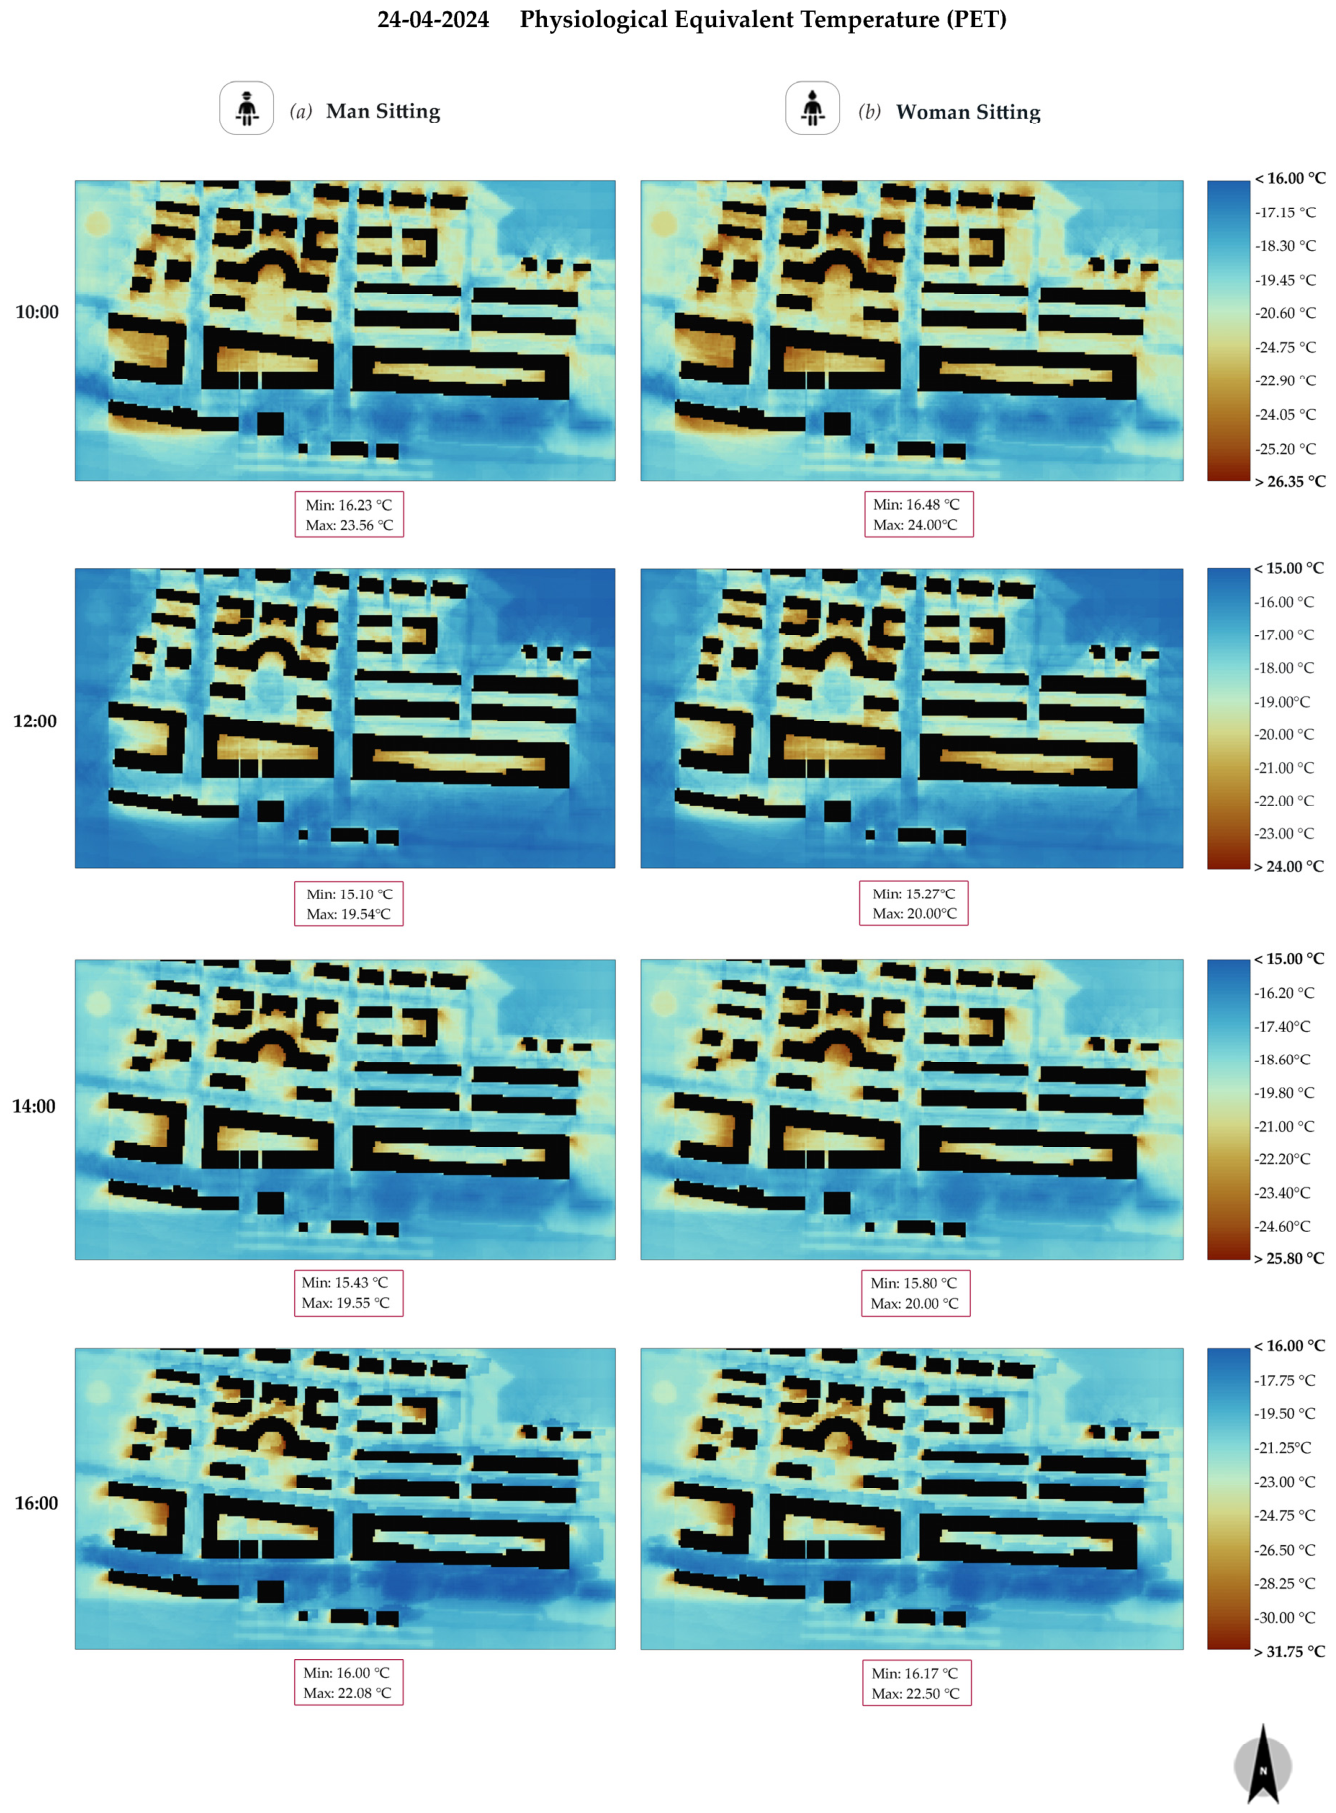
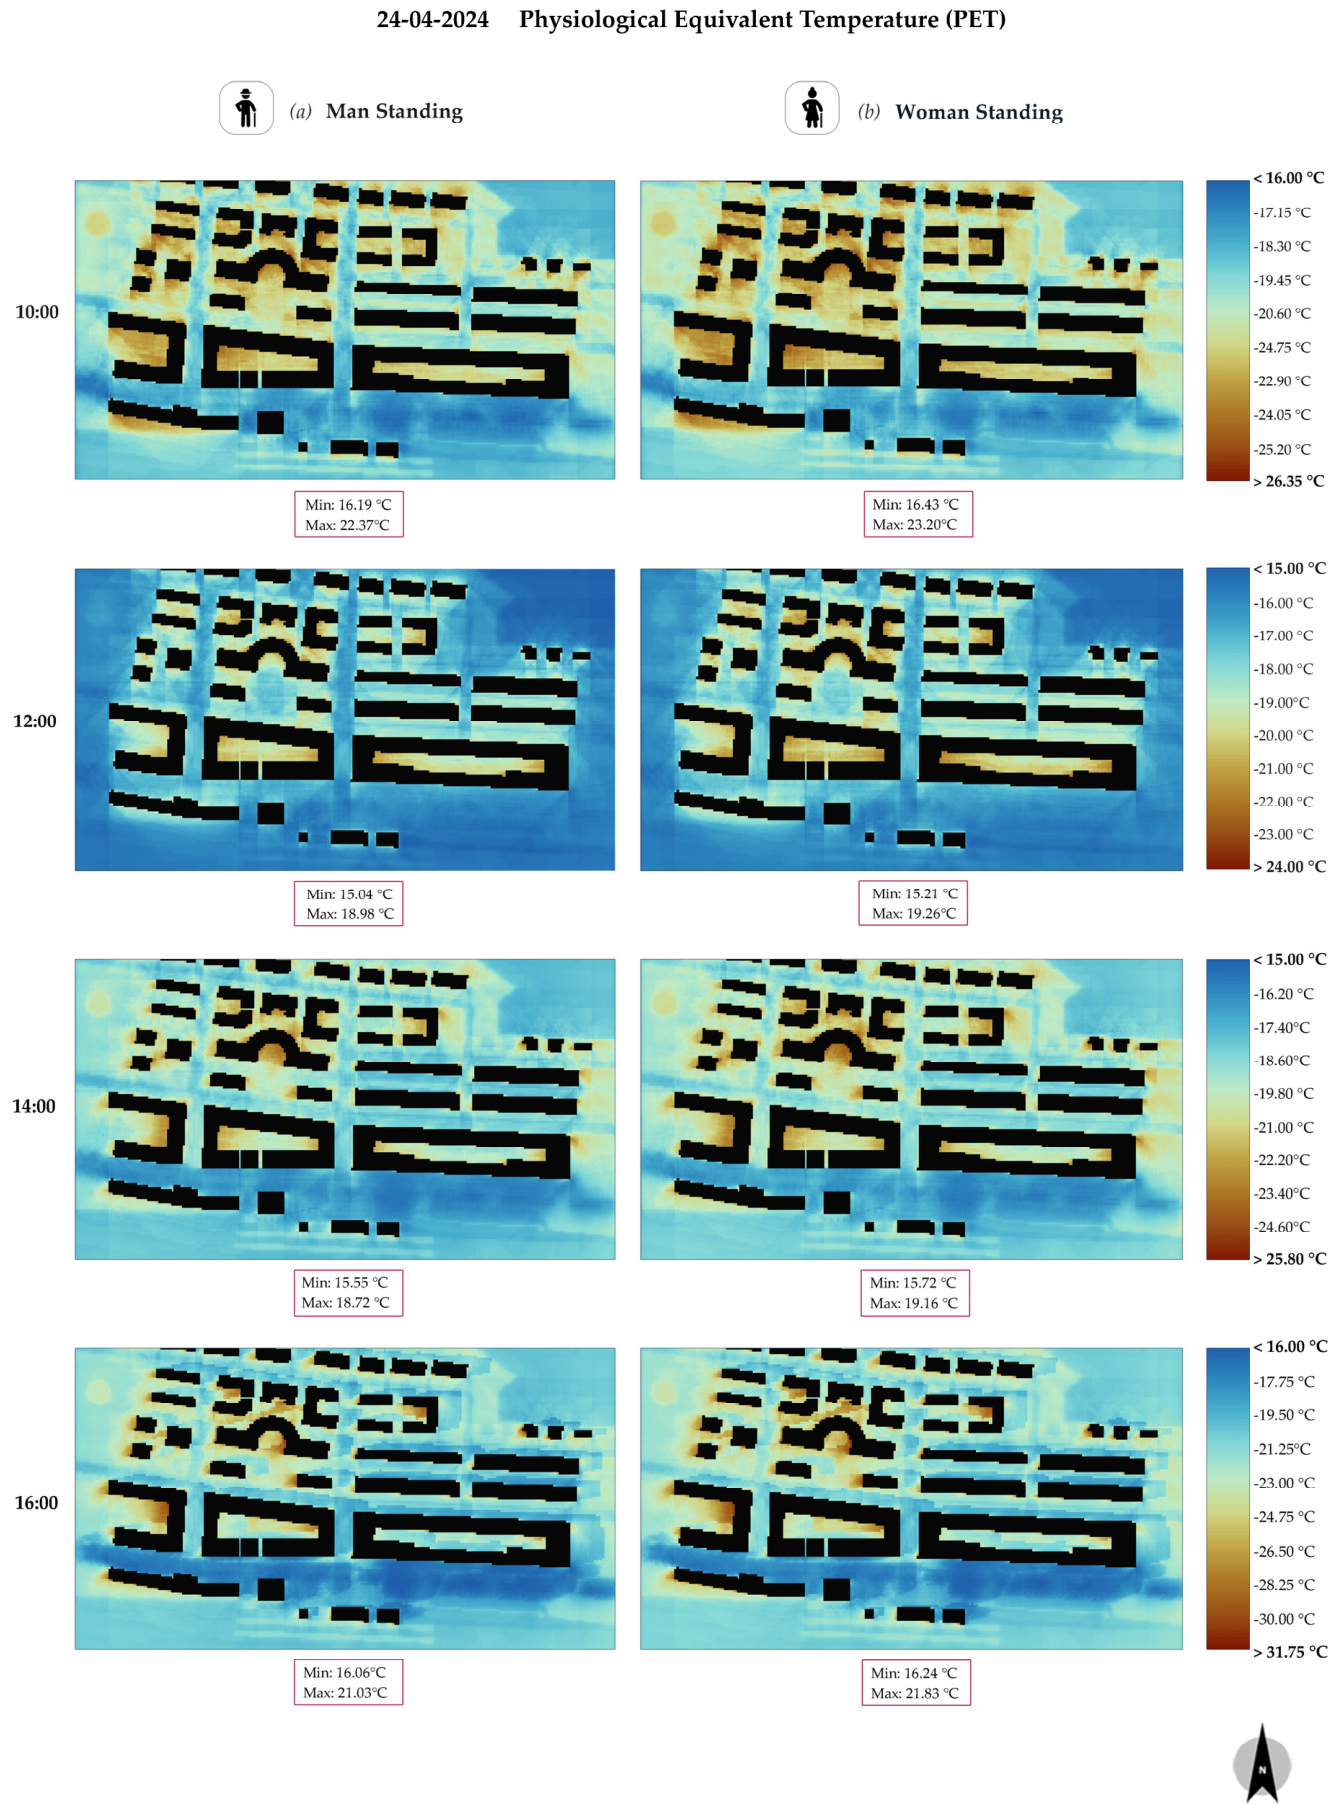
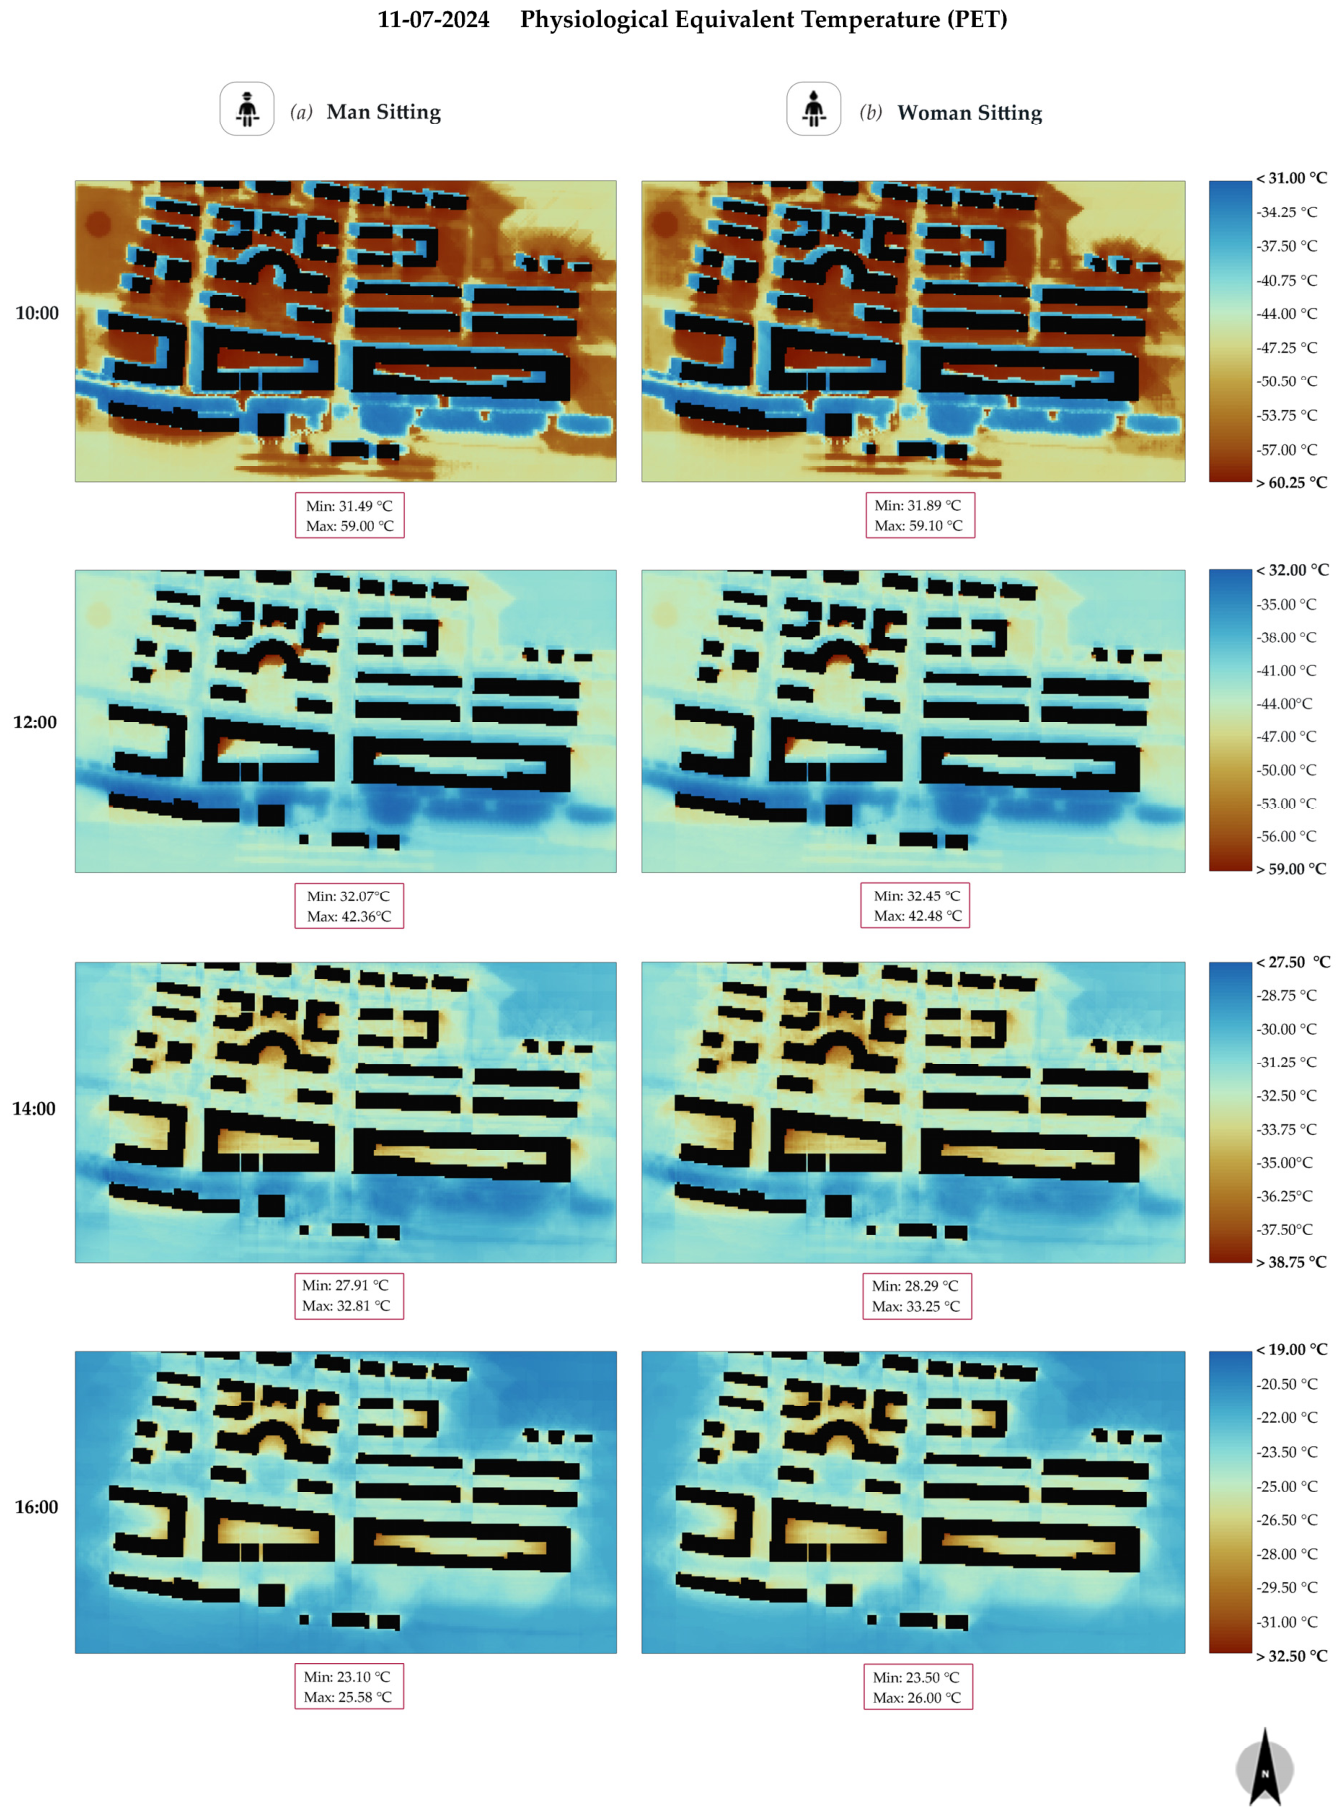
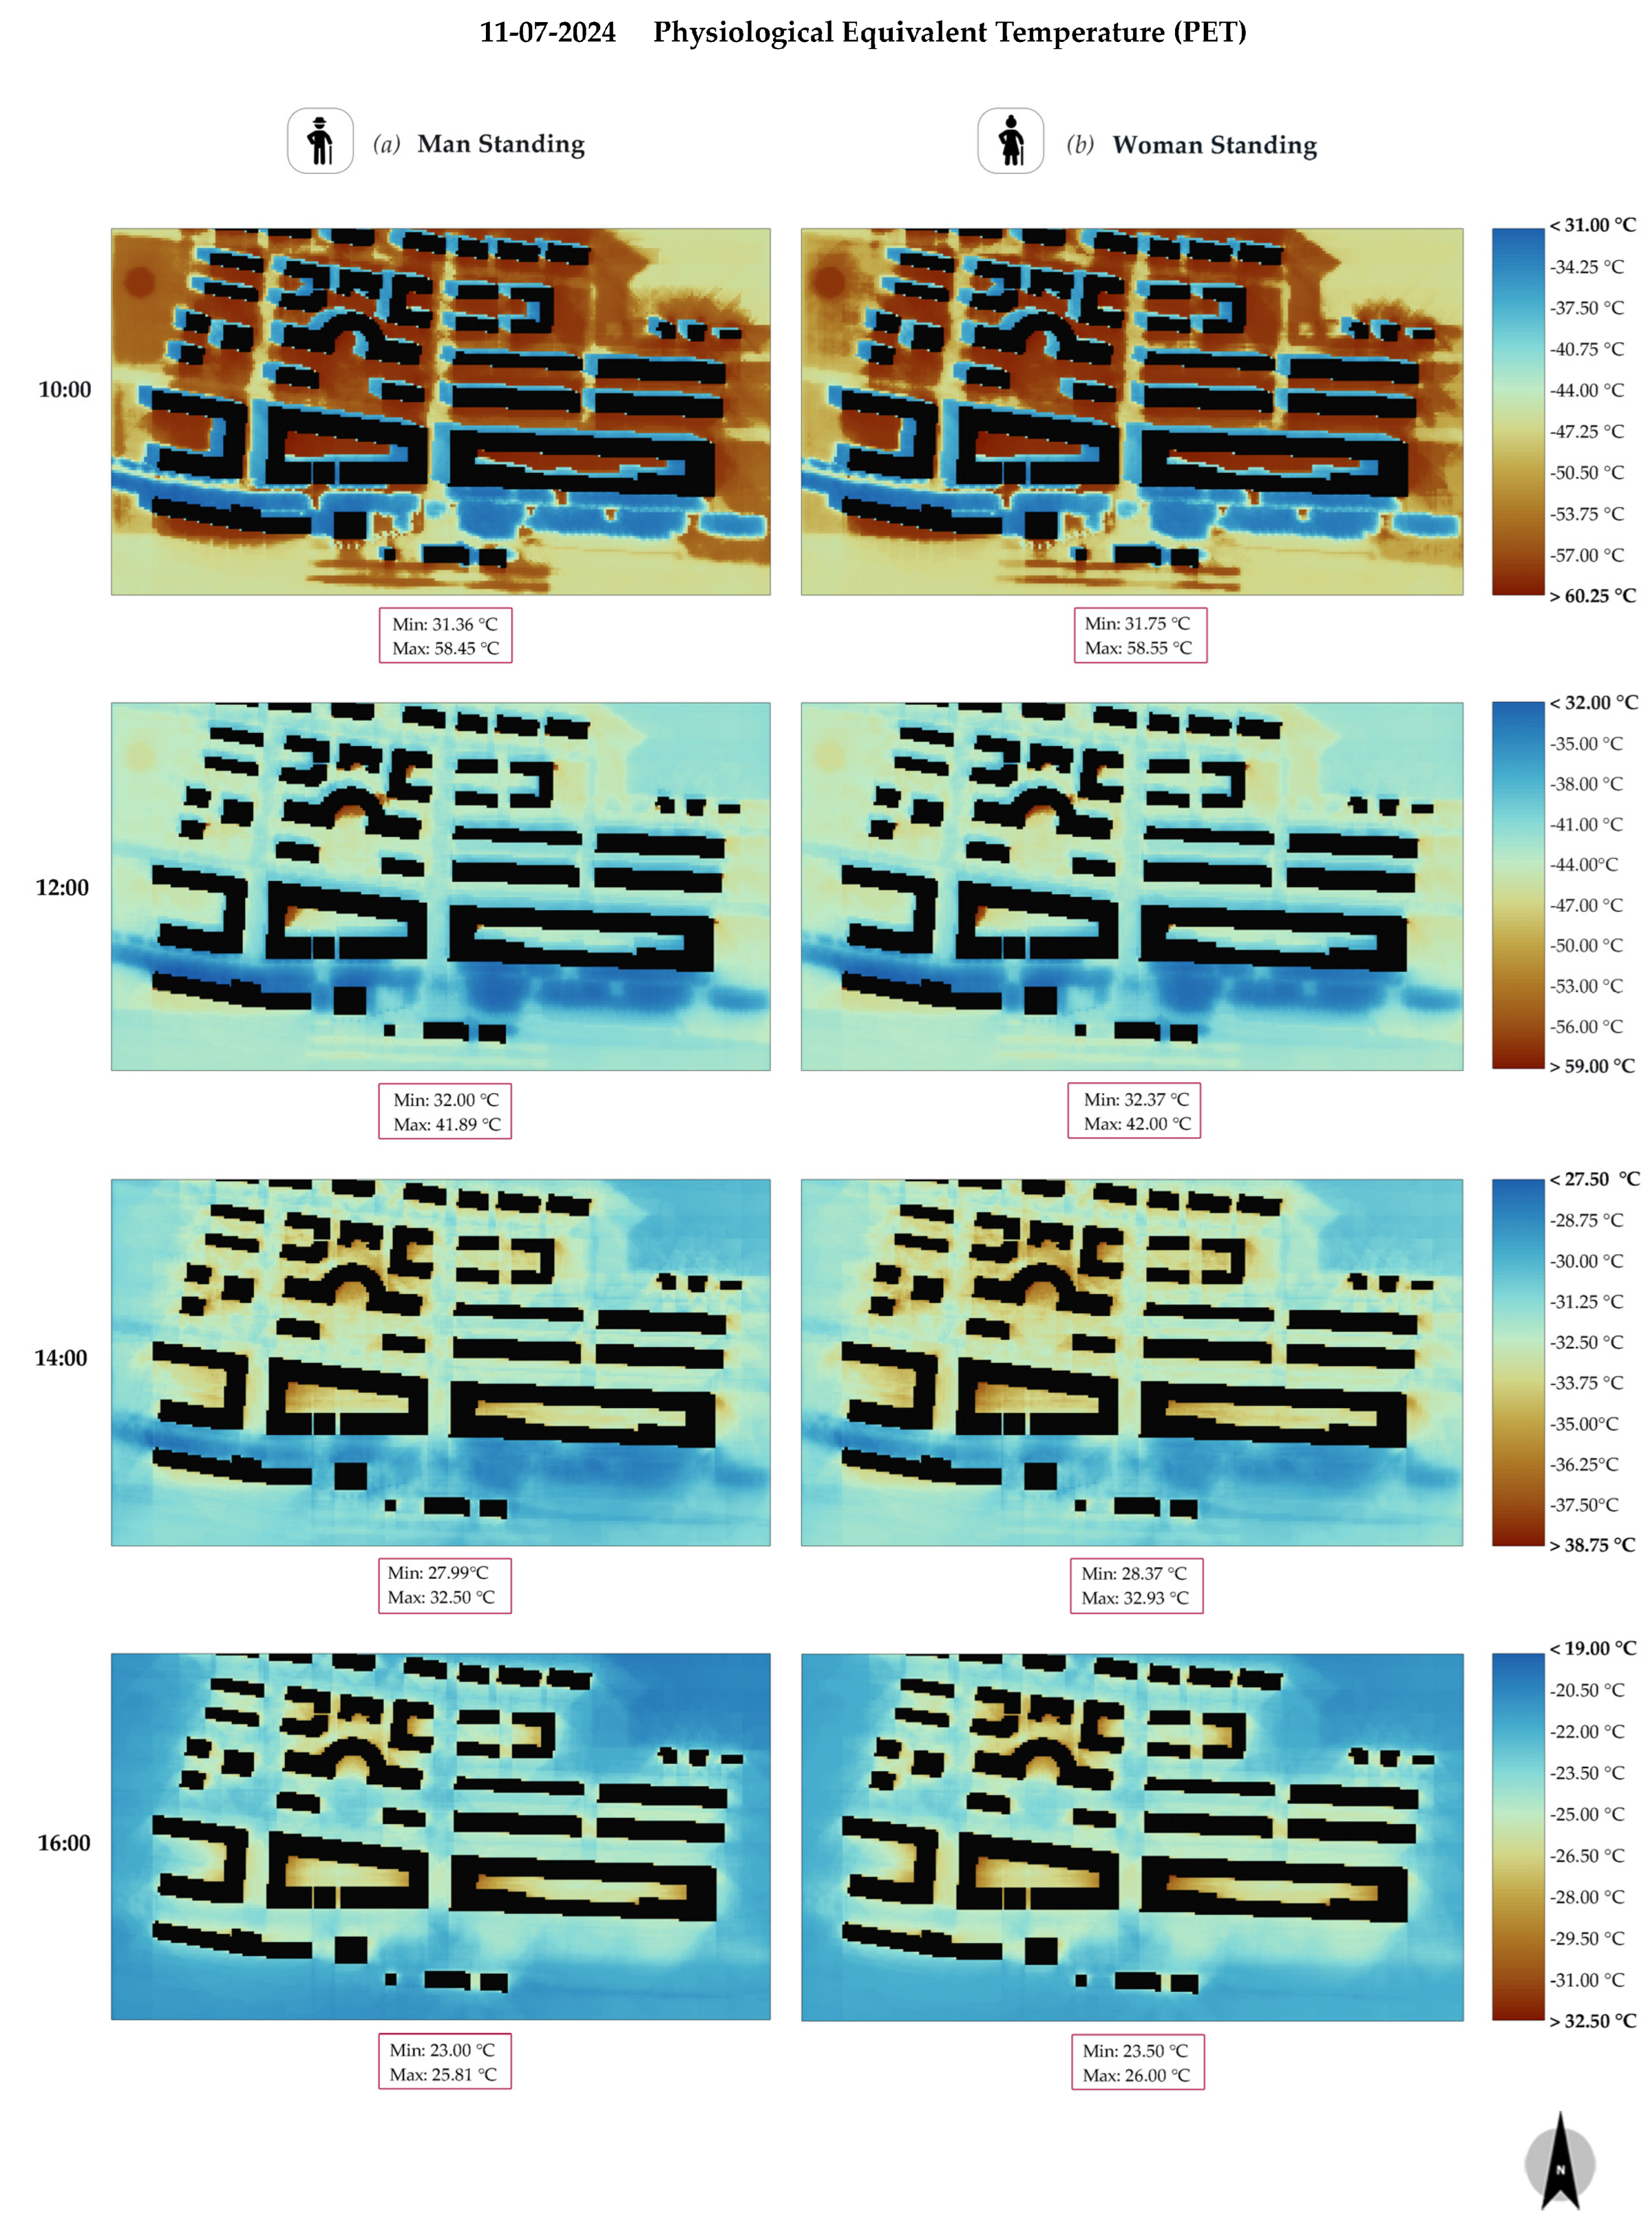
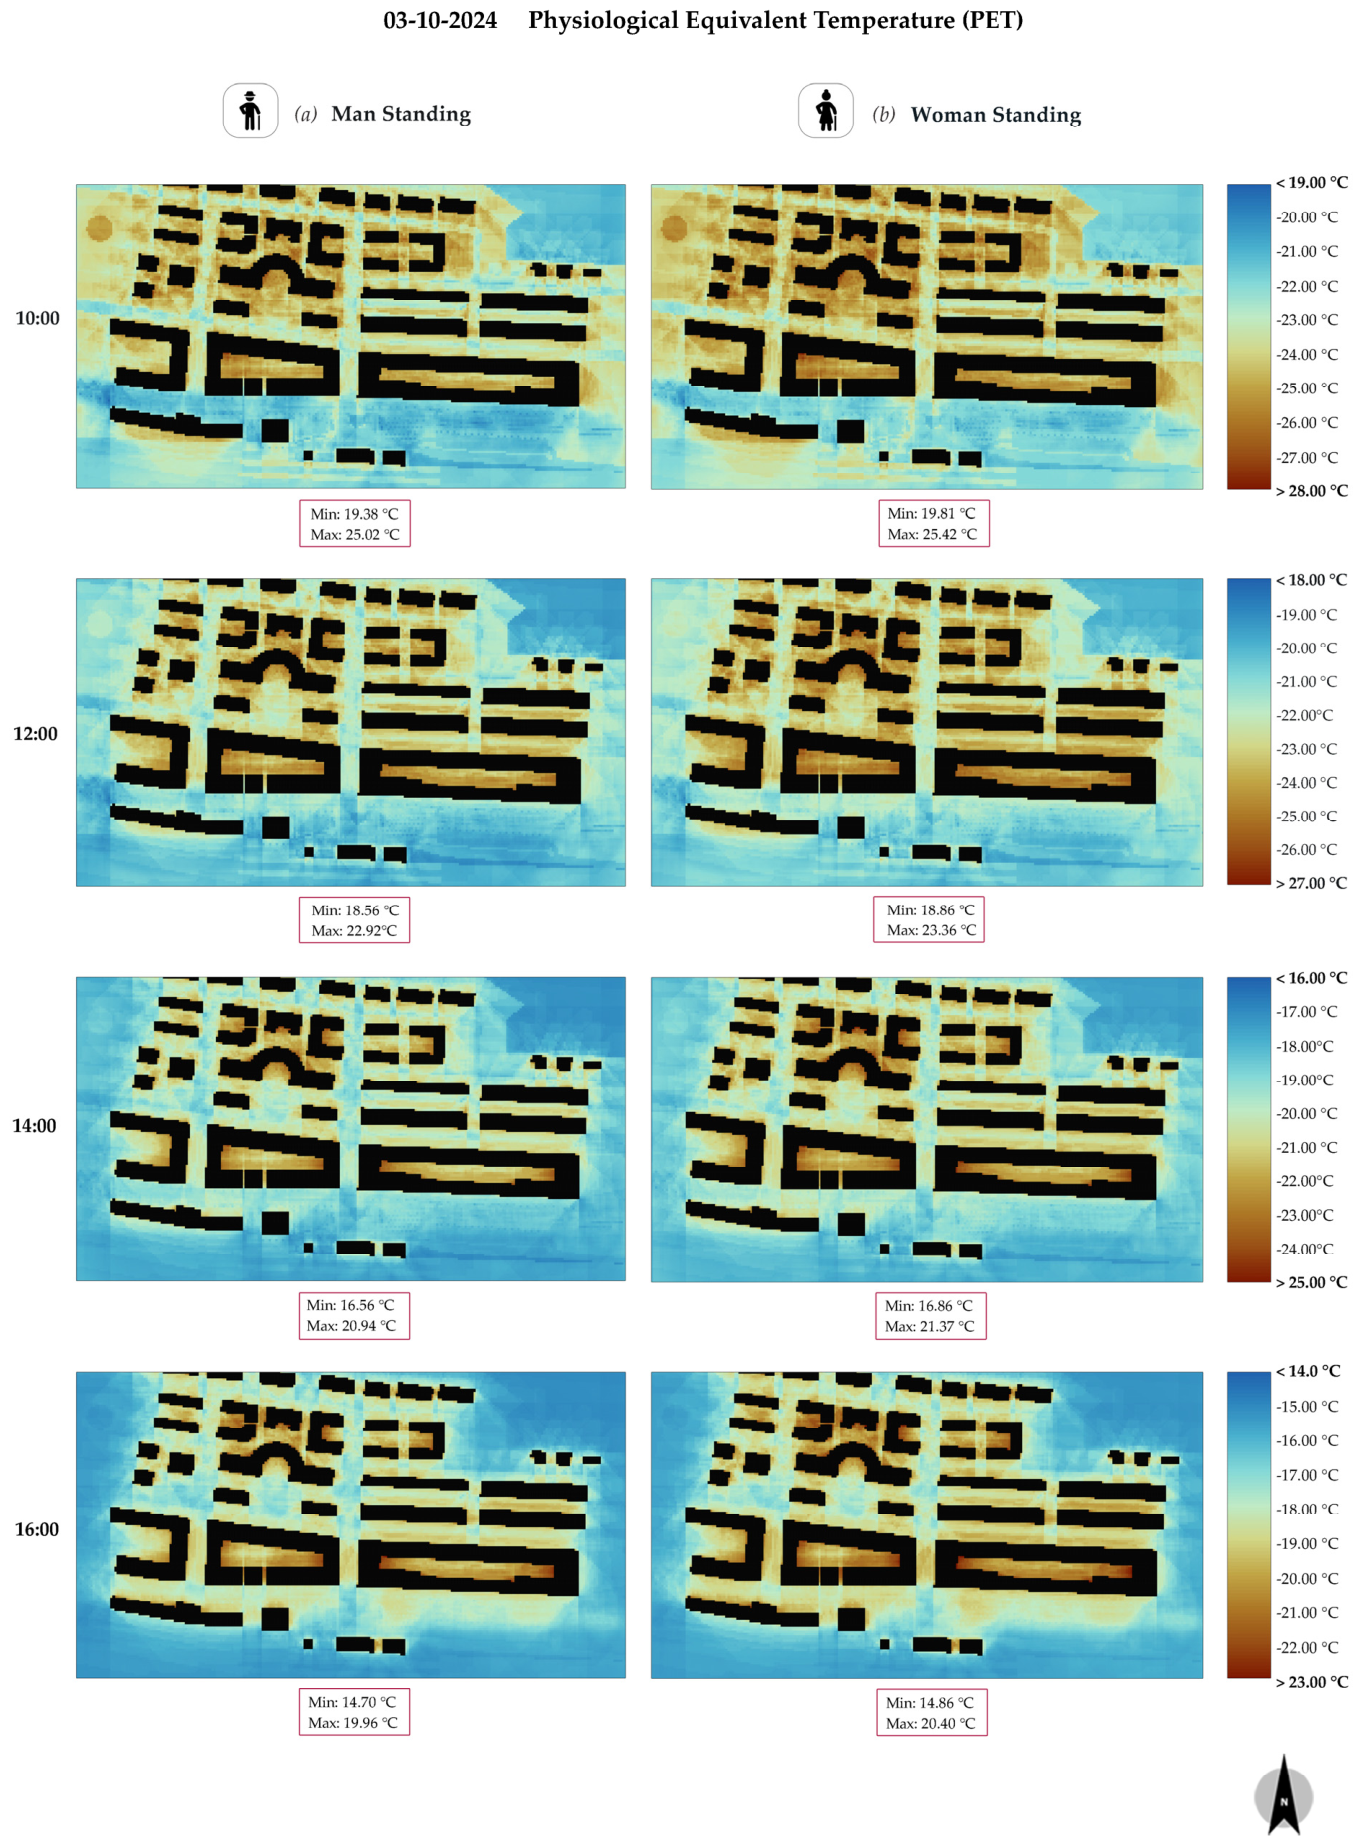
For each selected survey day, a separate SIMX file was generated. All simulations followed the same 10 h protocol, from 08:00 to 18:00. The first two hours, from 08:00 to 10:00, were treated as an initial model-adjustment period and were not used for the main comparison. Outputs were extracted at 10:00, 12:00, 14:00 and 16:00 to characterise the daytime evolution of the simulated conditions. The principal interpretation focused on the 12:00 output, which corresponded to the main midday survey slot.
2.6.5. Model Validation and Uncertainty
The ENVI-met simulations were developed to support a diagnostic interpretation of the existing microclimatic conditions of the study area, rather than to provide a stand-alone prediction of absolute pedestrian-level thermal values. Accordingly, the model outputs were interpreted as spatial indicators of relative microclimatic behaviour and were analysed together with the field-survey evidence on thermal perception, reported public-space use, and perceived sociability.
Measured meteorological data from the Beasain station were used to define the atmospheric forcing conditions of the simulations, including air temperature, relative humidity, wind conditions, and radiation/cloud conditions. These data ensured that the simulated scenarios were constrained by observed local meteorological conditions during the selected survey periods. In addition, the ENVI-met/INX inspection procedure was used to verify the technical consistency of the geometric model before the simulations were launched. However, station-based meteorological forcing and technical model inspection should be distinguished from full quantitative validation of pedestrian-level microclimatic fields within the study area. A full quantitative validation would require continuous on-site measurements collected within Barrendain intervention area at comparable spatial locations and time steps to the ENVI-met outputs.
This distinction between model setup verification and full quantitative validation is consistent with previous studies highlighting that urban microclimate simulations are highly sensitive to boundary conditions, material properties, vegetation parameterisation, and radiative exchanges, which can complicate their interpretation in complex urban environments [
57,
58,
59].
For this reason, PET maps and related microclimatic outputs are not interpreted as absolute validated measurements, but as comparative spatial estimates supporting the identification of exposed and protected areas, relative PET patterns, and microclimatic tendencies within the baseline condition of the Barrendain intervention area. The simulation outputs were therefore interpreted alongside the empirical survey data on user perception and behaviour, not as a validation procedure, but as part of an integrated framework for relating modelled thermal exposure to observed patterns of use and subjective thermal responses. In this sense, the simulations were primarily intended to identify relative spatial and seasonal differences in thermal exposure rather than to provide fully calibrated predictions of absolute pedestrian-level thermal conditions. This methodological scope was considered when interpreting the simulation results and is further addressed in the discussion and limitations sections.
2.6.6. Simulation Outputs and PET Assessment
Once the geometry had been completed, the model was exported in .INX format, which is the input file required for ENVI-met simulation.
Thermal comfort was assessed through the BIO-met module using the physiological equivalent temperature (PET) index. PET was selected because it allows for user-specific thermal comfort assessment through the explicit definition of personal parameters, while BIO-met enables the post-processing of ENVI-met outputs for biometeorological evaluation [
60].
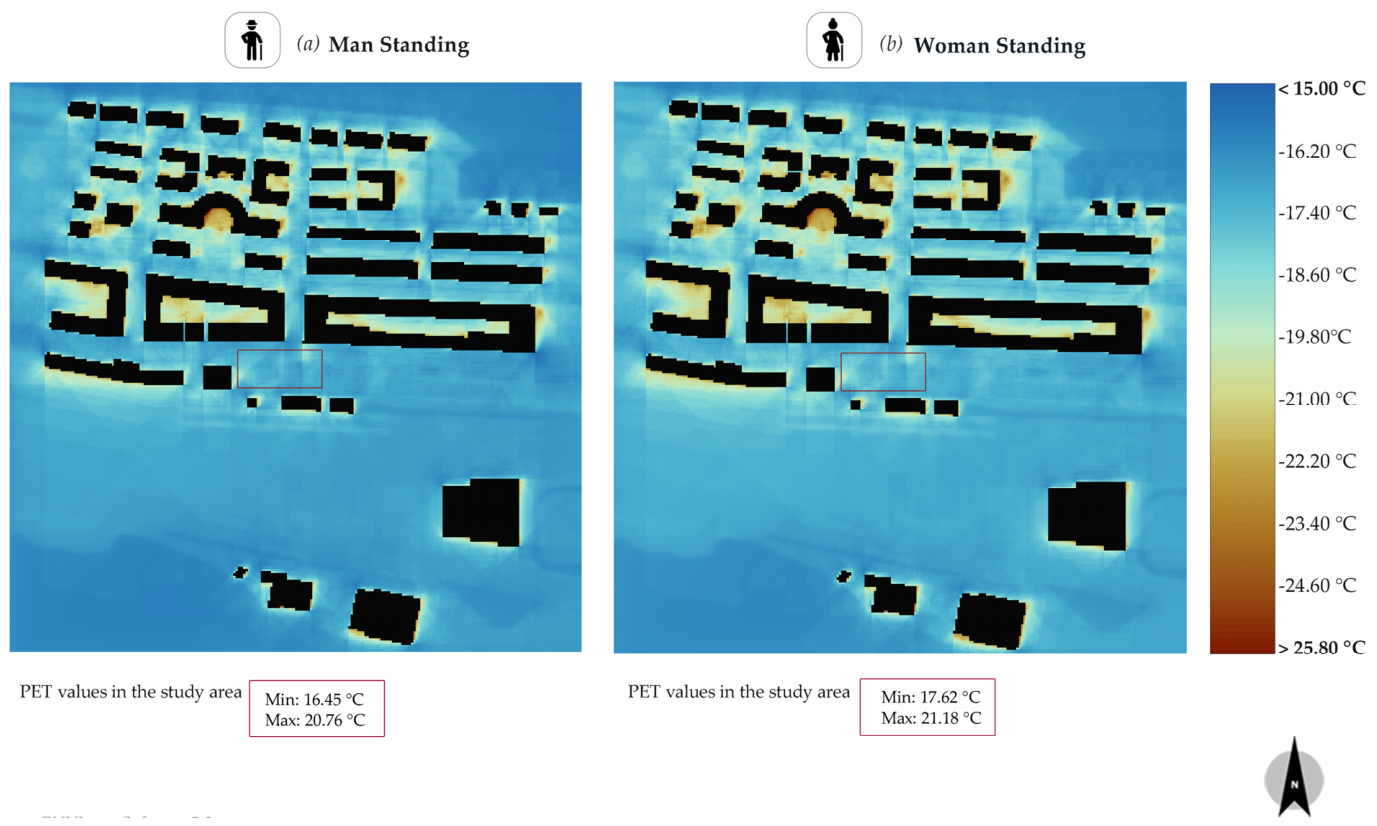
To account for possible differences in thermal perception according to sex and posture, four customised elderly user profiles were defined in BIO-met: elderly female standing, elderly female sitting, elderly male standing, and elderly male sitting. The female profile was set at 75 years of age, 1.63 m in height, and 66 kg in body weight, while the male profile was set at 75 years, 1.70 m in height, and 76 kg in body weight. These values were manually assigned as representative elderly user scenarios for the simulations and were not intended to reproduce the exact anthropometric distribution of the local population [
61,
62].
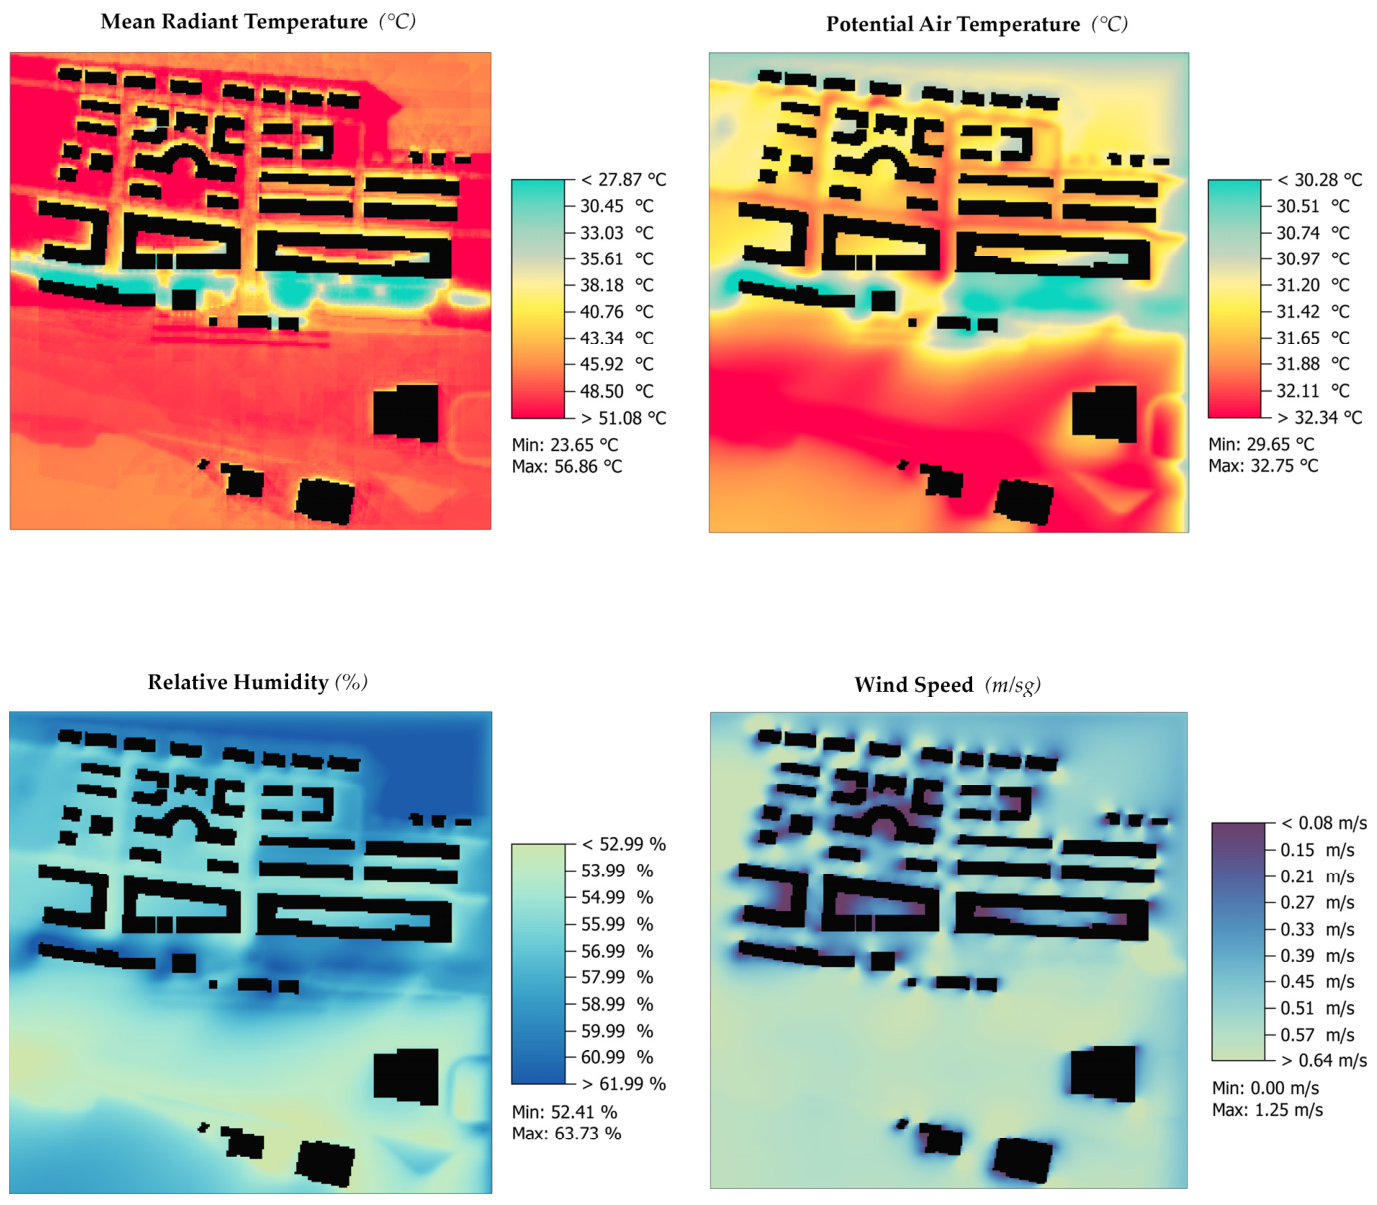
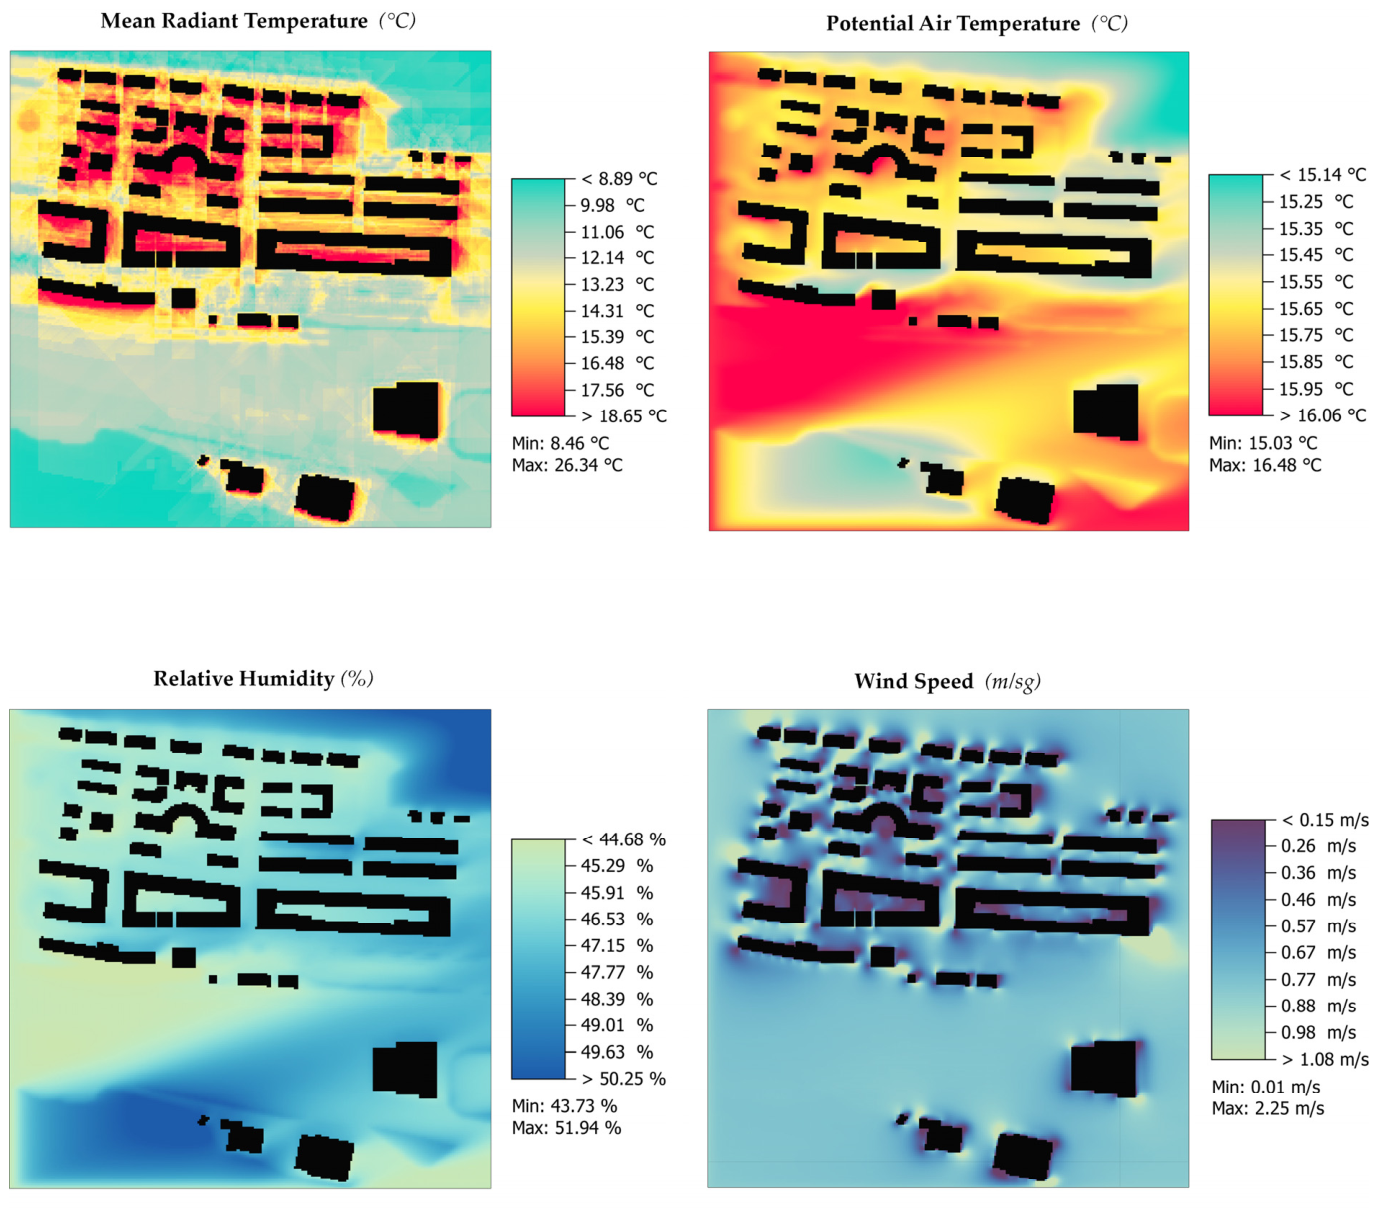
Model outputs included air temperature, mean radiant temperature (MRT), wind speed, relative humidity, and PET distributions at pedestrian level. These variables were subsequently analysed in relation to field observations and users’ subjective thermal responses.
For the comparison between simulation-derived PET and participants’ reported thermal sensation (TSVs), four field-survey days were selected for simulation: 7 February, 24 April, 11 July, and 3 October 2024. For each of these days, PET derived from the corresponding ENVI-met/BIO-met simulation was compared exclusively with TSV responses collected on that same field-survey day. This day-matched comparison should be distinguished from the overall TSV analysis and neutral-temperature calculations, which included responses collected across the complete seasonal campaigns. Representative mean PET values were calculated using all simulated PET values within the intervention area at 12:00 and 14:00, corresponding to the main period of questionnaire administration. The resulting mean PET values and the corresponding same-day TSV responses were used for the comparison presented in
Section 3.5.4.
Overall, the adopted modelling and post-processing workflow enabled the analysis of the spatial and seasonal distribution of PET within the study area, the comparison of modelled thermal conditions with users’ subjective thermal responses collected during the field surveys, and the identification of relatively exposed and thermally moderated areas within the study area to support the ongoing redesign process of Barrendain Square.
2.7. Thermal Comfort Assessment
Outdoor thermal comfort is commonly assessed through composite indices that integrate the effects of meteorological variables on the human heat balance. In the present study, thermal conditions were evaluated using the physiological equivalent temperature (PET), a widely used biometeorological index that expresses thermal conditions as an equivalent air temperature in degrees Celsius. This facilitates the interpretation and comparison in urban-climate and design-related studies [
35].
PET combines the effects of air temperature, relative humidity, wind speed, and mean radiant temperature, together with personal parameters such as clothing insulation and metabolic activity. Because radiant exchange plays a major role in outdoor thermal perception, PET is particularly suitable for analysing the effects of urban morphology, shading, vegetation, and surface materials in open spaces [
35,
63].
PET values were interpreted according to the thermal stress classification proposed in [
35]. According to this classification, PET values between 18 and 23 °C correspond to
no thermal stress, values between 4–8 °C indicate extreme cold stress, 8–13 °C
moderate cold stress, 13–18 °C
slight cold stress, 23–29 °C indicate
slight heat stress, 29–35 °C
moderate heat stress, 35–41 °C
strong heat stress whereas values from above 41 °C represent
extreme heat stress. Conversely, PET values below 18 °C indicate different levels of cold stress, ranging from
slight cold stress (13–18 °C) to
extreme cold stress (<4 °C). This classification was subsequently used to compare simulated thermal conditions with participants’ reported thermal sensation (TSVs). Within the range of environmental conditions observed in this study, PET values ranged from
slight cold stress during the winter and spring campaigns to
no thermal stress in autumn and
moderate heat stress during summer. These categories formed the basis for the comparison between simulated thermal conditions and subjective thermal sensation presented in the results section.
The use of PET in ageing populations requires careful interpretation, since thermal sensitivity and thermoregulatory responses may differ from those of younger groups [
64]. Recent studies suggest that PET can be successfully applied to ageing populations, although its interpretation should account for season, local climate, and microclimatic variability [
29,
65].
2.8. AI Use Statement
During the preparation of this manuscript, the authors used an artificial intelligence language model (ChatGPT, version GPT-5.5, OpenAI) to assist with English language editing, text clarification, and improvement of the manuscript structure. The tool was also used to support the categorisation and description of qualitative survey responses, as well as minor enhancements to the visual clarity of some figures. No images, figures, or graphical materials were generated using artificial intelligence. All scientific content, data analysis, interpretations, and conclusions were developed and verified by the authors.
4. Discussion
4.1. Outdoor Thermal Comfort and Ageing
The findings indicate context-dependent relationships between microclimatic conditions, thermal perception, and reported public-space use among older adults. In the case of the Barrendain intervention area, these findings informed the ongoing redesign process aimed at improving environmental comfort and opportunities for everyday encounters.
The survey results provide insight into how older adults perceive and use the space, revealing key patterns of social interaction, seasonal attendance, and user preferences. This study supports previous evidence suggesting that older adults, similarly to the general population, tend to tolerate outdoor thermal conditions relatively well compared with indoor environments [
22,
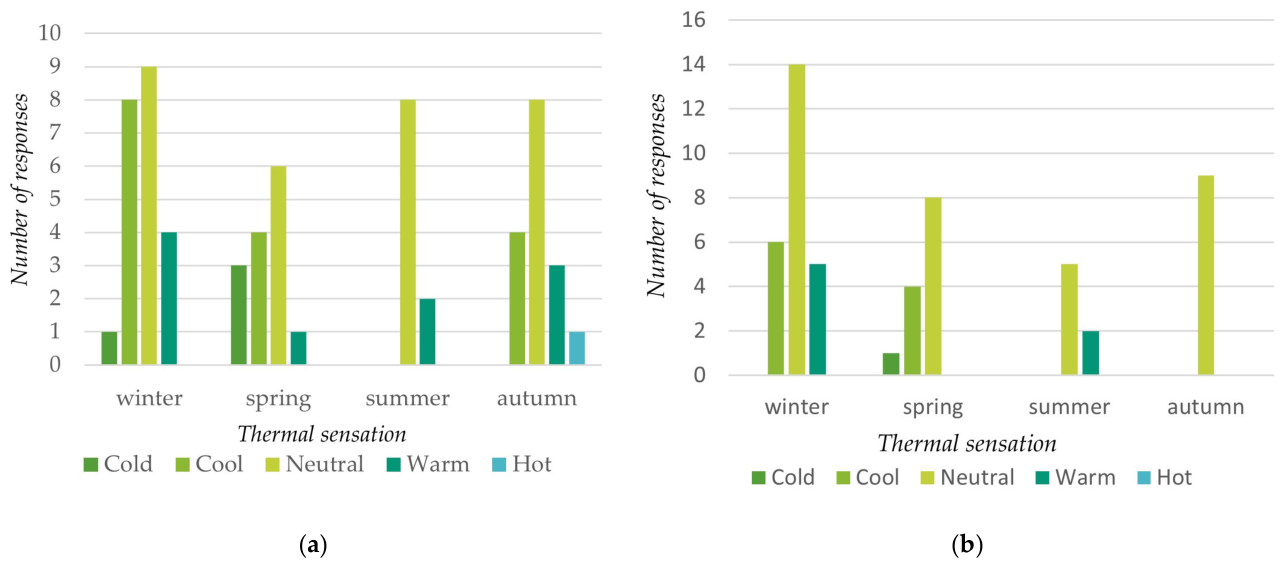
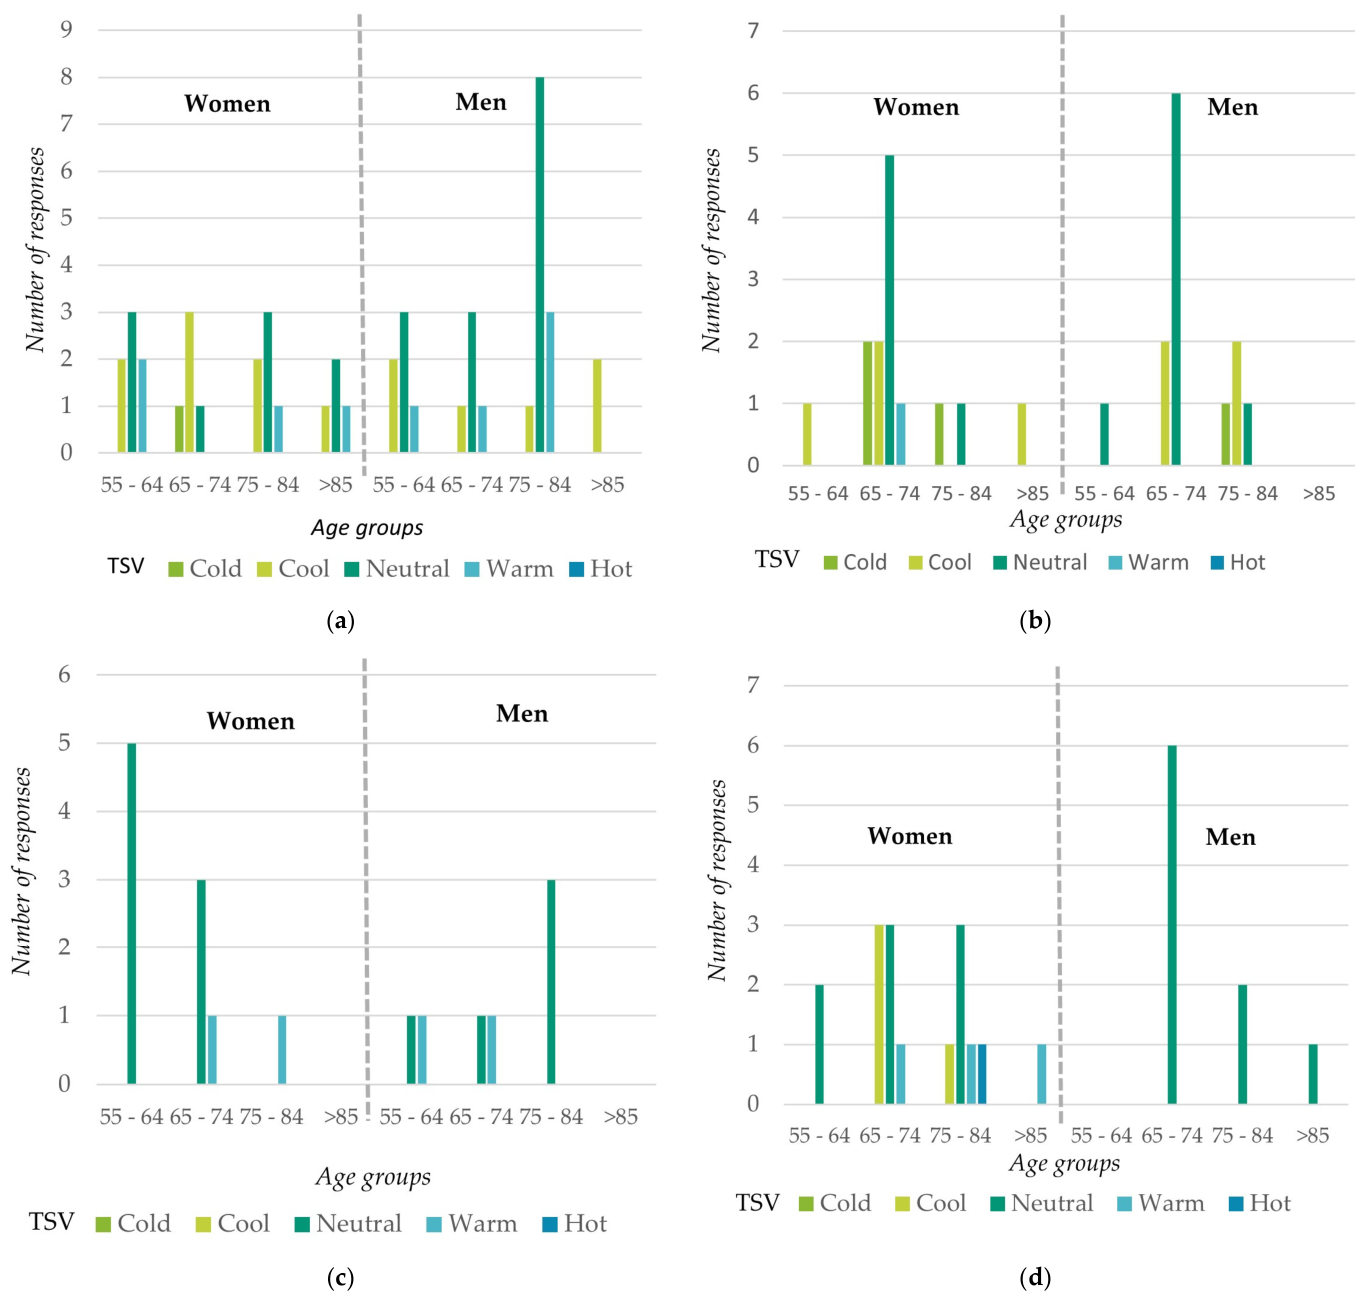
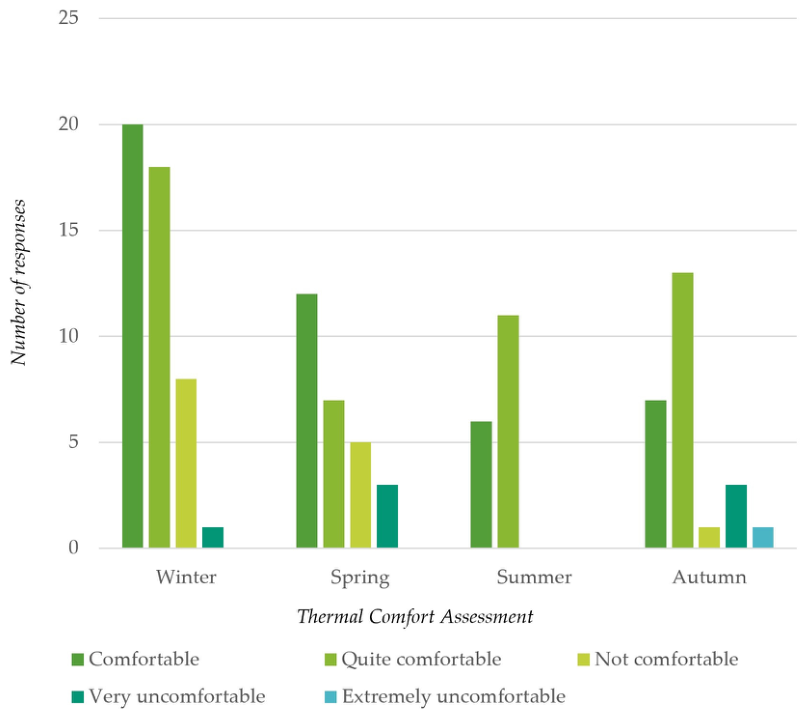
24]. Despite relatively low winter temperatures, 81% of respondents classified thermal conditions as comfortable or quite comfortable, suggesting a significant degree of seasonal adaptation to outdoor environments among older adults. This finding suggests that thermal preference was not determined solely by the measured environmental conditions but was also influenced by seasonal expectations and behavioural adaptation, consistent with adaptive thermal comfort theory [
47].
The results also support previous findings indicating that thermal sensitivity decreases with age [
22,
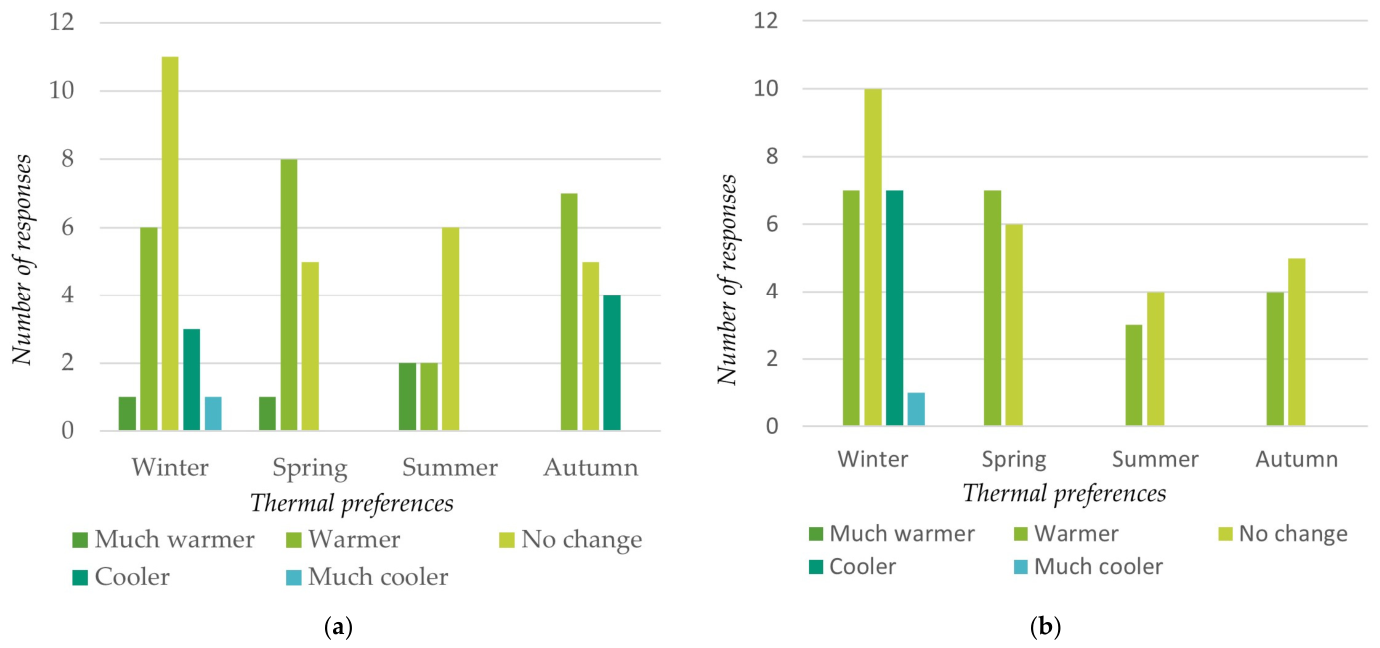
25]. In winter, the coexistence of preferences for both warmer and cooler conditions suggests that responses may be influenced not only by actual thermal conditions but also by seasonal expectations.
Overall, the findings are consistent with previous studies conducted in Mediterranean, continental and East Asian climates, which report that older adults generally exhibit greater behavioural adaptation and a preference for warmer outdoor conditions than younger populations [
23,
25,
26]. However, the temperate Atlantic climate of the present study resulted in comparatively limited cold stress during winter and moderate heat stress during summer, contrasting with the more extreme seasonal conditions reported in continental and subtropical climates. These differences highlight the importance of considering local climatic context when interpreting outdoor thermal comfort and translating findings into urban design strategies.
These behavioural responses may also reflect physiological changes associated with ageing. Reduced thermoregulatory efficiency, lower metabolic activity and altered thermal sensitivity have been widely reported among older adults and may contribute to the greater variability observed in thermal preferences and adaptive strategies, particularly among women and during transitional seasons. These findings are consistent with previous studies reporting a preference for warmer outdoor environments and greater reliance on behavioural adaptation in older populations [
23,
66].
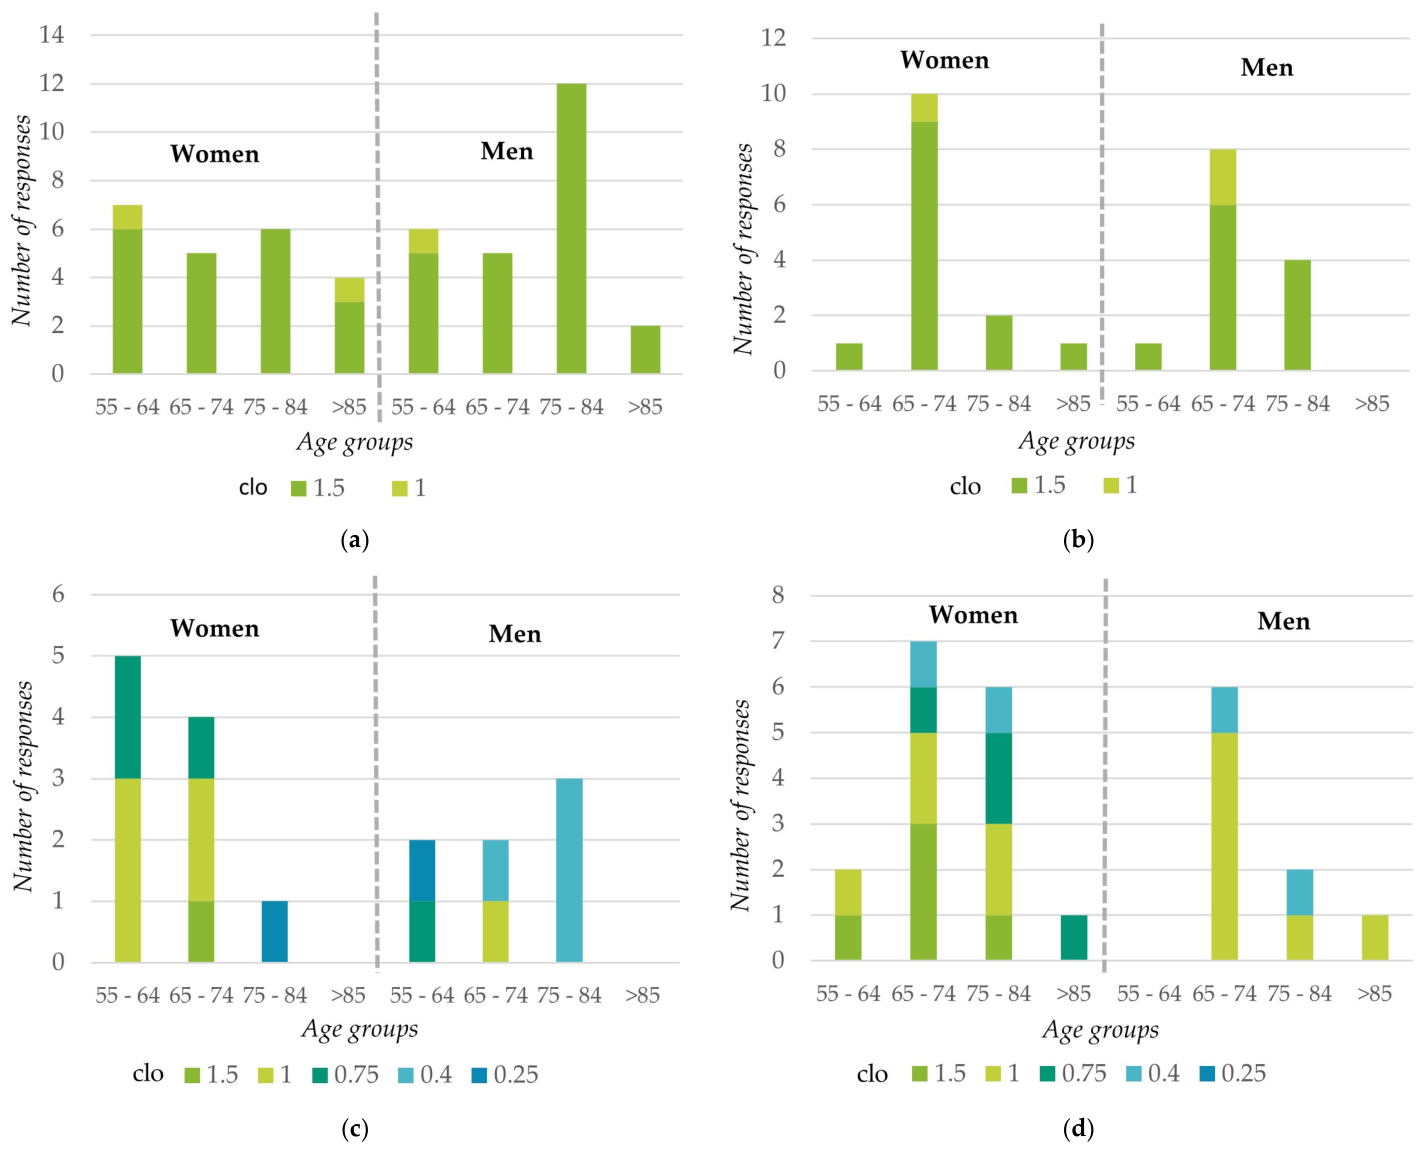
This is also reflected in adaptive behaviour, as reduced thermal sensitivity may be associated with higher levels of clothing insulation, particularly in winter and spring. At the same time, women appear to adopt more diverse adaptive strategies, especially in summer and autumn, adjusting clothing more flexibly to achieve thermal comfort [
27].
Beyond these perceptual aspects, the analysis of thermal conditions provides further insight into how environmental factors are associated with user experience. The integrated analysis of air temperature, thermal sensation (TSVs), and adaptive responses further supports an adaptive interpretation of outdoor comfort, showing that subjective responses are shaped by both environmental conditions and behavioural factors. Air temperature was clearly relevant, but it was not sufficient on its own to account for the observed spread in subjective responses.
The difference between the cold-period and warm-period neutral temperatures (12.35 °C and 19.87 °C, respectively) is consistent with adaptive thermal comfort theory. The findings suggest that the same air temperature may be perceived differently depending on seasonal expectations, behavioural adaptation, and environmental context [
32,
33,
47,
48,
49,
56]. In older adults, this adaptive process may also be influenced by habits, route choice, rest patterns, and the timing of outdoor activities [
18,
22,
65,
67].
Clothing functioned as a behavioural adjustment through which participants adapted to outdoor conditions [
33]. The repeated association between sun exposure and higher TSVs also reinforces the importance of radiative context in open urban spaces [
15,
36,
37]. No statistically detectable effects of sex or age were found within the available sample.
The comparison between PET simulations and TSV responses revealed varying levels of correspondence across the different survey campaigns. The strongest agreement was observed during autumn (3 October), when PET values fell within the no-thermal-stress category and neutral thermal sensations predominated among respondents. In contrast, the weakest correspondence occurred during summer (11 July), when PET values indicated moderate heat stress while neutral thermal sensations remained the most frequently reported response. Winter and spring showed intermediate situations, with subjective responses displaying greater variability than would be expected from PET classifications alone.
These findings reinforce the adaptive interpretation of outdoor thermal comfort and suggest that thermal perception among older adults is influenced not only by the physical environment but also by behavioural adaptation, expectations, previous thermal exposure, and contextual factors. Consequently, PET appears to be particularly useful for identifying relative differences in thermal exposure and seasonal contrasts, rather than predicting subjective comfort responses directly.
The partial correspondence observed between PET and TSVs may reflect both psychological and physiological adaptation processes. Previous research has shown that thermal perception in outdoor environments is shaped not only by environmental conditions but also by expectations, previous experiences, place-related factors, and contextual appraisal [
28,
49]. Among older adults, age-related changes in thermoregulation and thermal sensitivity may further influence the relationship between objective thermal exposure and perceived comfort [
23].
4.2. Microclimatic Performance of the Pre-Intervention Area
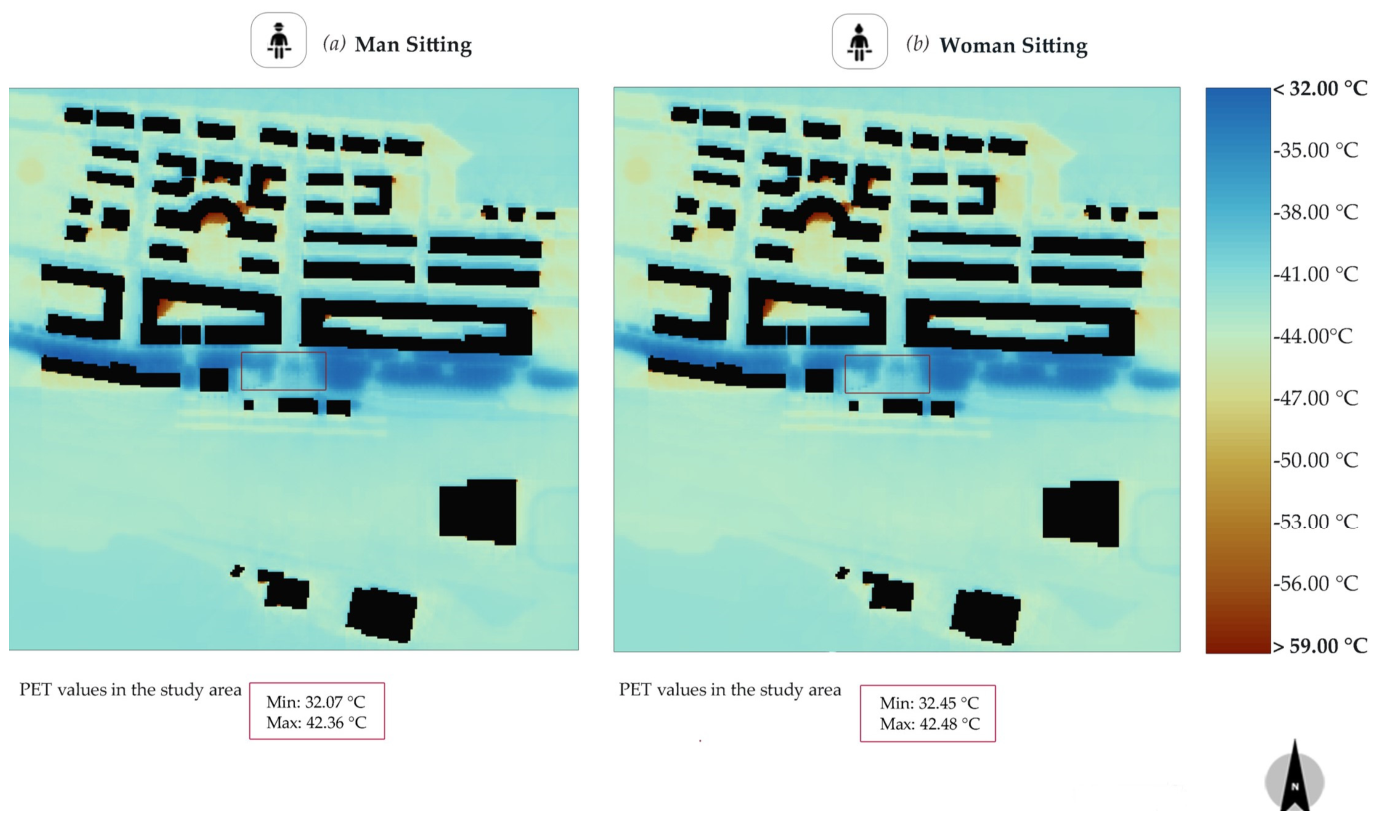
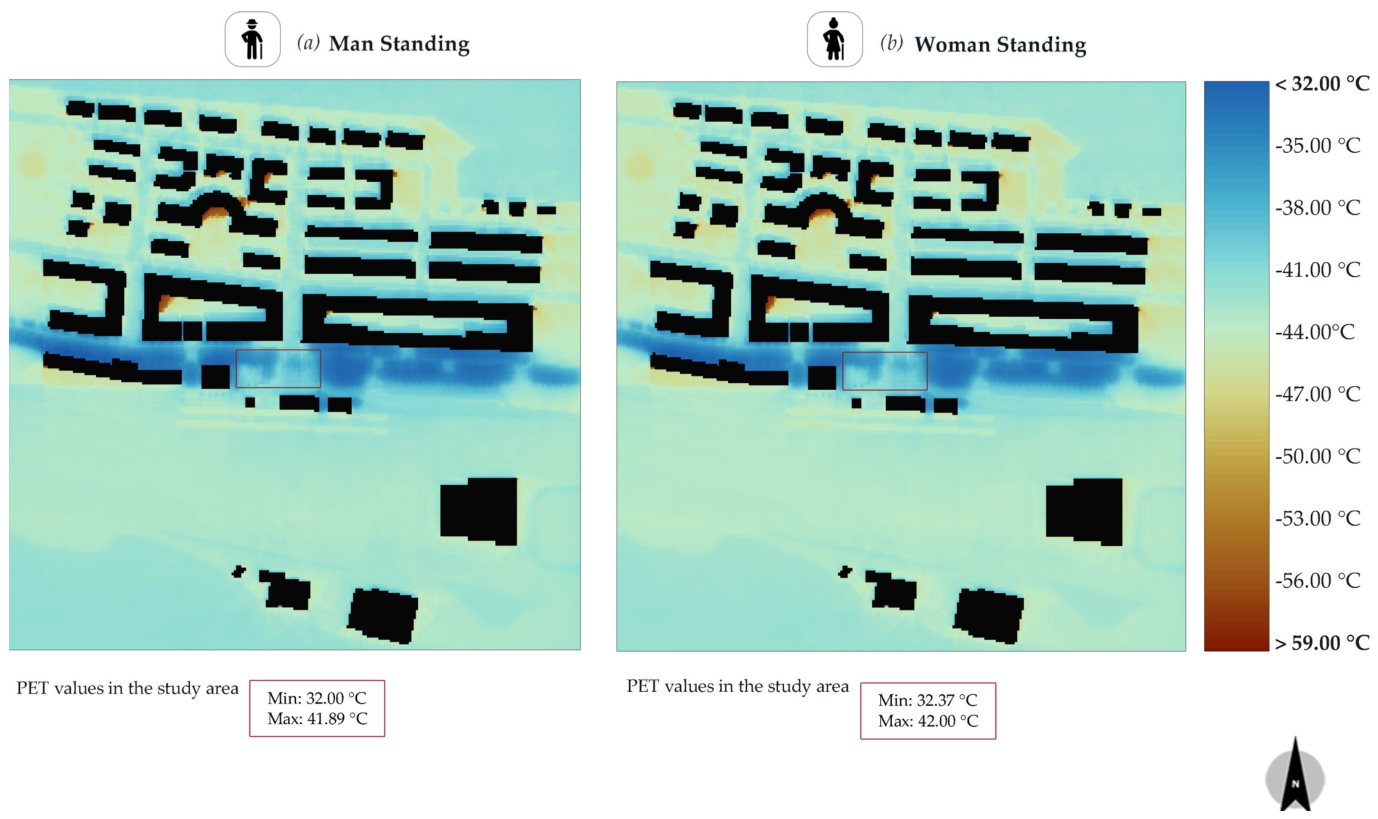
While a quantitative validation of the ENVI-met model was outside the scope of this study, its outputs provide useful comparative evidence for interpreting the spatial distribution of thermal exposure within the square. The PET simulations for the summer scenario identify high levels of thermal stress in the sun-exposed paved areas of the study area. This pattern is consistent with the lower survey participation recorded during the summer campaign.
Furthermore, the model’s identification of these thermally critical zones is coherent with users’ subjective feedback, where the most frequent suggestions for improvement included the addition of more seating. Therefore, the simulation should be understood as a complementary analytical tool that helps relate spatial thermal exposure to observed use patterns and perceived environmental needs.
Although these results highlight how individuals adapt to environmental conditions, it is also necessary to understand how such conditions are spatially distributed within the site. The PET simulations complement these findings by identifying spatial and temporal variations in thermal conditions, offering a more detailed understanding of microclimatic performance across the site. The simulations indicate clear spatial differences in PET distribution, with the central tree-covered areas consistently showing lower PET values than adjacent exposed surfaces, particularly during the summer scenario. In contrast, winter scenario simulations showed a much more homogeneous thermal pattern, reflecting the deciduous nature of the existing tree canopy and the greater availability of solar radiation across the site. Consequently, while the trees provide substantial shading and reduce radiant thermal loads during summer, they allow direct solar access during winter. This seasonal behaviour means that the thermally protected areas identified in the summer simulations do not correspond to permanently shaded locations throughout the year. Therefore, the partial correspondence observed between PET and subjective thermal sensation cannot be attributed simply to respondents selecting shaded areas during the winter surveys, but rather reflects the combined influence of seasonal adaptation, age-related physiological responses, and contextual factors.
During the summer scenario, these resulted in a shift from higher thermal stress in exposed areas to lower heat-stress categories beneath the tree canopy. In contrast, during the winter and spring campaigns, PET values generally remained within slight cold-stress or no-thermal-stress categories, reflecting the relatively mild Atlantic climate of the study area. These findings highlight the importance of preserving thermally diverse public spaces that simultaneously provide protection from summer heat while maintaining access to solar radiation during cooler periods.
These spatial differences in thermal conditions are particularly relevant in relation to how older adults occupy, use, and socially experience different areas of the public space.
The results also suggest that thermal heterogeneity may be advantageous in public-space design. Rather than providing uniform environmental conditions, the coexistence of sun-exposed and shaded areas allows users to select locations that best match their thermal preferences and activity patterns. This diversity may be particularly beneficial for older adults, whose thermal needs and adaptive behaviours can vary considerably across seasons and individuals.
4.3. Multisensory Perception, Social Interaction and Public-Space Use
The survey findings indicate that environmental perception extends beyond thermal comfort and includes acoustic, visual and social dimensions that together shape how older adults experience public space. The lower number of surveys collected during summer suggests that higher temperatures may have discouraged use of the space, despite generally acceptable subjective comfort responses. This finding highlights the importance of designing outdoor environments that maintain adequate thermal comfort during warmer conditions in order to support continued use, sociability, and well-being, particularly among older adults who are more vulnerable to heat stress.
In addition to thermal comfort, other environmental dimensions contributed to users’ overall experience of the Barrendain intervention area and provide a broader understanding of how public-space quality is associated with perceived comfort and sociability.
In relation to acoustic perception, although men tended to evaluate the sound environment more negatively and expressed a stronger preference for quieter conditions, noise was not commonly identified as a major barrier to use of the study area. Women reported a higher proportion of neutral or no-change responses, reinforcing the idea that perceived comfort is shaped not only by environmental conditions but also by social and behavioural factors.
The survey results revealed a strong preference for vegetation-related elements, particularly green and floral features, underlining the role of natural components in shaping environmental perception and potentially supporting both comfort and public-space use.
Perceived sociability was notably high, particularly among men, all of whom reported that interaction in the space is easy. In contrast, women more frequently identified the need for improvements related to comfort, suggesting a more critical perception of environmental conditions. These findings point to subtle sex-related differences in how public space is experienced and highlight the importance of incorporating inclusive design strategies. Taken together, the survey findings and the spatial distribution of PET suggest that favourable environmental conditions may facilitate opportunities for everyday use and informal social encounters. However, the present study did not quantify occupancy patterns or length of stay, and therefore these relationships should be interpreted as plausible associations rather than demonstrated causal effects.
Interestingly, respondents more frequently associated sociability with the presence of familiar people and the existing social atmosphere than with the physical characteristics of the urban area itself. Environmental quality may therefore be understood as an enabling condition that supports opportunities for everyday encounters, while existing social networks and community familiarity may play an important role in shaping perceived sociability.
Although participants frequently associated positive perceptions of the study area with familiar people and the existing social atmosphere, the questionnaire included only a limited number of items specifically addressing the social dimension. Consequently, the present study should be understood as providing an exploratory assessment of perceived sociability rather than a comprehensive analysis of social interaction.
4.4. Design Implications
Nevertheless, microclimatic performance alone is not sufficient to ensure an age-friendly and socially supportive public space. Despite its environmental advantages, the current configuration of the Barrendain intervention area reflects its origin as a set of previously disconnected spaces, including a children’s play area and a traffic roundabout separated by vehicular circulation. As a result, the site still presents spatial limitations, including fragmentation, very limited seating, interruptions caused by traffic, and the poor suitability of certain sub-areas. These factors reduce continuity, accessibility, and opportunities for everyday encounters, particularly among older users.
From this perspective, the study area can be considered environmentally favourable but only partially responsive to the social and functional needs of older adults. These findings suggest that favourable thermal conditions alone are insufficient to guarantee continued public-space use when accessibility, seating availability, spatial continuity, and opportunities for everyday encounters remain limited.
The results also indicate that age-friendly public spaces should not aim to provide uniform thermal conditions. Instead, they should incorporate a diversity of microclimatic environments, including both sun-exposed and shaded areas, allowing users to select locations that best match their thermal preferences and activity patterns throughout the year. Such environmental diversity may be particularly relevant for older adults due to individual differences in thermal sensitivity and thermoregulation.
The future Barrendain Square should therefore preserve the existing vegetation structure while strengthening spatial continuity, improving the distribution of seating areas, reducing circulation fragmentation, and introducing uses and activities that support everyday sociability, light physical activity, and climate resilience.
Practical design strategies derived from the present study include maintaining a balanced combination of shaded and sun-exposed seating areas, improving pedestrian continuity and accessibility, incorporating new vegetation that provides seasonal climatic protection, and creating flexible spaces that support both passive and active forms of everyday public-space use.
The simulations indicate that the central tree-covered zone functions as a thermally moderated area, with substantially lower PET values than surrounding exposed surfaces during summer conditions. This finding supports the design strategy of preserving and strengthening the existing vegetation structure, while strategically locating new seating areas within or near these thermally protected zones. This design implication is also consistent with users’ expressed demand for more seating and more comfortable places to stay.
Finally, the findings suggest that design decisions should not rely exclusively on objective thermal indices. Combining environmental modelling with user-centred assessment methods provides a more robust basis for designing age-friendly public spaces that are both thermally comfortable and socially supportive. Although the present study focuses on older adults, many of the proposed strategies may also improve environmental comfort, usability and opportunities for everyday encounters among the wider population, thereby contributing to broader age-friendly and climate-resilient urban design.
Beyond the Barrendain case study, the proposed framework provides a practical methodology for municipalities seeking to integrate climate adaptation, healthy ageing and social inclusion into public-space planning. Its recognition as a good practice within the KORALE (Interreg Europe) project further demonstrates its transferability and potential to support age-friendly urban policies in other European contexts facing similar demographic and climatic challenges.
Future research should examine the role of public space in supporting intergenerational interaction and addressing different forms of social isolation through longitudinal and comparative research designs.
4.5. Limitations and Future Research
Although the sample size limits broad statistical generalisation, the study provides context-specific evidence regarding thermal perception, environmental quality, and patterns of public-space use among older adults. The findings should therefore be interpreted within the exploratory and case-study nature of the research.
Another limitation concerns the survey design. A non-probability intercept sampling strategy was adopted to characterise environmental perception under real-use conditions rather than to estimate population prevalence. Although most participants (76.9%) reported that they were passing through the intervention area, the duration of outdoor exposure prior to the interview was not recorded. Consequently, the possible influence of exposure time on subjective thermal perception could not be assessed and should be considered in future research. Furthermore, the observational and cross-sectional nature of the study precludes causal interpretation of the reported associations between environmental conditions, subjective perception and reported public-space use.
Additional limitations relate to the use of in situ questionnaires conducted under real environmental conditions, which may influence participation rates, seasonal balance, and subjective responses. Perceptual evaluations are inherently context-dependent and may be affected by behavioural, social, and temporal factors that are difficult to isolate through field surveys alone.
Future research will evaluate the impact of the ongoing redesign project once construction works are completed. This evaluation will combine behavioural observation, user surveys, environmental monitoring, and updated microclimatic simulations in order to assess changes in environmental comfort, length of stay, and social interaction, while also improving the calibration and validation of the simulation framework. Particular attention will be given to the replicability of the proposed methodological approach.
Furthermore, although PET simulations provide valuable information on spatial and seasonal thermal patterns, model-based approaches cannot fully capture the complexity of subjective comfort perception and adaptive behaviour in public space. The comparison between PET and TSV responses conducted in this study illustrates the importance of combining objective environmental indicators with user-centred assessment methods when evaluating outdoor comfort among ageing populations.
The ENVI-met simulations were primarily intended to support the comparative spatial analysis of outdoor thermal conditions within the study area rather than to provide fully calibrated predictions of pedestrian-level microclimatic conditions. Although the simulations were based on meteorological forcing data obtained from the nearby official weather station, a formal quantitative validation against on-site microclimatic measurements was not conducted. Accordingly, the PET results presented here should be regarded as comparative indicators of spatial and seasonal thermal patterns rather than fully validated estimates of absolute pedestrian-level thermal exposure.
This limitation is consistent with broader challenges identified in urban microclimate modelling, where simulation outputs are sensitive to boundary conditions, material properties, vegetation representation, and the modelling of radiative exchanges [
57,
58,
59]. Accordingly, the PET results presented here should be interpreted as comparative indicators of spatial and seasonal thermal patterns rather than as fully validated estimates of absolute pedestrian-level thermal exposure. This interpretation is consistent with previous simulation-based studies that have used urban microclimate models to identify relatively exposed and protected areas, while acknowledging uncertainties associated with local parameterisation and validation procedures.
In addition, future analyses within the KALELAGUN project will compare the findings obtained at this study site with results from two additional case studies located in different urban contexts, including a consolidated urban public space and a peripheral public space. This comparative approach is expected to provide broader insights into the relationships between thermal comfort, public-space use, accessibility, and sociability, while contributing to the refinement of the methodological framework applied in this research.
5. Conclusions
This study highlights the value of integrating seasonal field surveys, environmental perception and microclimatic simulations as a baseline assessment to support evidence-informed urban regeneration for ageing populations, while acknowledging the uncertainties inherent in microclimatic simulation.
The findings of this study demonstrate that outdoor thermal perception among older adults is shaped by the combined influence of environmental conditions, behavioural adaptation and contextual factors. Older adults reported relatively high levels of outdoor thermal comfort throughout the year despite marked seasonal differences in environmental conditions, supporting previous evidence on adaptive thermal comfort in outdoor environments.
A key methodological contribution of this study lies in integrating subjective thermal responses, field-based environmental assessment and ENVI-met/BIO-met simulations within a single diagnostic framework applied before the redevelopment of a real public space.
The combined analysis of TSVs and simulation-derived PET showed that thermal perception among older adults should not be explained solely by objective environmental indicators. Neutral temperatures differed substantially between the cold- and warm-period campaigns (12.35 °C and 19.87 °C, respectively), while the comparison between PET and TSVs revealed only a partial correspondence between modelled thermal stress and subjective thermal sensation. Together, these findings suggest the role of behavioural adaptation, seasonal expectations, and contextual factors in shaping comfort, and show the value of combining environmental modelling with user-centred assessment methods when evaluating outdoor comfort and public-space performance.
From an urban design and planning perspective, the findings indicate that age-friendly public spaces should not aim to provide uniform thermal conditions but rather a diversity of microclimatic environments capable of accommodating seasonal variation and individual thermal preferences. Vegetation, a balanced distribution of shaded and sun-exposed seating, spatial continuity and accessibility should therefore be considered complementary strategies for creating thermally comfortable and socially supportive public spaces.
The PET simulations further demonstrate that vegetation can mitigate summer heat stress while preserving solar access during cooler periods, supporting seasonally responsive urban design. The simulations also highlight the importance of preserving seasonal microclimatic diversity rather than pursuing uniform thermal conditions throughout the intervention area.
The findings also indicate that environmental quality should be understood as an enabling condition rather than the sole determinant of perceived sociability. While favourable environmental conditions may facilitate opportunities for everyday encounters, existing social networks, familiarity and spatial organisation also contribute to how older adults experience public space. Consequently, environmental, spatial and social dimensions should be addressed together when designing age-friendly urban environments.
These findings should nevertheless be interpreted as exploratory, given that the assessment of the social dimension was based on a limited number of survey items.
The present study represents the baseline phase of a broader research process. Finally, in the context of climate change and the increasing frequency of extreme temperature events, the design of resilient and inclusive public spaces becomes increasingly important. Future research will evaluate the impact of the ongoing redesign of Barrendain Square through behavioural observation, user surveys, and updated microclimatic simulations. Additional comparative analyses developed within the KALELAGUN project will also assess other public-space typologies in order to improve the replicability and methodological robustness of the proposed approach.
As an exploratory baseline case study, the proposed methodological framework demonstrates how objective environmental assessment, microclimatic simulation and users’ subjective perceptions can be integrated to support evidence-informed urban regeneration. Beyond the specific case of Barrendain, this approach provides a transferable methodology for municipalities seeking to design climate-responsive, age-friendly and socially supportive public spaces while informing urban policies for healthy and active ageing.



 ,
,