Integrated Management of Urban Landscape and Public Security


 , and
, and
Abstract
1. Introduction
2. Materials and Methods
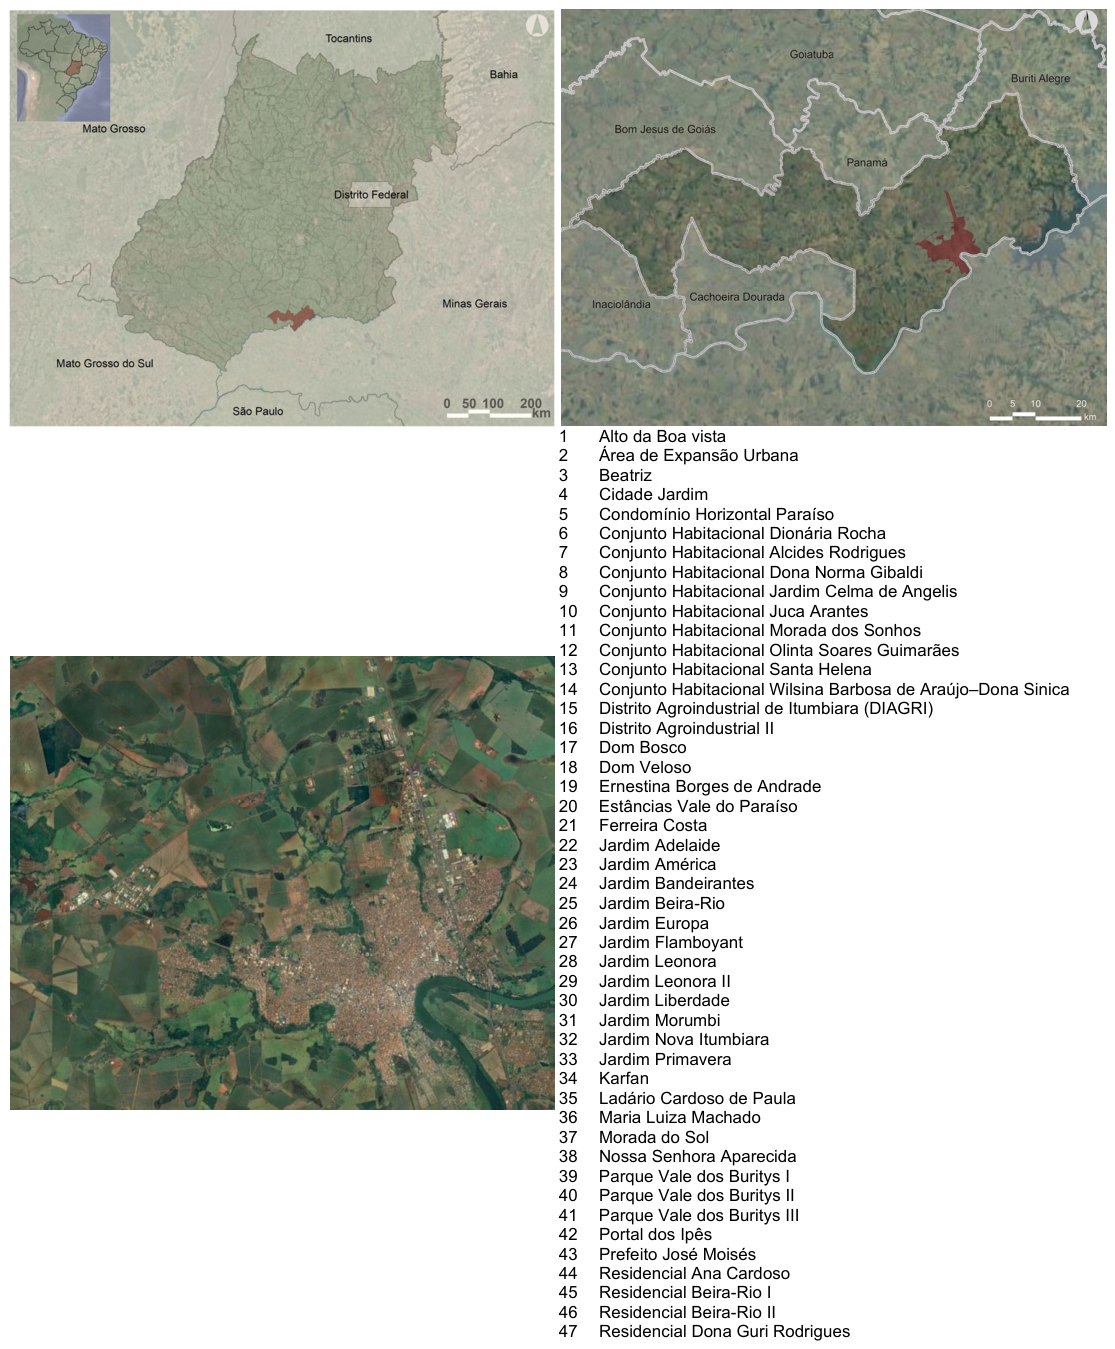
2.1. Research Area
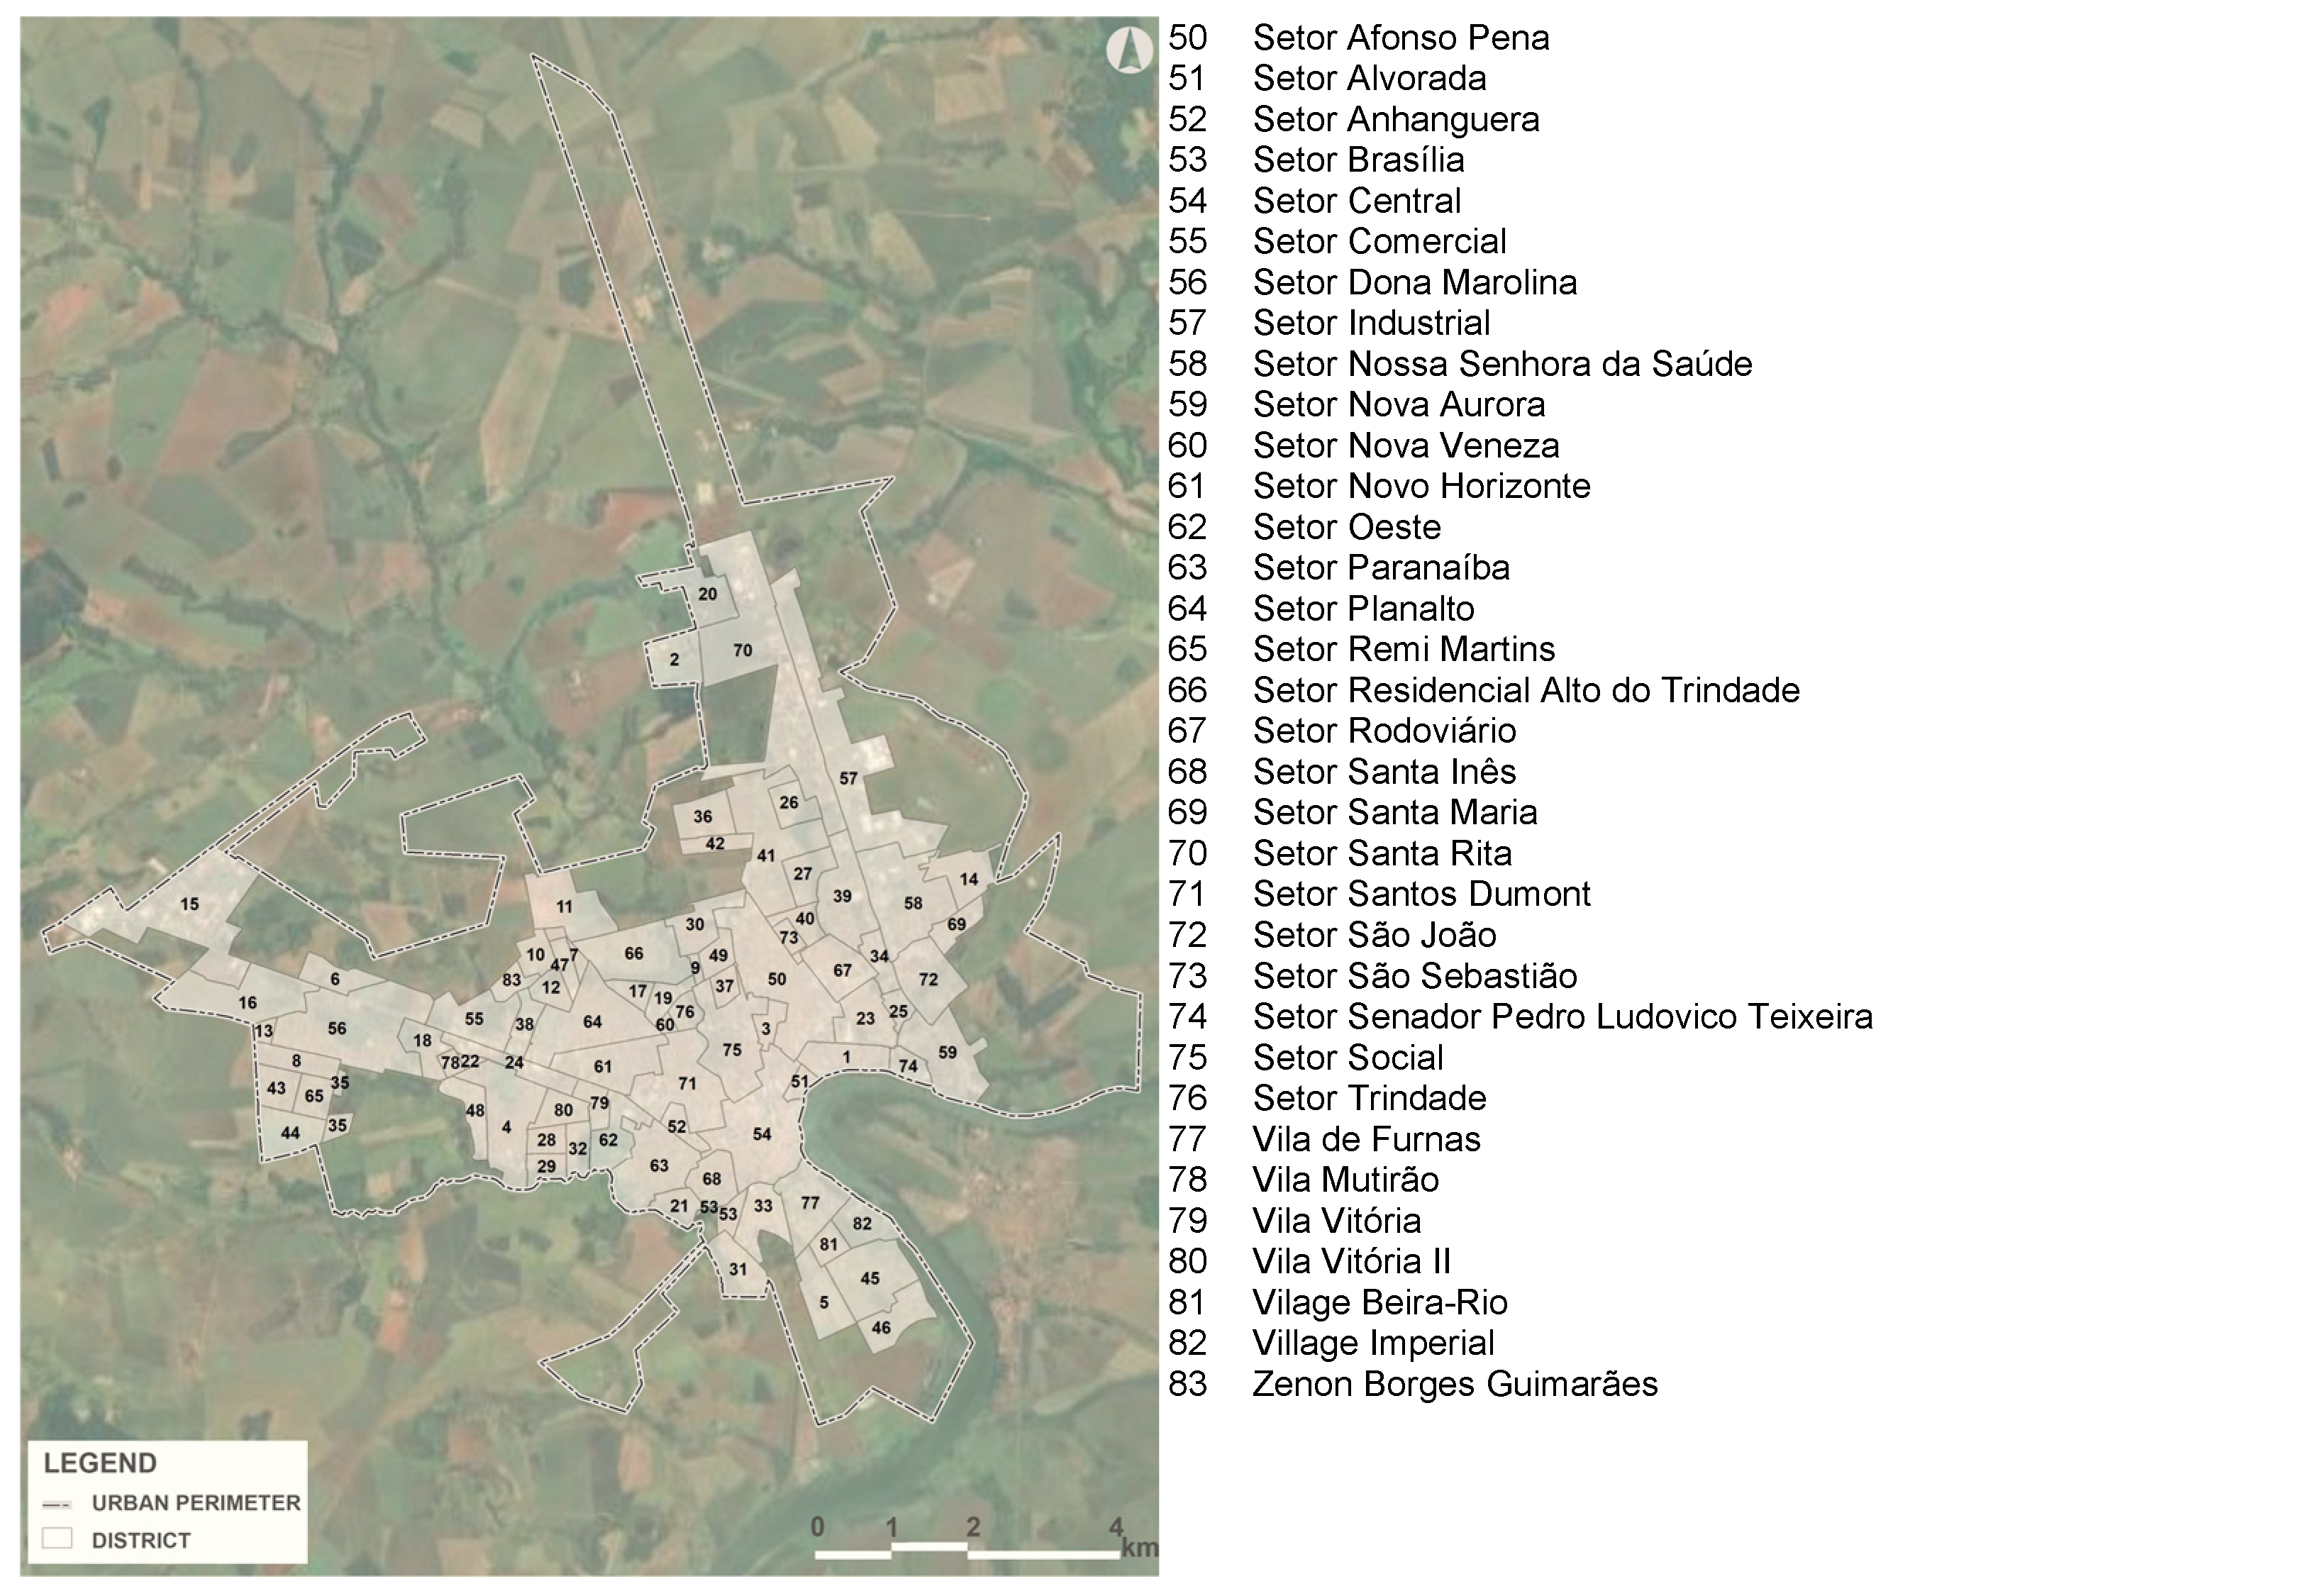
2.2. Study Units
2.3. Analytical Variables
3. Results
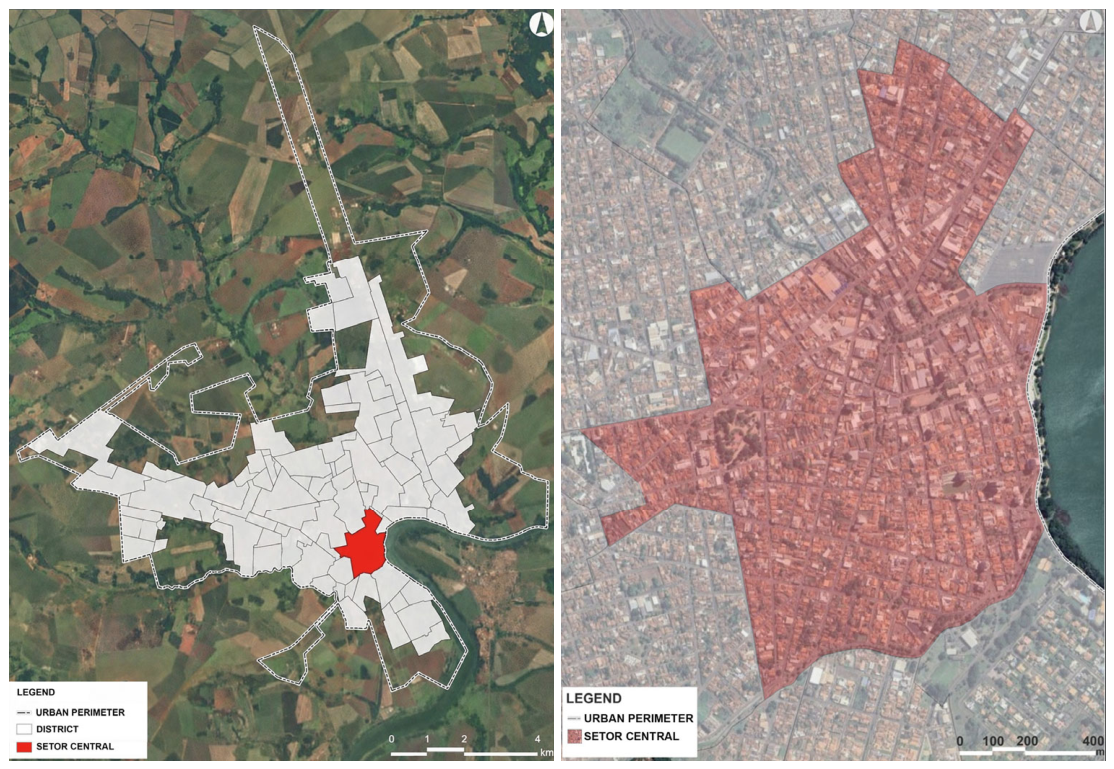
3.1. Selecting the District
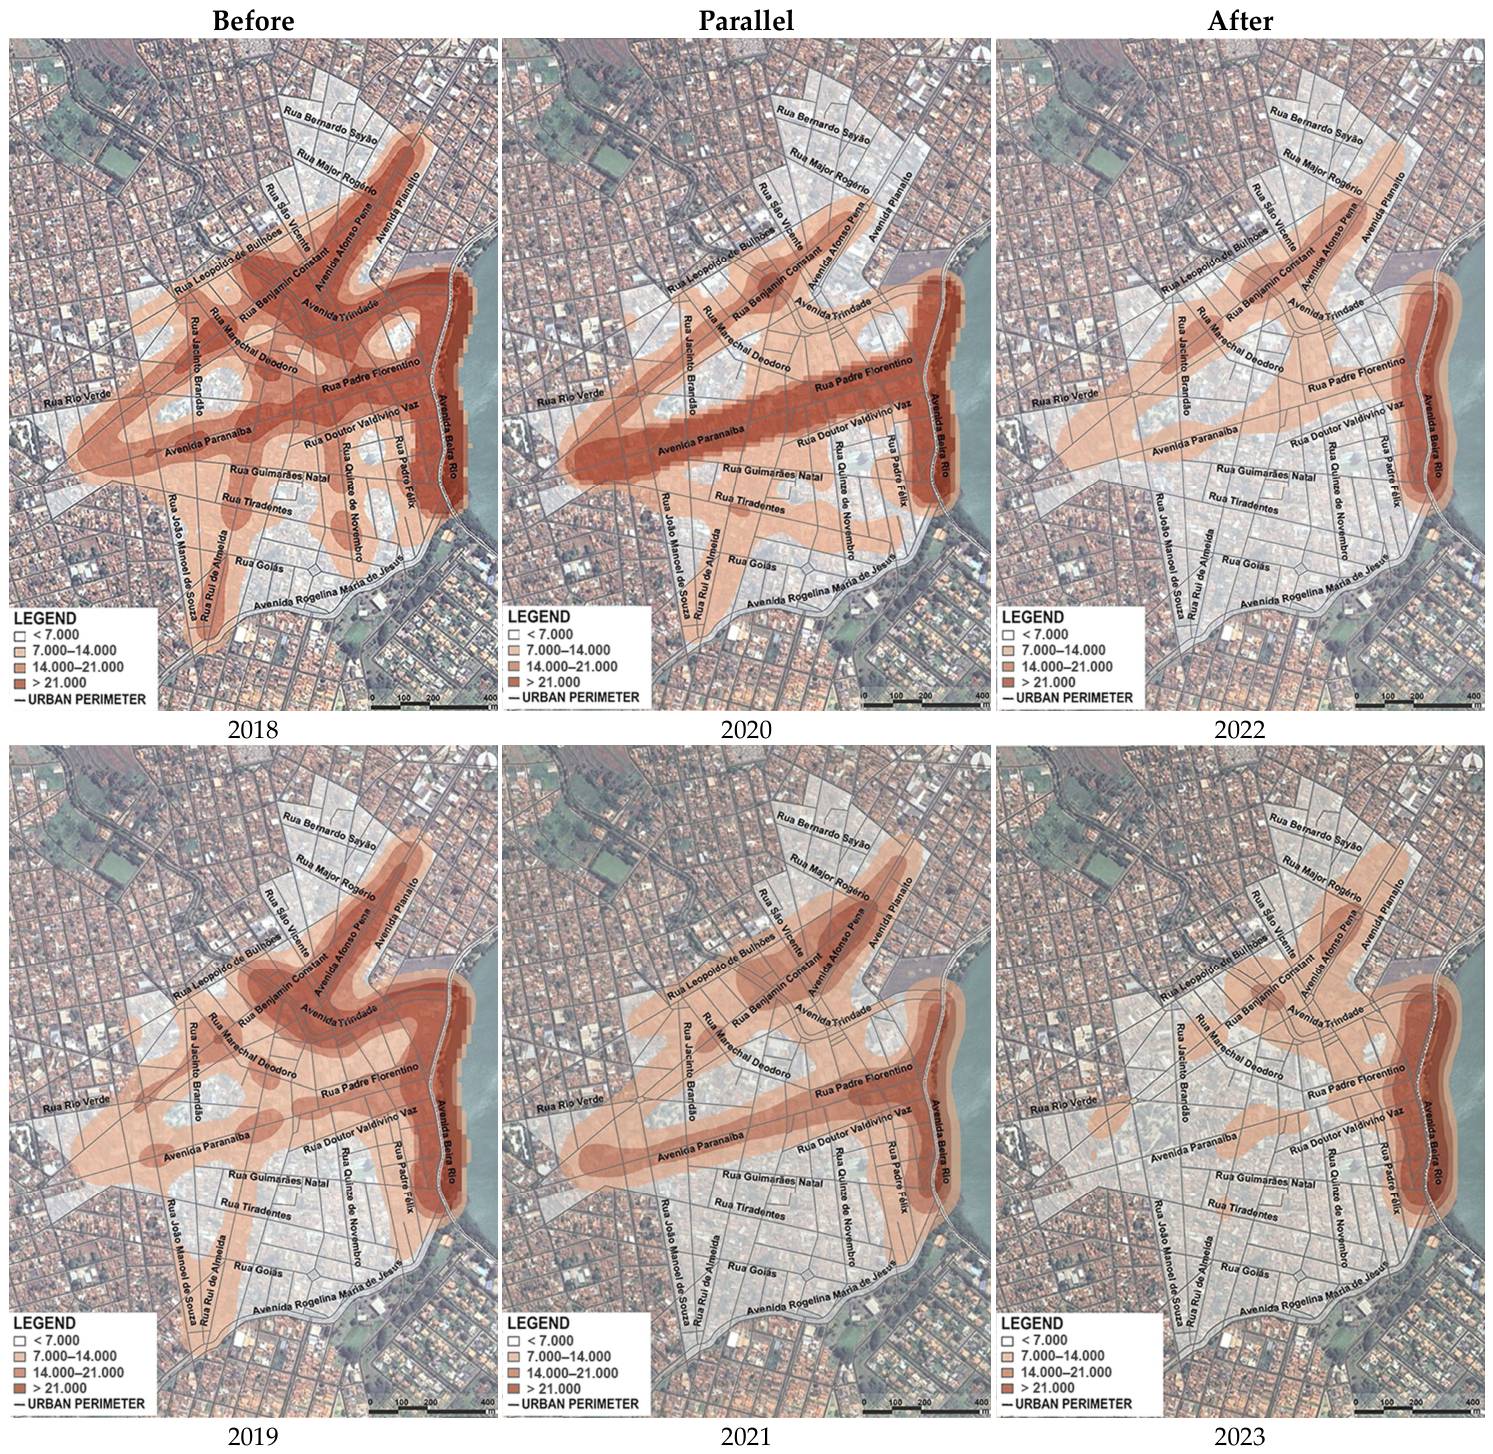
3.2. Selecting the Street
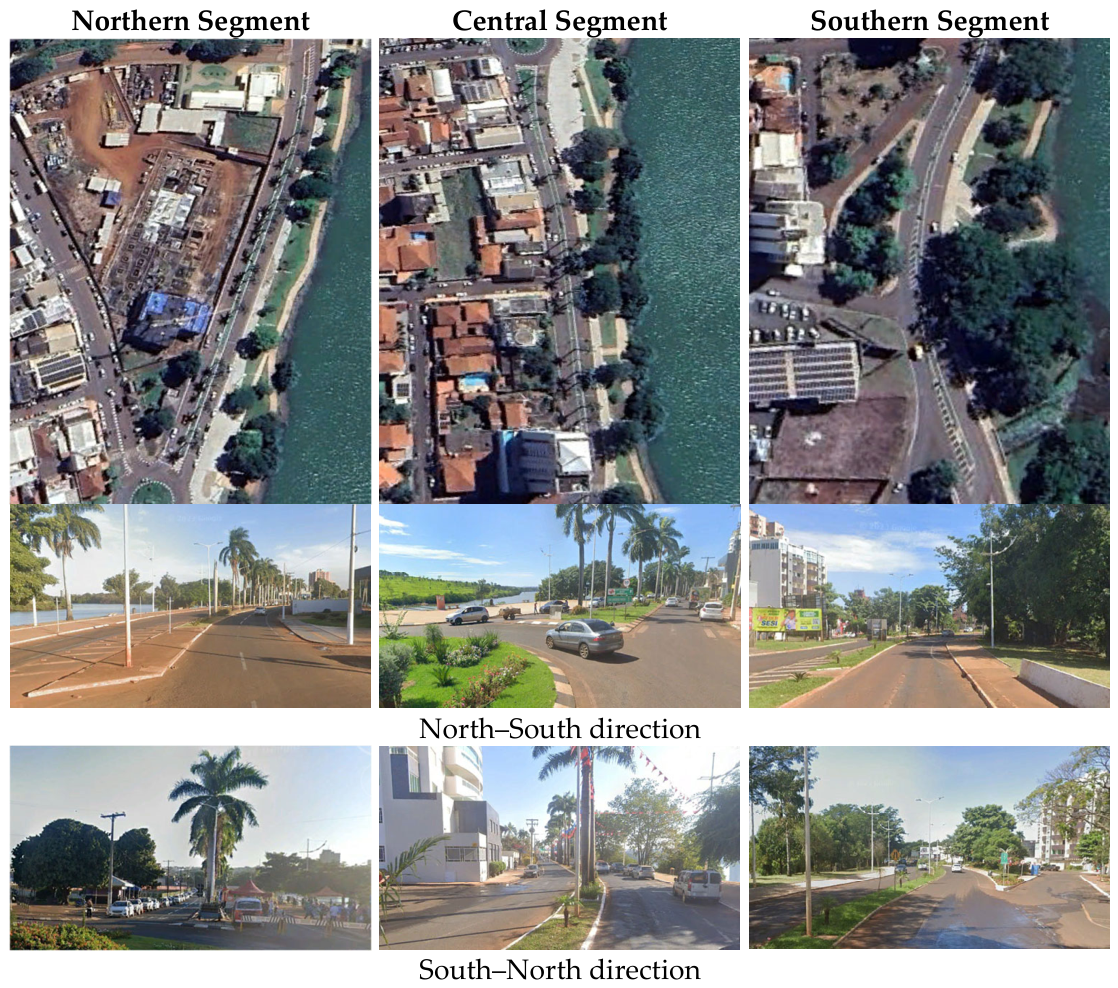
3.3. Segmenting the Route
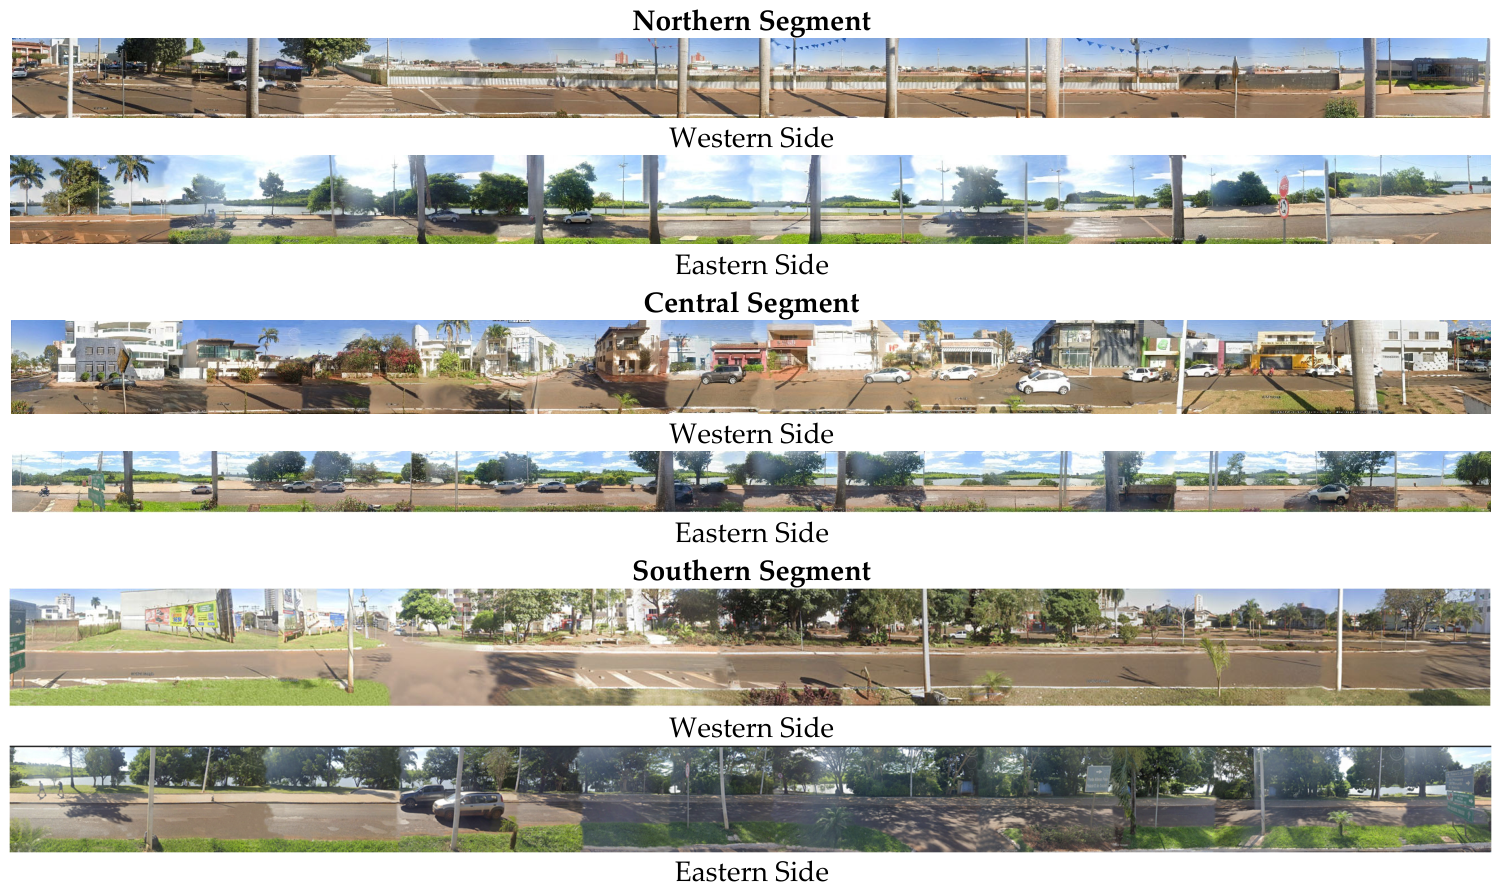
3.4. Evaluating Variables
4. Discussion
4.1. Key Theoretical–Practical Contributions
4.2. Main Conceptual–Empirical Limitations
5. Conclusions
Author Contributions
Funding
Institutional Review Board Statement
Informed Consent Statement
Data Availability Statement
Acknowledgments
Conflicts of Interest
Abbreviations
| ANOVA | Analysis of Variance |
| ArcGIS | Arc Geographic Information System |
| CNPq | National Council for Scientific and Technological Development (Conselho Nacional de Desenvolvimento Científico e Tecnológico) |
| COVID-19 | Coronavirus disease 2019 |
| CPTED | Crime Prevention through Environmental Design |
| ESRI | Environmental Systems Research Institute |
| FA | Araucária Foundation (Fundação Araucária) |
| GIS | Geographic Information System |
| IBGE | Brazilian Institute of Geography and Statistics (Instituto Brasileiro de Geografia e Estatística) |
| KDE | Kernel Density Estimation |
| OSP-GO | Public Security Observatory of the State of Goiás (Observatório de Segurança Pública do Estado de Goiás) |
| PMI | Municipal Government of Itumbiara (Prefeitura Municipal de Itumbiara) |
| PUCPR | Pontifical Catholic University of Paraná (Pontifícia Universidade Católica do Paraná) |
| QGIS | Quantum Geographic Information System |
| SciPy | Scientific Python |
| UniCerrado | Goiatuba University Center (Centro Universitário Goiatuba) |
Appendix A

| Variables/Parameters | Northern Segment | Central Segment | Southern Segment | |||||||||||||||
|---|---|---|---|---|---|---|---|---|---|---|---|---|---|---|---|---|---|---|
| Western Side | Eastern Side | Averages | Western Side | Eastern Side | Averages | Western Side | Eastern Side | Averages | ||||||||||
| Socio-Behavioral Variables | ||||||||||||||||||
| Evasion | Escape routes: short blocks unfavorable to police pursuit (due to the proximity of street corners) and other spatial elements structuring exit and dispersal paths for offenders (common in parks, squares, and similar places), which facilitate their withdrawal from the field of vision and therefore restrict their apprehension (average percentage) | Measure | 9% | 100% | 100% | 100% | 100% | 100% | ||||||||||
| Justification | almost the entire length of the segment characterized by long block (235 m) without physical permeability | entire length of the segment with physical permeability (park) | entire segment with blocks under 100 m (60, 75, 98 m) | entire length of the segment with physical permeability (park) | entire length of the segment with physical permeability (square and vacant lot) | entire length of the segment with physical permeability (park) | ||||||||||||
 |  |  |  |  |  | |||||||||||||
| Initial class | 4 | 1 | 1 | 1 | 1 | 1 | ||||||||||||
| Promoter or reducer | application of reducer due to the possibility of escape through wall crossing | |||||||||||||||||
 | ||||||||||||||||||
| Final class | 3 | 1 | 2.0 | 1 | 1 | 1.0 | 1 | 1 | 1.0 | |||||||||
| less than 10% | tendency for segment data located within the lower decile: potential for substantial minimization of adverse escape routes characteristics | |||||||||||||||||
| from 10% to 25% | tendency for remaining segment data in the lower decile located within the lower quartile: potential for relative minimization of adverse escape routes characteristics | |||||||||||||||||
| from 26% to 50% | tendency for segment data located within the intermediate-low quartile: potential for relative maximization of adverse escape routes characteristics | |||||||||||||||||
| more than 50% | tendency for segment data located within the two upper quartiles: potential for substantial maximization of adverse escape routes characteristics | |||||||||||||||||
| CONCEALMENT | Physical barriers: spatial components that form physical hiding places for offenders, enabling surprise attacks without giving victims time to react (average percentage) | Measure | 0% | 4% | 8% | 4% | 26% | 81% | ||||||||||
| Justification | the entire length of the stretch without physical barriers to concealment in public space | physical barriers for concealment in public spaces along less than 10% of the stretch’s length | physical barriers for concealment in public spaces along less than 10% of the stretch’s length | physical barriers for concealment in public spaces along less than 10% of the stretch’s length | physical barriers for concealment in public space covering between 30% and 50% of the section’s length | physical barriers for concealment in public space covering more than 75% of the section’s length | ||||||||||||
 |  |  |  |  |  | |||||||||||||
| Initial class | 4 | 4 | 4 | 4 | 2 | 1 | ||||||||||||
| Promoter or reducer | application of reducer due to the possibility of concealment caused by the drop on the riverbank | application of reducer due to the possibility of concealment caused by the drop on the riverbank | ||||||||||||||||
 |  | |||||||||||||||||
| Final class | 4 | 3 | 3.5 | 4 | 3 | 3.5 | 2 | 1 | 1.5 | |||||||||
| less than 10% | tendency for segment data located within the lower decile: potential for substantial minimization of adverse physical barriers characteristics | |||||||||||||||||
| from 10% to 25% | tendency for remaining segment data in the lower decile located within the lower quartile: potential for relative minimization of adverse physical barriers characteristics | |||||||||||||||||
| from 26% to 50% | tendency for segment data located within the intermediate-low quartile: potential for relative maximization of adverse physical barriers characteristics | |||||||||||||||||
| more than 50% | tendency for segment data located within the two upper quartiles: potential for substantial maximization of adverse physical barriers characteristics | |||||||||||||||||
| Shielding | Visual obstructions: spatial components that form visual hiding places for offenders, enabling surprise attacks without giving victims time to react (average percentage) | Measure | 2% | 100% | 9% | 100% | 39% | 100% | ||||||||||
| Justification | few visual obstructions in public space (especially by square elements) | visual obstructions in public space (especially by drop on the riverbank along the entire segment) | few visual obstructions in public space (especially by shrub vegetation) | visual obstructions in public space (especially by drop on the riverbank along the entire segment) | few visual obstructions in public space (especially by square shrub vegetation) | visual obstructions in public space (especially by drop on the riverbank along the entire segment) | ||||||||||||
 |  |  |  |  |  | |||||||||||||
| Initial class | 4 | 1 | 4 | 1 | 2 | 1 | ||||||||||||
| Promoter or reducer | ||||||||||||||||||
| Final class | 4 | 1 | 2.5 | 4 | 1 | 2.5 | 2 | 1 | 1.5 | |||||||||
| less than 10% | tendency for segment data located within the lower decile: potential for substantial minimization of adverse visual obstructions characteristics | |||||||||||||||||
| from 10% to 25% | tendency for remaining segment data in the lower decile located within the lower quartile: potential for relative minimization of adverse visual obstructions characteristics | |||||||||||||||||
| from 26% to 50% | tendency for segment data located within the intermediate-low quartile: potential for relative maximization of adverse visual obstructions characteristics | |||||||||||||||||
| more than 50% | tendency for segment data located within the two upper quartiles: potential for substantial maximization of adverse visual obstructions characteristics | |||||||||||||||||
| Socio-Morphological Variables | ||||||||||||||||||
| Dimensions | Street scale: proportions of sidewalks that optimize pedestrian circulation, configured as spatial guardians (average proportion: sidewalk width/ roadway width) | Measure | 0.20 | 0.66 | 0.53 | 0.77 | 0.53 | 0.77 | ||||||||||
| Justification | sidewalk = 1.5 m/ roadway = 7.5 m | sidewalk = 5.0 m/ roadway = 7.5 m | sidewalk = 3.5 m/ roadway = 6.5 m | sidewalk = 5.0 m/ roadway = 6.5 m | sidewalk = 3.5 m/ roadway = 6.5 m | sidewalk = 5.0 m/ roadway = 6.5 m | ||||||||||||
 |  |  |  |  |  | |||||||||||||
| Initial class | 1 | 3 | 3 | 3 | 3 | 3 | ||||||||||||
| Promoter or reducer | application of promoter due to the expansion of sidewalks into open areas | application of promoter due to the expansion of sidewalks into open areas | application of promoter due to the expansion of sidewalks into open areas | application of promoter due to the expansion of sidewalks into open areas | ||||||||||||||
 |  |  |  | |||||||||||||||
| Final class | 1 | 4 | 2.5 | 3 | 4 | 3.5 | 4 | 4 | 4.0 | |||||||||
| more than 1/1 (more than 1.00) | framing of segment proportional average between sidewalk and roadway widths with potential for significant maximization of positive street-scale attributes | |||||||||||||||||
| from 1/1 to 1/2 (from 1.00 to 0.50) | framing of segment proportional average between sidewalk and roadway widths with potential for relative maximization of positive street-scale attributes | |||||||||||||||||
| from 1/2 to 1/4 (from 0.49 to 0.25) | framing of segment proportional average between sidewalk and roadway widths with potential for relative minimization of positive street-scale attributes | |||||||||||||||||
| less than 1/4 (less than 0.25) | framing of segment proportional average between sidewalk and roadway widths with potential for substantial minimization of positive street-scale attributes | |||||||||||||||||
| Urban scale: proportions of built elements inviting the attraction of people and their spatial perception for natural surveillance (average proportion: block length/higher building height) | Measure | 42.70 | - | 6.50 | - | - | 56.78 | |||||||||||
| Justification | block length = 235 m/ higher building height = 5.5 m | block length = 278 m/ without buildings | blocks length = 234 m/ higher building height = 36.0 m | block length = 280 m/ without buildings | block length = 116 m/ without buildings | blocks length = 159 m/ higher building height = 2.8 m | ||||||||||||
 |  |  |  |  |  | |||||||||||||
| Initial class | 4 | 4 | 4 | 4 | 4 | 4 | ||||||||||||
| Promoter or reducer | ||||||||||||||||||
| Final class | 4 | 4 | 4.0 | 4 | 4 | 4.0 | 4 | 4 | 4.0 | |||||||||
| more than 1/1 (more than 1.00) | framing of segment proportional average between block length and higher building height with potential for substantial maximization of positive urban scale attributes | |||||||||||||||||
| from 1/1 to 1/2 (from 1.00 to 0.50) | framing of segment proportional average between block length and higher building height with potential for relative maximization of positive urban scale attributes | |||||||||||||||||
| from 1/2 to 1/4 (from 0.49 to 0.25) | framing of segment proportional average between block length and higher building height with potential for relative minimization of positive urban scale attributes | |||||||||||||||||
| less than 1/4 (less than 0.25) | framing of segment proportional average between block length and higher building height with potential for substantial minimization of positive urban scale attributes | |||||||||||||||||
| Densities | Constructive/population densification: higher levels of residential building occupation generally correspondent to a greater number of users in outdoor spaces surrounding constructions (average density) | Measure | 1.9 | 0 | 75.8 | 0 | 0 | 0 | ||||||||||
| Justification | low population density of the lots facing the street | without residential buildings | high population density of the lots facing the street | without residential buildings | without residential buildings | without residential buildings | ||||||||||||
 |  |  |  |  |  | |||||||||||||
| Initial class | 1 | 1 | 4 | 1 | 1 | 1 | ||||||||||||
| Promoter or reducer | ||||||||||||||||||
| Final class | 1 | 1 | 1.0 | 4 | 1 | 2.5 | 1 | 1 | 1.0 | |||||||||
| more than 36 inh./ha | framing of segment average constructive population density above twice the city mean: potential for significant expansion of natural surveillance | |||||||||||||||||
| from 24 inh./ha to 36 inh./ha | framing of segment average constructive population density between city mean and twice this value: potential for relative expansion of natural surveillance | |||||||||||||||||
| from 12 inh./ha to 24 inh./ha | framing of segment average constructive population density between city mean and half this value: potential for relative reduction in natural surveillance | |||||||||||||||||
| less than 12 inh./ha | framing of segment average constructive population density below half the city mean: potential for significant reduction in natural surveillance | |||||||||||||||||
| Diversity of uses: wider range of land uses that distinguishes distinct groups of users and enhances urban vitality and public safety (degree of land use diversity) | Measure | 2 (commercial and leisure-square) | 1 (leisure-park) | 4 (residential, commercial, institutional and services) | 1 (leisure-park) | 1 (leisure-square, besides vacant lot) | 2 (leisure-park-and services) | |||||||||||
| Justification | low-diversified use | undiversified use | diversified use | undiversified use | undiversified use | low-diversified use | ||||||||||||
 |  |  |  |  |  | |||||||||||||
 |  | |||||||||||||||||
 | ||||||||||||||||||
 | ||||||||||||||||||
| Initial class | 2 | 1 | 4 | 1 | 1 | 2 | ||||||||||||
| Promoter or reducer | ||||||||||||||||||
| Final class | 2 | 1 | 1.5 | 4 | 1 | 2.5 | 1 | 2 | 1.5 | |||||||||
| more than 3 uses | greater degree of segment land use diversity: potential for significant urban vitality | |||||||||||||||||
| 3 uses | median degree of segment land use diversity: potential for relative urban vitality | |||||||||||||||||
| 2 uses | smaller degree of segment land use diversity: potential for reduced urban vitality | |||||||||||||||||
| 1 use | absence of segment land use diversity: potential for very reduced urban vitality | |||||||||||||||||
| Acessibilities | Relations between public and private spaces: potential for access and circulation associated with the movement of people, fostering socio-spatial interactions (average percentage) | Measure | 5% | 100% | 0% | 100% | 65% | 97% | ||||||||||
| Justification | reduced potential of public access to small public space at a corner of the segment | broad potential of public access across full extent of the park | practically no potential due to predominance of private properties along entire segment | broad potential of public access across full extent of the park | broad potential of public access from presence of square, reduced by vacant private property | broad potential of public access along the almost extent of the park | ||||||||||||
 |  |  |  |  |  | |||||||||||||
| Initial class | 1 | 4 | 1 | 4 | 4 | 4 | ||||||||||||
| Promoter or reducer | ||||||||||||||||||
| Final class | 1 | 4 | 2.5 | 1 | 4 | 2.5 | 4 | 4 | 4.0 | |||||||||
| more than 50% | tendency for segment data located within the two upper quartiles: potential for substantial maximization of positive relations between public and private spaces | |||||||||||||||||
| from 26 to 50% | tendency for segment data located within the intermediate-upper quartile: potential for relative maximization of positive relations between public and private spaces | |||||||||||||||||
| from 10 to 25% | tendency for remaining segment data in the lower decile located within the lower quartile: potential for relative minimization of positive relations between public and private spaces | |||||||||||||||||
| less than 10% | tendency for segment data located within the lower decil: potential for substantial minimization of positive relations between public and private spaces | |||||||||||||||||
| Spatial intervisibility: facades and enclosures with transparent openings that induce interactions and visual access, enabling spatial monitoring at the observer’s eye level (average percentage) | Measure | 9% | 95% | 24% | 86% | 91% | 73% | |||||||||||
| Justification | low degree of openings and transparencies along nearly entire segment | high degree of openings with occasional transparency failure due to visual barrier from vegetation | low degree of openings and transparency in blocks (10%, 21% and 48%) | high degree of openings with occasional transparency failure due to visual barrier from vegetation | high degree of openings with occasional transparency failure due to visual barrier from vegetation and billboards | high degree of openings with transparency failure due to visual barrier from vegetation | ||||||||||||
 |  |  |  |  |  | |||||||||||||
 |  | |||||||||||||||||
 | ||||||||||||||||||
| Initial class | 1 | 4 | 2 | 4 | 4 | 4 | ||||||||||||
| Promoter or reducer | ||||||||||||||||||
| Final class | 1 | 4 | 2.5 | 2 | 4 | 3.0 | 4 | 4 | 4.0 | |||||||||
| more than 50% | tendency for segment data located within the two upper quartiles: potential for substantial maximization of positive spatial intervisibility attributes | |||||||||||||||||
| from 26 to 50% | tendency for segment data located within the intermediate-upper quartile: potential for relative maximization of positive spatial intervisibility attributes | |||||||||||||||||
| from 10 to 25% | tendency for remaining segment data in the lower decile located within the lower quartile: potential for relative minimization of positive spatial intervisibility attributes | |||||||||||||||||
| less than 10% | tendency for segment data located within the lower decil: potential for substantial minimization of positive spatial intervisibility attributes | |||||||||||||||||
| Attractiveness | Local references: presence of distinctive elements (nodal points and/or landmarks) that foster recognition and attract individuals and groups (degree of presence) | Measure | 1 | 1 | 1 | 1 | 1 | 0 | ||||||||||
| Justification | presence of a nodal point (roundabout) and absence of landmarks | presence of a nodal point (roundabout) and absence of landmarks | presence of a nodal point (roundabout) and absence of landmarks | presence of a nodal point (roundabout) and absence of landmarks | presence of a landmark (sign) and absence of nodal points | absence of nodal points and landmarks | ||||||||||||
 |  |  |  |  | ||||||||||||||
| Initial class | 1 | 1 | 1 | 1 | 1 | 1 | ||||||||||||
| Promoter or reducer | ||||||||||||||||||
| Final class | 1 | 1 | 1.0 | 1 | 1 | 1.0 | 1 | 1 | 1.0 | |||||||||
| more than 3 references | greater degree of segment local references presence: potential for significant local recognition and attractiveness | |||||||||||||||||
| 3 references | median degree of segment local references presence: potential for relative local recognition and attractiveness | |||||||||||||||||
| 2 references | lower-median degree of segment local references presence: potential for reduced local recognition and attractiveness | |||||||||||||||||
| 1 or absence of references | smaller degree of segment local references presence or their absence: potential for very reduced local recognition and attractiveness | |||||||||||||||||
| Public lighting: spacing of permanent nighttime light sources to ensure adequate distribution of luminosity in public spaces (average spacing: lamp posts) | Measure | average of 30 m | average of 30 m | average of 30 m | average of 30 m | average of 30 m | average of 30 m | |||||||||||
| Justification | spacing of permanent nighttime light sources with reasonable distribution of luminosity in public spaces | spacing of permanent nighttime light sources with reasonable distribution of luminosity in public spaces | spacing of permanent nighttime light sources with reasonable distribution of luminosity in public spaces | spacing of permanent nighttime light sources with reasonable distribution of luminosity in public spaces | spacing of permanent nighttime light sources with reasonable distribution of luminosity in public spaces | spacing of permanent nighttime light sources with reasonable distribution of luminosity in public spaces | ||||||||||||
 |  |  |  |  |  | |||||||||||||
| Initial class | 3 | 3 | 3 | 3 | 3 | 3 | ||||||||||||
| Promoter or reducer | application of reducer due to the public lighting only along the median strip | application of promoter due to the presence of high-efficiency lighting luminaries in the park | application of reducer due to the public lighting only along the median strip | application of promoter due to the presence of high-efficiency lighting luminaries in the park | application of reducer due to the public lighting only along the median strip | application of promoter due to the presence of high-efficiency lighting luminaries in the park | ||||||||||||
 |  |  |  |  |  | |||||||||||||
| Final class | 2 | 4 | 3.0 | 2 | 4 | 3.0 | 2 | 4 | 3.0 | |||||||||
| less than 20 m | smaller spacing of permanent nighttime light sources in the segment: potential for significant maximization of adequate luminosity distribution in public spaces | |||||||||||||||||
| from 20 to 35 m | lower-medium spacing of permanent nighttime light sources in the segment: potential for relative maximization of adequate luminosity distribution in public spaces | |||||||||||||||||
| from 36 to 50 m | medium spacing of permanent nighttime light sources in the segment: potential for relative minimization of adequate luminosity distribution in public spaces | |||||||||||||||||
| more than 50 m | greater spacing of permanent nighttime light sources in the segment: potential for significant minimization of adequate luminosity distribution in public spaces | |||||||||||||||||
| Permanencies | Arrangement of seating and/or stopping furniture: Potential for spatial appropriation by users due to furniture elements (average percentage) | Measure | 9% | 100% | 0% | 100% | 62% | 0% | ||||||||||
| Justification | existence of a bench in a square at one of the corners | existence of benches along the entire length | absence of furniture for spatial appropriation along the entire length | existence of benches along 58% of the length | existence of a bench in the square | absence of furniture for spatial appropriation along the entire length | ||||||||||||
 |  |  |  |  |  | |||||||||||||
| Initial class | 1 | 4 | 1 | 4 | 4 | |||||||||||||
| Promoter or reducer | excessive spacing between benches | excessive spacing between benches | insufficient quantity of benches | |||||||||||||||
 |  |  | ||||||||||||||||
| Final class | 1 | 3 | 2.0 | 1 | 3 | 2.0 | 3 | 1 | 2.0 | |||||||||
| more than 50% | tendency for segment data located within the two upper quartiles: potential for substantial maximization of positive furniture arrangement attributes | |||||||||||||||||
| from 26 to 50% | tendency for segment data located within the intermediate-upper quartile: potential for relative maximization of positive furniture arrangement attributes | |||||||||||||||||
| from 10 to 25% | tendency for remaining segment data in the lower decile located within the lower quartile: potential for relative minimization of positive furniture arrangement attributes | |||||||||||||||||
| less than 10% | tendency for segment data located within the lower decil: potential for substantial minimization of positive furniture arrangement attributes | |||||||||||||||||
| Shading for seating and/or stopping: potential for environmental comfort that encourages users to remain in the location (average percentage) | Measure | 5% | 36% | 0% | 31% | 51% | 67% | |||||||||||
| Justification | low shading rate in permanence spaces (square at corner) | medium shading rate in permanence spaces (park) | absence of shading in public spaces | medium shading rate in permanence spaces (park) | high shading rate in permanence space (square) | high shading rate in permanence spaces (park) | ||||||||||||
 |  |  |  |  |  | |||||||||||||
| Initial class | 1 | 3 | 1 | 3 | 4 | 4 | ||||||||||||
| Promoter or reducer | ||||||||||||||||||
| Final class | 1 | 3 | 2.0 | 1 | 3 | 2.0 | 4 | 4 | 4.0 | |||||||||
| more than 50% | tendency for segment data located within the two upper quartiles: potential for substantial maximization of positive shading attributes | |||||||||||||||||
| from 26 to 50% | tendency for segment data located within the intermediate-upper quartile: potential for relative maximization of positive shading attributes | |||||||||||||||||
| from 10 to 25% | tendency for remaining segment data in the lower decile located within the lower quartile: potential for relative minimization of positive shading attributes | |||||||||||||||||
| less than 10% | tendency for segment data located within the lower decil: potential for substantial minimization of positive shading attributes | |||||||||||||||||
| Socio-Political Variables | ||||||||||||||||||
| Institutional instruments/tactical tolls | Maintenance of public spaces: condition of conservation of streets (especially sidewalks) and other public components, revealing physical–territorial order/disorder (average percentage) | Measure | 89% | 8% | 32% | 2% | 14% | 3% | ||||||||||
| Justification | high proportion of sidewalks in precarious maintenance condition | low proportion of sidewalks in precarious maintenance condition | median proportion of sidewalks in precarious maintenance condition | low proportion of sidewalks in precarious maintenance condition | relatively low proportion of sidewalks in precarious maintenance condition | low proportion of sidewalks in precarious maintenance condition | ||||||||||||
 |  |  |  |  |  | |||||||||||||
| Initial class | 1 | 4 | 2 | 4 | 3 | 4 | ||||||||||||
| Promoter or reducer | ||||||||||||||||||
| Final class | 1 | 4 | 2.5 | 2 | 4 | 3.0 | 3 | 4 | 3.5 | |||||||||
| less than 10% | tendency for segment data located within the lower decile: indicative of smaller degree of maintenance precariousness in public spaces | |||||||||||||||||
| from 10% to 25% | tendency for remaining segment data in the lower decile located within the low quartile: indicative of lower-median degree of maintenance precariousness in public spaces | |||||||||||||||||
| from 26% to 50% | tendency for segment data located within the intermediate-low quartile: indicative of median degree of maintenance precariousness in public spaces | |||||||||||||||||
| more than 50% | tendency for segment data located within the two upper quartiles: indicative of greater degree of maintenance precariousness in public spaces | |||||||||||||||||
| Monitoring of public and private spaces: existence of permanent personnel and control devices in places of common and private use (average number) | Measure | Northern Segment | - | - | - | - | - | |||||||||||
| Justification | absence of permanent personnel and control devices | absence of permanent personnel and control devices | absence of permanent personnel and control devices | absence of permanent personnel and control devices | absence of permanent personnel and control devices | absence of permanent personnel and control devices | ||||||||||||
| Initial class | 1 | 1 | 1 | 1 | 1 | 1 | ||||||||||||
| Promoter or reducer | application of promoter due to the potential for natural surveillance through the presence of people | |||||||||||||||||
 | ||||||||||||||||||
| Final class | 1 | 1 | 1.0 | 2 | 1 | 1.5 | 1 | 1 | 1.0 | |||||||||
| more than 4 resources per 50 m | greater availability of monitoring resources across public and private spaces along the segment: indicative of more significant spatial control | |||||||||||||||||
| from 3 to 4 resources per 50 m | medium availability of monitoring resources across public and private spaces along the segment: indicative of significant spatial control | |||||||||||||||||
| from 1 to 2 resources per 50 m | lower availability of monitoring resources across public and private spaces along the segment: indicative of insignificant spatial control | |||||||||||||||||
| nonexistence of resources | absence of monitoring resources across public and private spaces along the segment: indicative of lack of spatial control | |||||||||||||||||
| LEGEND | ||||||||||||||||||
| high quality class | medium-high quality class | medium-low quality class | low quality class | |||||||||||||||
References
- Guzmán, G.; López-Ramírez, B.; Lópes-Ruiz, M. Chapter 14–Definition of public safety policies based on the characterization of criminal events using volunteered geographic information, case study: Mexico. In Smart Cities: Issues and Challenges: Mapping Political, Social, and Economic Risks and Threats; Visvizi, A., Lytras, M.D., Eds.; Elsevier: Amsterdam, The Netherlands, 2019; pp. 241–262. ISBN 978-0128166390. [Google Scholar]
- Khaliji, M.A.; Ghalehteimouri, K.J. Urban security challenges in major cities, with a specific emphasis on privacy management in the metropolises. Discov. Environ. 2024, 2, 74. [Google Scholar] [CrossRef]
- Cai, Y.; Chen, A.; Tang, Z.; Wang, Y.; Song, Y. Advancing urban management: Integrating GIS, LLMs, and media narratives into environmental and socio-economic analyses for enhanced urban crime analysis. PLoS ONE 2025, 20, e0331788. [Google Scholar] [CrossRef] [PubMed]
- Wang, Y.; Liu, D.; Gan, J.; Lai, X. A novel analytical framework for modeling crime spatial patterns using composite urban environmental factors. ISPRS Int. J. Geo-Inf. 2026, 15, 55. [Google Scholar] [CrossRef]
- Jubaer, S.M.O.F.; Hassan, M.N. The Routine Activities and Rational Choice Theory: A criminologist reflection. Eur. J. Sociol. 2021, 2, 19–29. [Google Scholar] [CrossRef]
- Felson, M.; Cohen, L.E. Human ecology and crime: A routine activity approach. Hum. Ecol. 1980, 8, 389–406. [Google Scholar] [CrossRef]
- Hollis, M.E.; Felson, M.; Welsh, B. The capable guardian in routine activities theory: A theoretical and conceptual reappraisal. Crime. Prev. Community Saf. 2013, 15, 65–79. [Google Scholar] [CrossRef]
- Wikström, P.-O.H. Routine Activity Theories; Oxford University Press: Oxford, UK, 2010; ISBN 978-0199805761. [Google Scholar]
- Jacobs, J. The Death and Life of Great American Cities; Bodley Head: London, UK, 2020; ISBN 978-1847926180. [Google Scholar]
- Wilcox, P.; Cullen, F.T. Situational opportunity theories of crime. Annu. Rev. Criminol. 2018, 1, 123–148. [Google Scholar] [CrossRef]
- Becker, G.S. Crime and punishment: An economic approach. J. Political Econ. 1968, 76, 169–217. [Google Scholar] [CrossRef] [PubMed]
- Bernburg, J.G. Labeling Theory. In Handbook of Crime and Deviance, 2nd ed.; Krohn, M.D., Hendrix, N., Hall, G.P., Lizotte, A.J., Eds.; Springer Nature: Cham, Switzerland, 2019; pp. 179–196. ISBN 978-1441902443. [Google Scholar]
- Besemer, S.; Farrington, D.P.; Bijleveld, C.C.J.H. Labeling and intergenerational transmission of crime: The interaction between criminal justice intervention and a convicted parent. PLoS ONE 2017, 8, e0172419. [Google Scholar] [CrossRef] [PubMed]
- Sigrist, F.C.; Marin, S.R. Morality, Justice, and Economic Theory of Crime: A positive-normative analysis. Mod. Econ. 2022, 13, 1–22. [Google Scholar] [CrossRef]
- Cozens, P.; Love, T. A review and current status of Crime Prevention through Environmental Design (CPTED). J. Plan. Lit. 2015, 30, 393–412. [Google Scholar] [CrossRef]
- Jeffery, C.R. Criminal behavior and the physical environment: A perspective. Am. Behav. Sci. 1976, 20, 149–174. [Google Scholar] [CrossRef]
- Jeffery, C.R. Crime Prevention Through Environmental Design, 2nd ed.; Sage: Thousand Oaks, CA, USA, 1977; ISBN 978-0803907058. [Google Scholar]
- Cornish, D.B.; Clarke, R.V. Opportunities, precipitators, and criminal decisions: A reply to wortley’s critique of situational crime prevention. In Crime Prevention Studies V.16; Clarke, R.V., Ed.; Criminal Justice Press: New York, NY, USA, 2003; pp. 41–96. ISBN 978-1881798163. [Google Scholar]
- Lynch, M.J.; Barrett, K.L. Social Disorganization Theory. In The Routledge Companion to Criminological Theory and Concepts; Brisman, A., Carrabine, E., South, N., Eds.; Routledge: Oxfordshire, UK, 2017; pp. 100–104. ISBN 978-1138819009. [Google Scholar]
- Shaw, C.R.; McKay, H.D. Juvenile delinquency and urban areas: A study of rates of delinquency in relation to differential characteristics of local communities in American cities. In Classics in Environmental Criminology; Andresen, M.A., Brantingham, P.J., Kinney, B., Eds.; University of Chicago Press: Chicago, IL, USA, 1942; pp. 140–169. ISBN 978-0429245879. [Google Scholar]
- Cohen, L.E.; Felson, M. Social change and crime rate trends: A routine activity approach. Am. Sociol. Rev. 1979, 44, 588–608. [Google Scholar] [CrossRef] [PubMed]
- Saraiva, M.; Matijošaitienė, I.; Mishra, S.; Amante, A. Crime prediction and monitoring in Porto, Portugal, using machine learning, spatial and text analytics. ISPRS–Int. J. Geo-Inf. 2022, 11, 400. [Google Scholar] [CrossRef]
- Wikström, P.-O.H.; Kroneberg, C. Analytic criminology: Mechanisms and methods in the explanation of crime and its causes. Annu. Rev. Criminol. 2022, 5, 179–203. [Google Scholar] [CrossRef]
- Brantingham, P.J.; Brantingham, P.L. Environmental criminology. In Crime and Justice: An Annual Review of Research, V.1; Tonry, M., Morris, N., Eds.; University of Chicago Press: Chicago, IL, USA, 1979; pp. 1–45. ISBN 978-0226539553. [Google Scholar]
- Brantingham, P.J.; Brantingham, P.L. Environmental criminology. In Encyclopedia of Victimology and Crime Prevention, V.1; Fisher, B.S., Lab, S.P., Eds.; Sage: Thousand Oaks, CA, USA, 2010; pp. 239–246. ISBN 978-1412960472. [Google Scholar]
- Feng, J.; Hou, H. Review of research on urban social space and sustainable development. Sustainability 2023, 15, 16130. [Google Scholar] [CrossRef]
- Sahharon, H.; Bolong, J.; Omar, S.Z. Exploring the evolution of social cohesion: Interdisciplinary theories and their impact. Forum Komun. 2023, 18, 58–73. [Google Scholar] [CrossRef] [PubMed]
- Sampson, R.J.; Raudenbush, S.W.; Earls, F. Neighborhoods and violent crime: A multilevel study of collective efficacy. Science 1997, 277, 918–924. [Google Scholar] [CrossRef] [PubMed]
- Druck, D. The rise, fall, and rebirth of territorial defense. Scand. J. Mil. Stud. 2023, 6, 69–85. [Google Scholar] [CrossRef]
- Taylor, R.B.; Gottfredson, S. Environmental design, crime, and prevention: An examination of community dynamics. Crime. Justice 1986, 8, 387–416. Available online: http://www.jstor.org/stable/1147433 (accessed on 31 May 2026). [CrossRef] [PubMed]
- Amirusholihin, J.K.; Rahadiantino, L.; Nilasari, A.; Rakhmawati, D.Y.; Fatoni, F. How population density and welfare affect crime rates: A study in East Java Province, Indonesia. Rev. Gest. Soc. E Ambient. 2024, 18, e06224. [Google Scholar] [CrossRef]
- Whyte, W.H. The Social Life of Small Urban Spaces, 8th ed.; Project for Public Spaces: New York, NY, USA, 2001; ISBN 978-0970632418. [Google Scholar]
- Widya Putra, D.; Salim, W.A.; Indradjati, P.N.; Prilandita, N. Understanding the position of urban spatial configuration on the feeling of insecurity from crime in public spaces. Front. Built Environ. 2023, 9, 1114968. [Google Scholar] [CrossRef]
- Newman, O. Defensible Space: Crime Prevention Through Urban Design; Macmillan: New York, NY, USA, 1972; ISBN 978-0020007500. [Google Scholar]
- Duman, Ü.; Asilsoy, B. Developing an evidence-based framework of universal design in the context of sustainable urban planning in Northern Nicosia. Sustainability 2022, 14, 13377. [Google Scholar] [CrossRef]
- Mace, R.L. Universal design, barrier free environments for everyone. Des. West 1985, 33, 147–152. Available online: https://www.usmodernist.org/DW/DW-1985-11.pdf (accessed on 31 May 2026).
- Crowe, T.D. CPTED–Crime Prevention Through Environmental Design: Applications of Architectural Design and Space Management Concepts, 3rd ed.; Butterworth-Heinemann: Oxford, UK, 2013; ISBN 978-0124116351. [Google Scholar]
- Newman, O. Creating Defensible Space, 2nd ed.; US Department of Housing and Urban Development, Office of Policy Development and Research: Washington, DC, USA, 1996; ISBN 978-0788145285.
- Marzukhi, M.A.; Afiq, M.A.; Ahmad Zaki, S.; Ling, O.H.L. An observational study of defensible space in the neighbourhood park. IOP Conf. Ser. Earth Environ. Sci. 2018, 117, 012016. [Google Scholar] [CrossRef]
- García-Tejeda, E.; Fondevila, G. Policing social disorder and Broken Windows Theory: Spatial evidence from the “Franeleros” experience. ISPRS Int. J. Geo-Inf. 2023, 12, 449. [Google Scholar] [CrossRef]
- Turanovic, J.J.; Pratt, T.C. Thinking About Victimization: Context and Consequences, 2nd ed.; Routledge: Oxfordshire, UK, 2023; ISBN 978-1032216874. [Google Scholar]
- Ancel, M. Social Defence: A Modern Approach to Criminal Problems, 3rd ed.; Routledge: Oxfordshire, UK, 2013; ISBN 978-0415863933. [Google Scholar]
- Heath-Kelly, C.; Shanaáh, Š. The long history of prevention: Social defence, security and anticipating future crimes in the era of ‘penal welfarism’. Theor. Criminol. 2022, 26, 357–376. [Google Scholar] [CrossRef]
- Burt, C.H. Self-control and crime: Beyond Gottfredson & Hirschi’s theory. Annu. Rev. Criminol. 2020, 3, 43–73. [Google Scholar] [CrossRef] [PubMed]
- Costello, B. Social Control Theory. In Preventing Crime and Violence (Advances in Prevention Science); Teasdale, B., Bradley, M.S., Eds.; Springer: Cham, Switzerland, 2017; pp. 31–41. ISBN 978-3319829890. [Google Scholar]
- Fisher, D.; Abel, M.N.; McCann, W.S. Differentiating violent and non-violent extremists: Lessons from 70 years of Social Control Theory. J. Deradicalization 2023, 34, 28–49. Available online: https://journal-derad.com/index.php/jd/article/view/707 (accessed on 31 May 2026).
- Gottfredson, M.R.; Hirschi, T. A General Theory of Crime; Stanford University Press: Stanford, CA, USA, 1990; ISBN 978-0804717748. [Google Scholar]
- Hirschi, T. Causes of Delinquency, 2nd ed.; Routledge: Oxfordshire, UK, 2017; ISBN 978-1315081649. [Google Scholar]
- Senna, I.; Iglesias, F.; Matsunaga, L.H. Measuring the effects of Crime Prevention Through Environmental Design (CPTED) on fear of crime in public spaces. Crime. Prev. Community Saf. 2025, 27, 1–17. [Google Scholar] [CrossRef]
- Bergquist, M.; Helferich, M.; Thiel, M.; Hellquist, S.B.; Skipor, S.; Ubianuju, W.; Ejelöv, E. Are broken windows spreading? Evaluating the robustness and strengths of the cross-norm effect using replications and a meta-analysis. J. Environ. Psychol. 2023, 88, 102027. [Google Scholar] [CrossRef]
- Kelling, G.L.; Coles, C.M. Fixing Broken Windows: Restoring Order and Reducing Crime in Our Communities, 2nd ed.; Free: New York, NY, USA, 1996; ISBN 978-0684837383. [Google Scholar]
- Kelling, G.L.; Wilson, J.Q. Broken windows: The police and neighborhood security. Atl. Mon. 1982, 249, 29–38. Available online: https://www.theatlantic.com/magazine/archive/1982/03/broken-windows/304465/ (accessed on 31 May 2026).
- Cohen, W. Peter Drucker’s Way to the Top: Lessons for Reaching Your Life’s Goals; LID: London, UK, 2018; ISBN 978-1911498759. [Google Scholar]
- Drucker, P.F. Managing for Results; William Heinemann Ltd.: London, UK, 1964; ISBN 978-0434209521. [Google Scholar]
- Santos, R.B. Crime Analysis with Crime Mapping, 5th ed.; Sage: Thousand Oaks, CA, USA, 2022; ISBN 978-1452202716. [Google Scholar]
- Marques, E. Notes on social conditions, rights, and violence in Brazilian cities. J. Iber. Lat. Am. Res. 2021, 27, 21–36. [Google Scholar] [CrossRef]
- Ventorim, F.C.; Netto, V.M. The hidden connections of urban crime: A network analysis of victims, crime types, and locations in Rio de Janeiro. Urban Sci. 2024, 8, 72. [Google Scholar] [CrossRef]
- Cerqueira, D.; Bueno, S.; de Lima, R.S.; de Oliveira Accioly Lins, G.; Coelho, D.S.C.; Moura, L.; Armstrong, K.C.; Guedes, E.; Marques, D.; Camarano, A.A.; et al. Atlas da Violência: Fórum Brasileiro de Segurança Pública–FBS; Instituto de Pesquisa Econômica Aplicada–IPEA: Brasília, Brazil, 2025. Available online: https://forumseguranca.org.br/wp-content/uploads/2025/05/atlas-violencia-2025.pdf (accessed on 19 March 2026).
- Presidência da República Casa Civil Subchefia Para Assuntos Jurídicos. Decreto-Lei N° 2.848, de 07 de Dezembro de 1940. Código Penal. Diário Oficial [da] República Federativa do Brasil, Poder Executivo, Brasília, DF, BR, 31 dez. 1940. Available online: http://www.planalto.gov.br/ccivil_03/decreto-lei/del2848.htm (accessed on 19 March 2026).
- OSP-GO–Observatório de Segurança Pública do Estado de Goiás. Dados Criminais de Itumbiara; Institutional ed.: Goiânia, GO, BR, 2018–2023. [Google Scholar]
- IBGE–Instituto Brasileiro de Geografia e Estatística. Cidades: Itumbiara, Goiás. 2026. Available online: https://cidades.ibge.gov.br/brasil/go/itumbiara/panorama (accessed on 19 March 2026).
- PMI–Prefeitura Municipal de Itumbiara. Portal Geo Web Itumbiara. 2026. Available online: https://geoitumbiara.com.br/ (accessed on 19 March 2026).
- Google Earth. Orthogonal Aerial Images: Itumbiara, Goiás, Brazil. 2023. Available online: https://earth.google.com/web/search/Itumbiara,+Goi%C3%A1s/@-18.4095,-49.2159,10000a,35y,0h,0t,0r (accessed on 31 December 2023).
- IBGE; Instituto Brasileiro de Geografia e Estatística. Portal de Mapas. 2026. Available online: https://portaldemapas.ibge.gov.br/portal.php#homepage (accessed on 19 March 2026).
- Knapp, H. Introductory Statistics Using R: An Easy Approach, 2nd ed.; SAGE: Thousand Oaks, CA, USA, 2025; ISBN 978-1071929001. [Google Scholar]
- R Core Team. R: A Language and Environment for Statistical Computing; R Foundation for Statistical Computing: Vienna, Austria, 2026; Available online: https://cran.r-project.org/doc/manuals/r-release/fullrefman.pdf (accessed on 17 July 2026).
- Grekousis, G. Spatial Analysis Methods and Practice; Cambridge University Press: Cambridge, MA, USA, 2020; ISBN 978-1108498982. [Google Scholar]
- Pallant, J. SPSS Survival Manual: A Step by Step Guide to Data Analysis Using IBM SPSS, 7th ed.; Routledge: Oxfordshire, UK, 2020; ISBN 978-1760875534. [Google Scholar]
- Field, A. Discovering Statistics Using IBM SPSS Statistics, 5th ed.; Sage: Thousand Oaks, CA, USA, 2018; ISBN 978-1526419521. [Google Scholar]
- Lima, W.C.S.; Hardt, L.P.A.; Hardt, C. Unveiling dynamics of contemporary cities: The influences of urban form on the potential for the socio-spatial vitality of streets. Glob. J. Hum. Soc. Sci.–C 2023, 23, 63–88. [Google Scholar] [CrossRef]
- Santos, P.M.; Caccia, L.S.; Samios, A.B.; Ferreira, L.Z. The 8 Principles of Sidewalks: Building More Active Cities, 2nd ed.; WRI–World Resources Institute: Santarém, Brazil, 2019; ISBN 978-8582181529. [Google Scholar]
- Gehl, J.; Rogers, L. Cities for People: Scaling Urban Design to Human Dimensions; Island: New York, NY, USA, 2010; ISBN 978-1597265737. [Google Scholar]
- ABNT–Associação Brasileira de Normas Técnicas. NBR 5101: Iluminação Pública–Procedimento; ABNT: Rio de Janeiro, Brazil, 2018; ISBN 978-8507077435. [Google Scholar]
- Kirchmaier, T.; Langella, M.; Manning, A. Commuting for crime. Econ. J. 2024, 134, 1173–1198. [Google Scholar] [CrossRef]
- Luo, X.I. Examining crime trajectories at micro geographic locations across varied urban contexts in the U.S. J. Quant. Criminol. 2026; epub ahead of printing. [CrossRef]
- Lupton, D. COVID futures: Social imaginaries of post-pandemic lives in Australia. Futures 2024, 164, 103470. [Google Scholar] [CrossRef]
- Park, W. Climate and Average Weather Year Round in Itumbiara Goiás, Brazil. 2026. Available online: https://weatherspark.com/y/29959/Average-Weather-in-Itumbiara-Goi%C3%A1s-Brazil-Year-Round (accessed on 19 March 2026).
- Gupta, J. Does weather make people kill each other: Correlation between weather variables and crime in multiple cities. Available online: https://read-me.org/crime02/2024/9/17/does-weather-make-people-kill-each-other-correlation-between-weather-variables-and-crime-in-multiple-cities (accessed on 31 May 2026).
- Wüllenweber, S.; Burrell, A. The crime and the place: Robbery in the night-time economy. J. Investig. Psychol. Offender Profiling 2024, 21, 3–19. [Google Scholar] [CrossRef]
- Erturk, E.; Raynham, P.; Teji, J.U. Exploring the effects of light and dark on crime in London. Int. J. Geo-Inf. 2024, 13, 182. [Google Scholar] [CrossRef]
- Google Maps. Oblique Images at the Observer’s Level: Itumbiara Goiás, Brazil. 2023. Available online: https://www.google.com/maps/place/Itumbiara+-+GO/@-18.4805202,-49.870343,76442m/data=!3m1!1e3!4m6!3m5!1s0x94a10d6489383995:0xa0d3f8f904066d35!8m2!3d-18.4167106!4d-49.2170958!16zL20vMDl4bmpq?entry=ttu&g_ep=EgoyMDI2MDYxMC4wIKXMDSoASAFQAw%3D%3D (accessed on 31 December 2023).
- Cornish, D.B.; Clarke, R.V. Introduction. In The Reasoning Criminal: Rational Choice Perspectives on Offending; Cornish, D.B., Clarke, R.V., Eds.; Routledge: Oxfordshire, UK, 2014; pp. 1–16. ISBN 978-1315134482. [Google Scholar]
- Gomes, N.; Semin, G.R. Mapping human vigilance: The influence of conspecifics. Evol. Hum. Behav. 2020, 41, 69–75. [Google Scholar] [CrossRef]
- Li, H.; Deng, Y.; Chang, J. Research on constructing a safety assessment model for the ‘environment-psychology’ space in urban villages based on CPTED Theory. J. Asian Archit. Build. Eng. 2024, 24, 1945–1964. [Google Scholar] [CrossRef]
- Pereira, G.; Israel, C.; Firmino, R.; Kramer, H.; Abad, J. Building a digital wall: The political economy of smart surveillance in Curitiba, Brazil. Globalizations 2025, 23, 592–612. [Google Scholar] [CrossRef]
- Cauvain, J.; Bruzzese, A.; Karvonen, A. Streets as platforms of public life. Urban Plan. 2026, 11, 1–7. [Google Scholar] [CrossRef]
- He, Z.; Meng, W.; Yao, J.; Gong, Y.; Wu, L.; Tao, L. Measuring the causal effect of urban environments on crime with street view images and points of interest. Cities 2026, 168, 106399. [Google Scholar] [CrossRef]
- Smith, T.B.; Mao, R.; Korotchenko, S.; Krohn, M.D. Partners in criminology: Machine learning and network science reveal missed opportunities and inequalities in the study of crime. J. Quant. Criminol. 2023, 40, 421–443. [Google Scholar] [CrossRef]
- Abujder Ochoa, W.A.; Iarozinski Neto, A.; Vitorio Junior, P.C.; Calabokis, O.P.; Ballesteros-Ballesteros, V. The Theory of Complexity and Sustainable Urban Development: A Systematic Literature Review. Sustainability 2025, 17, 3. [Google Scholar] [CrossRef]


| Variables | Parameters | Descriptions and Justifications |
|---|---|---|
| Socio-Behavioral | ||
| Evasion | Escape routes | Short blocks unfavorable to police pursuit (due to the proximity of street corners) and other spatial elements structuring exit and dispersal paths for offenders (common in parks, squares, and similar places), which facilitate their withdrawal from the field of vision and therefore restrict their apprehension. |
| Concealment | Physical barriers | Spatial components that form physical or visual hiding places for offenders, enabling surprise attacks without giving victims time to react. |
| Shielding | Visual obstructions | |
| Socio-Morphological | ||
| Dimensions | Street scale | Proportions of sidewalks that optimize pedestrian circulation, configured as spatial guardians. |
| Urban scale | Proportions of built elements inviting the attraction of people and their spatial perception for natural surveillance. | |
| Densities | Constructive/population densification | Higher levels of residential building occupation generally correspondent to a greater number of users in outdoor spaces surrounding constructions. |
| Diversity of uses | Wider range of land uses that distinguishes distinct groups of users and enhances urban vitality and public safety. | |
| Accessibilities | Relations between public and private spaces | Potential for access and circulation associated with the movement of people, fostering socio-spatial interactions. |
| Spatial intervisibility | Facades and enclosures with transparent openings that induce interactions and visual access, enabling spatial monitoring at the observer’s eye level. | |
| Attractiveness | Local references | Presence of distinctive elements (nodal points and/or landmarks) that foster recognition and attract individuals and groups. |
| Public lighting | Spacing of permanent nighttime light sources to ensure adequate distribution of luminosity in public spaces. | |
| Permanencies | Arrangement of seating and/or stopping furniture | Potential for spatial appropriation by users due to furniture elements. |
| Shading for seating and/or stopping | Potential for environmental comfort that encourages users to remain in the location. | |
| Socio-Political | ||
| Institutional instruments/ tactical tools | Maintenance of public spaces | Condition of conservation of streets (especially sidewalks) and other public components, revealing physical–territorial order/disorder. |
| Monitoring of public and private spaces | Existence of permanent personnel and control devices in places of common and private use. | |
| Variables/ Parameters | Classes (Unit of Analysis: Length of the Street Segment) | Possible Reducers | Possible Promoters | ||||
|---|---|---|---|---|---|---|---|
| Socio-Behavioral | |||||||
| Evasion | Escape routes: average percentage | less than 10% | high quality | tendency for segment data located within the lower decile: potential for substantial minimization of adverse escape routes characteristics | Short blocks and other elements facilitating exit and dispersion (e.g., parks, squares, and similar spaces) | Long blocks and possible barriers to exit and dispersion | |
| from 10 to 25% | medium-high quality | tendency for remaining segment data in the lower decile located within the lower quartile: potential for relative minimization of adverse escape routes characteristics | |||||
| from 26 to 50% | medium-low quality | tendency for segment data located within the intermediate-low quartile: potential for relative maximization of adverse escape routes characteristics | |||||
| more than 50% | low quality | tendency for segment data located within the two upper quartiles: potential for substantial maximization of adverse escape routes characteristics | |||||
| Concealment | Physical barriers: average percentage | less than 10% | high quality | tendency for segment data located within the lower decile: potential for substantial minimization of adverse physical barriers characteristics | Large dimensions of physical barriers (including shrubbery and similar elements) | Absence of physical barriers | |
| from 10 to 25% | medium-high quality | tendency for remaining segment data in the lower decile located within the lower quartile: potential for relative minimization of adverse physical barriers characteristics | |||||
| from 26 to 50% | medium-low quality | tendency for segment data located within the intermediate-low quartile: potential for relative maximization of adverse physical barriers characteristics | |||||
| more than 50% | low quality | tendency for segment data located within the two upper quartiles: potential for substantial maximization of adverse physical barriers characteristics | |||||
| Shielding | Visual obstructions: average percentage | less than 10% | high quality | tendency for segment data located within the lower decile: potential for substantial minimization of adverse visual obstructions characteristics | Large dimensions of visual obstructions (including shrubbery and similar elements) | Absence of visual obstructions | |
| from 10 to 25% | medium-high quality | tendency for remaining segment data in the lower decile located within the lower quartile: potential for relative minimization of adverse visual obstructions characteristics | |||||
| from 26 to 50% | medium-low quality | tendency for segment data located within the intermediate-low quartile: potential for relative maximization of adverse visual obstructions characteristics | |||||
| more than 50% | low quality | tendency for segment data located within the two upper quartiles: potential for substantial maximization of adverse visual obstructions characteristics | |||||
| Socio-Morphological | |||||||
| Dimensions | Street scale: average proportion (sidewalk width/roadway width) 1 | more than 1/1 (more than 1.00) | high quality | framing of segment proportional average between sidewalk and roadway widths with potential for significant maximization of positive street-scale attributes | Absence of sidewalks or pavement with obstructions to pedestrian passage | Pavement with a higher proportion of sidewalks without obstructions to pedestrian passage or expansion of sidewalk into open areas | |
| from 1/1 to 1/2 (from 1.00 to 0.50) | medium-high quality | framing of segment proportional average between sidewalk and roadway widths with potential for relative maximization of positive street-scale attributes | |||||
| from 1/2 to 1/4 (from 0.49 to 0.25) | medium-low quality | framing of segment proportional average between sidewalk and roadway widths with potential for relative minimization of positive street-scale attributes | |||||
| less than 1/4 (less than 0.25) | low quality | framing of segment proportional average between sidewalk and roadway widths with potential for substantial minimization of positive street-scale attributes | |||||
| Urban scale: average proportion (block length/higher building height) 2 | more than 1/1 (more than 1.00) | high quality | framing of segment proportional average between block length and higher building height with potential for significant maximization of positive urban scale attributes | Components of human scale mismatch | Components of human scale adjustment | ||
| from 1/1 to 1/2 (from 1.00 to 0.50) | medium-high quality | framing of segment proportional average between block length and higher building height s with potential for relative maximization of positive urban scale attributes | |||||
| from 1/2 to 1/4 (from 0.49 to 0.25) | medium-low quality | framing of segment proportional average between block length and higher building height with potential for relative minimization of positive urban scale attributes | |||||
| less than 1/4 (less than 0.25) | low quality | framing of segment proportional average between block length and higher building height with potential for substantial minimization of positive urban scale attributes | |||||
| Densities | Constructive/ population densification: average constructive population density 3 | more than 36 inh./ha | high quality | framing of segment average constructive population density above twice the city mean: potential for significant expansion of natural surveillance | Absence of residential buildings or vacant lots | Uses related to large audiences | |
| from 24 inh./ha to 38 inh./ha | medium-high quality | framing of segment average constructive population density between city mean and twice this value: potential for relative expansion of natural surveillance | |||||
| from 12 inh./ha to 24 inh./ha | medium-low quality | framing of segment average constructive population density between city mean and half this value: potential for relative reduction in natural surveillance | |||||
| less than 12 inh./ha | low quality | framing of segment average constructive population density below half the city mean: potential for significant reduction in natural surveillance e | |||||
| Diversity of uses: degree of land use diversity | more than 3 uses | high quality | greater degree of segment land use diversity: potential for significant urban vitality | Vacant lots | Diversified uses in the same location (e.g., residential, commercial, institutional, services, leisure, and others) | ||
| 3 uses | medium-high quality | median degree of segment land use diversity: potential for relative urban vitality | |||||
| 2 uses | medium-low quality | smaller degree of segment land use diversity: potential for reduced urban vitality | |||||
| 1 use | low quality | absence of segment land use diversity: potential for very reduced urban vitality | |||||
| Accessibilities | Relations between public and private spaces: average percentage (free spatial access) | more than 50% | high quality | tendency for segment data located within the two upper quartiles: potential for substantial maximization of positive relations between public and private spaces | Marked barriers between public and private spaces, including controlled accesses | Projections of private uses over free-access setbacks or over public spaces | |
| from 26 to 50% | medium-high quality | tendency for segment data located within the intermediate-upper quartile: potential for relative maximization of positive relations between public and private spaces | |||||
| from 10 to 25% | medium-low quality | tendency for remaining segment data in the lower decile located within the lower quartile: potential for relative minimization of positive relations between public and private spaces | |||||
| less than 10% | low quality | tendency for segment data located within the lower decil: potential for substantial minimization of positive relations between public and private spaces | |||||
| Spatial intervisibility average percentage (openings with transparency) | more than 50% | high quality | tendency for segment data located within the two upper quartiles: potential for substantial maximization of positive spatial intervisibility attributes | High proportion of openings above the observer’s eye level | High proportion of active facades at ground level | ||
| from 26 to 50% | medium-high quality | tendency for segment data located within the intermediate-upper quartile: potential for relative maximization of positive spatial intervisibility attributes | |||||
| from 10 to 25% | medium-low quality | tendency for remaining segment data in the lower decile located within the lower quartile: potential for relative minimization of positive r spatial intervisibility attributes | |||||
| less than 10% | low quality | tendency for segment data located within the lower decil: potential for substantial minimization of positive r spatial intervisibility attributes | |||||
| Attractiveness | Local references: degree of presence | more than 3 references | high quality | greater degree of segment local references presence: potential for significant local recognition and attractiveness | References without potential to attract large audiences | References with potential to attract large audiences | |
| 3 references | medium-high quality | median degree of segment local references presence: potential for relative local recognition and attractiveness | |||||
| 2 references | medium-low quality | lower-median degree of segment local references presence: potential for reduced local recognition and attractiveness | |||||
| 1 or absence of references | low quality | smaller degree of segment local references presence or their absence: potential for very reduced local recognition and attractiveness | |||||
| Public lighting: average spacing (between lamp posts) 4 | less than 20 m | high quality | smaller spacing of permanent nighttime light sources in the segment: potential for significant maximization of adequate luminosity distribution in public spaces | Absence of luminaires or low lighting efficiency | Lowered luminaires for pedestrian circulation or high lighting efficiency | ||
| from 20 to 35 m | medium-high quality | lower-medium spacing of permanent nighttime light sources in the segment: potential for relative maximization of adequate luminosity distribution in public spaces | |||||
| from 36 to 50 m | medium-low quality | medium spacing of permanent nighttime light sources in the segment: potential for relative minimization of adequate luminosity distribution in public spaces | |||||
| more than 50 m | low quality | greater spacing of permanent nighttime light sources in the segment: potential for significant minimization of adequate luminosity distribution in public spaces | |||||
| Permanencies | Arrangement of seating and/or stopping furniture: average percentage | more than 50% | high quality | tendency for segment data located within the two upper quartiles: potential for substantial maximization of positive furniture arrangement attributes | Absence of benches and similar elements or in an exceptional state of discomfort (e.g., excessive spacing or insufficient quantity) | Benches and similar elements in an exceptional state of comfort and with universal accessibility solutions | |
| from 26 to 50% | medium-high quality | tendency for segment data located within the intermediate-upper quartile: potential for relative maximization of positive furniture arrangement attributes | |||||
| from 10 to 25% | medium-low quality | tendency for remaining segment data in the lower decile located within the lower quartile: potential for relative minimization of positive furniture arrangement attributes | |||||
| less than 10% | low quality | tendency for segment data located within the lower decil: potential for substantial minimization of positive furniture arrangement attributes | |||||
| Shading for seating and/or stopping: average percentage | more than 50% | high quality | tendency for segment data located within the two upper quartiles: potential for substantial maximization of positive shading attributes | Absence of shading components or in an exceptional state of discomfort | Shading components in an exceptional state of comfort | ||
| from 26 to 50% | medium-high quality | tendency for segment data located within the intermediate-upper quartile: potential for relative maximization of positive shading attributes | |||||
| from 10 to 25% | medium-low quality | tendency for remaining segment data in the lower decile located within the lower quartile: potential for relative minimization of positive shading attributes | |||||
| less than 10% | low quality | tendency for segment data located within the lower decil: potential for substantial minimization of positive shading attributes | |||||
| Socio-political | |||||||
| Institutional instruments/tactical tools | Maintenance of public spaces: average percentage (deteriorated spaces) | less than 10% | high quality | tendency for segment data located within the lower decile: indicative of smaller degree of maintenance precariousness in public spaces | Exceptionally negative state of conservation, inducing physical-social disorder | Exceptionally positive state of conservation, inducing physical-social order | |
| from 10 to 25% | medium-high quality | tendency for remaining segment data in the lower decile located within the low quartile: indicative of lower-median degree of maintenance precariousness in public spaces | |||||
| from 26 to 50% | medium-low quality | tendency for segment data located within the intermediate-low quartile: indicative of median degree of maintenance precariousness in public spaces | |||||
| more than 50% | low quality | tendency for segment data located within the two upper quartiles: indicative of greater degree of maintenance precariousness in public spaces | |||||
| Monitoring of public and private spaces: average number of resources (per 50 m) 5 | more than 4 resources | high quality | greater availability of monitoring resources across public and private spaces along the segment: indicative of more significant spatial control | Absence of cameras or orientation of most cameras toward the interior of lots, and without constant police presence | Orientation of most cameras toward public spaces and with constant police presence | ||
| from 3 to 4 resources | medium-high quality | medium availability of monitoring resources across public and private spaces along the segment: indicative of significant spatial control | |||||
| from 1 to 2 resources | medium-low quality | lower availability of monitoring resources across public and private spaces along the segment: indicative of insignificant spatial control | |||||
| nonexistence of resources | low quality | absence of monitoring resources across public and private spaces along the segment: indicative of lack of spatial control | |||||
| Districts | Thefts | Total | Robberies | Total | Grand Total | |||||||||||||||||
|---|---|---|---|---|---|---|---|---|---|---|---|---|---|---|---|---|---|---|---|---|---|---|
| Before | Parallel | After | Before | Parallel | After | |||||||||||||||||
| 2018 | 2019 | Subtotal | 2020 | 2021 | Subtotal | 2022 | 2023 | Subtotal | 2018 | 2019 | Subtotal | 2020 | 2021 | Subtotal | 2022 | 2023 | Subtotal | |||||
| 1 | Alto da Boa vista | 62 | 33 | 95 | 43 | 19 | 62 | 29 | 43 | 72 | 229 | 22 | 24 | 46 | 9 | 9 | 18 | 9 | 5 | 14 | 78 | 307 |
| 23 | Jardim América | 34 | 33 | 67 | 38 | 19 | 57 | 22 | 27 | 49 | 173 | 19 | 26 | 45 | 5 | 6 | 11 | 8 | 0 | 8 | 64 | 237 |
| 50 | Setor Afonso Pena | 86 | 93 | 179 | 88 | 87 | 175 | 114 | 75 | 189 | 543 | 37 | 34 | 71 | 21 | 27 | 48 | 14 | 10 | 24 | 143 | 686 |
| 54 | Setor Central | 346 | 252 | 598 | 319 | 189 | 508 | 160 | 167 | 327 | 1.433 | 95 | 91 | 186 | 43 | 31 | 74 | 38 | 11 | 49 | 309 | 1.742 |
| 58 | Setor Nossa Senhora da Saúde | 42 | 31 | 73 | 42 | 26 | 68 | 22 | 35 | 57 | 198 | 15 | 11 | 26 | 3 | 11 | 14 | 11 | 2 | 13 | 53 | 251 |
| 61 | Setor Novo Horizonte | 44 | 56 | 100 | 41 | 20 | 61 | 28 | 45 | 73 | 234 | 15 | 10 | 25 | 16 | 11 | 27 | 7 | 3 | 10 | 62 | 296 |
| 63 | Setor Paranaíba | 28 | 29 | 57 | 24 | 17 | 41 | 14 | 13 | 27 | 125 | 17 | 10 | 27 | 6 | 10 | 16 | 3 | 5 | 8 | 51 | 176 |
| 64 | Setor Planalto | 43 | 36 | 79 | 26 | 29 | 55 | 36 | 37 | 73 | 207 | 20 | 20 | 40 | 8 | 9 | 17 | 9 | 3 | 12 | 69 | 276 |
| 67 | Setor Rodoviário | 49 | 38 | 87 | 46 | 23 | 69 | 29 | 17 | 46 | 202 | 20 | 16 | 36 | 9 | 14 | 23 | 3 | 3 | 6 | 65 | 267 |
| 70 | Setor Santa Rita | 27 | 42 | 69 | 30 | 41 | 71 | 25 | 31 | 56 | 196 | 19 | 13 | 32 | 21 | 16 | 37 | 13 | 6 | 19 | 88 | 284 |
| 71 | Setor Santos Dumont | 73 | 59 | 132 | 63 | 32 | 95 | 51 | 47 | 98 | 325 | 32 | 22 | 54 | 19 | 18 | 37 | 12 | 6 | 18 | 109 | 434 |
| 75 | Setor Social | 27 | 38 | 65 | 28 | 19 | 47 | 22 | 33 | 55 | 167 | 19 | 14 | 33 | 7 | 2 | 9 | 5 | 3 | 8 | 50 | 217 |
| LEGEND | ||||||||||||||||||||||
| Thefts | Robberies | |||||||||||||||||||||
| low: <40 annual occurrences | low: <3 annual occurrences | |||||||||||||||||||||
| medium-low: 41–80 annual occurrences | medium-low: 3–6 annual occurrences | |||||||||||||||||||||
| medium-high: 81–120 annual occurrences | medium-high: 7–10 annual occurrences | |||||||||||||||||||||
| high: >120 annual occurrences | high: >10 annual occurrences | |||||||||||||||||||||
| no record | no record | |||||||||||||||||||||
| Crimes | n | p Values | W de Kendall | Effect Magnitudes |
|---|---|---|---|---|
| Thefts | 12 | 0.002 | 0.521 | large |
| Robberies | 12 | <0.001 | 0.861 | large |
| Crimes | Comparison Periods | Adjusted p | r | Effect Magnitudes |
|---|---|---|---|---|
| Thefts | 2018–2019 vs. 2020–2021 | 0.010 | 0.861 | large |
| 2020–2021 vs. 2022–2023 | 0.556 | 0.181 | small | |
| 2018–2019 vs. 2022–2023 | 0.010 | 0.827 | large | |
| Robberies | 2018–2019 vs. 2020–2021 | 0.008 | 0.816 | large |
| 2020–2021 vs. 2022–2023 | 0.008 | 0.884 | large | |
| 2018–2019 vs. 2022–2023 | 0.008 | 0.884 | large |
| Crimes | Comparison Periods | n | Mean | SD | Median | Q1 | Q3 | Minimum | Maximum |
|---|---|---|---|---|---|---|---|---|---|
| Thefts | 2018–2019 vs. 2020–2021 | 12 | −24.3 | 24.5 | −18.0 | −34.0 | −8.8 | −90 | 2 |
| 2020–2021 vs. 2022–2023 | 12 | −39.9 | 74.0 | −20.5 | −31.0 | −12.3 | −271 | 10 | |
| 2018–2019 vs. 2022–2023 | 12 | −15.6 | 53.8 | −2.5 | −14.3 | 10.5 | −181 | 18 | |
| Robberies | 2018–2019 vs. 2020–2021 | 12 | −24.2 | 29.9 | −20.0 | −25.0 | −11.8 | −112 | 5 |
| 2020–2021 vs. 2022–2023 | 12 | −36.0 | 33.5 | −29.0 | −36.3 | −18.0 | −137 | −13 | |
| 2018–2019 vs. 2022–2023 | 12 | −11.8 | 9.0 | −12.5 | −18.3 | −3.8 | −25 | −1 |
| Crime | Year | n (Streets) | Significant Hot Spots | % Hot Spots | More Significant Streets | Maximum Gi-Z | Minimum p |
|---|---|---|---|---|---|---|---|
| Thefts | 2018 | 64 | 1 | 1.6 | Avenida Beira-Rio | 5.54 | <0.001 |
| 2019 | 64 | 1 | 1.6 | Avenida Beira-Rio | 5.14 | <0.001 | |
| 2020 | 64 | 2 | 3.1 | Avenida Beira-Rio Avenida Paranaíba | 6.21 3.60 | <0.001 | |
| 2021 | 64 | 2 | 3.1 | Avenida Beira-Rio Avenida Paranaíba | 4.48 3.20 | <0.001 | |
| 2022 | 64 | 2 | 3.1 | Avenida Beira-Rio | 5.47 | <0.001 | |
| 2023 | 64 | 1 | 1.6 | Avenida Beira-Rio | 6.44 | <0.001 | |
| Total | 64 | 2 | 3.1 | Avenida Beira-Rio | 5.29 | <0.001 | |
| Robberies | 2018 | 42 | 1 | 2.4 | Avenida Beira-Rio | 4.2 | <0.001 |
| 2019 | 42 | 1 | 2.4 | Avenida Beira-Rio | 5.66 | <0.001 | |
| 2020 | 42 | 1 | 2.4 | Avenida Beira-Rio | 4.54 | <0.001 | |
| 2021 | 42 | 1 | 2.4 | Avenida Beira-Rio | 5.09 | <0.001 | |
| 2022 | 42 | 1 | 2.4 | Avenida Beira-Rio | 4.61 | <0.001 | |
| 2023 | 42 | 1 | 2.4 | Avenida Beira-Rio | 4.42 | <0.001 | |
| Total | 42 | 1 | 2.4 | Avenida Beira-Rio | 5.55 | <0.001 |
| Variables | Parameters | Northern Segment | Central Segment | Southern Segment | Overall Averages | |||||||||
|---|---|---|---|---|---|---|---|---|---|---|---|---|---|---|
| Western Side | Eastern Side | Averages | Western Side | Eastern Side | Averages | Western Side | Eastern Side | Averages | ||||||
| Socio-Behavioral Variables | ||||||||||||||
| Evasion | Escape routes | 3 R1 | 1 | 2.0 | 1 | 1 | 1.0 | 1 | 1 | 1.0 | 1.3 | |||
| Concealment | Physical barriers | 4 | 3 R2 | 3.5 | 4 | 3 R2 | 3.5 | 2 | 1 | 1.5 | 2.8 | |||
| Shielding | Visual obstructions | 4 | 1 | 2.5 | 4 | 1 | 2.5 | 2 | 1 | 1.5 | 2.2 | |||
| Overall Averages | 3.7 | 1.7 | 2.7 | 3.0 | 1.7 | 2.3 | 1.7 | 1.0 | 1.3 | 2.1 | ||||
| Socio-Morphological Variables | ||||||||||||||
| Dimensions | Street scale | 1 | 4 P1 | 2.5 | 3 | 4 P1 | 3.5 | 4 P2 | 4 P1 | 4.0 | 3.3 | |||
| Urban scale | 4 | 4 | 4.0 | 4 | 4 | 4.0 | 4 | 4 | 4.0 | 4.0 | ||||
| Densities | Constructive/ population densification | 1 | 1 | 1.0 | 4 | 1 | 2.5 | 1 | 1 | 1.0 | 1.5 | |||
| Diversity of uses | 2 | 1 | 1.5 | 4 | 1 | 2.5 | 1 | 2 | 1.5 | 1.8 | ||||
| Accessibilities | Relations between public and private space | 1 | 4 | 2.5 | 1 | 4 | 2.5 | 4 | 4 | 4.0 | 3.0 | |||
| Spatial intervisibility | 1 | 4 | 2.5 | 2 | 4 | 3.0 | 4 | 4 | 4.0 | 3.2 | ||||
| Attractiveness | Local references | 1 | 1 | 1.0 | 1 | 1 | 1.0 | 1 | 1 | 1.0 | 1.0 | |||
| Public lighting | 2 R3 | 4 P3 | 3.0 | 2 R3 | 4 P3 | 3.0 | 2 R3 | 4 P3 | 3.0 | 3.0 | ||||
| Permanencies | Arrangement of seating and/or stopping furniture | 1 | 3 R4 | 2.0 | 1 | 3 R4 | 2.0 | 3 R5 | 1 | 2.0 | 2.0 | |||
| Shading for seating and/or stopping | 1 | 3 | 2.0 | 1 | 3 | 2.0 | 4 | 4 | 4.0 | 2.7 | ||||
| Overall Averages | 1.5 | 2.9 | 2.2 | 2.3 | 2.9 | 2.6 | 2.8 | 2.9 | 2.9 | 2.6 | ||||
| Socio-Political Variables | ||||||||||||||
| Institutional instruments/ tactical tools | Maintenance of public and private spaces | 1 | 4 | 2.5 | 2 | 4 | 3.0 | 3 | 4 | 3.5 | 3.0 | |||
| Monitoring of public and private spaces | 1 | 1 | 1.0 | 2 P4 | 1 | 1.5 | 1 | 1 | 1.0 | 1.2 | ||||
| Overall Averages | 1.0 | 2.5 | 1.8 | 2.5 | 2.0 | 2.0 | 2.0 | 2.5 | 2.3 | 2.1 | ||||
| LEGEND | ||||||||||||||
| high quality | medium-high quality | medium-low quality | low quality | |||||||||||
| Variables | Northern Segment | Central Segment | Southern Segment | Overall Averages | |||||||||||||
|---|---|---|---|---|---|---|---|---|---|---|---|---|---|---|---|---|---|
| West Side | East Side | Averages | West Side | East Side | Averages | West Side | East Side | Averages | |||||||||
| Socio-Behavioral | 3.7 | 1.7 | 2.7 | 3.0 | 1.7 | 2.3 | 1.7 | 1.0 | 1.3 | 2.1 | |||||||
| Socio-Morphological | 1.5 | 2.9 | 2.2 | 2.3 | 2.9 | 2.6 | 2.8 | 2.9 | 2.9 | 2.6 | |||||||
| Socio-Political | 1.0 | 2.5 | 1.8 | 2.0 | 2.5 | 2.3 | 2.0 | 2.5 | 2.3 | 2.1 | |||||||
| Overall Averages | 2.1 | 2.4 | 2.2 | 2.4 | 2.4 | 2.4 | 2.2 | 2.1 | 2.1 | 2.2 | |||||||
| LEGEND | |||||||||||||||||
| high quality | medium-high quality | medium-low quality | low quality | ||||||||||||||
| Segments | North- Western | North- Eastern | Central- Western | Central- Eastern | South- Western | South- Eastern |
|---|---|---|---|---|---|---|
| North- Western | 1.00 | −0.15 | 0.51 | −0.15 | −0.12 | −0.17 |
| North- Eastern | −0.15 | 1.00 | −0.07 | 1.00 | 0.85 | 0.85 |
| Central- Western | 0.51 | −0.07 | 1.00 | −0.07 | −0.07 | −0.07 |
| Central- Eastern | −0.15 | 1.00 | −0.07 | 1.00 | 0.85 | 0.85 |
| South- Western | −0.12 | 0.85 | −0.07 | 0.85 | 1.00 | 0.80 |
| South- Eastern | −0.17 | 0.85 | −0.07 | 0.85 | 0.80 | 1.00 |
| Criminological Theories 1 (Classical Works and Contemporary References) | Assumptions | Analytical Variables | ||
|---|---|---|---|---|
| Socio-Behavioral (Evasion, Concealment, Shielding) | Socio-Morphological (Dimensions, Densities, Accessibilities, Attractiveness, Permanencies) | Socio-Political (Institutional Instruments/Tactical Tools) | ||
| Routine Activities [5,6,7,8] | Crime resulting from the interaction between the existence of a target, the absence of a guardian, and the presence of an offender. | Insufficient alternatives for potential aggressors and removal of physical and visual barriers. | Reduction in unsafe practices, accessibility to escape routes, and attractiveness for offenders, together with encouragement of permanence for guardians. | Formulation of guidelines and implementation of protective measures for targets, attraction of guardians, and suppression of offenders. |
| Criminal Opportunities [9,10] | Limited disposition of citizens to maintain a crime-prevention posture. | Attention of spatial users to escape routes and physical and visual obstructions. | Attention of spatial users to unsafe dimensions, densities, accessibility, attractiveness, and permanencies. | Guidance for minimizing criminal opportunities. |
| Marginal Labeling [11,12,13] | Transformation of the individual into what they are labeled. | Reduction in social discrimination and consequent decrease in offenders’ propensity to flee, hide, and conceal. | Social decriminalization through dimensions, densities, accessibility, attractiveness, and spatial permanencies. | Awareness and implementation of actions for reducing socio-criminological discrimination. |
| Criminal Economy [11,14] | Evaluation of costs and gains of criminal actions. | Insufficiency of alternative gains from evasion, concealment, and hiding. | Reduction in criminal gains through dimensioning, densities, accessibility, attractiveness, and permanencies. | Construction and institution of alternatives for reducing criminal gains. |
| Rational Choice [5,6,11,15,16,17,18] | Option of committing crime based on weighing benefits against punishment. | Reduction in spatial advantages for evasion, concealment, and hiding. | Attenuation of criminal advantages through dimensioning, densities, accessibility, attractiveness, and permanencies. | Outline and implementation of spatial disadvantages for offenders. |
| Social Disorganization [19,20] | Probability of criminal occurrence in communities collapsed in customs and social opportunities. | Community strengthening for prevention of evasion and monitoring of physical and visual barriers. | Community interaction in defining dimensions, densities, accessibility, attractiveness, and permanencies. | Design and institution of community strengthening initiatives for crime prevention. |
| Locational Criminality [21,22,23] | Criminal actions linked to opportunities favored by the physical environment. | Control of escape routes, hiding places, and concealment areas for offenders. | Establishment of measures regarding dimensions, densities, accessibility, attractiveness, and permanencies to discourage crime. | Design and implementation of principles for public spaces guided by safety and adapted to local specificities. |
| Personal Space [24,25,26] | Personal physical environment influencing the propensity for criminal behavior. | Personal space restricting escape routes and mitigating physical and visual barriers. | Dimensions, densities, access, attractions, and permanencies related to personal space. | Guidance and implementation of measures to minimize criminal opportunities associated with safe personal spaces. |
| Social Cohesion [27,28] | Urban permanencies that strengthen solidarity but also create opportunities for criminal activities. | Separation of urban permanencies from escape routes, avoiding crowding that generates physical and visual obstructions. | Separation of urban permanencies from escape routes, ensuring accessibility, attractiveness, and safety, without crowding that produces physical and visual barriers. | Design of principles for public spaces guided by solidarity and safety, with permanencies that are both supportive and secure. |
| Territorial Defense [29,30] | The importance of the surrounding environment for spatial maintenance and social responsibility. | Social responsibility in hindering escape routes and monitoring physical and visual barriers. | Social responsibility in defining dimensions, densities, accessibility, attractiveness, and permanencies. | Awareness and assurance of social responsibility in crime monitoring. |
| Social Density [31,32] | Constructive population rates generate more interactive behaviors, with environmental and behavioral regulation. | Population interaction in monitoring escape routes and physical or visual obstructions. | Population interaction in defining dimensions, densities, access, attractions, and urban permanencies. | Orientation and assurance of population interaction in crime monitoring. |
| Safe Spaces [9,24,25,33] | Environments with easy access and mobility inducing the presence of ‘natural guardians.’ | Safety conditions impeding escape routes and mitigating physical and visual barriers. | Safety conditions associated with dimensions, densities, access, attractions, and permanencies. | Conception and implementation of guidelines for the design of safe spaces. |
| Environmental Design [15,34] | Organization of physical space for crime prevention and control. | Minimization of spatial opportunities for evasion, concealment, and hiding of offenders. | Enhancement of measures, densities, access, attractions, and appropriate permanencies for safe landscapes. | Design and implementation of measures to minimize spatial opportunities for the occurrence of crimes. |
| Universal Design [35,36] | Spatial accessibility for all people. | Accessible design solutions, with control of escape routes and places for concealment and hiding of offenders. | Dimensioning for accessible design solutions, including in areas of density, with universal accessibility, safe attractions, and permanencies. | Design and implementation of accessible project solutions for crime control. |
| Defensible Space [34,37,38,39] | Spatial design with a security and defense function conducted by citizens themselves. | Spatial design hindering escape routes and mitigating physical and visual barriers. | Design with dimensions, densities, accessibility, attractiveness, and permanencies for spatial defense. | Conception and implementation of principles for the design of defensible public spaces. |
| Spatial Needs [24,25,40] | Spatial construction influencing users’ sense of security. | Spatial limitation of escape routes and of physical and visual barriers. | Reduction in unsafe measures for potential targets and of accessibility to offenders’ escape routes, with favoring attractiveness and permanencies for guardians. | Outline and implementation of spatial limitation options for criminal activities. |
| Spatial Victimization [24,25,41] | Places of social interaction for longer periods facilitating the existence of targets. | Distancing potential victims from escape routes and physical and visual barriers. | Distancing, decongestion, and inaccessibility for potential victims, with reduction in attractions and permanencies contributing to their insecurity. | Guidance and implementation of measures to minimize chances of victimization in public spaces. |
| Social Defense [42,43] | Public security as a responsibility not only of the state. | Social participation in monitoring escape routes and physical or visual obstructions. | Social participation in monitoring dimensions, densities, accessibility, attractiveness, and permanencies. | Organization and encouragement of social involvement in crime monitoring. |
| Social Control [44,45,46,47,48] | Society as responsible for its own stability, with clear rules for crime prevention. | Transparent dissemination of penalties for evasion and establishment of norms preventing the creation of physical and visual barriers. | Regulation of dimensions, densities, access, and attractions related to permanencies and circulations. | Construction of social norms for crime prevention and their formal institution for criminal repression. |
| Natural Surveillance [9,10,11,12,13,14,15,16,17,18,19,20,21,22,23,24,25,26,27,28,29,30,31,32,33,34,35,36,37,38,39,40,41,42,43,44,45,46,47,48,49] | People as ‘guardians’ of public areas. | Guardians’ attention to escape routes and physical and visual barriers. | Guardians’ attention to dimensions, densities, accessibility, attractiveness, and spatial permanencies. | Construction and institution of alternatives for attracting spatial guardians. |
| Broken Windows [50,51,52] | Physical disorder enhancing criminality. | Physical ordering to hinder escapes and mitigate physical and visual barriers. | Physical ordering to adjust dimensions, densities, accessibility, attractiveness, and permanencies for spatial defense. | Conception and implementation of principles of physical–spatial ordering for crime prevention. |
| Results-Based Management [53,54] | Systematic performance analysis of security, with evaluation of strategic and tactical actions. | Evaluation of strategic and tactical actions for containment of escapes and elimination of physical and visual obstructions. | Evaluation of strategies and tactics for dimensioning, densities, access, attractions, and permanencies. | Evaluation of strategic instruments and tactical tools for crime containment. |
| Criminal Mapping [24,25,55] | Data visualization on crimes supporting security management. | Visualization in maps of potential escape routes and physical and visual barriers. | Simulation in maps of dimensions, densities, access, attractions, and safe permanencies. | Simulation in maps of potential security strategies and tactics. |
Disclaimer/Publisher’s Note: The statements, opinions and data contained in all publications are solely those of the individual author(s) and contributor(s) and not of MDPI and/or the editor(s). MDPI and/or the editor(s) disclaim responsibility for any injury to people or property resulting from any ideas, methods, instructions or products referred to in the content. |
© 2026 by the authors. Licensee MDPI, Basel, Switzerland. This article is an open access article distributed under the terms and conditions of the Creative Commons Attribution (CC BY) license.
Share and Cite
Nogueira, R.S.; Hardt, L.P.A.; Pellizzaro, P.C.; Hardt, C. Integrated Management of Urban Landscape and Public Security. Urban Sci. 2026, 10, 462. https://doi.org/10.3390/urbansci10080462
Nogueira RS, Hardt LPA, Pellizzaro PC, Hardt C. Integrated Management of Urban Landscape and Public Security. Urban Science. 2026; 10(8):462. https://doi.org/10.3390/urbansci10080462
Chicago/Turabian StyleNogueira, Rodrigo Sant’Ana, Letícia Peret Antunes Hardt, Patrícia Costa Pellizzaro, and Carlos Hardt. 2026. "Integrated Management of Urban Landscape and Public Security" Urban Science 10, no. 8: 462. https://doi.org/10.3390/urbansci10080462
APA StyleNogueira, R. S., Hardt, L. P. A., Pellizzaro, P. C., & Hardt, C. (2026). Integrated Management of Urban Landscape and Public Security. Urban Science, 10(8), 462. https://doi.org/10.3390/urbansci10080462