1. Introduction
Smart mobility has become a major concern in contemporary urban transport planning, especially as cities seek to improve public transport efficiency, reduce dependence on private vehicles, and provide more responsive mobility services. In many studies, smart mobility is associated with intelligent transport systems, real-time passenger information, mobile applications, smart payment, vehicle tracking, and digitally supported service management. These tools can improve the visibility, predictability, and operational quality of public transport. However, when smart mobility is understood mainly through digital systems, it may overlook the physical and environmental conditions through which passengers actually experience the service. The value of smart mobility therefore depends not only on technological provision, but also on whether such technologies improve accessibility, comfort, reliability, and user acceptance in everyday travel conditions [
1,
2,
3,
4,
5].
This issue is particularly important at the scale of the bus stop, especially when the stop functions as an interchange point. Interchange bus stops are not ordinary waiting locations; they are points where several routes overlap; further, passengers may transfer, compare route options, wait for different services, or obtain clearer information to complete their trips. A stop may be connected to several bus lines and supported by digital tools such as real-time information yet still fail to operate effectively if it lacks shade, seating, lighting, safe crossings, or universal accessibility. In this sense, interchange potential alone does not guarantee smart readiness [
6,
7,
8]. In hot–arid cities, the quality of interchange bus stops becomes even more critical. High solar radiation, elevated temperatures, limited shade, and uncomfortable walking conditions can make waiting and transferring physically challenging. This is especially relevant where interchange stops are expected to support higher passenger activity than ordinary stops. Research on transit infrastructure in hot and dry climates shows that stop design and shade provision directly influence users’ heat perceptions, indicating that shade, shelter, seating, and protection from climatic exposure should be treated as essential conditions for public transport usability rather than secondary amenities [
9,
10,
11,
12]. Accessibility is also central to the readiness of interchange bus stops. Because these stops serve multiple routes, they are likely to attract users from different directions and surrounding land uses. Their performance therefore depends not only on their location within the bus network, but also on whether passengers can reach them safely, directly, and comfortably. Sidewalk continuity, safe crossings, curb ramps, visibility, and proximity to active destinations all shape the practical value of an interchange stop [
13,
14,
15].
In this study, three related but distinct concepts are used. “Smart mobility” refers to the wider digitally supported and user-oriented mobility system. “Transit stop quality” refers to the conventional performance of stop-level facilities and service attributes, such as seating, shelter, accessibility, information, and safety. “Smart bus stop readiness” refers more specifically to the capacity of a stop to support the effective use of smart public transport through the combined provision of passenger information, appropriate waiting conditions, pedestrian accessibility, safety, and integration with its surrounding urban context. Physical qualities are therefore not classified as “smart” merely because they are desirable amenities; they are included because they determine whether digitally enabled mobility services can be accessed and used effectively. This positions smart readiness as a socio-technical condition in which technological systems and the built environment operate together [
1,
2,
16].
This study addresses that gap by developing and applying a Smart Bus Stop Readiness Index (SBSRI) to seven interchange bus stops in Jeddah, Saudi Arabia. The selected stops are official operating locations served by three or more bus lines and represent historic, institutional, mixed-use, and district-level urban contexts. The SBSRI assesses five dimensions: Passenger Information and Digital Readiness; Physical and Thermal Comfort Provision; Pedestrian Accessibility and Universal Design; Safety and Security; and Land-Use and Activity Integration. Evidence was collected through field audit, spatial mapping, passenger observation, and a short passenger survey.
The study has four objectives:
To establish a literature-informed conceptual framework that defines smart bus stop readiness as the interaction between digital, physical, climatic, accessibility, safety, and urban-context conditions.
To develop a transparent composite index for assessing readiness at interchange bus stops in hot–arid urban settings.
To apply the SBSRI to selected interchange stops in Jeddah and identify the principal dimensions responsible for differences in stop performance.
To derive transferable theoretical and planning implications for the assessment and upgrading of interchange bus stops in other hot-climate cities.
The principal contribution is therefore both methodological and conceptual. Methodologically, the study provides a multidimensional diagnostic instrument for comparing stop-level deficiencies and prioritizing interventions. Conceptually, it extends smart mobility assessment from the presence of digital systems to the environmental and spatial conditions that enable those systems to function for passengers. The SBSRI is presented as an exploratory decision-support framework rather than a universal regulatory standard; its value lies in making the assumptions, dimensions, and trade-offs of stop-level smart readiness explicit and testable across different urban contexts.
2. Literature Review
This section establishes the conceptual and methodological basis for assessing smart readiness at interchange bus stops in hot–arid cities. It reviews seven interrelated areas: smart mobility, interchange and transfer experience, passenger information, pedestrian accessibility, thermal comfort provision, safety and security, and composite index development. Rather than treating these areas as independent bodies of knowledge, the review examines how they interact at the bus-stop scale. The central argument is that interchange bus stops operate as socio-technical interfaces where digital services depend on supporting physical, environmental, spatial, and social conditions [
16].
2.1. Smart Mobility and the Bus Stop as a Passenger Interface
Smart mobility is commonly associated with real-time information, mobile applications, smart payment, vehicle tracking, intelligent transport systems, and data-driven service management. These technologies can improve public transport predictability and legibility, but their value depends on how they improve the passenger’s actual experience. A technology may be available, yet its benefit remains limited if users cannot access the stop safely, understand the service clearly, or wait in acceptable physical conditions. Therefore, smart mobility should be examined as a user-centered and context-sensitive condition, not simply as the presence of digital systems [
17,
18]. Within this study, smart mobility, transit stop quality, and smart bus stop readiness are treated as related but distinct concepts. Smart mobility refers to the broader use of digital, operational, and information-based systems to improve urban mobility. Transit stop quality concerns the conventional physical and service characteristics of the stop, such as seating, shelter, accessibility, information, and safety. Smart bus stop readiness refers to the capacity of the stop environment to support the effective use of digitally enabled and integrated public transport services.
The bus stop is a critical interface in this process because it is where the passenger first encounters the public transport system. It is the point where users seek information, wait, assess safety, and connect the service with the surrounding pedestrian environment. This role becomes more complex at interchange stops. Such stops may involve route choice, longer waiting, and transfer activity, which increases the importance of clear information, comfort, and spatial legibility. A digitally connected stop cannot be considered fully ready if it lacks shade, seating, safe crossings, lighting, or universal accessibility [
19,
20]. These physical characteristics are not classified as “smart” merely because they represent desirable facilities. Rather, they are considered enabling conditions that determine whether passengers can access, remain within, and benefit from a digitally supported public transport environment. This interpretation positions smart bus stop readiness as a socio-technical condition in which technological provision and built-environment quality operate together.
2.2. Interchange Stops and the Complexity of Transfer Experience
Interchange points are essential to public transport networks because they allow passengers to complete trips that cannot be served by one route alone. However, they can also add inconvenience through waiting, walking, uncertainty, and the need to understand different route options. Research on transfer experience shows that passengers often perceive waiting and transfer inconvenience as more burdensome than in-vehicle time. This makes the design and management of interchange environments central to the perceived attractiveness of public transport [
21,
22]. Interchange readiness depends on more than route overlap. The stop must help passengers identify routes, understand direction, compare options, wait safely, and board the correct bus. If information is unclear, access is weak, or the waiting environment is uncomfortable, the stop may remain operationally important but experientially poor. Efficient interchange environments therefore depend on information, accessibility, transfer convenience, spatial clarity, and integration with the surrounding urban fabric [
21,
23]. A distinction is therefore required between route overlap and interchange readiness. Route overlap is an operational network characteristic, whereas interchange readiness concerns whether passengers can effectively use the combined services available at the stop. A route-rich stop may have substantial network importance while remaining poorly prepared for passenger transfer, waiting, and route-selection activities.
2.3. Passenger Information and Digital Readiness
Digital information is a core component of smart public transport, particularly at interchange stops where passengers may need to compare multiple route options. Real-time arrival information can reduce uncertainty, improve perceived reliability, and support better travel decisions. Users value such systems because actual bus arrival times often differ from scheduled times. However, the usefulness of real-time information depends on accuracy, clarity, visibility, and user trust [
24,
25]. At interchange stops, information needs are more complex than at ordinary stops. Passengers may need to know which among several lines arrives first, whether different routes serve the same destination, or whether a transfer is worth making. Route maps, timetables, stop identification, QR codes, mobile-application links, and real-time displays therefore become central to stop readiness. Yet these tools should not be assessed in isolation. A display may reduce uncertainty, but its value is weakened if passengers cannot remain comfortably within the formal waiting area because of heat, lack of shade, or poor seating [
26,
27]. Passenger information includes both digital and non-digital components. Real-time displays, mobile applications, and QR codes represent digitally enabled information, whereas static route maps, timetables, stop identification, and directional signage provide essential baseline information. The dimension is therefore termed “Passenger Information and Digital Readiness” to recognize that analog and digital information systems are complementary rather than interchangeable.
2.4. Accessibility and Pedestrian Integration Around Interchange Stops
Accessibility is fundamental to bus stop readiness because passengers must be able to reach the stop before they can use the service. At interchange stops, accessibility is especially important because users may approach from multiple directions and surrounding land uses. A stop may serve several routes but still perform poorly if sidewalks are discontinuous, crossings are unsafe, curb ramps are missing, or pedestrian routes are exposed and uncomfortable. Bus stop accessibility should therefore be evaluated through actual pedestrian conditions, not distance alone [
15,
28]. Land-use integration also shapes the value of interchange stops. Stops located near commercial activities, institutions, schools, hospitals, public services, or dense residential areas are more likely to support meaningful passenger demand. Spatial analysis can help evaluate the relationship between bus stops and nearby amenities, services, and facilities. This is important because the readiness of an interchange stop depends not only on the number of lines it serves, but also on whether it is positioned within an urban context that generates daily mobility needs [
29]. Nevertheless, high land-use intensity and high passenger activity should not automatically be interpreted as evidence of high stop readiness. Passengers may continue to use deficient stops because they serve necessary routes or are located near important destinations. In such cases, high passenger demand indicates the strategic importance of the stop and the urgency of intervention rather than the adequacy of its infrastructure.
Universal accessibility must also be part of the assessment. Interchange stops may serve a wide range of passengers, including elderly users, people with disabilities, children, and users carrying bags or moving between destinations. Curb ramps, level access, obstruction-free sidewalks, safe crossings, and accessible waiting areas are therefore necessary conditions for inclusive public transport [
13,
14]. Universal accessibility should therefore be understood as a core condition of readiness rather than an additional design feature. A stop cannot be considered fully ready when its information or services are available but cannot be reached or used equitably by passengers with different mobility needs.
2.5. Physical and Thermal Comfort Provision in Hot–Arid Cities
Thermal conditions are a decisive consideration in hot–arid cities, where passengers may be exposed to high solar radiation, elevated air temperatures, and uncomfortable surface conditions while walking to or waiting at bus stops. In such contexts, shade, shelter, seating, and protection from solar exposure are not secondary amenities; they are essential to public transport usability [
11,
30]. Research on transit infrastructure in hot and dry climates shows that stop design and shade provision influence users’ heat perceptions. This evidence is particularly relevant to Jeddah, where the climatic context can make waiting physically demanding. Waiting-time research also shows that amenities such as shelters and seating can reduce the perceived burden of waiting, while insecurity and poor environmental conditions can make waiting feel longer [
8,
31].
Poor thermal conditions may also change passenger behavior. When formal waiting areas are exposed to direct sun, passengers may move to nearby shaded spaces such as building edges, trees, or shopfronts. While this behavior improves comfort, it may reduce boarding visibility, safety, and access to route information. Therefore, the assessment should consider not only whether shade exists, but whether it is aligned with seating, signage, and the formal boarding area [
9,
30]. Accordingly, the study assesses Physical and Thermal Comfort Provision as the availability of design features intended to mitigate climatic exposure, rather than measured thermal performance.
2.6. Safety, Security, and the Social Experience of Interchange
Safety and security influence whether passengers perceive public transport as acceptable and reliable. Safety includes both traffic safety and personal security. Traffic safety concerns protected waiting space, safe crossings, separation from vehicles, and clear boarding zones. Personal security concerns lighting, visibility, passive surveillance, and the presence of active surroundings. These factors become more important where passengers may wait longer or transfer between services [
32,
33]. The surrounding urban environment also shapes the social experience of waiting. Stops located near active frontages, public institutions, shops, or visible pedestrian movement may feel safer than stops along inactive edges or wide traffic corridors. In hot–arid contexts, safety and comfort may interact: passengers may leave the formal stop area to find shade, but this may place them closer to traffic or away from information systems [
8,
23]. Safety and security should therefore not be examined as isolated stop attributes. They interact with pedestrian accessibility, thermal comfort provision, land-use activity, and the organization of the formal waiting area. For example, passengers seeking shade outside the designated stop may experience greater exposure to traffic or reduced passive surveillance.
2.7. Index-Based Assessment of Smart Bus Stop Readiness
Index-based assessment is useful when infrastructure performance depends on several interacting dimensions. Interchange bus stop readiness cannot be measured by a single variable such as the number of bus lines, the presence of digital information, or the availability of shelter. A composite index allows digital information, thermal comfort provision, accessibility, safety, and land-use integration to be assessed separately and then combined into an overall readiness score. This provides both diagnostic and comparative value for prioritizing interventions [
34,
35].
The reviewed literature remains fragmented across smart mobility, passenger information, interchange quality, accessibility, thermal comfort provision, safety, and land-use research. The gap is therefore not the absence of individual indicators, but the limited integration of these indicators into a stop-level framework explaining how technological, physical, environmental, and urban conditions jointly shape interchange readiness. The SBSRI addresses this gap by integrating the five dimensions within a socio-technical assessment framework adapted to hot–arid interchange stops.
3. Methodology
This section explains the research design, study context, stop-selection procedure, data-collection methods, construction of the Smart Bus Stop Readiness Index, and analytical approach. The study was designed as an exploratory, micro-scale case study rather than a statistically representative assessment of the entire Jeddah bus network. Its purpose was to develop and test a multidimensional readiness framework across operational interchange stops representing different route intensities and urban contexts.
3.1. Research Design
This study adopted a micro-scale empirical research design to assess the smart readiness of selected interchange bus stops in Jeddah, Saudi Arabia. The study focused on stops served by several bus lines because these locations are more likely to involve route choice, transfer activity, longer waiting, and higher demand for clear passenger information. The research combined field audit, spatial mapping, passenger observation, and a short user survey. This mixed-method structure was considered appropriate because interchange stop readiness cannot be assessed through one type of evidence alone; it requires examining digital information, physical and thermal comfort provision, pedestrian accessibility, safety, land-use context, observed waiting behavior, and user perception [
6,
36]. The methodology was organized around the development and application of the SBSRI. The index evaluated each selected interchange stop through five dimensions:
Passenger Information and Digital Readiness;
Physical and Thermal Comfort Provision;
Pedestrian Accessibility and Universal Design;
Safety and Security;
Land-Use and Activity Integration.
These dimensions reflect the argument that a smart interchange stop should not be understood only as a digitally connected stop, but as a user-oriented public transport node where information, waiting provision, access, safety, and urban context work together. This is particularly important in hot–arid cities, where shade, seating, and pedestrian conditions directly affect public transport usability [
1,
9].
The study was exploratory in nature. The seven selected stops constituted the analytical cases, while the observation counts and survey responses provided supporting descriptive evidence. The research was not designed to produce statistically generalizable estimates for all bus stops or passengers in Jeddah.
3.2. Study Area
The study was conducted in Jeddah, a major Saudi coastal city characterized by hot climatic conditions, high dependence on private vehicles, expanding public transport services, and uneven pedestrian environments. These conditions make Jeddah a relevant context for examining the relationship between smart mobility infrastructure and stop-level passenger experience. The focus on interchange bus stops is also relevant to Jeddah because stops served by multiple routes are likely to play a stronger role in the public transport network than ordinary single-route stops. Deficiencies at interchange stops may therefore affect not only boarding, but also transfer convenience, route legibility, and passenger confidence [
23,
37]. Jeddah also contains considerable variation in urban morphology and land use. The selected stops included locations within the historic core, institutional and public-service settings, mixed-use districts, and district-level interchange environments. This variation supported comparison across different forms of urban context rather than limiting the assessment to one neighborhood type.
3.3. Sampling Strategy and Stop Selection
The study used purposive maximum-variation sampling to select interchange bus stops that are operationally important, field-verifiable, and suitable for detailed stop-level assessment. The sampling was based on six inclusion/exclusion criteria to ensure that the sample was limited to real and operational interchange stops rather than ordinary stops, informal waiting points, or ambiguous locations. The criteria included:
The selected stop was required to be served by three or more bus lines. This condition defined the study’s focus on interchange stops and excluded ordinary stops with one or two routes. The rationale is that stops served by multiple lines are more likely to generate route-choice behavior, transfer activity, information demand, and longer or more complex waiting experiences.
Each stop was required to be an existing official stop within the operating Jeddah bus network. This ensured that all selected stops were real, active, and assessable at the time of fieldwork.
The stop was required to demonstrate practical interchange potential rather than route overlap alone. Some stops may technically serve three or more lines, but their practical interchange role may be weak if they have limited passenger activity, weak surrounding land-use demand, or little evidence of route-choice behavior.
Stops were selected to represent variation in urban context, including historic-core locations, institutional settings, mixed-use areas, and district-level interchange stops.
Observable passenger activity was required, since the study included actual waiting behavior as part of the contextual assessment of stop activity.
Stops located too close to another were excluded when both locations had similar route function, urban context, and physical conditions.
The screening process began with 16 candidate stops. All 16 met the requirements of being official operational stops served by three or more bus lines. Applying the practical-interchange criterion reduced the pool to 15 stops. The observable passenger-activity criterion reduced it to 11 stops. Four additional locations were excluded because of proximity and duplication in route function, urban context, and physical conditions, resulting in a final sample of seven stops. Urban-context variation was then checked across the final sample. The sample should not be interpreted as statistically representative of every bus stop in Jeddah. Instead, it provides analytical representation of different interchange conditions, route concentrations, and urban settings. The findings are therefore intended to support conceptual development and comparative diagnosis rather than population-level estimation.
3.4. Data Collection Methods
The study used four data collection methods: field audit, spatial mapping, passenger observation, and user survey. Each method captured a different aspect of interchange bus stop readiness, as follows:
The field audit recorded the physical and digital attributes of each stop.
Spatial mapping examined location, surrounding land uses, and pedestrian access relationships.
Passenger observation captured actual waiting behavior.
The user survey recorded passenger perceptions of waiting conditions, safety, information clarity, and accessibility.
Together, these methods treated readiness as both an observable infrastructure condition and an experienced passenger condition.
3.4.1. Field Audit
A structured field audit checklist was used to assess each selected interchange stop. The checklist recorded the availability, condition, and functionality of indicators related to real-time information, QR codes, route maps, stop identification, seating, shelter, shade, shaded seating, lighting, cleanliness, sidewalk continuity, pedestrian crossings, curb ramps, obstruction-free access, visibility, universal accessibility, intersection conditions, and walking-route directness around each stop [
8].
Lighting, visibility and passive surveillance, and traffic protection were assessed under the Safety and Security dimension. Seating, shelter, shade coverage, shaded seating, and cleanliness and maintenance were assessed under Physical and Thermal Comfort Provision. Each indicator was scored using a binary or ordinal scale so that field observations could be converted into comparable numerical values for the SBSRI calculation.
The audit was conducted by the author. Each stop was assessed on two separate days during April 2026. On each day, assessment sessions were conducted for 30 min at approximately 10:00, 15:00, and 20:00. These time periods represented morning use, the midday heat period, and evening use. The repetition of the audit on two days served as an intra-observer verification procedure. Where observations differed between the two visits, the paired audit sheets and contemporaneous field notes were reviewed before the final indicator score was assigned. Air temperature, relative humidity, solar radiation, wind speed, PET, and UTCI were not instrumentally measured. Accordingly, the study assessed thermal comfort and heat-mitigation provision rather than measured thermal performance.
3.4.2. Spatial Mapping and Land-Use Analysis
Spatial mapping was used to locate the selected interchange stops and analyze their relationship with surrounding land uses and pedestrian access conditions. Each stop was mapped using its geographic coordinates. A pedestrian catchment area of 300–400 m was drawn around each stop, depending on the available mapping data and local street configuration. Within this catchment, the study identified nearby land uses and pedestrian-generating destinations [
38]. The mapping analysis examined the presence and diversity of residential, commercial, institutional, public-service, and mixed-use destinations. It also considered the continuity and directness of pedestrian connections between these destinations and the stop. The analysis was conducted as structured spatial mapping rather than a comprehensive GIS network analysis. The purpose of the land-use assessment was not to estimate total travel demand. Instead, it was used to establish whether the stop was embedded within an urban environment capable of generating regular passenger activity and interchange demand.
3.4.3. Passenger Observation
Passenger observation was conducted at each selected interchange stop to record how the stop was used in practice. The observation documented the number of waiting passengers, whether passengers used available seating, whether they waited in shaded areas, whether they remained within the formal stop area, and whether they moved away from the stop to seek comfort or safety [
21]. Each stop was observed for 30 min at approximately 10:00, 15:00, and 20:00 on two separate days during April 2026. The observations therefore covered morning, midday/heat-period, and evening conditions. For each time period, the reported passenger counts represented the average of the observations recorded on the two days. These periods captured different patterns of passenger activity, climatic exposure, and lighting or safety conditions.
The purpose of passenger observation was not to produce a full ridership model, but to examine visible waiting behavior and stop activity. Passenger waiting activity was also included as one indicator within the Land-Use and Activity Integration dimension, where it represented realized activity at the stop in conjunction with proximity to active land uses and destination diversity. Because passenger activity can also be influenced by route frequency, network importance, surrounding travel demand, and service characteristics, the observed passenger counts were not treated as an independent validation measure of the SBSRI.
3.4.4. User Survey
A short user survey was administrated to passengers at the selected interchange stops between 16 and 18 May 2026. The survey collected user perceptions of route and arrival information, waiting comfort, shade, safety, pedestrian access, universal accessibility, and overall satisfaction. Responses used a five-point Likert scale, ranging from 1 = very poor or strongly disagree to 5 = very good or strongly agree. The survey was kept brief to avoid interrupting passengers during waiting time and was conducted through a digital form. A total of 71 valid responses was obtained, comprising 10 valid responses at six stops and 11 responses at Musharifa 5B. Passengers who were present at the selected stops during the survey periods and agreed to participate completed the anonymous questionnaire. The survey results complemented the field audit by showing whether observed conditions corresponded with passenger perceptions. Perceived safety was the survey-based indicator incorporated into the Safety and Security dimension, while the remaining survey items were used as supporting descriptive evidence of passenger perceptions. Given the small stop-level samples of 10–11 respondents, these perception scores were treated as exploratory supporting evidence rather than population-level estimates [
36].
3.5. Smart Bus Stop Readiness Index
The SBSRI was constructed around five weighted dimensions. Each dimension included measurable indicators collected through field audit, spatial mapping, passenger observation, and user survey. The index generated both a total readiness score and separate dimension scores for each stop. This was necessary because stops may receive similar total scores while having different weaknesses; one may lack digital information, while another may lack shade or safe access.
The baseline dimension weights were author-defined, literature-informed, and context-specific. The literature was used to establish the relative importance and conceptual relevance of the dimensions, rather than to derive the exact numerical percentages mathematically. The allocation reflected the relative emphasis placed in previous research on passenger information and uncertainty [
6,
7,
24,
26], heat exposure and waiting provision [
8,
9,
10,
11,
30], pedestrian accessibility and inclusion [
13,
14,
15,
28,
29], safety and perceived security [
8,
23,
32,
33], and land-use integration and access to destinations [
14,
15,
28,
37]. Accordingly, Physical and Thermal Comfort Provision and Pedestrian Accessibility and Universal Design each received 25%; Passenger Information and Digital Readiness received 20%; and Safety and Security and Land-Use and Activity Integration each received 15%. No formal weighting method, such as Analytic Hierarchy Process (AHP), Delphi analysis, expert consultation, or passenger-preference weighting, was used to calculate these baseline percentages; however the detailed justification and sensitivity analysis of these weights are presented in
Section 4.6.
3.6. Data Analysis
The analysis began with descriptive statistics for each indicator, dimension, and stop. For each of the selected interchange stops, the study calculated raw indicator scores, normalized indicator scores, dimension scores, and the final SBSRI score. The results were presented in tables and charts. For the scores of the five dimensions, the revised analysis reported the mean, median, standard deviation, minimum, and maximum across the seven stops. A comparative analysis then identified the highest- and lowest-performing stops and explained the reasons for their ranking. Passenger observations and user-survey results were analyzed descriptively. Morning, midday, evening, and total passenger counts were compared across stops. Survey items were summarized using weighted mean scores, while stop-level satisfaction results were used to identify differences in passenger perception. Given the small number of responses at each stop, survey-based differences were interpreted descriptively and were not treated as population-level estimates. Passenger observation data were likewise interpreted as contextual evidence rather than as an independent validation dataset, because passenger waiting activity also contributed to the Land-Use and Activity Integration dimension. A sensitivity analysis was undertaken to examine the influence of dimension weights on the final ranking. The author-defined, literature-informed baseline weighting scenario was compared with an equal-weight scenario and alternative scenarios, as shown in
Table S4. The purpose was to determine whether the principal rankings were stable under plausible alternative weighting assumptions.
4. Index Development
This section explains the rationale, structure, indicators, normalization, aggregation, weighting, classification, and robustness assessment of the Smart Bus Stop Readiness Index. The SBSRI was developed as an exploratory decision-support instrument rather than as a regulatory standard. Its purpose was to compare the selected stops, diagnose dimension-specific deficiencies, and identify priorities for stop-level intervention.
4.1. Rationale for the Smart Bus Stop Readiness Index
The SBSRI was developed to assess whether selected interchange bus stops in Jeddah are ready to support smart, accessible, comfortable, and user-oriented public transport use [
6,
23]. The index was based on a socio-technical interpretation of smart mobility. Under this interpretation, digital information and technology were not assessed independently from the physical and urban conditions through which passengers used them. Conventional stop-quality attributes, such as shelter, seating, pedestrian access, and safety, were included because they enable or constrain passengers’ ability to benefit from digitally supported public transport services.
This approach is especially important for interchange stops because they are more demanding than ordinary bus stops. In this study, interchange stops are defined as stops served by three or more bus lines. These stops may involve route choice, transfer activity, longer waiting, and greater reliance on clear passenger information. At such locations, users need to identify routes, understand service direction, compare travel options, and wait in a setting that allows them to board the correct bus safely and comfortably. Previous research on public transport transfer and interchange environments shows that waiting, information clarity, transfer inconvenience, and pedestrian movement influence the perceived quality of public transport journeys [
39,
40]. The index was also adapted to the hot–arid conditions of Jeddah, where shade, seating, shelter, and pedestrian conditions are essential to the usability of public transport stops. In hot climates, the absence of effective shade or comfortable waiting space may push passengers to stand outside the formal stop area, which can reduce boarding visibility, safety, and access to route information. For this reason, the SBSRI gave strong emphasis to physical and thermal comfort provision rather than treating shade and seating as secondary amenities [
10,
30].
4.2. Structure of the Index
The SBSRI was organized into five weighted dimensions: Passenger Information and Digital Readiness, Physical and Thermal Comfort Provision, Pedestrian Accessibility and Universal Design, Safety and Security, and Land-Use and Activity Integration. These dimensions were selected because they represent the main conditions that shape the performance of an interchange bus stop from the passenger’s perspective. They also allowed the index to move beyond a technology-centered view of smart mobility by linking digital information with the physical, spatial, and social conditions required for actual public transport use [
16]. The indicators were derived from the literature: passenger information and real-time transport systems [
6,
24,
27,
41,
42]; waiting experience and heat-mitigation provision [
8,
30,
31,
43]; pedestrian accessibility and universal design [
14,
15,
38,
44]; safety and security [
8,
23,
45]; and land-use and spatial integration [
14,
28,
46,
47]. These indicators were translated into observable field, mapping, survey, and passenger-activity measures, as shown in
Table 1.
4.3. Indicators and Scoring Criteria
The SBSRI indicators were extracted through a structured synthesis of the existing literature review and then adapted to the present study. The extraction process followed three main steps [
1,
13]:
First, the literature was reviewed to identify recurrent variables used to evaluate smart mobility, real-time public transport information, interchange quality, bus stop accessibility, waiting experience, thermal comfort, and user satisfaction.
Second, these variables were grouped according to their relevance to the passenger experience at interchange bus stops.
Third, the grouped variables were translated into field-measurable indicators that could be assessed through field audit, spatial mapping, passenger observation, and user survey.
This process ensured that the index was not based on arbitrary criteria, but on dimensions repeatedly emphasized in public transport and smart mobility research.
The first group of indicators was derived from studies on smart mobility and real-time passenger information. This literature emphasizes that digital tools, such as real-time arrival information, route maps, QR codes, mobile links, and stop identification, can reduce uncertainty and improve public transport legibility. The literature also emphasized the continued importance of clear route maps, timetables, directional information, and stop identification. These indicators are particularly important at interchange stops because passengers may need to compare several routes, confirm travel direction, or decide whether to wait for a specific service. Accordingly, the index included indicators for real-time arrival displays, QR codes or digital links, static route maps or timetables, and route direction or stop identification [
6,
24,
27,
41].
The second group of indicators was extracted from research on waiting experience and thermal comfort. Studies on transit-stop design in hot and dry climates highlighted the role of shade, shelter, and waiting comfort in shaping users’ heat perception, while research on waiting-time perception shows that amenities such as seating and shelters can reduce the perceived burden of waiting. These findings are directly relevant to Jeddah’s hot climatic context. Therefore, the SBSRI included seating availability, shelter availability, shade coverage, shaded seating, cleanliness, and maintenance as indicators of physical and thermal comfort [
8,
30,
31].
The third group of indicators was derived from studies on bus stop accessibility and pedestrian integration. This literature shows that stop accessibility should not be measured only by distance, but by the actual pedestrian conditions that allow users to reach and use the stop. For interchange stops, this is especially important because users may approach from several directions and surrounding land uses. Based on this literature, the index included sidewalk continuity, safe pedestrian crossings, curb ramps, level access, obstruction-free approach, and universal accessibility features. These indicators reflected the need to assess whether a stop is accessible not only for average users, but also for elderly passengers, persons with disabilities, and users carrying bags or travelling with dependents [
14,
15,
38].
The fourth group of indicators was extracted from research on safety, security, and the social experience of waiting. Previous studies showed that perceived safety, lighting, visibility, passive surveillance, and traffic protection influence how users experience waiting environments. These indicators are particularly relevant at interchange stops because passengers may wait longer, stand in more complex boarding environments, or move between different route options. Consequently, the SBSRI included lighting provision, visibility and passive surveillance, protection from traffic exposure, and perceived safety as safety and security indicators [
8,
23].
The fifth group of indicators was derived from studies on land-use integration and spatial accessibility. The literature emphasized that the functional value of a bus stop depends partly on its relationship with surrounding land uses, services, and pedestrian-generating destinations. This is especially relevant for interchange stops, where demand may be influenced by nearby commercial activities, institutions, public services, residential areas, and mixed-use districts. Accordingly, the index included proximity to active land uses, diversity of nearby destinations, and observed passenger waiting activity. Passenger waiting activity was included as an indicator of realized activity associated with the stop and its surrounding urban context, rather than as a purely physical attribute of stop readiness. Its inclusion was intended to complement the two spatial indicators by identifying whether the surrounding urban and network context generated observable use of the interchange stop. However, passenger activity may also be influenced by route frequency, network importance, service availability, and wider travel demand. It therefore has a partially outcome-related character and was not treated as an independent validation measure of the SBSRI. These indicators allowed the study to distinguish between stops that merely serve several routes and stops that are embedded in urban contexts capable of supporting actual public transport demand [
14,
28,
42].
The SBSRI indicators were selected to be measurable through the different tools. They were intentionally simple and observable so that the index can be applied in a practical field setting without requiring advanced equipment. Each indicator was scored using a binary or ordinal scale, depending on the nature of the variable. Binary-type scoring was used when the indicator concerns presence or absence, while ordinal scoring was used when the quality or adequacy of the condition varies by degree, see
Table 1.
The use of mixed scoring scales reflected the nature of the measured indicators. Some indicators, such as QR-code availability or real-time display presence, can be assessed through direct observation. Other indicators, such as shade coverage, passive surveillance, cleanliness, and land-use diversity, required graded assessment because they vary in quality and intensity. This approach allowed the index to capture both the presence of infrastructure and its practical adequacy for passenger use [
8,
34]. The ordinal scores represented structured field judgments rather than instrumentally measured quantities. To reduce one-time observer effects, each stop was assessed twice on separate days, as explained in
Section 3.4.1.
4.4. Normalization of Indicator Scores
Because the indicators used different scoring ranges, all raw scores were normalized before they were combined. This step avoided giving greater numerical influence to indicators with larger scoring scales. Normalization converted each indicator score to a common 0–100 scale, where 0 indicated the weakest possible condition and 100 indicated the strongest possible condition. The normalized score for each indicator was calculated using the following formula:
where
is the normalized score of indicator (
i) at stop (
j),
is the observed raw score of indicator (
i) at stop (
j),
is the minimum possible score for that indicator, and
is the maximum possible score for that indicator.
After normalization, all indicators could be compared and combined within their respective dimensions in a transparent way [
34]. The minimum and maximum values were defined by the scoring criteria rather than by the lowest and highest observed values in the seven-stop sample. This prevented the normalized scores from changing solely because of the composition of the selected sample.
4.5. Dimension Scores
After normalization, the indicators within each dimension were averaged to calculate the dimension score. This produced five separate scores for each interchange stop. These dimension scores were important because they provided a diagnostic profile before the final composite score was calculated. The dimension score was calculated as follows:
where
is the score of dimension (
k) at stop (
j),
is the normalized score of indicator (
i) at stop (
j), and (
n) is the number of indicators within dimension (
k).
The index used equal weighting among indicators within each dimension [
36]. This decision was appropriate for the present exploratory study because the aim was to develop a practical and transparent field-based assessment tool. Equal weighting within each dimension also avoided introducing an additional layer of subjective weighting at the indicator level. The unequal weights were applied only between the five principal dimensions. In future applications, the internal indicator weights could be refined through expert consultation or passenger preference analysis.
4.6. Weighting of Index Dimensions
The five dimensions were assigned author-defined, literature-informed, and context-specific weights. The literature was used to establish the conceptual relevance and relative importance of the dimensions, but it did not provide or mathematically determine the exact numerical weights adopted in this study. No formal weighting procedure, such as AHP, Delphi analysis, expert consultation, or passenger-preference weighting, was used to derive the baseline percentages. Physical and Thermal Comfort Provision and Pedestrian Accessibility and Universal Design were each assigned 25% of the total score, reflecting the importance of shade, seating, shelter, walking access, safe crossings, and inclusive design in Jeddah’s climatic and urban conditions. Passenger Information and Digital Readiness received 20% because information clarity is particularly important at stops served by three or more bus lines. Safety and Security and Land-Use and Activity Integration each received 15%, reflecting their roles in supporting waiting, interchange use, and functional urban connectivity, as shown in
Table 2 [
9,
13]. The resulting baseline allocation was therefore an analytical choice informed by the literature and the local study context rather than an objectively derived weighting solution. Its influence on the SBSRI results was subsequently examined through the sensitivity analysis presented in
Section 4.9.
This weighting structure was context-sensitive rather than universal. In a cooler climate, thermal comfort provision might receive a lower weight. In Jeddah, however, climatic exposure and pedestrian access are especially important because a digitally connected interchange stop may still fail if passengers cannot reach it safely or wait comfortably. The selected weights therefore reflected the main argument of the study: smart readiness at interchange stops should be assessed through the combined performance of digital systems, thermal comfort provision, pedestrian access, safety, and urban integration [
6].
4.7. Final Smart Bus Stop Readiness Score
The final SBSRI score was then calculated by multiplying each dimension score by its assigned weight and summing the weighted values. The final score ranged from 0 to 100, with higher values indicating stronger readiness, as per the equation below:
where
is the Smart Bus Stop Readiness Index score for stop
,
is passenger information and the digital readiness score at stop (
j),
is the physical and thermal comfort provision score at stop (
j),
is the pedestrian accessibility and universal design score at stop (
j),
is the safety and security score at stop (
j), and
is the land-use and activity integration score at stop (
j).
4.8. Readiness Classification and Diagnostic Profile
For planning-oriented interpretation, the final SBSRI scores were classified into four readiness categories: high readiness, moderate readiness, low readiness, and very low readiness, as shown in
Table 3. This classification translated numerical scores into practical planning categories. The classification could help identify stops that required only minor upgrades, stops that required targeted improvement, and stops that needed more substantial redesign or infrastructure intervention.
The categories were intended to assist interpretation and prioritization rather than to imply precise empirical discontinuities at scores of 40, 60, or 80. Accordingly, these category labels refer to the adopted classification scheme and should not be interpreted as empirically established universal readiness thresholds. Continuous SBSRI scores, rankings, and dimension profiles therefore remained the primary analytical outputs. The classification was intended as a planning aid rather than a rigid judgment. A stop might fall within the moderate-readiness category but still require urgent intervention if it scores very poorly in pedestrian safety or thermal comfort. Similarly, a stop close to the high-readiness threshold might still need a specific improvement, such as better real-time information or improved shaded seating. For this reason, each classification was interpreted together with the detailed readiness profile of the stop. In addition to the final score, each stop was presented through a diagnostic readiness profile showing the five dimensions’ scores separately. The diagnostic profiles also revealed broader patterns across the selected stops, such as whether the main system-level weakness related to thermal comfort, pedestrian access, digital information, or safety.
4.9. Sensitivity Analysis of Weights and Classification Thresholds
Because composite-index results may be influenced by methodological choices, a sensitivity analysis was conducted to examine the robustness of the SBSRI rankings. The author-defined, literature-informed baseline allocation was D1 = 0.20, D2 = 0.25, D3 = 0.25, D4 = 0.15, and D5 = 0.15. It was compared with four alternative scenarios:
Equal weights for all five dimensions scenario: D1 = 0.20, D2 = 0.20, D3 = 0.20, D4 = 0.20, and D5 = 0.20;
Passenger Information and Digital Readiness priority scenario: D1 = 0.30, D2 = 0.20, D3 = 0.20, D4 = 0.15, and D5 = 0.15;
Physical and Thermal Comfort Provision and Accessibility priority scenario: D1 = 0.15, D2 = 0.30, D3 = 0.30, D4 = 0.125, and D5 = 0.125;
Safety and Land-Use priority scenario: D1 = 0.15, D2 = 0.20, D3 = 0.20, D4 = 0.225, and D5 = 0.225.
4.10. Linking the Index with Observation and Survey Data
The SBSRI was interpreted alongside passenger observation and user survey results. This step was important because readiness should not be understood only as an infrastructure inventory. A stop might have several physical features but still be perceived negatively by users, or it might attract passengers because of route importance despite weak infrastructure. These additional observations and perceptions were used for descriptive interpretation rather than independent statistical validation of the SBSRI. In particular, passenger waiting activity has already contributed to the Land-Use and Activity Integration dimension and therefore could not be considered an independent outcome against which the index was validated. Similarly, perceived safety contributed directly to the Safety and Security dimension, while the remaining survey items provided supporting perception evidence. Given the small stop-level survey samples, these results were interpreted as exploratory rather than population-level estimates.
5. Results
This section presents the characteristics of the selected interchange stops, their performance across the five SBSRI dimensions, the final readiness scores, passenger-observation findings, user-survey results, urban-context patterns, and the sensitivity analysis. The findings are interpreted descriptively because the study includes seven stop-level analytical cases.
5.1. Description of the Selected Interchange Bus Stops
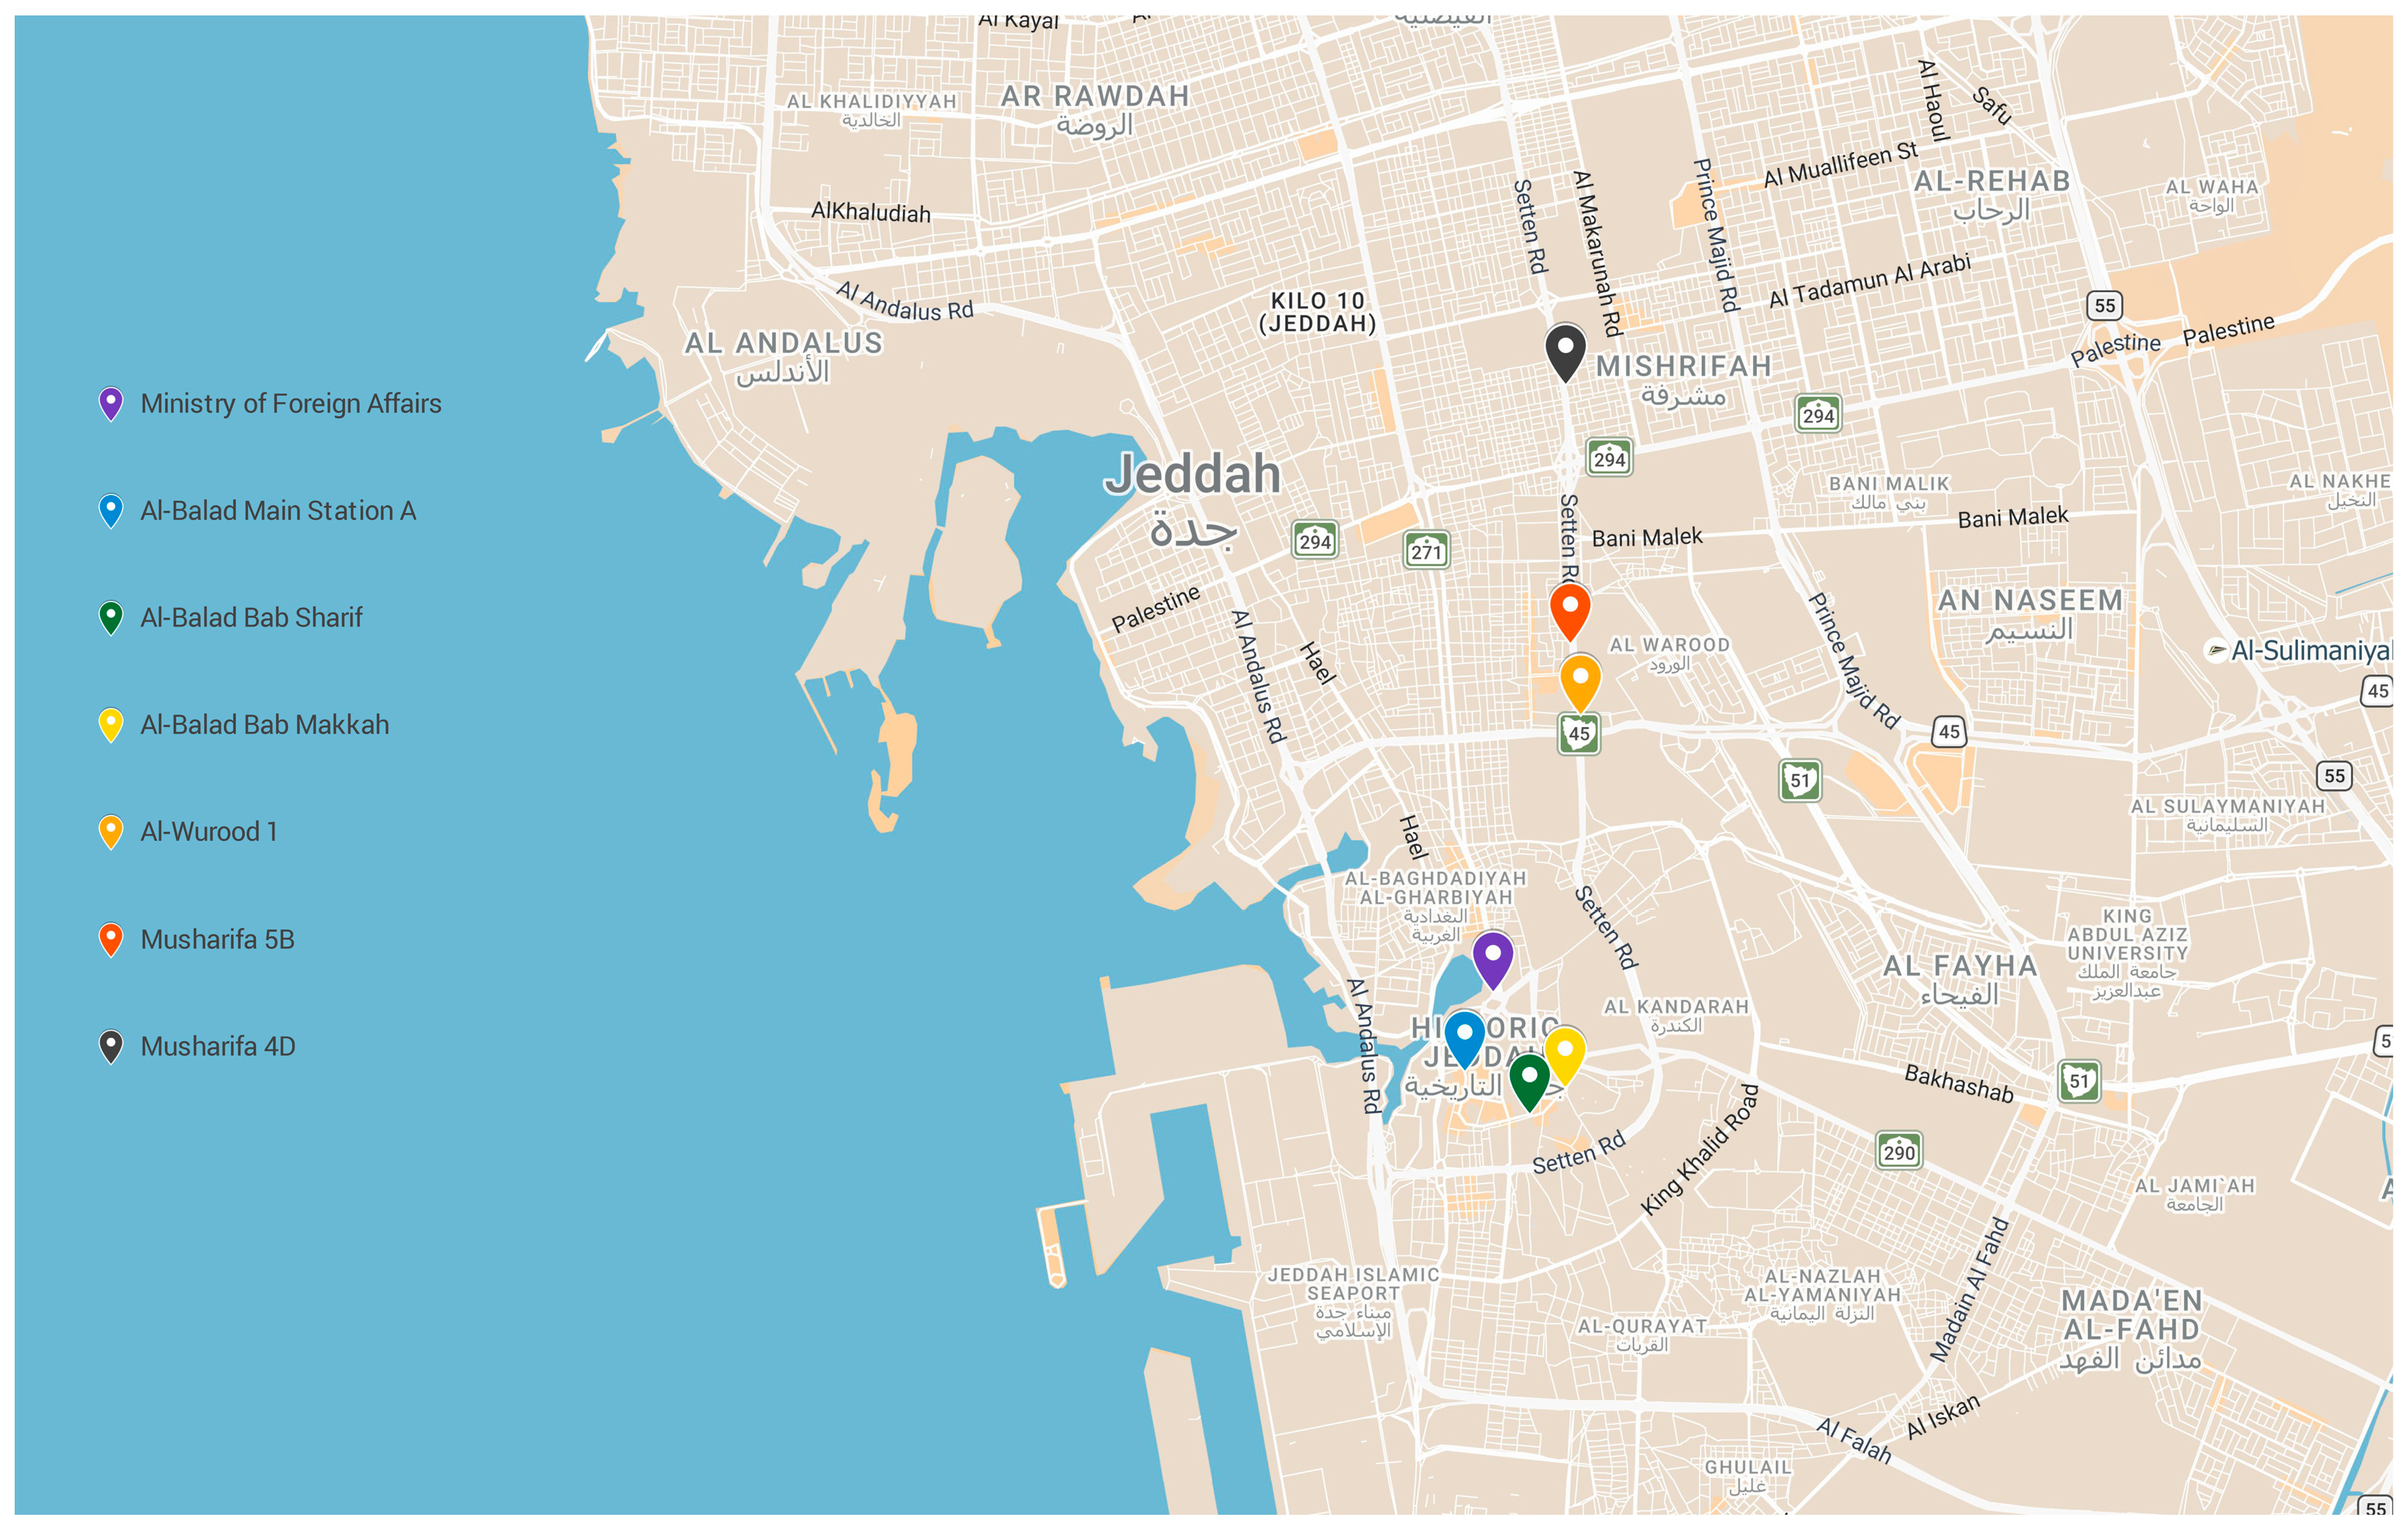
Seven stops were selected for detailed field assessment: Ministry of Foreign Affairs, Al-Balad Main Station A, Al-Balad Bab Sharif, Al-Balad Bab Makkah, Al-Wurood 1, Musharifa 5B, and Musharifa 4D.
Figure 1 shows the location of the seven selected stops.
The final sample included four stops in Al-Balad, comprising three historic-core or gateway locations and one institutional/public-service location; one residential/mixed-use stop in Al-Wurood; one district-level interchange stop in Al-Sharafyah; and one district-level interchange stop in Mushrifah. The number of bus lines serving the selected stops ranged from three to seven. The Ministry of Foreign Affairs and Al-Balad Bab Sharif stops had the highest route concentration, each served by seven lines, followed by Al-Balad Bab Makkah with six lines. The remaining stops were served by three lines each. This variation allowed the study to assess interchange readiness across different degrees of route intensity and different urban conditions, see
Table 4.
5.2. Performance by Readiness Dimensions
The dimension-level results provide a clearer explanation of detailed scores for each stop. The strongest average dimensions were land-use and activity integration at 67.06/100 and safety and security at 66.43/100. However, the weakest dimensions were physical and thermal comfort provision at 16.19/100, accessibility and universal design at 32.86/100, and passenger information and digital readiness at 33.93/100.
Table 5 shows that the most critical weakness across the sample was physical and thermal comfort provision. All stops had very low or low provision scores, with S3 and S4 scoring only 5/100, and S2 scoring 10/100 despite being the best-performing stop overall. The field audit shows that seating, shelter, shade coverage, and shaded seating were generally insufficient. Pedestrian accessibility and universal design was also uneven across the sample. S2 performed exceptionally well in pedestrian accessibility and universal design, with a score of 100/100, while S5 scored 0/100, and S6 and S7 each scored only 6.67/100. These results show that some stops are physically important within the route network but remain difficult to reach or use comfortably as pedestrian environments.
The descriptive statistics also demonstrate substantial between-stop variation. Pedestrian Accessibility and Universal Design had the largest standard deviation, at 35.66, reflecting the difference between the complete score recorded at S2 and the very weak scores recorded at S5–S7. By contrast, Physical and Thermal Comfort Provision had the lowest mean and a comparatively limited range, confirming that inadequate waiting provision was a system-wide problem rather than a deficiency confined to one or two stops.
5.3. Overall Smart Bus Stop Readiness Scores
The SBSRI results show generally weak readiness across the selected interchange stops. The average final SBSRI score was 39.07/100, which falls within the very low readiness category under the adopted planning-oriented classification scheme. Only one stop, Al-Balad Main Station A, reached the moderate-readiness category with a score of 64.71/100. Three stops were classified as low readiness: Musharifa 4D at 43.21/100, Al-Balad Bab Makkah at 41.96/100, and Musharifa 5B at 40.62/100. The remaining three stops were classified as very low readiness: Al-Balad Bab Sharif at 30.72/100, Ministry of Foreign Affairs at 28.01/100, and Al-Wurood 1 at 24.28/100, see
Table 6. The complete SBSRI scores, rankings, readiness classifications, and principal weak dimensions for the seven stops are provided in
Supplementary Table S1. These categorical labels are used as supplementary planning descriptors; the continuous scores, rankings, and dimension profiles remain the primary results. Across the seven stops, the median SBSRI score was 40.62, the standard deviation was 13.52, and the scores ranged from 24.28 to 64.71. The distance between the highest-ranked stop and the second-ranked stop was 21.50 points, indicating that S2 performed distinctly better than the rest of the sample.
5.4. Passenger Observation Results
Across the averaged observation-period counts, 155 waiting passengers were recorded across the seven stops and three daily observation periods. The reported values represent the average counts from the two observation days for each corresponding time period. Passenger activity was highest in the evening observation period, with 62 passengers, followed by the midday/heat period with 58 passengers, and the morning observation period with 35 passengers. This pattern is consistent with greater observed activity later in the day at several stops, particularly in Al-Balad, as shown in
Table 7. Detailed passenger counts by observation period, together with seating use, shade use, and waiting outside the formal stop area, are reported in
Supplementary Table S2. Because passenger waiting activity also contributes to the Land-Use and Activity Integration dimension, these counts are presented as descriptive contextual evidence and not as an independent validation of the SBSRI.
The highest passenger activity was recorded at Al-Balad Bab Sharif, with 35 observed passengers, followed by Musharifa 4D with 26 passengers, and Ministry of Foreign Affairs with 23 passengers. Al-Balad Bab Sharif was especially active during the midday and evening periods, consistent with the intensity of surrounding urban activities identified during the spatial assessment.
Usable seating and shaded waiting areas were unavailable at five of the seven stops. Consequently, no use of seating or shade was recorded at S1–S5. These zero values therefore represent unavailable facilities rather than passenger non-use of facilities that were present. In contrast, Musharifa 5B and Musharifa 4D were the only stops where usable seating and shade were available and where meaningful use was observed. However, both stops still scored poorly in Pedestrian Accessibility and Universal Design. This illustrates that readiness weaknesses differed by stop: some stops were weak because of physical and thermal comfort provision, while others were weak because of access, passenger information, or pedestrian conditions.
A total of 52 passengers were observed outside the formal stop area. The largest numbers were recorded at S2 and S3, with 13 passengers each. This pattern is consistent with the absence of usable seating and shade at these stops, although the descriptive observation design does not establish a causal relationship.
5.5. User Survey Results
The survey included 71 valid responses across the seven selected stops. Given the small stop-level samples of 10–11 respondents, the survey results are interpreted as exploratory perception evidence rather than population-level estimates of passenger opinion. The highest overall perception scores were recorded for willingness to use the bus more if the stop were improved with a weighted mean of 4.36/5, followed by ease of pedestrian access with 4.11/5, and location convenience with 3.91/5. The number of valid responses and mean scores for each survey item at each stop are presented in
Supplementary Table S3. Within this exploratory survey sample, these results suggest that many users recognize the functional value of the selected interchange stops but also see clear need for improvement. The lowest perception scores were recorded for shade adequacy with a weighted mean of 1.80/5, waiting comfort with 2.19/5, and crossing safety with 2.53/5. These results are consistent with the audit findings, especially the weak physical and thermal comfort provision scores, as shown in
Table 8.
The narrow between-stop variation in willingness to use the bus more if stops were improved is notable. All seven stop-level means were between 4.14 and 4.60, indicating consistently strong perceived improvement potential across the sample. By contrast, overall satisfaction showed the largest between-stop variation, with a standard deviation of 1.09 and values ranging from 1.00 to 4.20. This indicates that stop-level mean evaluations differed substantially within the exploratory survey sample, even though perceived improvement potential was consistently high.
At the stop level, Musharifa 5B and Musharifa 4D recorded the highest mean overall satisfaction scores within the surveyed respondents, with 4.2/5 and 3.9/5, respectively. These two stops were also the only stops where passengers were observed using seating and shade. In contrast, Al-Wurood 1 recorded the lowest overall satisfaction score, with 1/5, followed by Al-Balad Bab Makkah and Ministry of Foreign Affairs.
Although the survey rated ease of pedestrian access relatively positively overall, the field audit identified very weak accessibility provision at several stops. This difference may reflect the distinction between respondents’ immediate perceptions of access and the broader audit criteria, which included curb ramps, universal-accessibility features, crossing quality, sidewalk continuity, and obstruction-free movement. Because demographic and disability-specific information was not collected, this interpretation remains tentative.
5.6. Sensitivity of Rankings and Readiness Categories
The sensitivity analysis compared the author-defined, literature-informed baseline weights with four alternative weighting scenarios: equal weighting, Passenger Information and Digital Readiness priority, Physical and Thermal Comfort Provision and Accessibility priority, and Safety and Land-Use priority. Al-Balad Main Station A remained first under every scenario, while no stop shifted by more than one position relative to the baseline ranking. The main ranking pattern was therefore relatively stable across the tested weighting scenarios. The complete scenario weights, recalculated scores, rankings, and classification-threshold comparison are reported in
Supplementary Tables S5 and S6. The greatest variation occurred among S4, S6, and S7, whose adjacent positions changed when different dimensions were prioritized. The original readiness categories were also compared with an alternative equal-interval classification using 25-point bands. Under this alternative classification:
S2 remained moderate;
S4, S6, and S7 remained low;
S1 and S3 changed from very low to low;
S5 remained very low; and
the sample mean changed from very low to low.
The continuous scores and rankings did not change. This result indicates that category labels are more sensitive to threshold selection than the underlying SBSRI scores. Consequently, the interpretation of the findings prioritizes the continuous scores, rankings, and dimension profiles, while the readiness categories are treated as supplementary planning descriptors.
6. Discussion
This section interprets the SBSRI results in relation to interchange function, urban context, passenger experience, and the socio-technical understanding of smart mobility developed in the literature review. The discussion emphasizes the comparative patterns and transferable propositions.
6.1. Interchange Value, Demand, and Readiness Gaps
The results demonstrate a clear gap between the operational importance of the selected interchange stops and their passenger-oriented readiness. This confirms that interchange value cannot be inferred from route count alone. A stop may serve several lines, yet still fail to provide the physical, digital, and spatial conditions required for a comfortable and reliable passenger experience. This gap is particularly clear at the Ministry of Foreign Affairs and Al-Balad Bab Sharif stops, each served by seven bus lines but both classified as very low readiness under the adopted planning-oriented classification scheme. These stops appear to function as operational interchange points without being fully developed as passenger-oriented interchange environments.
This distinction supports the conceptual separation between route overlap and interchange readiness. Route overlap indicates network concentration, whereas readiness concerns whether passengers can identify, access, wait for, and transfer between the available services effectively. At the same time, the strongest average dimensions were Land-Use and Activity Integration and Safety and Security, indicating that several stops were located in active urban settings. However, strong Land-Use and Activity Integration did not guarantee high overall readiness. Al-Balad Bab Sharif recorded the highest passenger activity but remained within the very low readiness category under the adopted classification scheme. This descriptive pattern is consistent with the possibility that passengers may continue to use poorly equipped stops because of route necessity, location importance, surrounding travel demand, or limited alternatives. However, passenger waiting activity also contributes to the Land-Use and Activity Integration dimension and should therefore not be interpreted as an independent validation of the SBSRI.
The descriptive results therefore indicate that passenger presence should not be treated automatically as evidence of adequate stop quality. High activity at a deficient stop may instead indicate substantial demand despite inadequate infrastructure. A similar condition may occur in other urban contexts where passengers depend on strategically located stops and where route necessity or destination access outweigh deficiencies in waiting conditions. This has an important planning implication. Highly used but poorly equipped stops should be prioritized for intervention because their deficiencies may affect substantial numbers of users who have limited practical alternatives. Passenger demand is therefore a reason for upgrading the stop rather than an indication that the existing environment is satisfactory.
6.2. Thermal Comfort Provision, Accessibility, and Digital Readiness as Main Deficits
Physical and Thermal Comfort Provision was the most consistent weakness across the sample. The audit and exploratory survey findings both identified insufficient shade, seating, shelter, and shaded waiting space, indicating a substantial gap between the operational importance of the stops and the quality of their waiting environments.
These results are consistent with previous research showing that shade, shelter, seating, and environmental conditions influence heat perception and the perceived burden of waiting at public transport stops [
8,
9,
10,
11,
30,
31]. However, the present findings refer to the provision of heat-mitigation and waiting facilities rather than measured thermal performance. The results should therefore be interpreted as evidence of inadequate thermal comfort provision, not as a quantitative assessment of actual thermal stress. This distinction is important because a shaded structure may vary in effectiveness according to its orientation, material, time of day, season, and surrounding urban morphology.
Pedestrian accessibility and universal design was also uneven across the sample. Al-Balad Main Station A achieved a high accessibility score, while Al-Wurood 1, Musharifa 5B, and Musharifa 4D scored very poorly. This indicates that some stops are physically present in the network but weakly connected to pedestrian movement. Fragmented sidewalks, unsafe crossings, missing curb ramps, and weak universal access reduce the inclusiveness and reliability of the stop as a public transport node.
The contrast between Al-Balad Main Station A and the two district-level stops is particularly important. Musharifa 5B and Musharifa 4D provided the strongest seating and shade provision in the sample, yet both had very weak pedestrian accessibility. This demonstrates that improving the waiting area alone is insufficient when passengers cannot reach it through continuous, safe, and inclusive pedestrian routes. Accessibility must therefore be addressed at both the stop and surrounding street scales. Shelter, signage, or seating investments may have limited value when the approach route includes discontinuous sidewalks, unsafe crossings, obstructions, or missing curb ramps [
13,
14,
15,
28,
29].
Passenger Information and Digital Readiness was also weak, particularly because real-time information and clear route guidance were limited. This is significant because interchange stops require stronger information support than ordinary stops. Passengers may need to identify the correct line, compare alternatives, confirm direction, or understand whether different routes serve similar destinations. However, digital tools alone would not solve the readiness problem. Real-time information, QR codes, and route maps need to be embedded within a usable physical environment. A digitally connected stop remains incomplete if passengers cannot wait comfortably, access the stop safely, or remain near the formal boarding area.
The results support a complementary rather than substitutive relationship between digital and conventional passenger information. Real-time displays and mobile links can reduce uncertainty, but static maps, route identification, and directional signage remain necessary baseline provisions [
6,
24,
25,
26,
27]. Similarly, neither digital nor static information can function effectively when climatic exposure pushes passengers away from the formal stop area. Smart-readiness interventions should therefore avoid treating digital installation as a stand-alone solution. Passenger information, physical waiting provision, accessibility, and safety should be designed as an integrated package.
6.3. Passenger Experience and Planning Implications
Observation and survey findings provided complementary descriptive context for interpreting the dimension-level results. Stops with usable shade and seating recorded more positive mean satisfaction scores among the surveyed respondents, while high passenger activity also occurred at poorly equipped locations. These associations are descriptive and should not be interpreted as causal relationships or independent validation of the SBSRI. The different profiles within Al-Balad further indicate that readiness is shaped by micro-scale conditions—such as pedestrian connections, boarding-area placement, surrounding frontages, and shade alignment—rather than by district classification alone.
These differences suggest that micro-scale urban conditions—including street configuration, boarding-area placement, pedestrian connections, surrounding frontages, and the relationship between shade and the formal stop—may be more influential than district designation alone.
The findings support differentiated intervention strategies according to stop profile:
Historic-core and gateway stops require climate-responsive waiting and access interventions that can be incorporated without obstructing active pedestrian movement or sensitive urban character. Their priorities include effective shade, compact seating, legible route information, and safer organization of boarding areas.
District-level stops with better waiting facilities require wider pedestrian-network interventions, including continuous sidewalks, curb ramps, safe crossings, and universal-design improvements.
Institutional or public service stops require stronger passenger information and clear connections between building entrances, pedestrian routes, and boarding locations.
Residential or mixed-use stops with weak overall readiness require coordinated improvements to accessibility, visibility, safety, and surrounding pedestrian connections rather than isolated stop furniture.
This differentiated approach may be more useful than applying one standard upgrade package to every stop. The SBSRI dimension profiles allow agencies to identify whether the principal deficiency lies within the waiting area, the pedestrian approach, the information system, the surrounding urban context, or a combination of these conditions.
6.4. Broader Theoretical and Transferable Implications
Four broader lessons can be derived from the results:
Network importance and passenger-oriented readiness are distinct. A route-rich stop may be operationally important but experientially deficient.
High passenger activity may coexist with poor stop-level infrastructure when a stop serves essential routes or strategically important destinations.
Digital information cannot compensate for unsafe access, climatic exposure, or the absence of a usable waiting area.
Stop improvements should be based on dimension-specific diagnostic profiles rather than a uniform design response.
These propositions may be applicable to other cities where public transport networks expand more rapidly than stop-level infrastructure, particularly in hot–arid and car-dependent urban environments. However, direct transfer of the SBSRI author-defined baseline weights and category thresholds should be approached cautiously. Local climate, urban morphology, public transport policy, service structure, disability regulations, passenger expectations, and available data may require recalibration of the dimensions and weights. In cooler climates, for example, thermal comfort provision may receive a lower relative weight, while protection from rain, snow, or wind may require greater emphasis. In cities with mature digital systems, information-readiness indicators may need to evaluate data accuracy, interoperability, and accessibility rather than simple presence. In contexts with stronger universal-design requirements, accessibility indicators may require more detailed assessment involving people with disabilities.
The SBSRI should therefore be understood as a transferable framework rather than a fixed universal index. Its five-dimensional structure can guide comparative assessment, but its indicators, weights, and interpretation bands should be validated and adapted to local conditions.
7. Conclusions
This study developed and applied the SBSRI to seven interchange bus stops in Jeddah. The average score of 39.07/100 demonstrated generally weak readiness, with only Al-Balad Main Station A reaching moderate readiness under the adopted planning-oriented classification scheme. Route concentration and passenger activity did not necessarily correspond to adequate stop conditions, indicating that operational interchange importance should be distinguished from passenger-oriented readiness.
Physical and Thermal Comfort Provision was the principal system-wide deficiency, while pedestrian accessibility, universal design, and passenger information also showed substantial weaknesses. The findings demonstrate that digital systems cannot compensate for exposed waiting environments, unsafe pedestrian approaches, or inadequate universal access. Interchange demand should therefore be used to prioritize integrated stop, pedestrian, and information upgrades.
The SBSRI demonstrated diagnostic utility within the exploratory sample because it identified not only which stops performed better or worse, but also why. The dimension scores showed that each stop requires a different improvement strategy. For example, Al-Balad Main Station A requires improvement mainly in Physical and Thermal Comfort Provision, while Al-Wurood 1, Musharifa 5B, and Musharifa 4D require stronger Pedestrian Accessibility and Universal Design interventions. This confirms the value of using a multidimensional readiness profile rather than relying only on a total score. Such an approach can help transport agencies and municipalities prioritize limited resources and design more targeted interventions for interchange stops.
The sensitivity analysis further indicated that the broad ranking pattern remained relatively stable under alternative weighting scenarios. However, the readiness-category labels were more sensitive to the selected threshold system. Accordingly, labels such as high, moderate, low, and very low readiness should be interpreted as outcomes of the adopted planning-oriented classification scheme rather than as empirically established universal categories. Continuous SBSRI scores, rankings, and dimension profiles should therefore be treated as the principal analytical outputs, while the readiness categories should be used only as planning-oriented descriptors.
The study contributes to smart mobility research by conceptualizing the bus stop as a micro-scale socio-technical interface where passenger information, thermal comfort provision, pedestrian accessibility, safety, and land-use context interact. The SBSRI does not replace existing public transport quality, accessibility, interchange, or thermal comfort frameworks; rather, it integrates them to assess whether stop-level conditions can support digitally enabled and passenger-oriented mobility. The findings show that route concentration does not necessarily indicate interchange readiness, high passenger activity may coexist with inadequate stop-level infrastructure, digital information cannot compensate for inadequate access or climatic protection, and interventions should respond to each stop’s specific deficiencies. Although these conclusions may apply to other hot, car-dependent cities with expanding bus systems, the index should be adapted to local climate, transport policy, urban morphology, accessibility regulations, and passenger expectations. In particular, the baseline weights should be understood as author-defined, literature-informed, and context-specific rather than as objectively derived values.
The study remains limited by its purposive sample of seven stops, 71 survey responses, small stop-level survey samples of 10–11 respondents, lack of demographic and disability-specific data, single-observer audit, one-season fieldwork, absence of objective climatic measurements, and author-defined, literature-informed weighting structure. The survey findings therefore provide exploratory perception evidence rather than population-level estimates. In addition, passenger waiting activity was included within the Land-Use and Activity Integration dimension while also being used descriptively to interpret stop use. Because waiting activity may be influenced by route frequency, network importance, service characteristics, surrounding land use, and wider travel demand, this indicator has a potentially outcome-related character and should not be interpreted as an independent validation of the SBSRI. Accordingly, the findings are exploratory rather than statistically representative. Future research should validate the SBSRI across larger and multi-city samples, incorporate seasonal thermal measurements, GIS-based pedestrian analysis, real-time mobility data, environmental sensors, passenger characteristics, co-designed accessibility audits with persons with disabilities, and formal weighting procedures such as expert panels, AHP, Delphi, or passenger-preference methods. Overall, the study demonstrates that a smart bus stop is defined not by digital equipment alone, but by the combined performance of information systems, heat-mitigation and waiting provision, pedestrian connections, safety conditions, and the surrounding urban environment.