1. Introduction
AI surveillance technologies in urban policing bring together three forces: data-driven governance, expanding surveillance infrastructure, and persistent racial inequities in law enforcement. Understanding the Metropolitan Police Department’s (MPD) adoption of body-worn cameras (BWCs) requires situating these technologies within D.C.’s particular history of policing, racial geography, and governance. This study examines whether MPD’s 2015–2017 BWC randomized controlled trial generated racially disparate surveillance exposure across the city’s wards, connecting this technological deployment to historical patterns of racialized policing and contemporary debates about algorithmic governance.
1.1. Surveillance Technologies and Police Reform
Modern surveillance policing emerged from technological innovation and political imperatives to manage urban populations. Foucault [
1] traced surveillance to 18th-century disciplinary institutions, arguing power operated through visibility rather than force. His Panopticon model described how institutional power could be exercised through continuous observation rather than physical coercion, a logic that diffused outward into factories, schools, hospitals, and the open city itself [
1]. By the late 20th century, this logic embedded itself in urban governance through databases, closed-circuit television (CCTV), and automated tracking [
2]. Lyon’s analysis documented how surveillance systems sorted populations, subjecting those deemed risky or disorderly to intensified monitoring and reproducing spatial and racial geographies of state attention [
2].
Predictive policing algorithms in the 2000s transformed historical data into prospective risk assessments shaping deployment [
3]. These systems are trained on historical records of police activity that already reflect cumulative decades of racially disparate enforcement, creating a self-reinforcing feedback loop in which past enforcement generates the data later used to justify future enforcement in the same locations [
4,
5]. Body-worn cameras entered as reform technologies following high-profile killings and protests [
6,
7]. In 2015, the U.S. Department of Justice launched a Body-Worn Camera Pilot Program part of a proposed three-year,
$75 million federal investment, framing cameras as accountability tools [
8]. However, scholars questioned whether BWCs functioned as accountability mechanisms or surveillance extensions disproportionately monitoring over-policed communities [
6,
9]. Integration with facial recognition, license plate readers, and predictive analytics suggested BWCs were nodes in an expanding surveillant assemblage aggregating data across sources [
10,
11].
1.2. Washington, D.C.’s Governance and Demographic Transformation
Washington, D.C. occupies a distinctive position as a federal district lacking full sovereignty. Congress retains ultimate authority, and partial self-governance only arrived with the Home Rule Act of 1973 [
12]. Demographically, D.C. was 71% Black in 1970 [
13], but gentrification reduced this to under 50% by 2011 [
14], continuing to approximately 43% by 2020 [
15]. However, Wards 7 and 8 east of the Anacostia River remained predominantly Black and economically marginalized [
16,
17,
18], with concentrated police enforcement [
19] while Wards 2 and 3 in Northwest became majority-White, high-income areas with lower stop rates [
20].
1.3. Racialized Policing Patterns
Policing in D.C. has long reflected and reinforced racial inequality. Mid-20th-century urban renewal and subsequent gentrification displaced Black residents, concentrating poverty and surveillance east of the river [
21,
22,
23]. By the 2010s, Black residents accounted for approximately 85% of arrests despite comprising less than half the population [
24]. Golash-Boza et al. [
24] found White residents’ encroachment in Black neighborhoods associated with higher Black arrest rates, even controlling for crime a pattern termed White encroachment. These studies establish that deployment decisions respond to racial composition, producing systematically unequal surveillance exposure [
19].
1.4. The MPD Body-Worn Camera Trial
MPD launched a BWC randomized controlled trial (RCT) in 2015, randomly assigning 2224 officers to receive BWCs or serve as controls [
25]. Running from June 2015 to March 2017, the trial measured effects on use of force and complaints. Yokum et al. [
25] reported null findings: no significant effects on force, complaints, or policing activity. However, the analysis did not examine whether camera deployment produced unequal surveillance burdens across racially stratified geography. No subsequent analysis tested whether predominantly Black, low-income wards experienced higher per-capita BWC exposure than majority-White, high-income wards, leaving a critical gap in understanding how formally neutral experiments produce racially disparate outcomes when implemented in structurally unequal contexts.
1.5. Research Objectives
The broad goal of this article is to determine whether MPD’s formally race-neutral BWC RCT produced racially disparate surveillance burdens at the ward level. Specific objectives are: (1) to use officer-level BWC assignment data to measure per-capita BWC exposure by ward; (2) to test whether Wards 7–8 experience significantly higher BWC exposure than Wards 2–3; and (3) to quantify the relationship between BWC exposure and ward-level racial and socioeconomic indicators, including percent Black, poverty, income, and unemployment.
1.6. Research Gap and Contribution
The spatial equity of urban public goods is a well-developed field: scholars routinely assess whether schools, transit, parks, and environmental burdens are distributed fairly across socially differentiated neighborhoods, drawing on traditions of spatial justice and the just city that treat the geographic distribution of benefits and burdens as a core test of equitable urban governance [
26,
27]. As cities worldwide expand camera networks, sensors, and data-driven policing under the “smart city” agenda, a parallel literature warns that these technologies can widen rather than narrow urban inequality and calls for inclusive, accountable governance of their deployment [
28,
29,
30]. International surveillance scholarship further establishes that monitoring is unevenly distributed across urban space and operates as a form of state-generated exposure [
19,
23,
31], and comparative work on body-worn cameras specifically including evidence from Canada shows that the technology can reproduce, rather than disrupt, existing racial patterns of police visibility [
9]. What this body of work seldom supplies is a transferable, quantitative method for auditing how a specific surveillance deployment is distributed across a city’s population. That methodological gap, rather than a single substantive claim, motivates the present study.
The contribution of this article is therefore primarily methodological and conceptual rather than a demonstration of disparity. First, it adapts per-capita exposure metrics from environmental and spatial-justice scholarship to a surveillance technology, extending an established urban-equity method to a domain where it is rarely applied. Second, it separates two dimensions that experimental evaluations typically conflate—the internal validity of a randomized design and the distributional equity of how that design is realized across urban space—showing that a trial can be methodologically sound yet leave distributional questions unexamined. Third, through a deliberately transparent and reproducible analysis, it demonstrates that whether a formally race-neutral deployment appears equitable depends on the unit and measure of analysis, and that detecting ward-level disparity is structurally constrained by the small number of governance units—an argument for sustained, governance-based equity monitoring rather than reliance on significance tests at coarse scales. The audit method is transferable to other cities, technologies, and spatial scales.
2. Review of Related Literature
This section situates the study within existing scholarship on police surveillance technology deployment, spatial distribution of policing resources, and body-worn cameras in Washington, D.C. The review establishes five bodies of literature that together ground the central research question: Did MPD’s BWC randomized controlled trial (2015–2017) result in unequal per-capita surveillance exposure between majority-Black Wards 7–8 and majority-White Wards 2–3?
2.1. Surveillance as Spatially Distributed Exposure
Surveillance scholarship documents that monitoring practices are not evenly distributed across urban space but instead concentrate in particular neighborhoods [
23,
31]. Studies of Washington, D.C. specifically describe how order-maintenance and broken-windows policing strategies have historically concentrated police presence in neighborhoods east of the Anacostia River [
31]. Environmental justice research provides tools for measuring and comparing exposure to state-generated monitoring across populations, evaluating whether exposure to enforcement or regulatory burdens is proportionate across sub-jurisdictions using metrics such as cumulative exposure and per-capita burden [
32,
33].
Chen et al. [
19] used smartphone data from 21 U.S. cities to show that police spend more time in neighborhoods with higher proportions of Black and Hispanic residents, even after controlling for crime and socioeconomic conditions. Their analysis shows that deployment patterns account for more than half of observed racial disparities in neighborhood arrest rates [
19], establishing officer deployment location as a measurable structural factor that shapes enforcement outcomes independently of officer behavior.
Together, these studies position surveillance deployment as a distributional question of the kind that spatial-justice and just-city scholarship treats as central to equitable urban governance [
26,
27], and as one increasingly raised by the global expansion of data-driven, “smart” urban technologies whose benefits and harms fall unevenly across residents [
28,
29,
30]. The relevance extends well beyond the United States. Comparative evidence underscores that cameras are never neutral recording devices: Glasbeek et al. show that BWCs in Canada selectively render racialized subjects visible while obscuring the violence done to them [
9], reinforcing the broader point that who becomes visible to surveillance is shaped by how the technology is embedded in policing. What the present study draws from these traditions is methodological as much as conceptual—the per-capita exposure metric used here adapts the distributional logic of environmental- and spatial-justice analysis to a surveillance technology, offering a transferable way to ask, for any city or deployment, whether a formally neutral rollout is experienced proportionally across a socially stratified population. This positions the Washington, D.C. case not as an isolated local audit but as one instance of a question facing cities worldwide as they expand camera-based and algorithmic policing.
2.2. Formal Policy Neutrality and Unequal Implementation Outcomes
Legal scholarship on disparate impact holds that policies neutral in their written design may nonetheless impose unequal burdens when implemented within contexts of existing structural inequality [
34,
35]. Courts have historically been reluctant to apply disparate impact liability to police discretionary functions: Washington v. Davis, 426 U.S. 229 (1976) established that the Equal Protection Clause requires proof of discriminatory intent—a higher bar than Title VII or the Fair Housing Act impose. McCleskey v. Kemp, 481 U.S. 279 (1987) further insulated systemic policing disparities from equal protection challenge even in the face of compelling statistical evidence.
This article draws on the normative logic of disparate impact—that racially unequal outcomes from facially neutral policies warrant scrutiny and governance response—while acknowledging that such outcomes would not automatically trigger legal liability under existing constitutional doctrine. The argument advanced here is one of administrative equity and governance obligation, not a claim that the MPD trial violated any specific statute.
2.3. Randomized Controlled Trials and Implementation-Level Equity
Although randomized controlled trials are widely regarded as methodologically rigorous, political science scholarship cautions that experimental design does not eliminate distributional concerns. Mummolo [
36] demonstrates that street-level policing behavior is shaped by administrative and managerial decisions rather than fixed officer traits, underscoring that how a policy is implemented not just its formal design drives variation in on-the-ground conduct. Gerber and Green [
37] note that field experiments allocate not only potential benefits but also burdens across the participants subject to them, and MacKay [
38] argues that government policy experiments must be evaluated not only for methodological rigor but also for consistency with equitable governance.
2.4. Body-Worn Cameras as Surveillance Infrastructure
Recent scholarship describes body-worn camera systems as data-generating surveillance infrastructure. Voigt et al. [
39] demonstrate that BWC footage can serve as a data source for computational analysis of police–citizen interactions rather than mere archival evidence, documenting racial disparities in the respectfulness of officer language during routine traffic stops. Davies and Krame [
40] conceptualize BWCs as part of an integrated technological stack alongside drones and AI. Heydari et al. [
41] evaluate AI platforms that automatically analyze BWC audio to generate officer performance metrics, cautioning that AI analytics can repurpose BWC systems from accountability tools into general-purpose investigative surveillance. This literature establishes that BWC deployment creates a foundation for future AI-driven analysis, making the question of who is recorded and how often a matter of ongoing analytical significance.
2.5. Empirical Gap
No prior study examined whether the MPD BWC randomized controlled trial resulted in equal per-capita surveillance exposure across D.C. wards. Existing evaluations focused on officer behavior and aggregate citywide outcomes [
25,
42]. This article fills that gap by analyzing the geographic distribution of BWC exposure at the ward level during the experimental period.
3. Theoretical Framework
This study integrates four interconnected theoretical perspectives: (1) surveillance as spatially distributed exposure, (2) disparate impact theory, (3) experimental implementation equity, and (4) surveillance infrastructure development. Together, these perspectives establish that equitable governance requires examining not only whether a policy is neutral in design, but whether it produces proportionate burdens across populations when implemented in contexts shaped by historical inequality.
3.1. Spatial Exposure as an Analytic Frame
Surveillance exposure can be conceptualized as a measurable burden unevenly distributed across geographic space, analogous to the socio-spatial distribution of environmental hazards [
32,
33]. Key concepts include cumulative exposure (surveillance as an accumulated burden through repeated police–citizen interactions), per-capita burden (the appropriate equity metric), geographic concentration (surveillance intensity varies systematically by neighborhood), and upstream measurement (officer deployment patterns as upstream indicators of surveillance exposure).
3.2. Disparate Impact Theory
Applying this disparate-impact logic, the present study treats facially neutral policy design as insufficient to ensure equitable outcomes: the MPD BWC trial employed race-neutral officer-level randomization, yet this framework predicts that neutral randomization at the officer level does not guarantee equitable exposure at the neighborhood level if camera-equipped officers were disproportionately deployed in certain geographic areas.
3.3. Experimental Implementation Equity
Because experimental rigor does not by itself ensure equitable burden distribution, internal validity (proper randomization eliminates selection bias) and distributional equity (equitable burden allocation across communities) must be treated as distinct criteria requiring separate evaluation. Unequal ward-level exposure could occur if camera-equipped officers were disproportionately assigned to patrol certain wards, spent more time in certain wards, or if encounter volume varied systematically across wards.
3.4. Surveillance Infrastructure and Temporal Persistence
Because BWC systems generate archives that may later feed automated analysis, the geography of who is recorded carries consequences beyond the moment of capture: initial deployment decisions can create path dependencies. This point is raised as conceptual context only: the present study does not observe footage, training data, or any automated analysis, and its empirical claims are limited to the ward-level density of BWC-equipped officers during 2015–2017. Whether the patterns documented here would propagate into downstream algorithmic systems is an open question for future research rather than a finding of this analysis.
4. Materials and Methods
4.1. Study Design
This article employs quantitative secondary analysis of publicly available RCT replication files and administrative data. Specifically, it conducts an assignment-based spatial density analysis of BWC deployment, aggregating randomized officer-level BWC assignment from police districts to wards using a population-weighted spatial crosswalk [
25]. The replication file resolves each officer to one of the seven Metropolitan Police Department patrol districts; it does not contain a finer geographic identifier such as police service area, so the district is the smallest spatial unit at which officers can be located. A critical feature of the study’s design is that the RCT assigned cameras to officers at an essentially constant rate within districts (approximately 50% in every district), so camera-equipped officers were distributed in proportion to the overall officer presence in each district. Ward-level BWC-equipped officer density therefore operates as a tracer of the preexisting distribution of policing infrastructure across the city, not as an independent experimental manipulation of spatial coverage.
4.2. Data Sources
Two data sources were used: (1) officer-level BWC assignment indicators, including police-district identifiers, from the Yokum et al. [
25] replication repository; and (2) ward boundary and demographic data, including population, percent Black residents, median household income, poverty rates, and unemployment, drawn from the American Community Survey and D.C. Open Data [
43].
4.3. Procedures
Officer-level BWC assignment indicators were cleaned and aggregated to the seven Metropolitan Police Department patrol districts (1D–7D); officers assigned to non-geographic units without a numeric district (e.g., Special Operations) were excluded. For each district, the number of BWC-assigned officers was calculated using the replication file’s officer weights. District-level totals were then allocated to wards using a population-weighted crosswalk constructed as follows. Census tract, ward, and police-district boundary layers were projected to a common planar coordinate system (NAD83/Maryland State Plane, EPSG:26985) [
44] and combined through a three-way spatial intersection (tract-ward-district). Each resulting tract–ward–district piece received a share of its parent tract’s population in proportion to its area, with intersection slivers below one square meter discarded; the procedure conserved total population to within less than one percent of the tract totals. Population shares were then used to apportion each district’s officers to the wards it overlaps, and ward-level BWC-equipped officer density was calculated as the number of BWC-assigned officers per 1000 ward residents. Boundary vintages were 2020 census tracts and 2022 ward boundaries; these post-date the 2015–2017 study window, a limitation noted here. All spatial processing was performed in R version 4.4.1 using the sf (version 1.0-19) and lwgeom (version 0.2-15) packages, and the crosswalk code is available in the repository cited in the Data Availability Statement. Wards 7–8 were designated as focal wards and Wards 2–3 as comparison wards for hypothesis testing.
4.4. Analytical Approach
Analysis proceeded in three stages: (1) descriptive ranking of BWC-equipped officer density by ward; (2) comparison of density between Wards 7–8 and Wards 2–3 using an independent-samples Welch
t-test, with the directional hypothesis (Wards 7–8 > Wards 2–3) specified explicitly; and (3) correlation analysis linking density to racial and socioeconomic indicators using Pearson correlation coefficients, with Fisher-transformed 95% confidence intervals. Because each comparison group contains only two wards, the
t-test was accompanied by an exact permutation test enumerating all possible group assignments, and effect sizes (Cohen’s d) were reported alongside the null hypothesis test. A recognized and fundamental constraint is that ward-level comparison involves a small number of geographic units, which limits statistical power; with two wards per group only six distinct permutations exist, so the smallest attainable one-sided permutation
p-value is approximately 0.17. The inferential results are therefore treated as exploratory, with confidence intervals and effect sizes reported to convey the magnitude and uncertainty of estimates rather than to rely on significance thresholds. A supplementary chi-square test of high-versus-low exposure and poverty is reported with the caveat that expected cell counts fall below conventional thresholds.
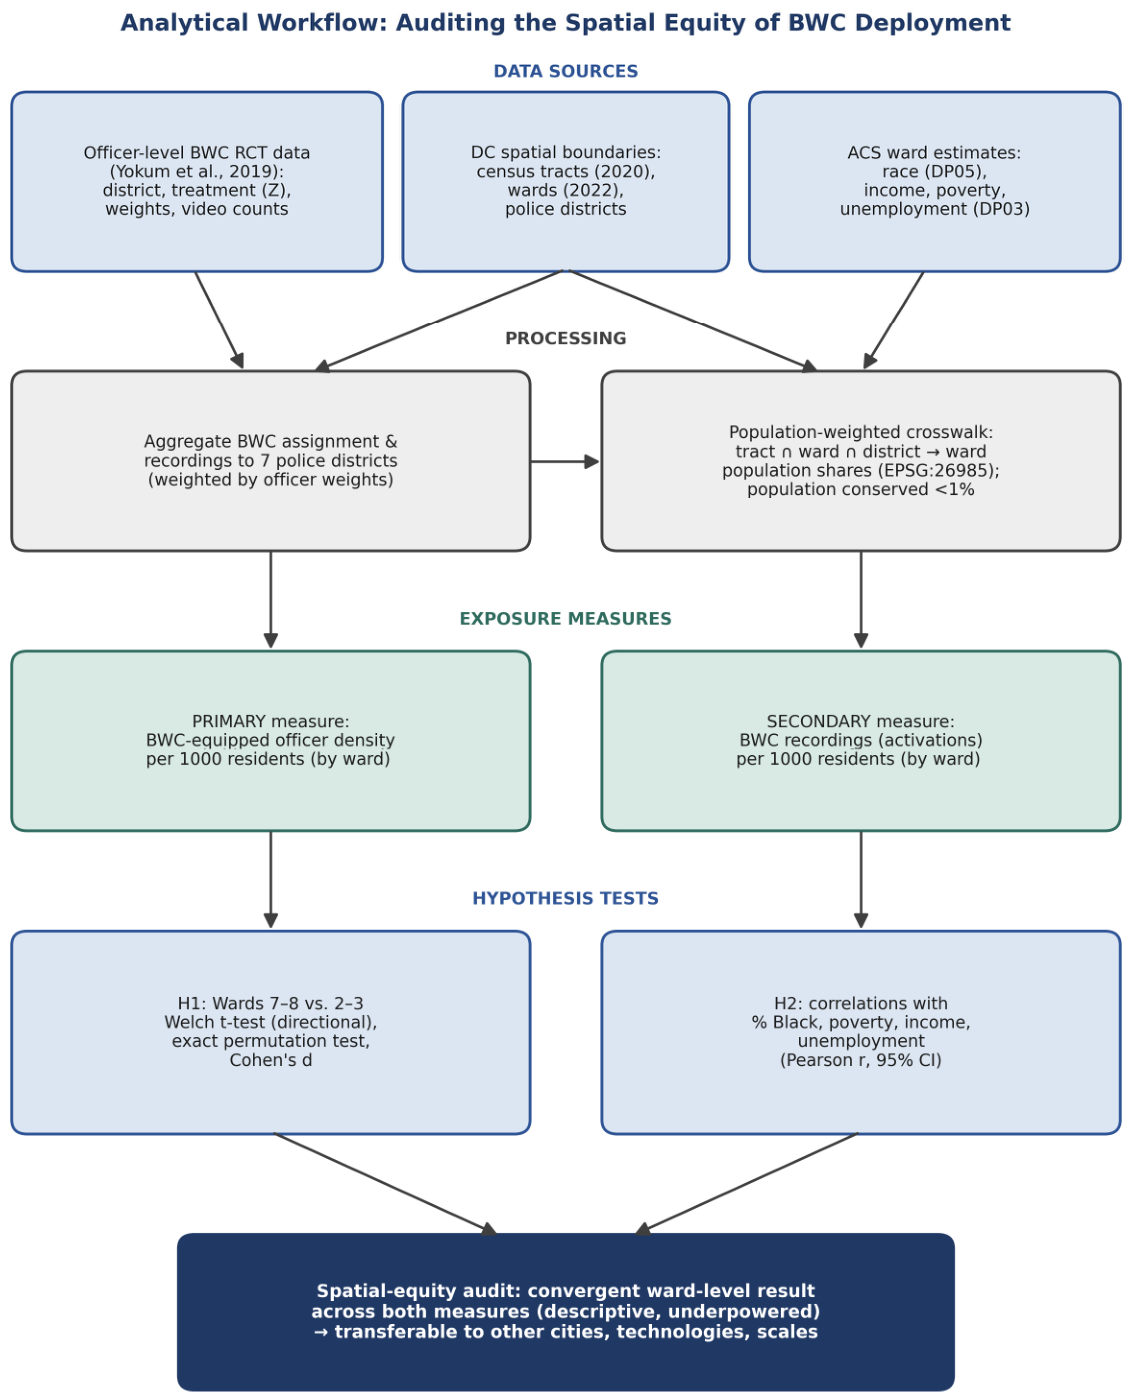
Figure 1 summarizes the analytical workflow, from data sources through district aggregation and the population-weighted crosswalk to the two exposure measures and hypothesis tests.
4.5. Ethical Considerations
This article relies exclusively on secondary analysis of publicly available administrative data. No human subjects were contacted, recruited, or directly observed. The data contain no individually identifiable information. Under the author’s institutional review board guidelines and the federal Common Rule (45 C.F.R. § 46.104 (d) (4)), secondary analysis of pre-existing, publicly available administrative datasets that do not contain individually identifiable private information is exempt from IRB review. This study was reviewed and determined to qualify for exempt status.
5. Results
5.1. Descriptive Analysis of Ward-Level BWC Exposure
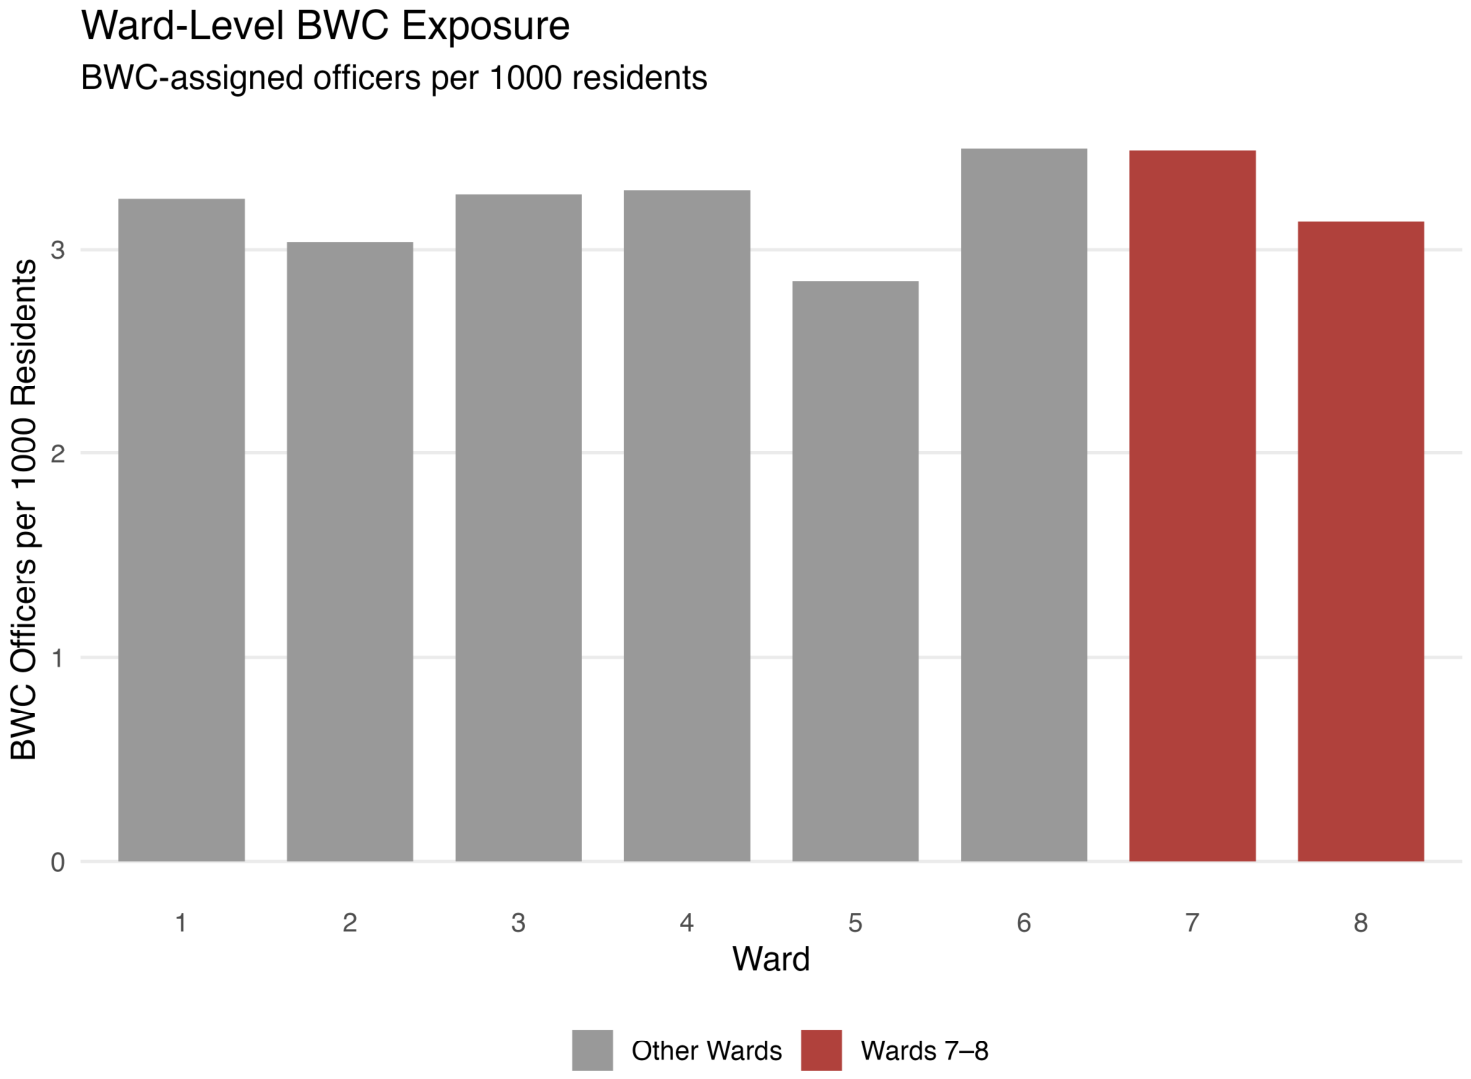
Descriptive analysis indicates modest variation in per-capita body-worn camera (BWC)—equipped officer density across Washington, D.C.’s eight wards, illustrating that a nominally race-neutral, district-based assignment did not produce uniform density at the ward scale. Estimated density ranged from 2.84 to 3.49 BWC-equipped officers per 1000 residents, with Ward 6 exhibiting the highest density (3.49) and Ward 5 the lowest (2.84)—a citywide range of 0.65 officers per 1000 residents. The two focal wards fell at different points in this distribution: Ward 7 was near the top (3.48), while Ward 8 (3.14) sat below the citywide midpoint, so the focal-ward group mean is carried largely by Ward 7 rather than reflecting a uniformly elevated pair.
Table 1 presents ward-level per-capita BWC exposure alongside total officer counts, ward population, and the percentage of Black residents, providing the descriptive foundation for the exposure comparisons and correlation analyses that follow.
Figure 2 displays BWC-equipped officer density across all eight wards. Ward 6 carries the highest citywide density at 3.49 BWC-equipped officers per 1000 residents, with Ward 7 close behind (3.48), while Ward 5 records the lowest at 2.84, producing a citywide range of 0.65 officers per 1000 residents.
5.2. Hypothesis 1: Focal-Ward Density Comparison
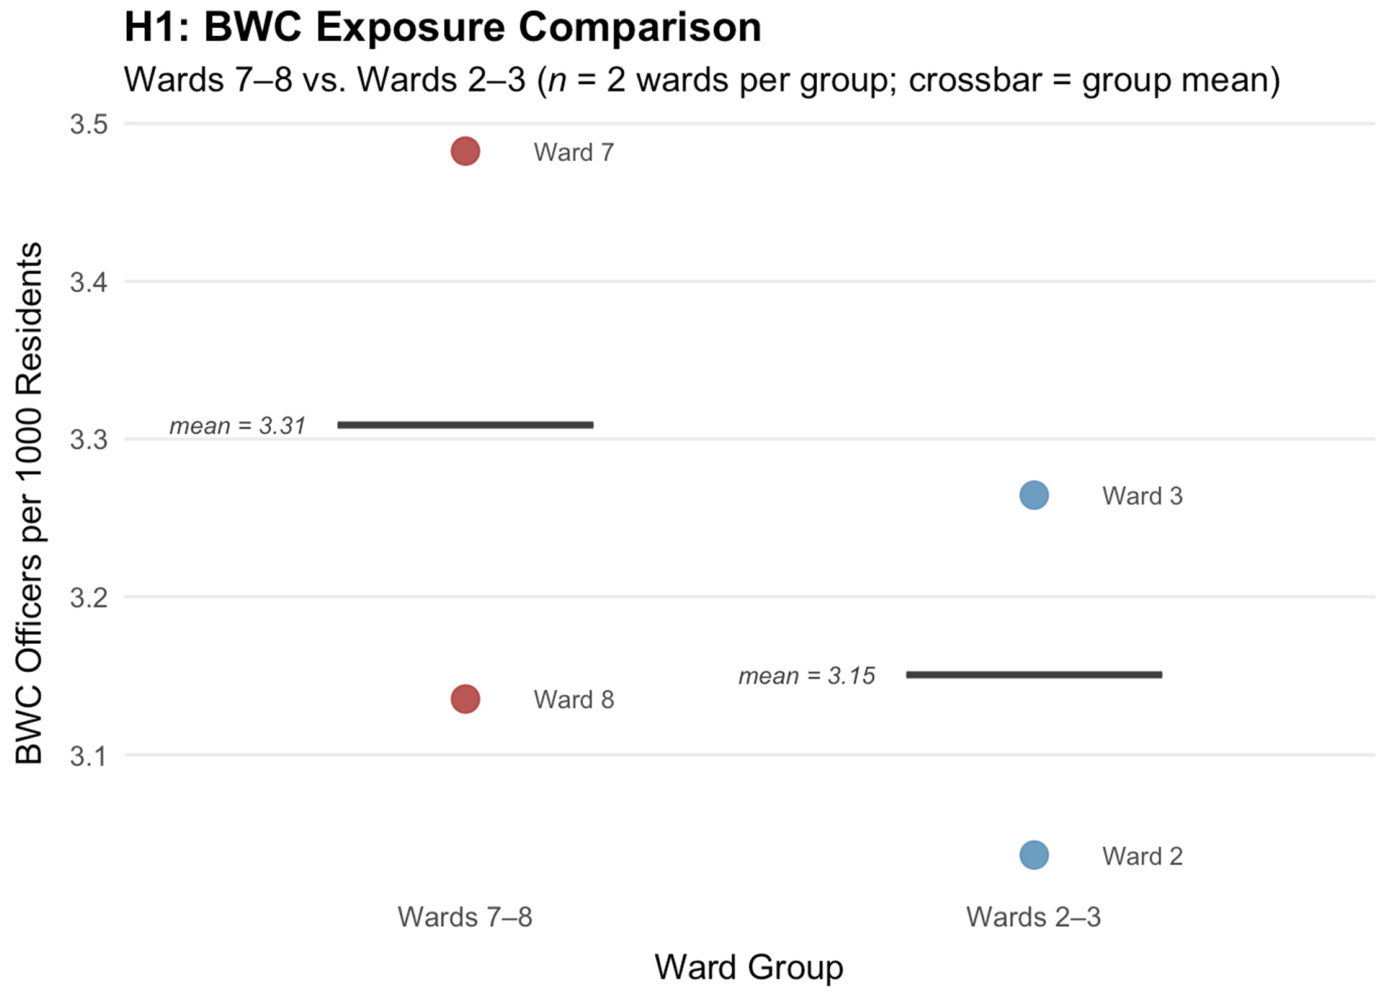
Comparisons between the focal and reference wards were directionally consistent with the hypothesized pattern but did not reach statistical significance. Wards 7–8 had a modestly higher mean BWC-equipped officer density than Wards 2–3 (3.31 vs. 3.15 officers per 1000 residents), a difference of roughly 5% (0.16 officers per 1000). The directional Welch t-test (Wards 7–8 > Wards 2–3) was not significant (t = 0.763, df = 1.73, one-sided p = 0.268; two-sided p = 0.536), with a medium-to-large standardized effect size (Cohen’s d = 0.763). Because each group contains only two wards, an exact permutation test was also computed across all six possible group assignments: the observed difference was equaled or exceeded in two of the six arrangements (one-sided p = 0.33), and the smallest p-value attainable under this design is approximately 0.17. These results are statistically inconclusive given the small number of geographic units rather than evidence of equitable density; conventional hypothesis testing provides limited evidentiary leverage when the units of analysis are few and politically defined.
A key finding is that BWC saturation among officers was constant across districts: exactly half of officers in every district were BWC-equipped, a direct consequence of the trial’s 50/50 randomization. What varied across wards was therefore not the proportion of officers equipped with cameras, but the intensity of officer deployment relative to population. Ward 7 had the highest concentration of officers (599 total; 299 BWC-equipped), yielding an officer-to-resident ratio 22% higher than Ward 5 (6.96 vs. 5.69 officers per 1000 residents). These patterns indicate that BWC-equipped officer density operated as a tracer for the underlying distribution of policing infrastructure rather than as an independent property of the camera program.
Figure 3 presents the distribution of BWC-equipped officer density for each ward group, showing that Wards 7–8 exhibit a higher mean density (3.31) and greater variability than Wards 2–3 (3.15), a directionally consistent pattern that nonetheless fell short of statistical significance given the severely limited sample of two wards per group.
5.3. Hypothesis 2: Demographic and Socioeconomic Correlates
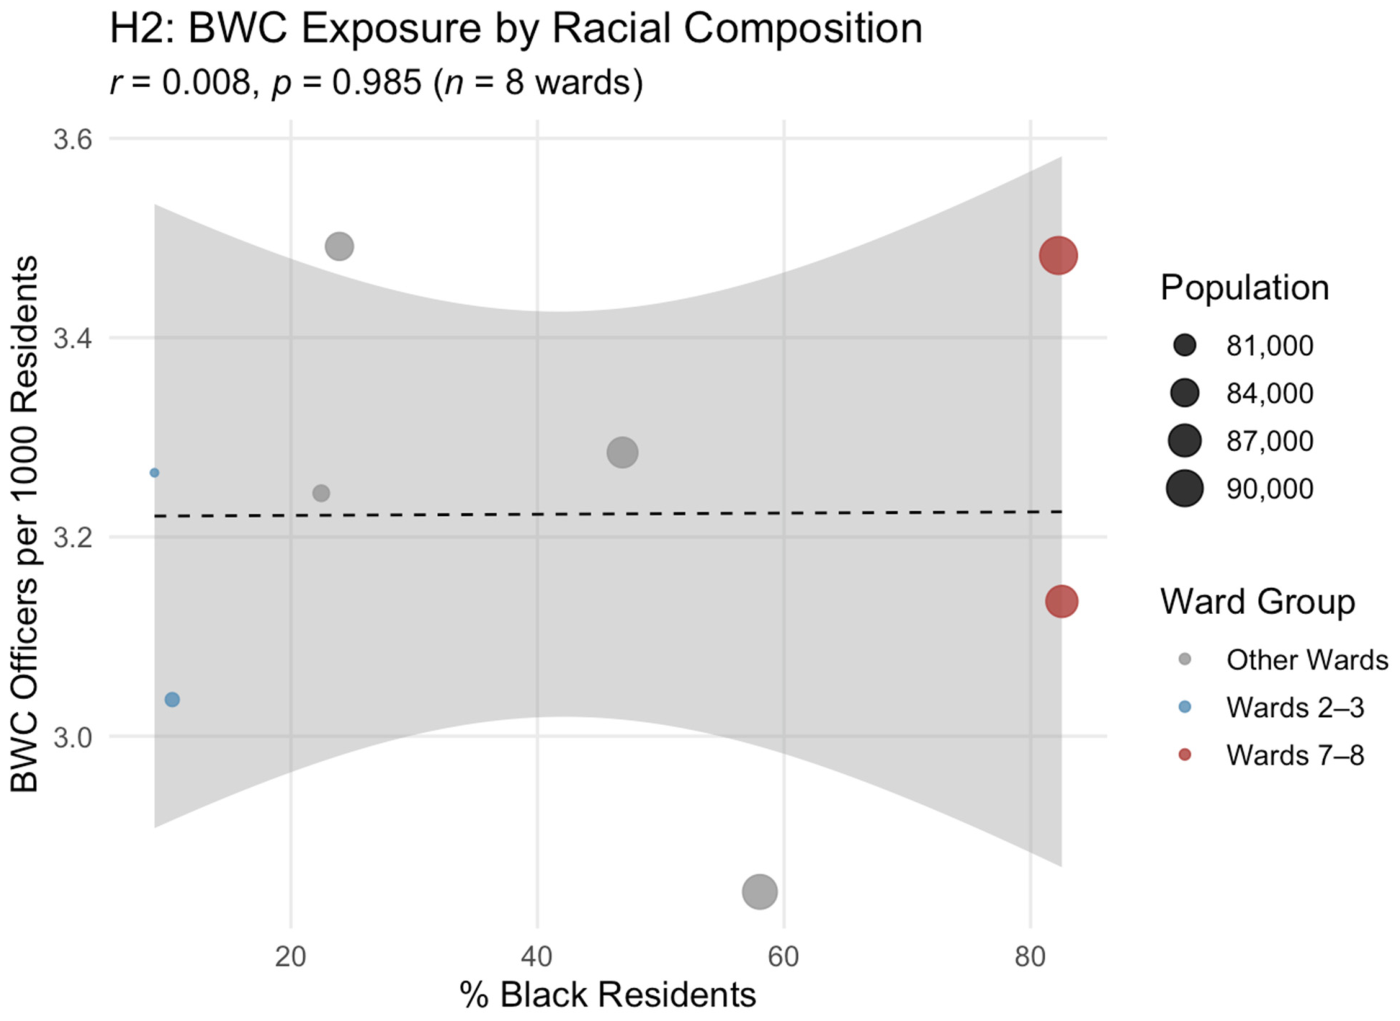
Correlation analyses assessed whether ward-level BWC exposure covaried with racial composition and socioeconomic conditions. Across all eight wards, Pearson correlations between per-capita BWC exposure and demographic indicators were uniformly weak and statistically non-significant: percent Black residents (r = 0.008, p = 0.985), poverty rate (r = 0.069, p = 0.871), median household income (r = 0.106, p = 0.802), and unemployment rate (r = 0.101, p = 0.811). These estimates do not provide evidence of a systematic linear relationship between ward exposure and these covariates at the ward level.
These null correlations must be interpreted in light of extreme power limitations. With only eight observations, confidence intervals spanned approximately moderate negative to moderate positive values, meaning the data cannot distinguish between no relationship and a meaningful association in either direction. The absence of statistically significant correlations should not be interpreted as affirmative evidence that BWC exposure was unrelated to race or socioeconomic status.
A supplementary chi-square test explored whether wards classified as high exposure (above median) were disproportionately characterized by high poverty. The result was not statistically significant (χ2 = 0.5, p = 0.48), and expected cell counts were below conventional thresholds. The counterintuitive direction of this result—higher BWC exposure in lower-poverty wards in the full eight-ward distribution—reflects the specific composition of the comparison set and the fact that Wards 7–8 (highest-poverty, majority-Black) exhibited directionally higher per-capita BWC exposure than Wards 2–3, consistent with the primary hypothesis.
Figure 4 plots per-capita BWC exposure against the percentage of Black residents in each ward, with bubble size scaled to ward population; the near-zero correlation (r = 0.008,
p = 0.985) reflects not an affirmative finding of equitable distribution but rather the severe statistical constraints of an eight-unit analysis, which cannot reliably distinguish no association from a substantively meaningful one.
5.4. Realized Recording: BWC Activations per Capita
BWC-equipped officer density measures the potential for recording but not its realization. To capture realized recording directly, a post hoc secondary measure was constructed from the replication file’s officer-level video counts, which record the number of videos each camera-equipped officer generated during the post-deployment period. Because cameras were assigned at a constant 50% rate, this measure captures variation the density measure cannot: differences in how frequently equipped officers actually activated their cameras. District-level recording totals were apportioned to wards using the same population-weighted crosswalk and expressed as BWC recordings per 1000 residents. This measure is reported as a robustness extension rather than a pre-specified test; like the primary analysis, it remains severely underpowered at the ward level.
Under this measure, the focal–reference contrast is modestly larger than for officer density but remains statistically inconclusive. Wards 7–8 averaged 1275 BWC recordings per 1000 residents versus 1149 in Wards 2–3—a gap of approximately 11%, compared with roughly 5% for officer density. The directional Welch t-test did not reach significance (t = 0.720, df = 1.12, one-sided p = 0.296), and the exact permutation test returned p = 0.500. Activation rates are computed at the police-district level, the finest unit to which officers are resolved, and are essentially flat across the city (range approximately 333 to 458 recordings per equipped officer). The districts that contribute most of the population of the focal wards (Districts 6 and 7) average about 372 recordings per equipped officer, against about 361 for the districts contributing most to the reference wards (Districts 2 and 3)—a difference of roughly 3%. The small ward-level gap therefore arises mainly from differences in officer numbers across the districts that serve each ward, not from systematically higher camera activation in the districts serving the focal wards.
Correlations between recordings per 1000 residents and ward characteristics were uniformly weak and statistically non-significant, mirroring the near-zero pattern observed for officer density: percent Black residents (r = 0.046, p = 0.914, 95% CI [−0.68, 0.73]), poverty rate (r = 0.008, p = 0.986), median household income (r = 0.160, p = 0.705), and unemployment rate (r = −0.016, p = 0.971). Every confidence interval is wide and spans zero. The more direct measure of realized recording thus shows no detectable association with racial or socioeconomic composition at the ward level, corroborating, rather than overturning, the primary analysis.
Taken together, the two operationalizations converge: neither BWC-equipped officer density nor the more direct measure of realized recording shows a statistically detectable disparity by race or class at the ward level. This convergence strengthens the primary finding by showing it is not an artifact of how exposure is measured. It is worth noting that the city itself is sharply stratified along the dimensions tested—median household income ranges from roughly $51,000 in Ward 8 to over $140,000 in Ward 3, and unemployment from about 3% to 14%—yet neither surveillance measure is detectably patterned onto that gradient at this geographic scale. BWC-equipped officer density is retained as the study’s primary, pre-specified indicator, with the activation measure reported as a robustness check; both remain underpowered at eight units, so the convergent null is best read as the absence of a detectable ward-level disparity rather than affirmative proof of equitable distribution.
6. Discussion
The analyses yield three descriptive conclusions. First, ward-level estimates are directionally consistent with the hypothesized pattern: Wards 7–8 showed roughly 5% higher mean BWC-equipped officer density than Wards 2–3, with a medium-to-large effect size, though this group mean is carried largely by Ward 7 and the comparison is not statistically distinguishable from chance at this design. The contrast is therefore treated as a hypothesis-generating pattern rather than a confirmed disparity. This result both echoes and qualifies international scholarship: like Glasbeek et al.’s [
9] Canadian analysis, it treats body-worn cameras as a technology that can track existing patterns of police visibility rather than neutralize them, but unlike studies that infer disparity from deployment alone, the present audit finds that at the ward scale the distribution is not statistically distinguishable from proportionality, underscoring that the equity signal depends heavily on the spatial unit at which surveillance is assessed. The broader implication is methodological: governance systems should be capable of flagging and contextualizing candidate patterns of unequal density without waiting for statistical certainty that may be structurally unattainable at coarse geographic scales.
Second, BWC saturation was constant across districts; exactly half of officers in every district were camera-equipped yet ward-level density varied across the city. What differed was not the proportion of officers carrying cameras but the intensity of officer deployment relative to residential population. BWC-equipped officer density, in this analysis, functions as a window into pre-existing deployment patterns rather than as an independent spatial intervention introduced by the experiment. The central equity question therefore lies upstream—in the institutional practices that determine where officers are concentrated and how those deployment decisions are reported and justified publicly. The activation measure (
Section 5.4) reinforces this point rather than complicating it: the more direct measure of realized recording shows the same near-zero association with race and class as the headcount measure (a modest, non-significant ~11% focal-ward gap), so the convergent finding is that camera deployment is not detectably patterned onto the city’s steep racial and economic stratification at the ward level even though that stratification is itself pronounced.
Third, the absence of statistically significant ward-level disparities should not be read as validation of the RCT’s equity performance. Rather, it demonstrates that aggregate deployment exposure metrics may be insufficient indicators of surveillance equity. These results point to a critical distinction between formal assignment neutrality and substantive governance equity: a process can be procedurally race-neutral at the design stage while still producing conditions that warrant ongoing institutional scrutiny.
6.1. Limitations
Several limitations bound the interpretation of these results. The most consequential is statistical: with only eight wards—and two per group in the focal comparison—the analysis is severely underpowered, and confidence intervals for every correlation span from moderate negative to moderate positive values. The design can neither confirm a ward-level disparity nor rule one out, and the reported nulls should be read as inconclusive rather than as affirmative evidence of equitable distribution.
Second, the findings are sensitive to the spatial unit of analysis—an instance of the modifiable areal unit problem. Because officers can be resolved only to the seven police districts, ward-level exposure is interpolated from district-level assignment through a population-weighted crosswalk rather than measured directly; this introduces an ecological-inference step and assumes officer presence within a district tracks residential population. Aggregating to a different unit, such as census tracts or police service areas, could yield a different equity signal.
Third, the analysis relies on ward-level aggregates and publicly available administrative records that may under- or over-represent particular enforcement activities, and it captures the presence of camera-equipped officers rather than any individual resident’s realized likelihood of being recorded. The secondary activation measure (
Section 5.4) moves closer to realized recording but inherits the same district-level attribution and cannot separate higher camera-activation behavior from a higher underlying rate of police–citizen encounters; downstream footage retention and access are not observed. Finally, the study is deliberately bounded to a single city, a single technology, and a single historical window (2015–2017).
6.2. Transferability
Although the empirical findings are specific to Washington, D.C., the study’s approach and central argument are designed to transfer. Methodologically, the per-capita exposure audit—apportioning officer- or asset-level assignment data to residential geography through a population-weighted crosswalk and testing the result against demographic and socioeconomic gradients—can be applied wherever comparable deployment data are published, whether for other body-worn camera programs, automated license plate readers, CCTV analytics, gunshot-detection systems, or other spatially distributed public-safety infrastructure. The framing of surveillance as an urban public good subject to the same spatial-equity standards as transit, schools, or environmental burdens is likewise portable across cities and technologies.
The study’s most transferable contribution is conceptual: the finding that a formally race-neutral deployment mechanism can nonetheless produce uneven exposure because it is layered onto a pre-existing, unequal distribution of enforcement resources. This upstream logic—locating the equity question in deployment intensity rather than in the neutral technology itself—applies to any ostensibly neutral system introduced into a structurally stratified urban environment, and it motivates a governance response (sustained, geographically disaggregated monitoring rather than one-time significance testing) that generalizes independently of any single jurisdiction.
Transferability is nonetheless conditional. Applying the approach elsewhere requires deployment data resolved to some usable spatial unit; results remain sensitive to that unit’s scale; and D.C.’s distinctive features—its status as a federal district without full home rule, and its unusually sharp east-of-the-river racial and economic stratification—both sharpen the test and limit direct generalization to cities with different governance structures and settlement geographies. The framework travels; the specific magnitudes do not.
7. Conclusions
This article examined whether the Metropolitan Police Department’s 2015–2017 body-worn camera randomized controlled trial generated geographically uneven BWC-equipped officer density at the ward level in Washington, D.C. Three principal findings emerged. First, Wards 7–8 showed roughly 5% higher mean density than Wards 2–3 (3.31 vs. 3.15 BWC-equipped officers per 1000 residents), a directionally consistent pattern with a medium-to-large effect size (Cohen’s d = 0.763) that the data were too underpowered to confirm statistically and that is carried largely by Ward 7; it is therefore reported as descriptive rather than confirmatory. Second, ward-level correlations between density and racial and socioeconomic indicators were uniformly weak and non-significant—reflecting severe statistical limitations rather than affirmative evidence of equitable distribution. Third, variation in density was driven not by the camera-assignment mechanism but by underlying differences in officer deployment intensity: cameras were assigned to officers at a constant 50% rate, but officers were not distributed in proportion to residential population.
These findings make three contributions. First, they provide the first ward-level per-capita analysis of exposure produced by the MPD BWC trial, adding a geographic equity dimension to a literature focused exclusively on behavioral outcomes. Second, they demonstrate that standard inferential methods are structurally ill-suited to detecting or ruling out meaningful disparities at the ward level, establishing the case for governance-centered monitoring approaches that operate independently of statistical significance thresholds. Third, they reframe the central equity question from the camera-assignment mechanism to the broader policing infrastructure that BWC data make visible.
The way forward for equitable surveillance governance requires moving beyond point-in-time statistical tests toward sustained institutional monitoring of deployment patterns, disaggregated by race and geography, as a standard element of public accountability for AI-enabled policing technologies.
8. Suggestions for Further Research
Findings from this article motivate additional research on ward-level deployment patterns for other AI-enabled public safety technologies, including automated license plate readers (ALPR), CCTV analytics, and predictive policing tools, where deployment decisions are not governed by randomized experimental designs. Future studies should examine whether formally neutral deployment processes produce equitable exposure when scaled beyond controlled trials into routine operational use. Longitudinal analyses tracking surveillance exposure over time as new technologies are procured would help assess whether equity observed during experimental phases persists under non-experimental conditions. In addition, qualitative and survey-based research examining how residents in Wards 7–8 and Wards 2–3 perceive and experience surveillance would complement spatial exposure metrics by capturing lived impacts not visible in administrative data [
45,
46]. Future work could also extend this approach through census tract-level disaggregation, which would substantially increase the number of geographic units and statistical power.