1. Introduction
In more developed contexts, cadastres are commonly argued as a key component in guaranteeing land tenure security [
1]. However, in many of these countries, there still exists a dearth of credible land rights records [
2]. Underlying causes are often political, legal, economic, and social—however, technology can also impede development: selected tools and designed procedures are often anachronistic or lack alignment with the context where they are applied. Conventional ground-based cadastral surveying and mapping methodologies are time consuming and labour intensive. Continuing to use these approaches, it is suggested, would mean that many countries would not experience anything near cadastral completeness for decades or even centuries [
3].
Beyond the initial establishment of cadastres, another challenge is keeping cadastral systems up-to-date: transfers of ownership, parcel subdivisions, and consolidation need to be recorded in as close to real-time as possible. Cadastres must reflect the current status of land tenure holdings [
4]. They must be kept in an “up-to-date” manner: people and land relations are complex and dynamic [
5]. This demand for instantaneity makes cadastral mapping intensive in terms of the number of professionals, processes, and institutions involved. In poorer countries, the time and costs involved are prohibitive and land users and holders often revert to informal or non-statutory systems of land trading and development.
In order to combat the challenge of cadastral establishment and maintenance, innovative and increasingly automated methods are demanded and keenly investigated. An emerging area of automation involves detecting, extracting, or reconstructing visible boundaries, as patterns or objects, from representations of physical objects in imagery or point cloud data. Crommelinck et al. [
6] provides a comprehensive review of developments regarding the former. Specific examples are also found in van Beek [
7] where a workflow to extract general boundaries from Airborne Laser Scanning (ALS) point clouds are created; Xiao, Gerke, & Vosselman [
8] where buildings are reconstructed through detection; Mumbone et al. [
9], who investigated using UAVs, automation, and community participation to create cadastral maps; and, Wassie, Koeva & Bennett [
10], who developed a workflow to semi-automatically extract topography boundaries from satellite images. Other cases are shown in [
11,
12,
13]. A challenge for all of these studies is the limited knowledge on the morphology of parcel boundaries: prior to building the automated solutions it is often unclear what exactly needs to be measured, detected, extracted, and vectorized to create the cadastral maps.
In different areas, parcel boundaries might be marked by various kinds of physical objects: roads, buildings walls, or water bodies may coincide with cadastral boundaries—particularly general boundaries. Parameters of these physical objects should therefore be clearly defined. However, cadastral boundaries are fundamentally a human construct, and not all of these boundaries are visible. Likewise, not all detectable features coincide with cadastral boundaries. van Beek [
7] researched the relationship between general boundaries and topographic features. He took rural areas in the Netherlands as case study material, and pointed out that road sections, water sections, and delimitation of courtyard mark a large portion of cadastral boundaries. However, only very few cities worldwide have dense networks of water channels: the Netherlands is not a universal case. Meanwhile, Wassie et al. [
14] found that in rural area of Ethiopia, where the general cadastral boundary approach is applied. In this study, many cadastral boundaries were visible from satellite imagery and were doubled with topographical boundaries, farmland boundaries and roads, but fluctuating topography and farmland are less likely to occur in an urban area. Building from their work, this research seeks to more thoroughly quantify the relationship between physical objects and visual boundaries—specifically in urban areas of a less developed context, where the very urgent need of accelerated cadastral surveys is typically present. By acquiring knowledge on what kind of physical objects have connection with cadastral parcel boundaries, a more aligned survey and mapping strategy can be developed that focuses on detecting these objects: with the help of automatic feature extraction techniques, both time and labor cost could be significantly saved, and then the effectiveness and efficiency of cadastral surveying could then be increased.
By investigating the morphology of visible parcel boundaries in a developing country, this paper aims to provide supportive evidence for the development of automated methods to generate cadastral boundaries: define what the targets objects for automated cadastral survey are, describe the cadastral boundary morphology, and quantify the possibility of delineating cadastral boundary from physical land objects. To this end, this paper first revisits pre-existing boundary and cadastral boundary concepts, with more attention being paid to the history of utilizing physical land objects to demarcating property boundaries—which is a general or visible cadastral boundary in this case. Then, how they relate to the study area in Vanuatu is illustrated. An overview of the methodology, based upon the object-based approach is then provided. Results are outlined and discussed in a subsequent section in terms of proportion, possibility of coincidence, and characteristics. Based on the key observations stemming from the research, conclusions along with recommendations for future research are provided.
2. Background
An initial overview and definition of the concept of cadastre is essential for this study: definitions of cadastres determine the nature of cadastral boundaries and the subsequent boundary morphologies. Convention suggests a cadastre is a comprehensive record of the real property’s boundary and ownership [
15]—and is a key component of a broader land administration system that captures and maintains changes about people-to-land relationships [
16]. It is often described as “official”, and may record information about ownership, value, use, location, and dimensions [
1]. Similarly, Zevenbergen [
17] describes cadastres as systematically arranged public registers of property data, which depend on the survey of property boundaries. These definitions are backed by the International Federation of Surveyors (FIG), who emphasize the parcel-based nature of cadastres [
18]. In both historical and contemporary settings, cadastres contribute to important societal activities and may have juridical or fiscal roots [
17,
19,
20]. Multipurpose cadastres emerge as another alternative, at least in Anglophone literature post-1970, however, the concept has its roots in Germanic registers that were developed in the 1800s [
16].
Going beyond broad definitions, a cadastre is usually described as consisting of two parts: a geographic part, which is normally represented as maps or plans, and a descriptive part, called a register or index [
17]. Increasingly, the two components are merged into integrated digital land information systems—built upon an underlying data model [
21]. The map, sketch, or plan component is of prime interest to this research. It is considered as a graphic representation of the unit of land that supplies additional assurance of its spatial existence [
15]. However, the map is only one artefact of the existence of a cadastral boundary: it is the mere virtual or recorded component. Other components include the boundary’s spatial aspects, which include human-based perceptions of its existence, its physical presence (material, shape, spatial location), and its temporal presence [
22]. On the human-based perception component, according to the concept of “subject-object-right” relationships in a cadastre, a boundary involves two related parties.
Legal and administrative systems are created that support the adjudication, demarcation, surveying, and mapping of these cadastral boundary components [
23]. “In a legal sense, a boundary is a vertical surface that defines where one land owner’s territory ends and the next begins”: each parcel survey must be related to the adjoining properties [
24]. Broadly speaking, two major administrative alternatives are discussed in literature: “fixed” vs. “general” boundary mapping approaches [
1].
A fixed boundary is a specific boundary that has been accurately surveyed, where agreements on location are made at the time of adjudication of the land. Therefore, lines and corner points of fixed boundaries are fixed in space, by the parties involved: location cannot change without appropriate documentation and due procedure [
24]. Fixed boundaries provide sufficient confidence for the register [
20]. In fixed boundary approaches, a surveyor’s measurement serves as important evidence: whether a boundary is fixed or not depends on whether there has been a survey [
17]. Additionally, in fixed systems, boundary lines are invisible and precise measurements need to be done for retracement [
17].
In contrast, a general boundary is where the line between adjoining parcels is left undetermined [
16]. In these cases, the boundary is physically marked by a person-made or natural object: less emphasis is placed on its precise and definitive location. Giving priority to land registration procedures, a gap with unspecified width or uncertain ownership may occur—and this is considered reasonable. Therefore “fuzziness” in cadastres—with regards to the spatial dimension—enables using general boundaries between parcels while still guaranteeing the title of each [
16]. The major advantages of such a general boundary is that fewer surveys are required. Maintenance of the cadastral register is generally cheaper and convenient. The approach is particularly useful in sporadic adjudication when demarcation occurs: consulting the owners of the adjoining properties is not compulsory [
16], but is usually pertinent.
In this work, the ultimate aim is to support alternative methods for developing cadastral maps, specifically automating methods for capturing and recording boundary information. In this regard, the morphology of cadastral boundaries, particularly general cadastral boundaries, is of high interest. The morphology of cadastral boundaries depicts the boundary’s spatial aspects, which include human-based perceptions of its existence, its physical presence (material, shape, spatial location), its temporal presence, and its virtual presence—and these characteristics can be used to form the basis for developing an automated image-based cadastral mapping approach [
14,
22].
Ideas for alternative cadastral mapping approaches are not new: cadastral establishment has been a focus for international development community in the post-Cold War era. Establishment processes, using conventional surveying and mapping approaches, have been proved to be much slower than desired. Alternative approaches and mind-sets have emerged for cadastral implementation and completion: “fit for purpose” concepts and approaches are the embodiment of these [
25,
26]. To this end, an alliance of “fit for purpose” or “pro-poor” land tools is developed under the Global Land Tool Network (GLTN) initiative, amongst others, in order to establish full coverage “fit for purpose” cadaster in countries where cadastral coverage is limited [
27,
28]. In these documents, general boundary approaches are heavily promoted (cf. GLTN 2016).
As per alternative cadastral methods more generally, the idea of using general boundary approaches—or visible boundaries—to map land interests is certainly not new. There exists substantial history in utilizing natural features for demarcating political, administrative, or legal boundaries [
22]. However, as mentioned, this approach aligns positively with the current societal pull for fast and recognizable clarity on property ownership in contemporary settings where increasing populations and denser land use patterns prevail. According to Smith [
29], the distinction between “bona-fide” and “fiat” boundaries, the legislative process towards “fiat” of natural boundaries, is always a challenge. Bennett et al. [
22] develops a model for utilizing natural boundaries in multi-disciplinary fields, and points out that—alongside physical characteristics—understanding why a natural boundary is perceived to exist, its purpose in an administrative sense, and how it is graphically or textually captured are all equally important characteristics of the boundary that need to be taken into account. Therefore, notwithstanding the fuzzy nature of natural and physical objects as boundaries that are utilized in a cadastral system, they are useful in enhancing legal clarity and reducing ambiguity [
30]. Despite the temporal instability of natural boundaries, they are perceived to exist in human conceptions—which equally makes them visible from computer based imagery from the air.
Supporting the societal pull for faster property recordation is the technology push coming from advances in remote sensing, photogrammetry, and geo-information science. Image-based methods are considered to enable fast and more economically efficient mapping in many contexts. Since visual boundaries can be easily identified from images, automatic feature extraction techniques are now maturing and can be used to assist spatial data creation, even for cadastral purposes [
6,
14,
21]. Extracted vector data that represents visual cadastral boundaries can be digitally obtained from images using a range of imagery processing tools [
21]. Subsequently, interpretation and editing of the vectors—based on comparisons from expedited fieldwork processes, including participation from local stakeholders, can take place and a draft cadastral map is prepared. In this way, much less person-power would be needed in the field. It is estimated that time and cost for surveying mapping, consuming up to 25% of any land administration intervention, could be significantly reduced. However, reliable quantifications of these savings are difficult to make: the number of physical objects that double as cadastral boundaries is unknown. It is this final point that drives the work at hand project [
1]. As already disclosed, this study explores the overlap of visual boundaries that coexist with physical objects, and how these can be extracted from remotely sensed data.
3. Contextualizing the Study Area
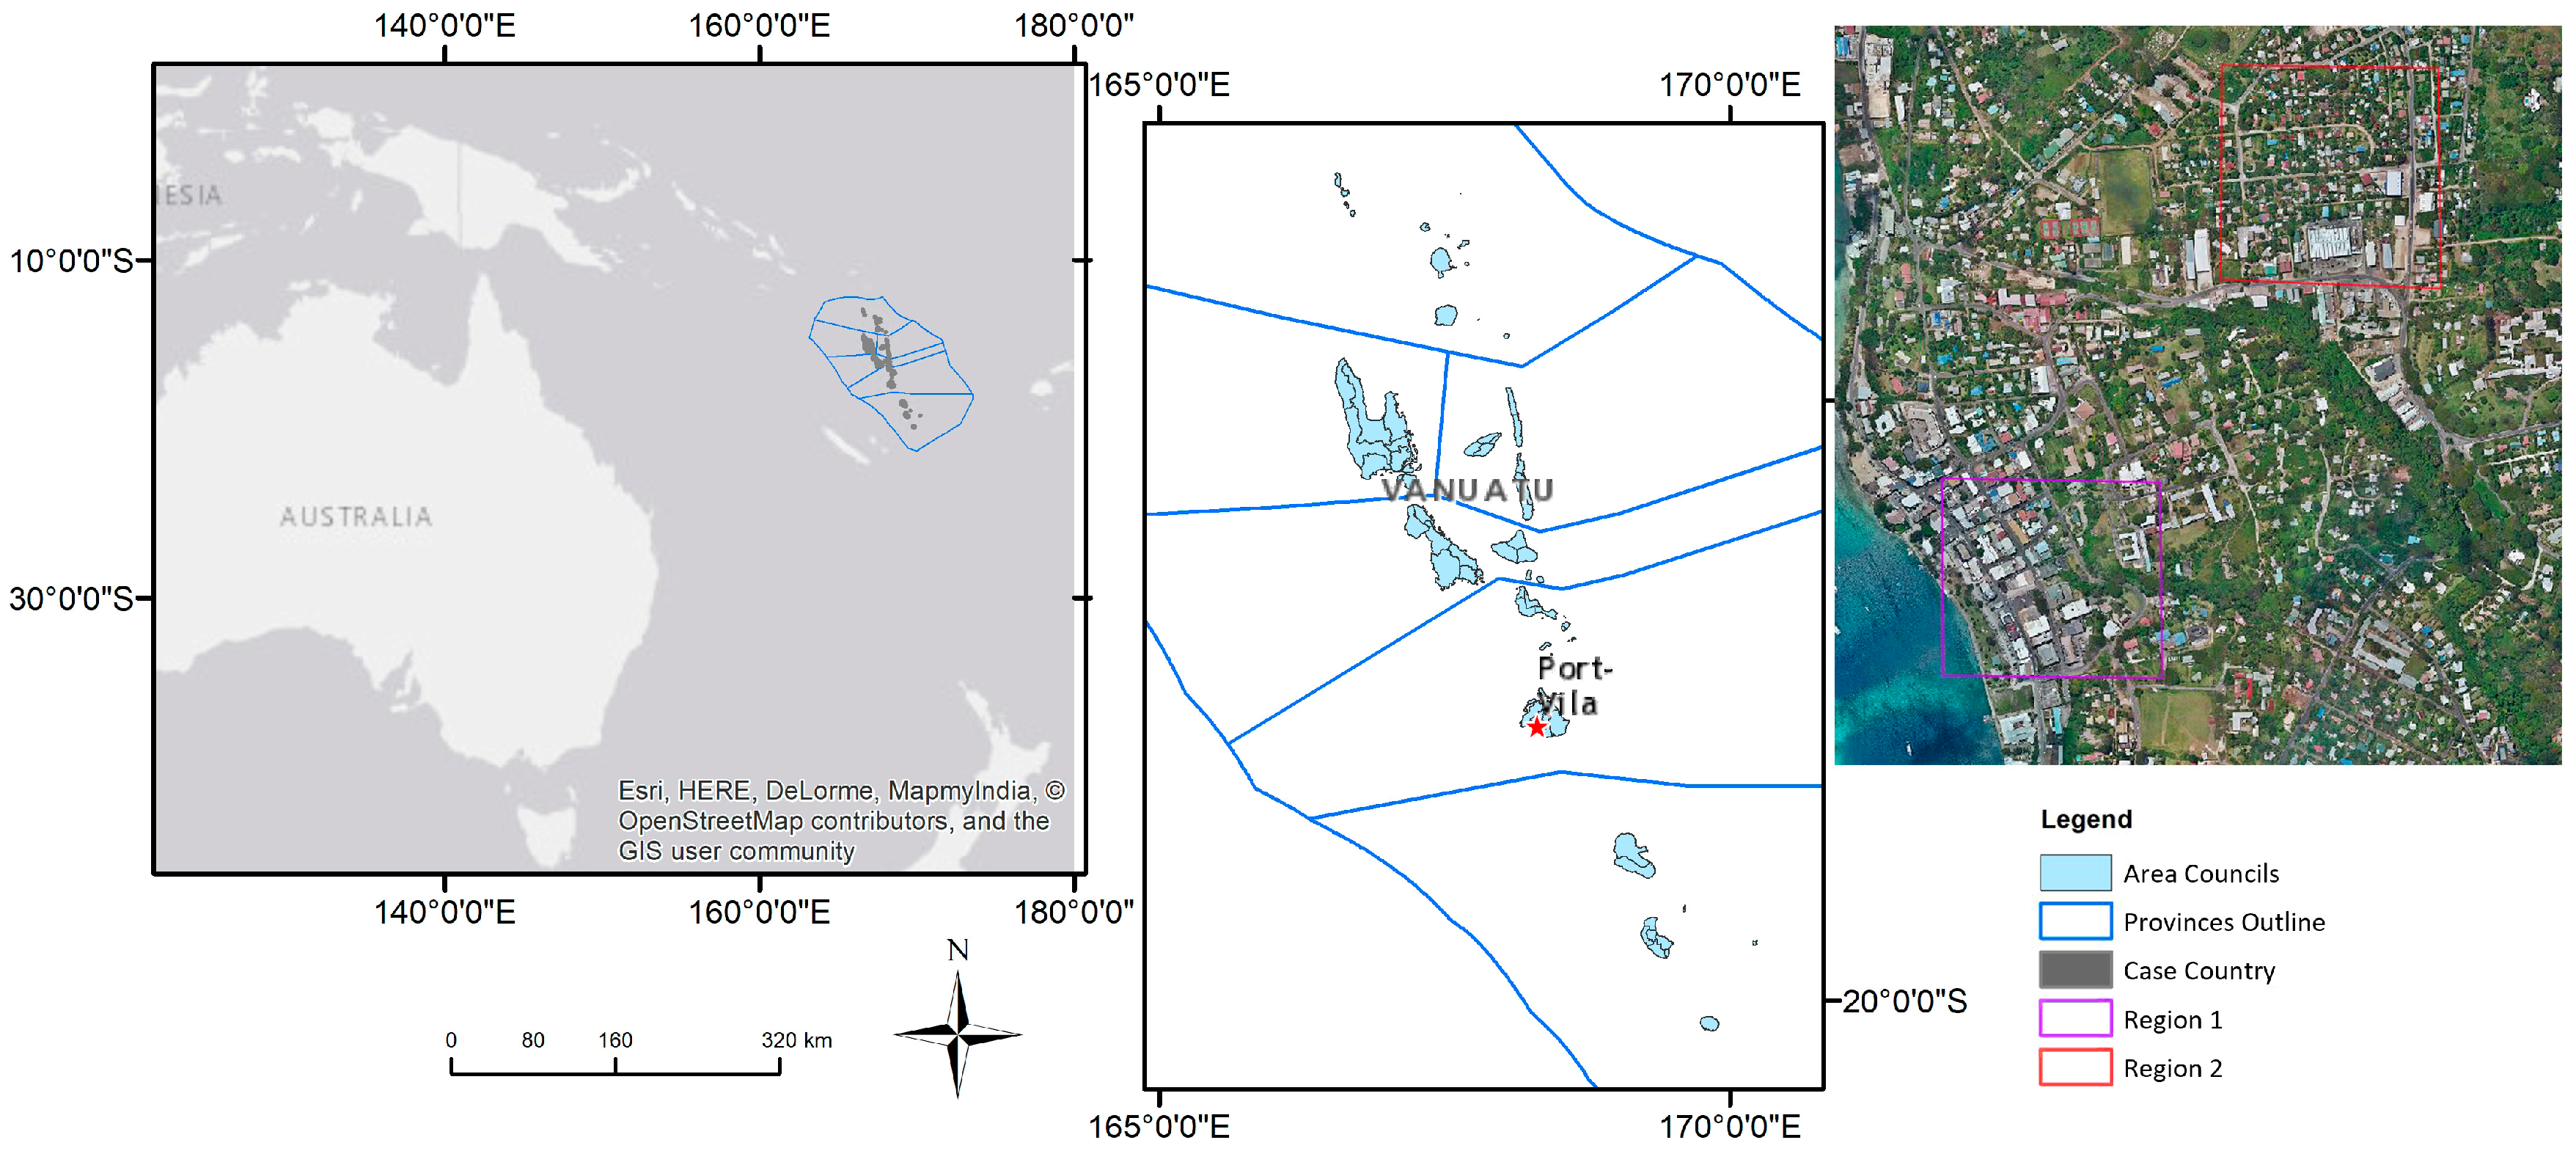
The selected case location is Port Vila, located on the island of Efate in Vanuatu. The key reasons for selecting Port Vila include data availability and its status as a developing country. Located in a seaside area, the topography of Port Vila is comparatively flat. As a capital city, land parcels in Port Vila are densely arranged, without any river network involved. Constructions are mostly stand-along buildings rather than high-rise buildings or connected apartments. A cadastral mapping project was recently completed across the island and concurrent work was undertaken to capture aerial imagery data by CRC-SI of Australia to support land management activities, specifically climate change response and adaptation measures.
In this vein, Vanuatu was considered ideal for conducting the quantitative study: it had both recently captured cadastral maps and orthophotos—they are up-to-date, enabling comparative boundary analysis. Unlike most urban contexts, the high accuracy cadastral records and high resolution orthophoto are transparent to the public. The boundary data was sourced from the Ministry of Land and Natural Resource of Vanuatu. The cadastral map provided was created using data originally measured by DGPS survey and digitized in a GIS environment [
31]. The orthophoto across Port Vila was supplied by CRC under confirmation. The morphology of Vanuatu arguably provides an ideal representation of a less developed context, where innovative survey methods are needed to finalize and complete cadastral and land registration activities.
Vanuatu is a Y-shaped archipelago, consisting of about 82 relatively small, volcanic origin islands.
Figure 1 gives an overall view of the territory of Vanuatu. This study focuses on urban area, where land rights are complex arranged. It is clear that even within Port Vila, the land parcels distribution present vary in terms of in shape and density. To clarify the influence of land parcels’ characteristics on cadastral boundary morphology, two regions—dense urban region and suburban region—are subseted for investigate separately, as shown in
Figure 1.
In contemporary times, two land tenure systems run in parallel in Vanuatu: a formal deeds system inherited from the colonial period, and an un-codified customary system [
32,
33]. Different cultural backgrounds relating to the two tenure systems cultivate conflicts in the perception and conceptions of tenure rights [
34]. Arguably, the lack of security provided via written regulation and a concrete register means land conflicts happen frequently on uncodified customary land [
35]. Until recently, registering land in the formal system was a voluntary action [
34]. Parcel boundary markers tend to be the physical features in the land—such as trees, stones, and streams—although, quantities of each type are unknown [
36].
Modern Vanuatu is facing increasing urban migration, especially to Port Vila. Its increasing population is placing growing pressure on land and resources [
37]. The past twenty years have witnessed an increase in land disputes, as well as the establishment of widespread urban squatter settlements and informal housing [
38]. Real time records of customary land not only remain important, but are becoming increasingly significant [
32]. A simpler and faster cadastral survey method, such as imagery based automated boundary extraction, which enables the capture of the changes could help in the maintenance of land records. In view of the urgent demand for a full coverage of the cadastral map, Vanuatu has accelerated its cadastral survey procedure [
36]. The Vanuatu Land Program, a long-term commitment by the Government of Vanuatu Land Sector Framework, is carried out to implement land sector reforms [
39].
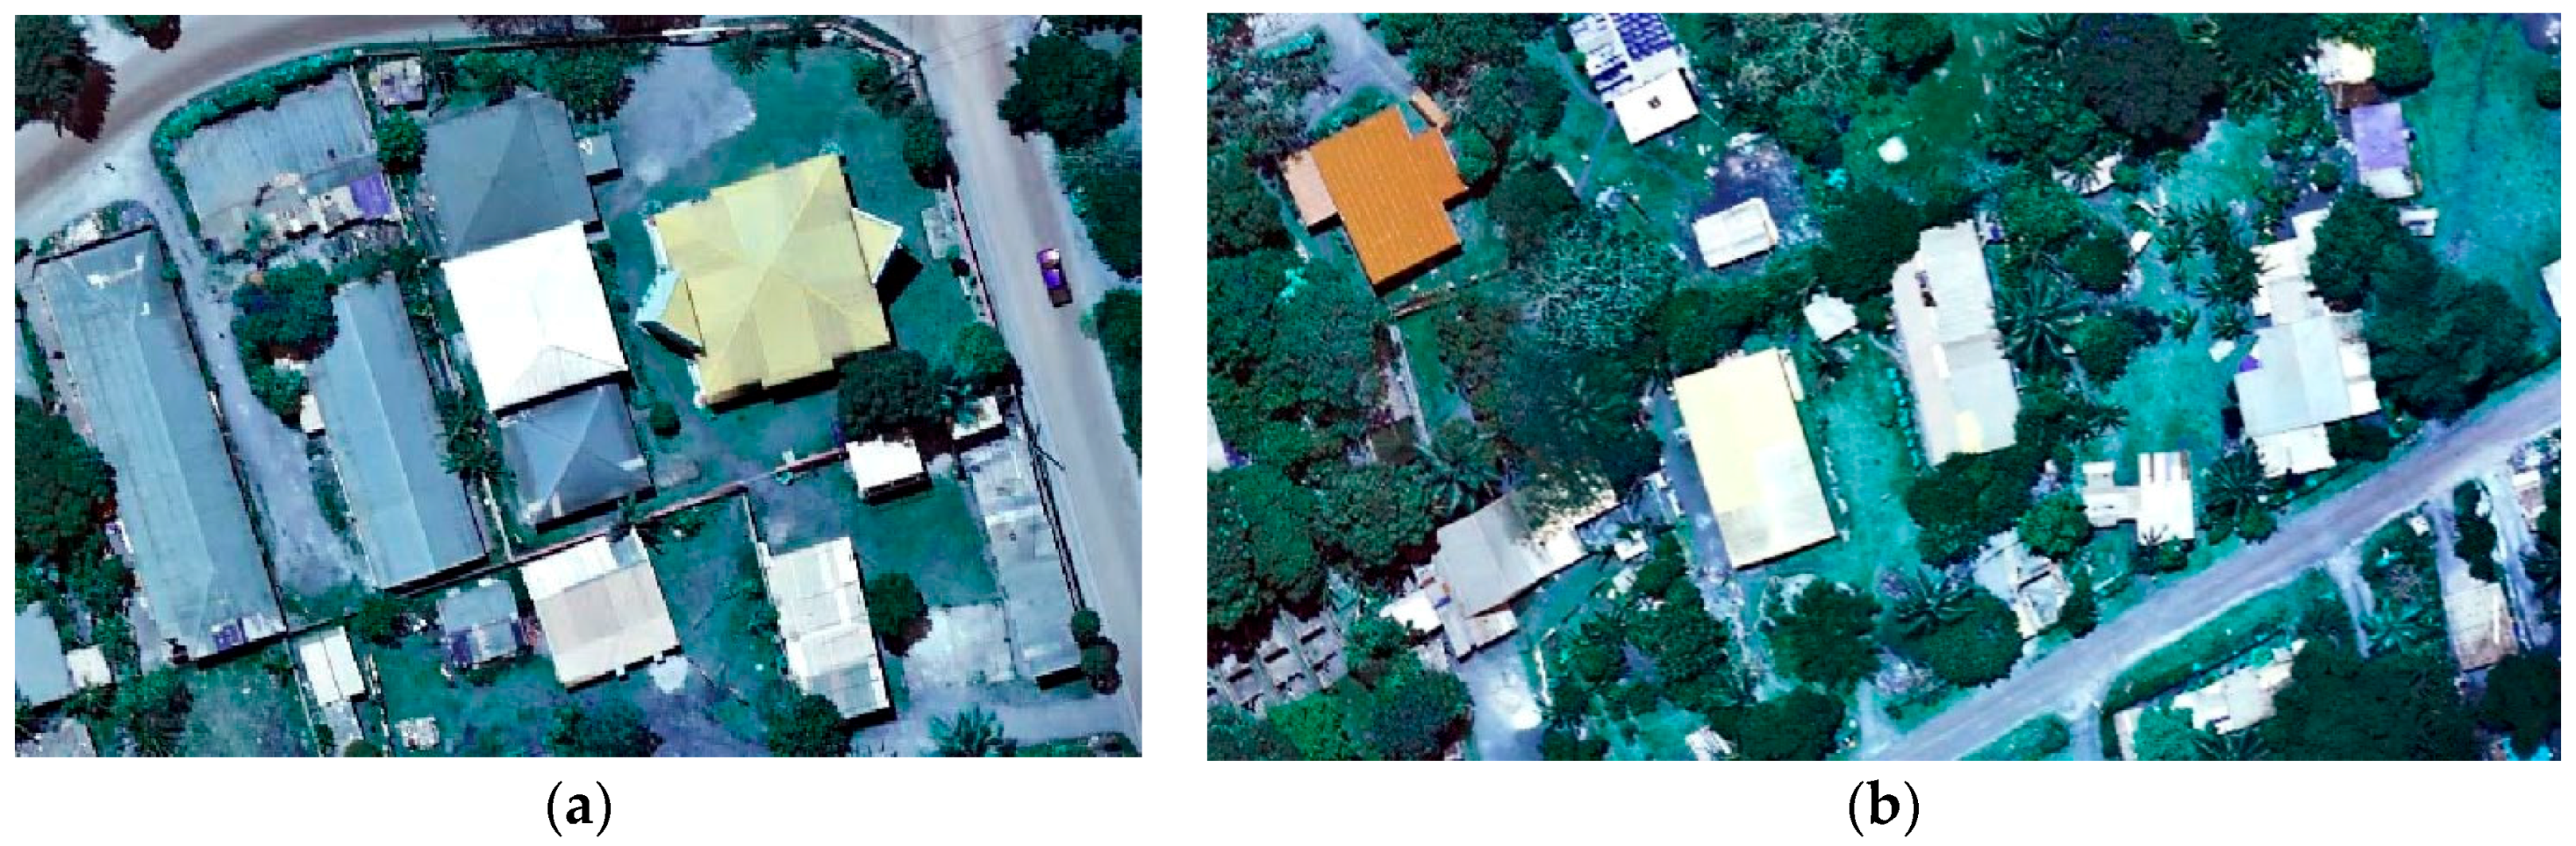
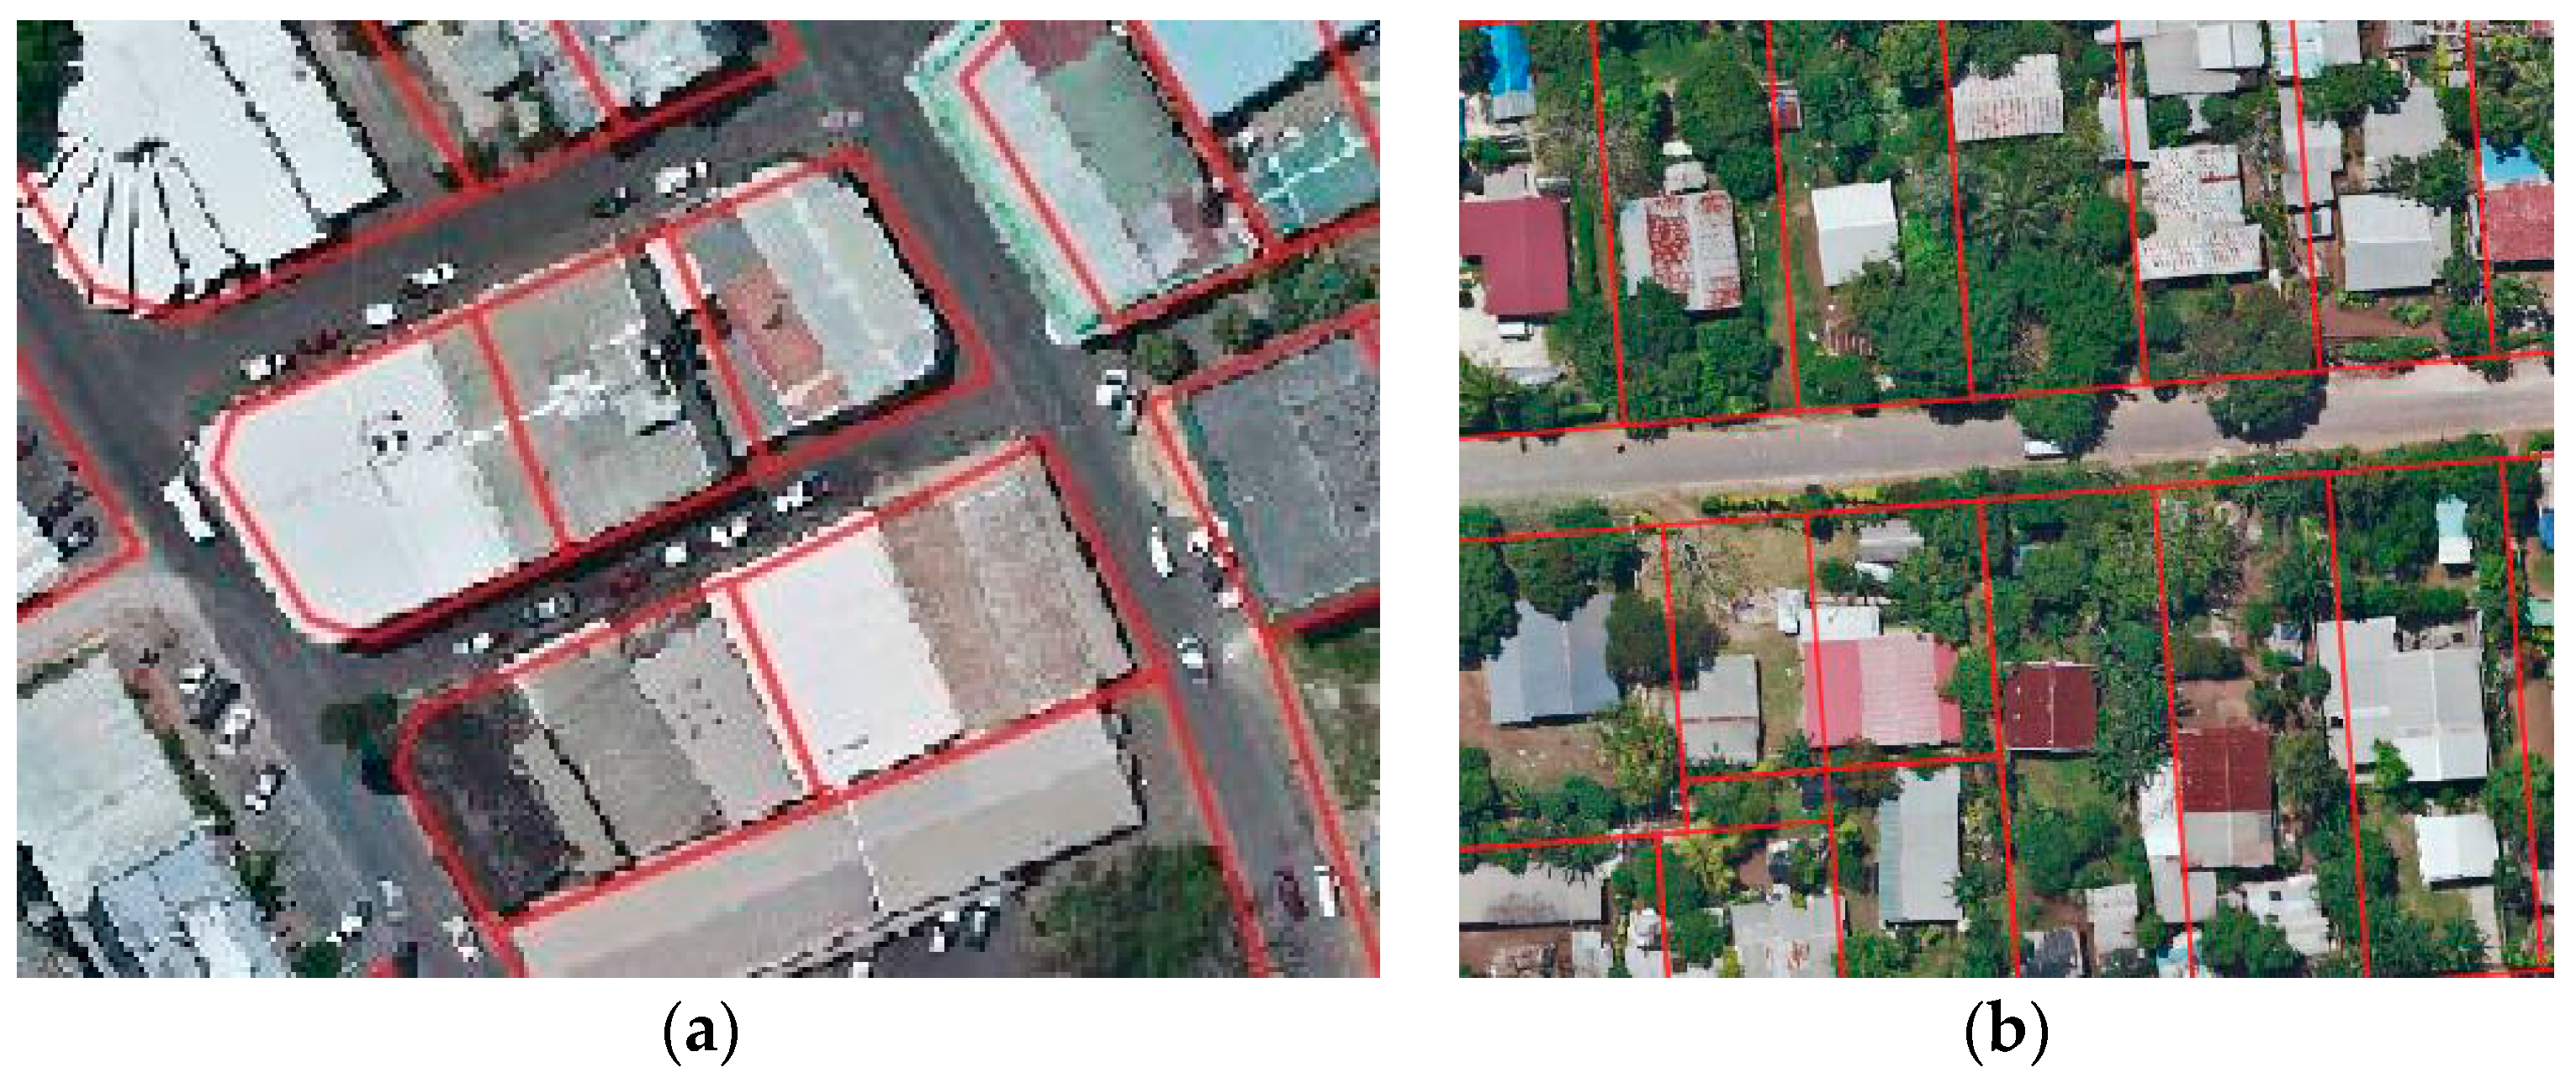
In different areas, diverse landscapes may consist of various physical land objects, such as farmlands or buildings, water channels or roads, and fences or walls—which may have influence on the presence of general boundaries: they may double with these physical objects. As shown in
Figure 2, in Port Vila, intense constructions split the land into small plots or parcels. This circumstance not only increases the workload for ground-based cadastral surveying, but also for land boundaries extracted from remote sensing data.
Figure 2b shows that in suburban regions, many parcel boundaries are marked by thin fences. These fences are often hidden or obscured by vegetation clusters: they are difficult to distinguish from aerial or satellite imagery. These general boundaries are understood as being common in the landscape.
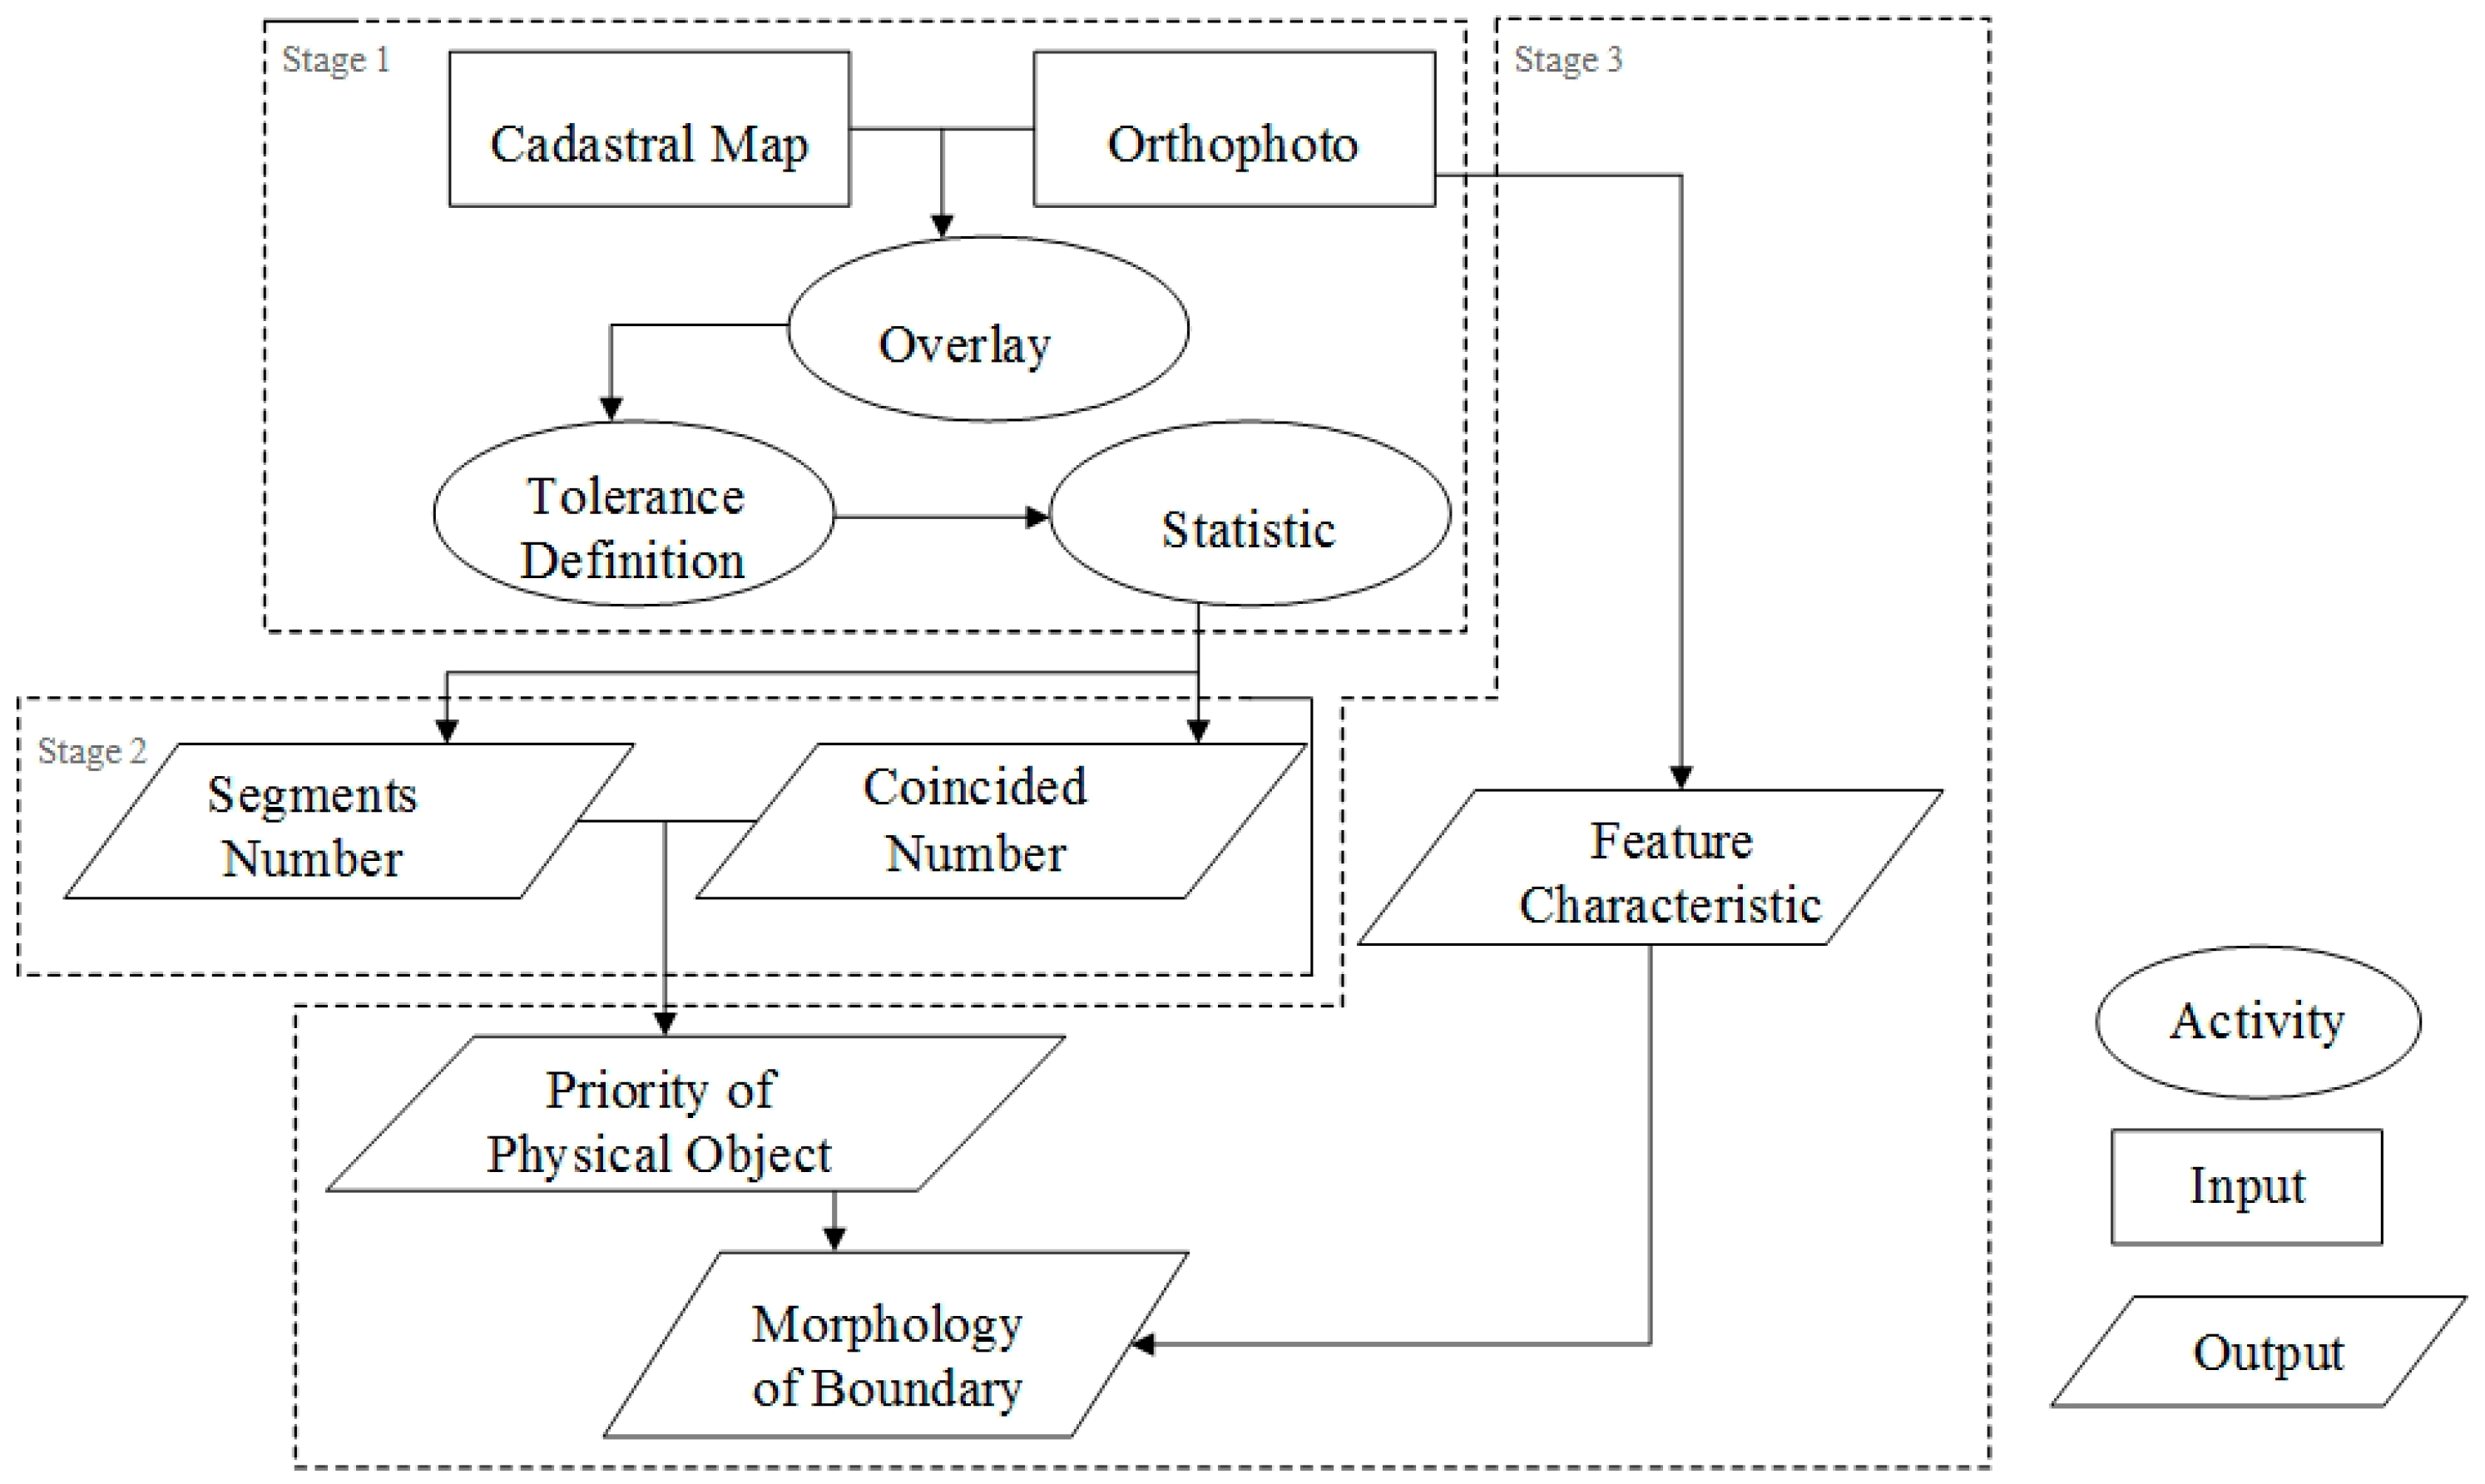
4. Methodology
For the selected study area, the morphology of land parcels is studied by comparing the iteration of the national cadastral map with an available orthophoto mosaic, which are both projected to the WGS84 coordinate system. The cadastral map described the registered parcels in urban areas of Port Vila, confirming the fixed records in the exiting cadastre. The true orthophoto mosaic is produced with a resolution of 20 cm. The methodology consists of three stages.
In the first stage, following basic image interpretation rules, physical objects are recognized by visual interpretation from the orthophoto. Then, by overlaying the cadastral map over the orthophoto, the total number of cadastral boundary segments per study region, as well as the number of cadastral boundaries that coincide with each physical object, are calculated. Offsets less than 1 m are accepted.
Before proceeding to the next stage, it is worth noting the difficulty of selecting and justifying an error tolerance, in terms of whether a boundary segment “coincided” with an object. The requirements for cadastral boundary surveying accuracy are usually laid down in a law and context specific manner—for example cadastral surveys normally require 20 cm or less accuracy in the general boundary survey approach, but sometimes “10 cm accuracy” is suggested for urban regions [
40,
41]. Here, the concept of “idealization precision” needs to be recalled: survey accuracy depends on the nature of the boundary being surveyed: it is not realistic to argue for high precisions when taking account of dimensions of nature objects, which by nature cannot actually be defined at such a precise level [
42]. In addition, there is visible misalignment between the orthophoto and the reference cadastral map. This offset is inevitable since they are produced from different input data sources, organizations, and projects. When considering these mismatching, in this study, a match was only accepted when the cadastral boundary segment was perceived close to or in alignment to the object; usually within 1 m.
It should be noted that it was necessary to make generalized categories when establishing each object type. For example, the typology of “roads” included all types of roads, regardless of the hierarchy: no distinction between a major road or community path was made. “Building outlines” referred to perceived constructions, are based on assessments of tone, color, and brightness, regardless of their shapes or utility. Finally, “Vegetation” means afforestation in the study area, regardless its concrete type, such as trees or a piece of grassland.
In the second stage, by computing the proportion of extractable boundary segments, the possibility of physical objects that mark the cadastral boundary is determined. The possibility of one kind of physical object doubling with a cadastral boundary is described by the percentage of the coincided cadastral boundary segments from the total number of cadastral boundary segments in a study region, as described by Equation (1). The larger the percentage, the bigger the possibility. Therefore, the sequence of possibility describes the priority of each kind of the physical object.
where
Pir is the proportion of cadastral boundaries coinciding with object
i in area
r;
Eir is the number of cadastral boundary segments double with object
i in area
r; and,
Cr is the total number of cadastral boundary segments in area
r.
Finally, characteristics of the generalized physical objects, as well as explicit parcel presentations, are studied based on how they appear in the imagery: a summary of the morphology of cadastral boundaries is extracted from these characteristics. After defining which kinds of physical objects are prominent when locating parcel boundaries, and why they are chosen to be the natural boundary, how to extract them from remote sensed data becomes the next issue. In this study, material, location, as well as geometry, such as shape and smoothness, are selected as essential characteristics of these objects, based on what can be observed from imagery. Since the reflectance of the variety of materials is different, specific knowledge is needed to interpret remote sensing data. The shape of the objects helps in computing potential models from pixels. The knowledge of the spatial location of these physical objects and parcels describes where and how they are likely to occur, and then a prediction can be made to find them easier. A general workflow is provided in
Figure 3.
5. Results
In alignment with
Figure 3, results are presented in accordance with the process of quantification: initial cadastral map and orthophoto overlay results, proportions of physical objects recognition, and identified boundary characteristics and morphologies are presented in sequence.
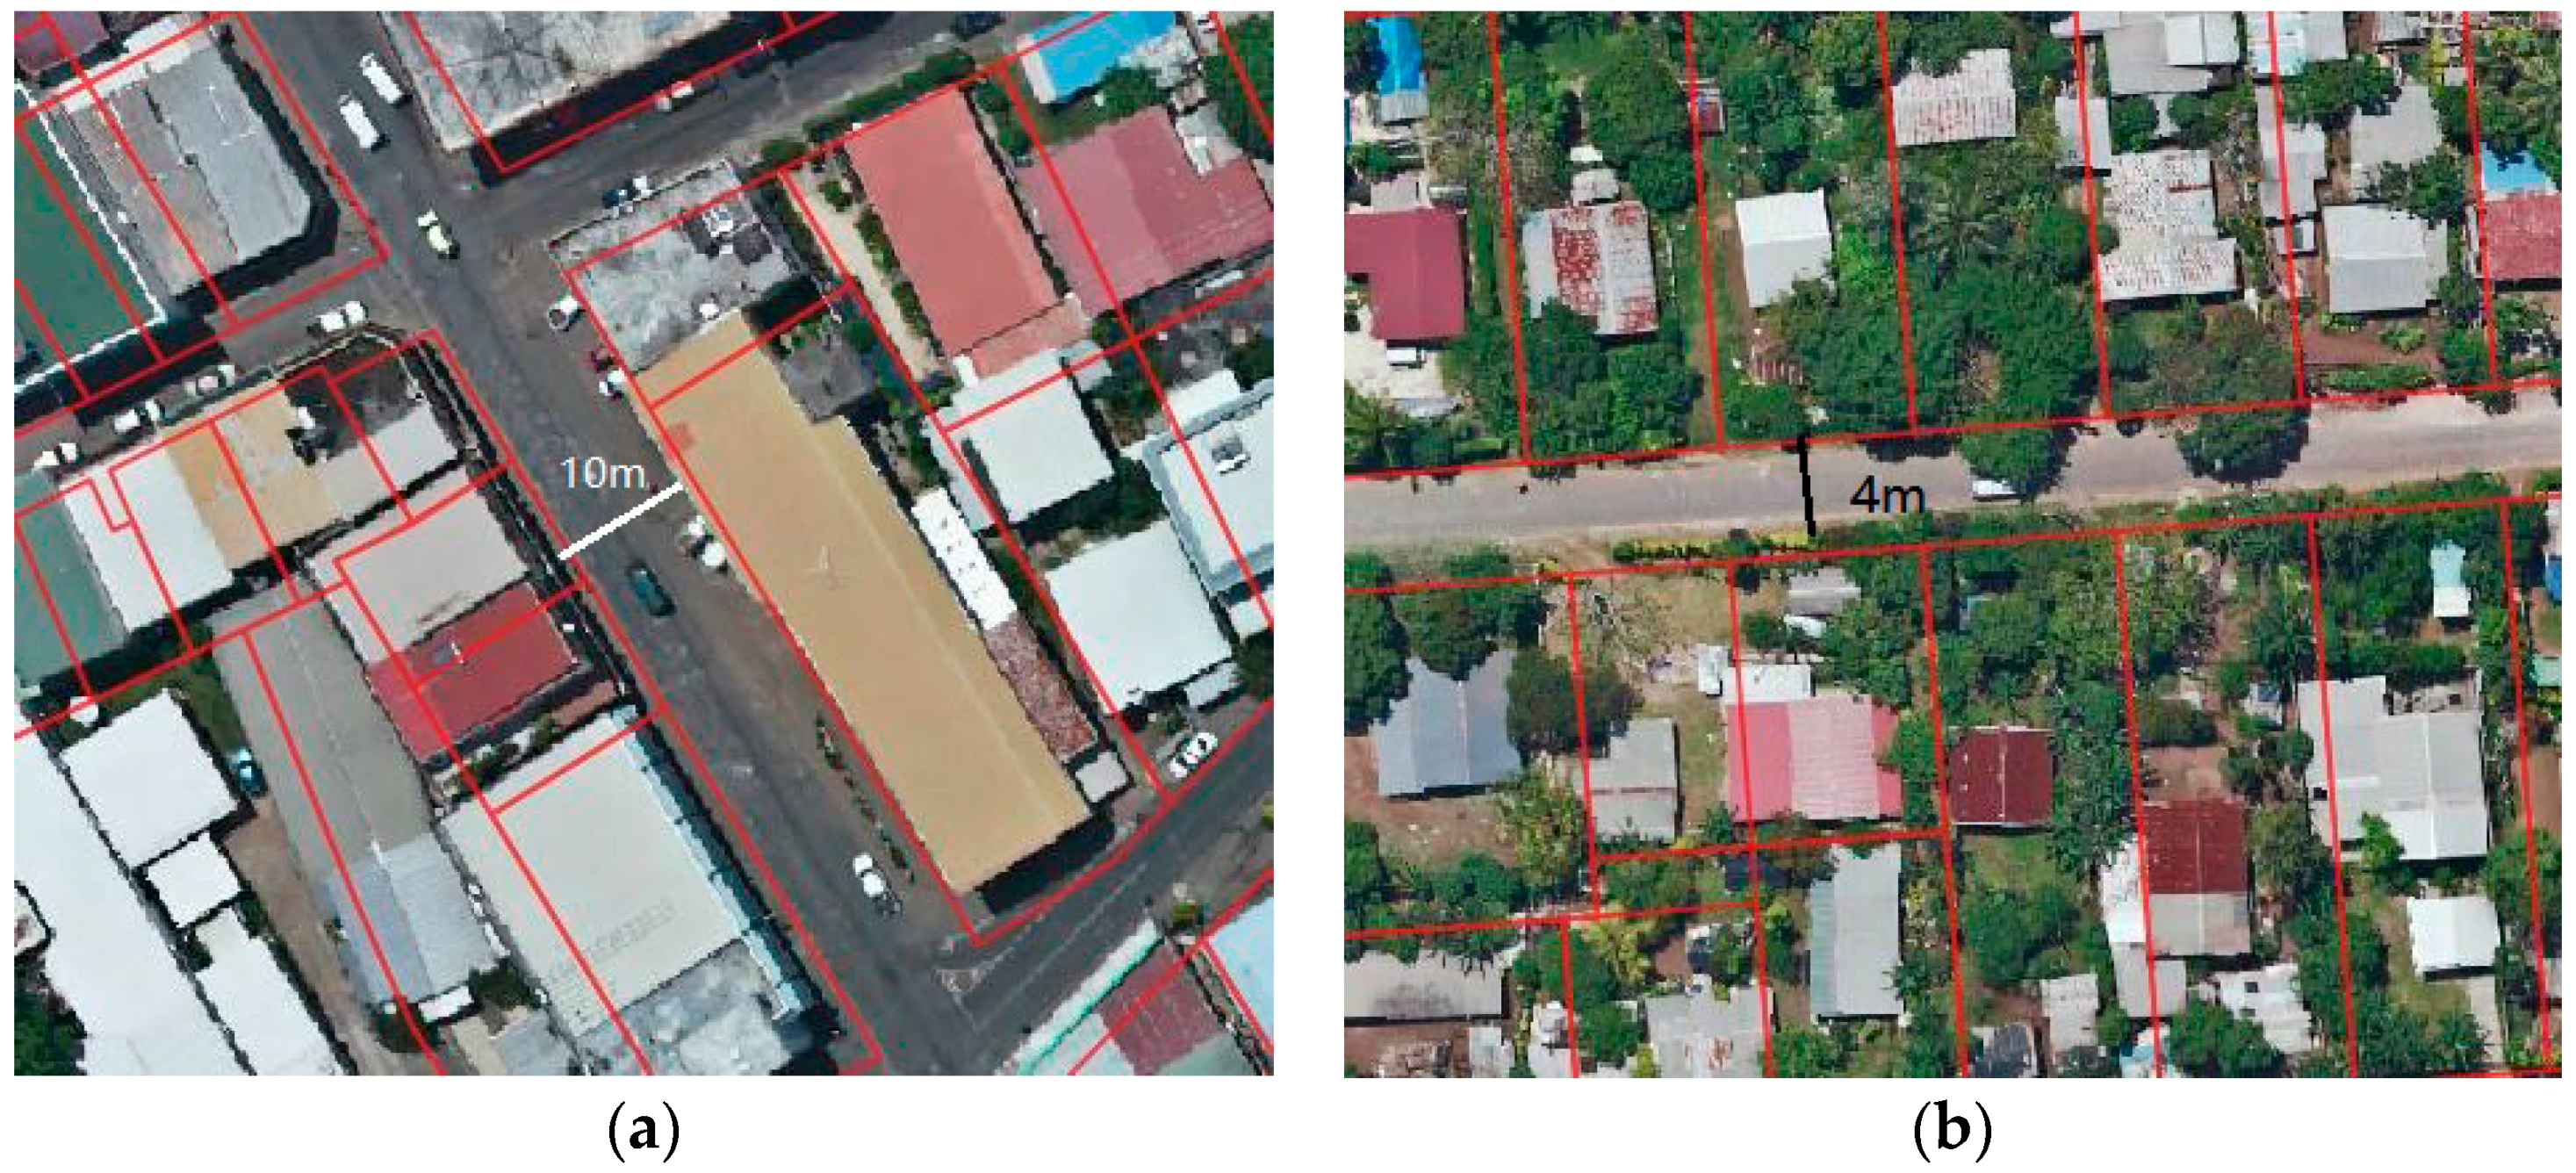
Before interpreting the overlay, a suitable tolerance should be defined, as it is difficult to define “what is overlap” between a one-dimensional cadastral boundary line and a three-dimensional realistic object. It is observed that a homogenous tolerance is not suitable for different areas. In the dense urban region where more major roads exist (
Figure 4a), cadastral boundary segments are coincided with roadside boundaries, even with a 1 m offset. By measuring three times at different road segments and taking the average, it was calculated that the width of major roads was about 10 m on average—and that a 10% error was deemed acceptable. For community roads in the suburban region, where the road width was smaller (
Figure 4b)—3 m measured on average—a 1 m offset already resulted in difficulties in determining whether the cadastral boundary coincided or not with the roadside boundary. In addition, further relating to the concept of “idealization precision” to this study: the precision of cadastral survey is dominated by the nature of survey environment. For instance, a 1 m tolerance is acceptable for roads, which means that a cadastral boundary segment is considered “coincide with” a roadside segment that is 1 m away. This offset is too big for buildings in dense urban regions: a 2 m offset may result in a boundary segment passing through the middle of a building. Therefore, during interpretation, the tolerance of coincide is obscure when considering the fuzziness of the general boundary. When judging whether a boundary segment coincides with a physical object, the size of the object as well as the context situation are taken into consideration, instead of setting a homogeneous tolerance.
Comparison of the visible boundaries, derived by visual interpretation from the overlay of orthophotos and the reference cadastral map, enabled the quantification of the coincidence between physical objects and cadastral boundaries for the two regions (
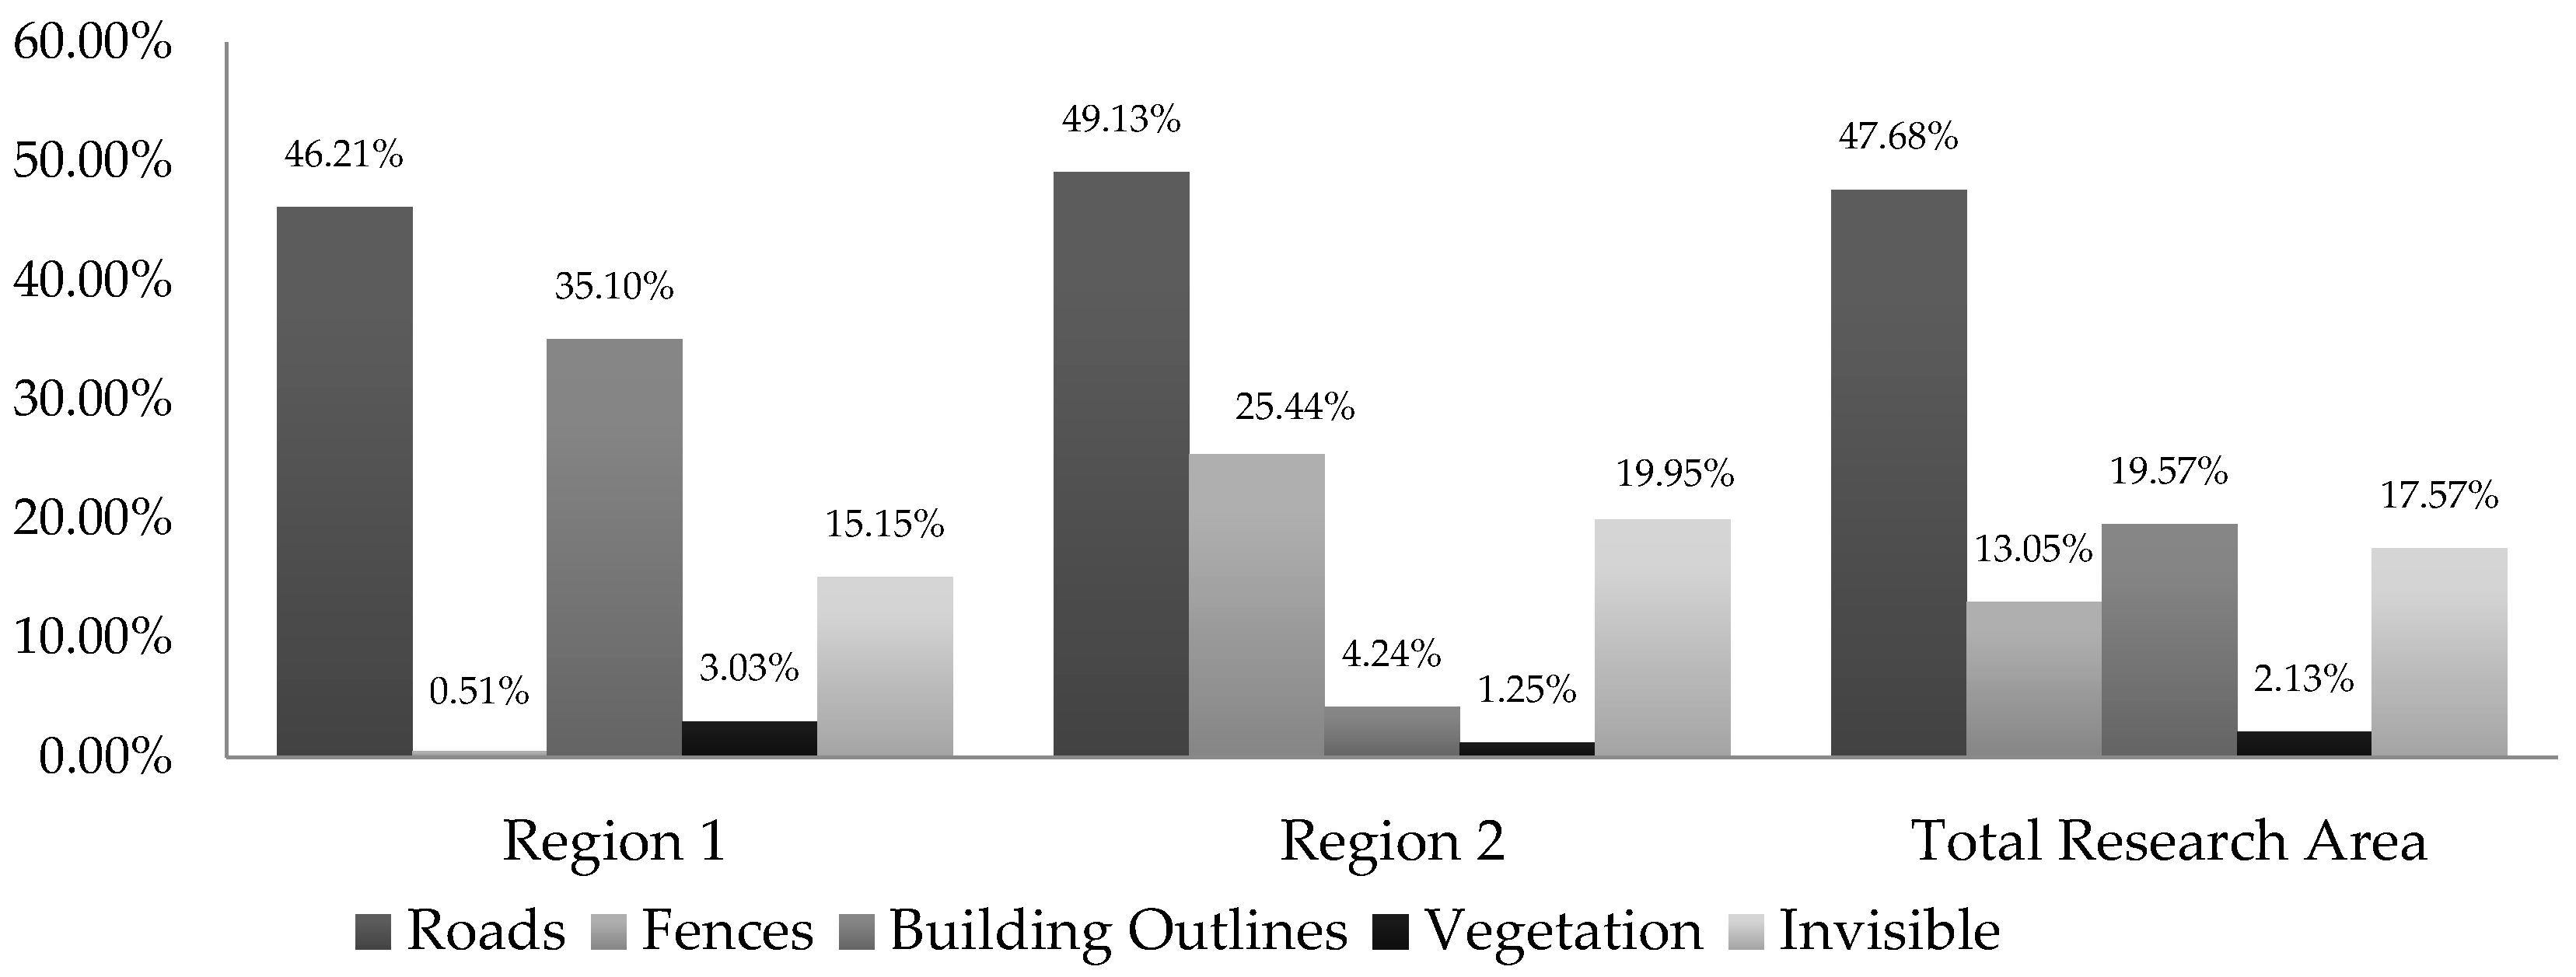
Table 1). The “Total” column describes the total number of coincidences identified in the combined research areas. The physical objects focused upon included “roads”, “fences”, “building outlines”, and “vegetation”.
Calculated according to Equation (1), the proportion
Pir was displayed in
Figure 5. In the two study regions, cadastral boundary segments coincide with similar types of physical objects—but in different amounts.
As shown in
Figure 5, there were similarities in the cadastral boundary morphology of the two. The most coincidence, percentage wise, of cadastral boundaries occurred with road outlines: this was not entirely surprising as in both regions, roads always surround clusters of parcels. In both the dense urban region and the suburban region, about half of the cadastral boundary segments coincided with road outlines. Vegetation was hardly used for marking general boundaries in both study regions, even in the suburban region, which is surprisingly different with previous hypotheses. Meanwhile, in both regions, approximately 15–20% of cadastral boundaries did not coincide with any visible physical object—they cannot be derived from an automated feature extraction approach. There were large portions of cadastral boundaries—about 81–84%—that can potentially be extracted in a rather straightforward manner, no matter whether they were in the dense urban regions or in more rural suburban regions. This illustrates the potential universal capability of automatic feature extraction approaches in cadastral surveying.
The differences in the cadastral boundary morphology in the two regions were also observed. Building walls coincided with a large portion of cadastral boundaries in region 1—the dense urban region. However, alignment was far more limited in region 2—the suburban region. On the contrary, in the suburban region, besides roads, one-third of visible cadastral boundaries were marked by fences. The major difference in the two regions, observed from the overlay of orthophoto and cadastral boundary, was the nature of landscape and land uses: denser construction in the dense urban region and less efficient land use in the suburban region. This appears to have a large impact on the coincidence of boundaries.
Having investigated the physical object types that have the potential to coincide with the cadastral boundary,
Table 2 illustrates the observed characteristics for describing each target object from diverse perspectives. The observation follows the basic rules of imagery interpretation. In
Table 2, “Characteristic” describes land objects “physical presence”, while the “Virtual presence” describes how the parcel boundaries coincide with each object [
22]. Specifically, “Characteristic” consist of land objects’ location, geometry, smoothness and materials. These characteristics are chosen because they are easily visible from remote sensed data.
As shown in
Table 2, road, building, and fences all have sharp and clear shapes, which can be used to derive an unambiguous boundary and therefore distinguish land parcels. Both road and fence were linear shape, which is coherent with the concept of boundary—usually a line.
Besides specific object characteristics, by overlaying the cadastral map over the orthophoto, land parcels arrangements were observed. In Region 1, many parcel boundaries aligned closely with constructions located inside parcels. In dense urban regions, the shape and size of parcels were diverse (
Figure 6a), while in rural areas, parcels were in uniform size and shape, orderly arranged. Accordingly, parcel boundaries appear like regular grids (
Figure 6b). These characteristics can serve as a basis for automatically extracting them for the cadastral boundary depiction.
6. Discussion
6.1. Significant Coincidence of Physical Objects with Cadastral Boundaries
In the domain of land administration, the concept of general boundaries to define property rights is widely accepted and utilized: the study results presented here further support this view. Two regions from Port Vila in Vanuatu were selected as typical subsets, a dense urban region and a suburban region, respectively. By visual interpretation, the number of cadastral boundary segments that coincide with a physical object was determined. From the results, over 80% of cadastral boundaries coincided with visible physical objects—with roads being most prominent—and fences and building footprints playing significant although different roles in each region.
6.2. Road Infrastructure a Key Feature, Vegetation Less So
Road features are the most coincidental features, in both regions, with regards to cadastral boundary overlap. This suggests deriving road outlines would contribute significantly to generating cadastral boundary features. Contrastingly, vegetation plays only a minor role in both regions. The land parcels in both regions are considered small, however, the size of vegetation clusters is comparatively large. This might make vegetation ambiguous in terms of land tenure security: the trunk and foliage size perhaps exceed the accuracy requirements for cadastral surveys. Meanwhile, in both regions, approximately only 20% of boundaries were considered invisible—again indicating significant opportunities for automated feature extraction methods in cadastral surveying: most boundaries can be remotely sensed using RGB images.
6.3. Landscape Matters! Great Influence on Boundary Morphology
It was observed that the landscape played an important role in determining the cadastral boundary morphology for a particular region.
The visible cadastral boundaries have varied morphologies, with particular rules and patterns. The two regions share the same legal and administrative background and they possess similarities in terms of cadastral boundary morphology.
The potential of mapping cadastral boundary from physical land objects is apparent in both dense and suburban areas, these two regions also exhibited key differences—despite locating in the same city and only 2 km apart, which means that they share the same juridical cadastre background. When investigating the reason why there are different quantities for different morphologies in the two regions, the landscape was observed to be crucial. Fences are used far more prominently in the more regularized suburban region, whereas building footprints play a much larger role in the denser urban region—with its more irregular parcel arrangements. This all appears logical as land values are most likely higher, meaning that parcels would tend to be smaller, whilst owners would still seek to maximize the size of dwellings—perhaps extending those dwellings to the extents of the parcels—should planning regulations permit. Meanwhile, the larger plots, and perhaps the lifestyle of the suburban areas, mean that dwellings do not extend to boundaries and unambiguous and low-cost fences are the boundary monuments of choice. On both fronts, like the roads, the high coincidence with both fences and building footprints provides further promise for the domain of automatic extraction: generating vectors from both fence lines and building footprints would appear to deliver a high return. Moreover, the highly regular parcel layouts in the suburban region appear to present opportunities for pattern recognition and improved computation efficiencies (e.g., draft griddling): it is perhaps not necessary to recognize and delineate objects one by one.
The results from Vanuatu show that, though there is no written standard on which kind of feature should be used as markers for cadastral boundaries, they present certain traceable natural characters. Both person-made and natural objects have the capacity for enclosing spatial rights—especially in a general boundary system—on the condition that they are visible and constant. To further illustrate the heterogeneity across landscapes, the work presented here is compared with similar work completed in the Netherlands [
7]. Generally speaking, the Netherlands consists of highly organized agricultural and urban landscapes. When compared against the Netherlands case, there are far fewer water channels in Vanuatu—the later one coherent with the most landscape in developing contexts around the world. Likewise, building outlines appear to coincide far less than in the Netherlands than in Vanuatu, although, this is largely to do with the fact that the Netherlands case data used by van Beek was entirely rural. However, similarities are found in roads and fences: both contribute significantly in locating parcel boundaries and appear to be for demarcating land rights. This small vignette begins to reveal the importance that surrounding ecology, livelihoods, economies, and social patterns play in determining cadastral boundary morphology.
6.4. Limitations and Suggested Improvements
Though diverse urban landscapes have significant influence on cadastral boundary morphology and survey tolerance, and result in no one-size-fits-all solution will be apparent in automated approaches, it is likely that some universal rules can be determined for the morphology of cadastral boundaries—although, more research taking into account diverse contexts needs to be completed to support such work. A suite of algorithms is likely to be needed, a set of approaches that can be selected from following an audit of the landscape and land tenure situation. With regards to limitations, when conducting the image interpretation, difficulties in object extraction were observed. First, due to the complex morphology of cadastral boundaries, a multi-entity strategy is more suitable for detecting various physical objects. Combinations of characteristics should be taken into consideration for a more accurate extraction of physical objects. For example, existing works suggest it is apparently easy to separate vegetation and constructions from imagery by spectral information from images, however, more aspects—such as geometry and texture—should be taken into consideration when distinguishing roads, bare lands, and car parks, since their materials can often be similar [
43]. Moreover, in orthophotos, fences may be invisible because they are covered by vegetation above. Therefore, when delineating parcel boundaries through identifying physical objects, various aspects—if not technologies such as LiDAR—should be considered.
Going further, in view of the complex cadastral accuracy configuration, introducing the concept of “fuzzy logic” into the analysis should be considered [
44]. Diverse aspects that affect the precision could be weighted and valued, and then consolidated to realize a multi-valued accuracy system. In this way, different degrees of “confidence” are computed instead of binary “coincide or not”. To achieve such an approach, more research and larger data volumes are needed.
In addition, machine learning approaches could be further investigated in order to develop more intelligent approaches for feature extraction—rather than just investigating whether cadastral boundaries double with physical objectives. For example, the spatial distance between boundaries and objects could be investigated. Besides object-based methods that extract parcel boundaries from digital descriptions of a physical object, the spatial connection between cadastral boundaries and physical objects can be utilized as trainers to predict the location of parcel boundaries accordingly.


