Article

Enzymes Degrading Fungal Cell Wall Components vs. Those Exhibiting Lactonase Activity as Participants of Antifungals

Faculty of Chemistry, Lomonosov Moscow State University, Lenin Hills 1/3, Moscow 119991, Russia
*
Author to whom correspondence should be addressed.
Sci 2025, 7(4), 169; https://doi.org/10.3390/sci7040169
Submission received: 23 September 2025 / Revised: 11 November 2025 / Accepted: 14 November 2025 / Published: 17 November 2025
(This article belongs to the Special Issue Feature Papers—Multidisciplinary Sciences 2025)

Abstract

Recently, we found that combining various antimicrobial polypeptides (AMPs) with enzymes exhibiting lactonase activity results in an antifungal agent with significantly enhanced stability and antimicrobial action efficiency. In this context, this study aims to investigate the catalytic and antifungal activity and physical-chemical properties of antifungal enzyme combinations hydrolyzing fungal cell wall components with various AMPs, comparing them with enzymes exhibiting lactonase activity (capable of hydrolyzing lactones by ring opening). Additionally, combinations of enzymes targeting the fungal cell wall and/or hydrolyzing fungal lactone-containing Quorum-sensing molecules with polyamino acids (PAAs) supplemented with fungicides (PAAF) were studied for comparison with AMP-containing combinations. Interaction models for these antifungal enzyme combinations were simulated in silico using the molecular docking method. The most promising variants, which were predicted to possess high catalytic activity, were selected, and their catalytic and physical-chemical characteristics were further evaluated in vitro. The antifungal activity of the selected combinations of enzymes with AMPs or PAAF was assessed against a number of fungi, leading to the identification of several combinations as potential candidates for inclusion in antifungals. Unexpectedly, antifungal enzyme combinations with lactonase activity were, in most cases, more effective than those with fungal-cell-wall-degrading enzymes.

Graphical Abstract

1. Introduction

The World Health Organization fungal priority pathogens list, published in 2022, highlights the severity of the problem posed by the spread of fungal infections, which cause over 2 million deaths annually [1,2,3]. Pathogenic fungi also cause significant economic losses in agriculture and animal husbandry. The increasing resistance of fungi to traditional fungicides frequently requires higher concentrations of antifungal agents in practice. This, in turn, leads to elevated toxic effects on living organisms and limits the number of currently available effective antifungal agents. Therefore, considerable attention should be given to exploring novel strategies to overcome the observed fungal resistance [4,5,6].
Previous studies have shown that enzymes exhibiting lactonase activity can interfere with Quorum-sensing systems of microorganisms by catalyzing the hydrolysis of lactone rings in Quorum-sensing molecules, thereby attenuating signaling pathways involved in fungal virulence and biofilm formation [7,8,9].
Recently, we demonstrated that the combinations of various antimicrobial polypeptides (AMPs) with enzymes exhibiting lactonase activity results in an antifungal agent with significantly enhanced catalytic stability and antimicrobial action efficiency [7,8]. AMPs represent a broad and diverse class of biologically active molecules that serve as key components of the innate immune defense in a wide range of organisms. Depending on their structure, AMPs can be classified into several main groups, including α-helical (such as temporins), β-sheet stabilized by disulfide bridges (such as defensins), extended peptides rich in specific amino acids (for instance, indolicidin), and cyclic or lipopeptides (such as iturins and polymyxins). Their antimicrobial action is usually based on electrostatic interaction with negatively charged microbial membranes, followed by membrane disruption, pore formation, or interference with intracellular processes [10]. This suggests that such an approach represents a promising strategy for controlling fungal infections.
Other classes of hydrolases, such as carbohydrases and proteases, capable of hydrolyzing fungal cell wall components, also have significant interest as potential antifungal agents, alongside lactonase enzymes, since both mechanisms may contribute to fungal growth inhibition through different biochemical pathways [11,12,13,14,15,16,17]. Accordingly, similarly to lactonases, this study aims to investigate the enzyme–AMP combinations of fungal-cell-wall-degrading enzymes and to analyze the mutual influence of these substances on each other’s properties.
It is well established that various poly(amino acids) (PAAs) and/or their PEGylated (polyethylene glycol, PEG) derivatives can serve as a stabilizing agent in enzyme combinations [18,19,20]. PAAs are synthetic or semi-synthetic polymers composed of repeating amino acid residues (e.g., poly-l-lysine) and their PEGylated derivatives. They are widely used as enzyme stabilizers or carriers due to their biocompatibility, biodegradability, and ability to form non-covalent complexes with proteins.
The main limitation of this approach is that, unlike AMP–enzyme combinations, where AMPs act both as stabilizing and antimicrobial agents, PAA–enzyme combinations typically require supplementing the resulting combination with antimicrobial agents, e.g., fungicides. Nevertheless, such combinations remain of practical interest, as they can enhance the efficacy of blockbuster fungicides, allowing for continued use without the immediate need to develop new antifungals. Therefore, it was of interest to compare the antifungal action efficiency of AMP–enzyme combinations with PAA–enzyme combinations supplemented with fungicides (PAAF).
The following aims were defined in this work: (1) to investigate the physical-chemical and catalytic characteristics of enzyme–AMP and enzyme–PAA combinations using combined in silico and in vitro methods; and (2) to compare the effect of the resulting antifungal enzyme combinations with different mechanisms of action (lactonase activity vs. cell wall degradation) on fungi. The comprehensive experimental design of this study is described in Figure 1.
In this paper, the following terms will be used: (i) “antifungal enzyme combinations”—combinations of one of the two groups of enzymes with AMP or PAAF; (ii) “enzymes exhibiting lactonase activity”—enzymes capable of hydrolyzing lactones by opening the lactone ring; and (iii) “antifungal drugs”—compounds or systems exhibiting the ability to inhibit or kill fungal cells.
Initially, computational methods were employed to simulate the interactions between enzymes targeting fungal cell wall components and various substrates in silico, allowing for the selection of the most promising catalytically efficient enzymes. Subsequently, the interactions of these selected enzymes with various AMPs and PAAs were assessed in silico using a molecular docking method. The same approach was applied to study interactions between PAAs and lactonase enzymes, which had previously been investigated in combination with AMPs [7]. The most suitable combinations were selected based on their potential to preserve enzymes catalytic activity, and the physical-chemical properties of the selected combinations were evaluated in vitro. The antifungal activity of the chosen enzyme–AMP or enzyme–PAAF combinations was then assessed in vitro against different fungi, allowing for the identification of the variants with the highest antifungal action efficiency.

2. Materials and Methods

2.1. Materials

Chitinase from Streptomyces griseus, polymyxin B, colistin, zineb, clotrimazole paraoxon, N-(3-oxohexanoyl)-l-homoserine lactone, m-cresol purple, chitin azure, and 4-methylumbelliferyl-β-d-N,N′,N″-triacetylchitotrioside were obtained from Sigma Aldrich (Darmstadt, Germany). 1,3–1,4-β-d-glucanase from Myceliophtora fergusi was purchased from BioPreparat (Moscow, Russia). Lactonase AiiA was obtained from ProteoGenix (Schiltigheim, France), and recombinant New Delhi metallo-beta-lactamase 1 (NDM-1) was obtained from RayBiotech, Inc. (Norcross, GA, USA).
Hexahistidine-containing organophosphate hydrolase (His6-OPH) was produced, purified, and characterized by a published procedure [21]. The following polymers and co-polymers with PEG based on poly-l-aspartic acid (PLD10, PLD50, PEG113PLD10,) or poly-L-glutamic acid (PLE10, PLE50, PEG113PLE10, PEG22PLE50 and PLE50PEG113PLE50) were purchased in Alamanda Polymers (Huntsville, AL, USA).

2.2. Molecular Docking

The enzymes crystal structures from the Protein Data Bank were used for molecular docking simulations: lactonase AiiA from Bacillus thuringiensis (PDB ID: 2A7M), metallo-β-lactamases NDM-1 from Escherichia coli (PDB ID: 5YPI), MIM-1 from Novosphingobium pentaromativorans (PDB ID: 6AUF), chitinase ChiC from Streptomyces griseus (PDB ID: 1WVU) [13,14], endo-α-1,4-galactosaminidase Ega3 from Aspergillus fumigatus [15] (PDB ID: 6OJ1), and hen egg white Lysozyme (PDB ID: 3WUN) [16,17]. His6-OPH dimer structure was prepared according to a previously described procedure [19].
To predict the structure of 1,3–1,4-β-d-glucanase Bgy6, the sequence encoding Bacillus halotolerans Y6 [12] β-glucanase (GenBank: MH643779) was uploaded to the Iterative Threading ASSEmbly Refinement (I-TASSER) server (ver. 4.4, http://zhanglab.ccmb.med.umich.edu/I-TASSER/ accessed on 20 September 2025) [12,22]. The I-TASSER server was also employed to fold 21 AMPs (Aculeacin A (1), Bacitracin (2), Bovine Myeloid Antimicrobial Peptide-18 (BMAP-18) (3), Bralicidin (4), Caspofungin (5), Colistin (6), Fengycin (7), Indolicidin (8), Iturin A (9), KK14 (10), Leg2 (11), human lactoferrin (hLF) 1-11 (12), Lfampin B (13), PAF26 (14), PepGAT (15), PepKAA (16), Polymyxin B (17), RcAlb-PepII (from the seed cake of Ricinus communis) (18), TC3 (19), Temporin A (20), and Temporin G (21)), as described previously [7].
Structures of 14 PAAs (including the following PEGylated variants: PEG22PLE50 (1), PEG113PLD10 (2), PEG113PLD50 (3), PEG113PLD100 (4), PEG113PLE10 (5), PEG113PLE50 (6), PEG113PLE100 (7), PLD10 (8), PLD50 (9), PLD100 (10), PLE10 (11), PLE50 (12), PLE50PEG113PLE50 (13), and PLE100 (14)) were obtained as described previously [19] using segment PEG4 available from the Cambridge Crystallographic Data Center (# 707050) as a structural basis for PEG. It was merged with other polypeptides after its elongation and charge calculation (Gasteiger–Marsili method). PLEs and PLDs models with varying chain lengths were predicted computationally.
APBS (Adaptive Poisson-Boltzmann Solver ver. 1.4.2.1) and PDB2PQR (ver. 2.1.1) servers, available at http://www.poissonboltzmann.org/, were used to calculate the charge distribution on the surfaces of enzymes and polypeptides [7,23,24].
PDB format of Allosamidin, Chitosan, Triacetylchitotriose, Chitin tetramer, Chitin octamer, Zineb, and Clotrimazole were obtained using their two-dimensional structures of (PubChem CID: 119339, 21896651, 444514, 5288898, 24978517, 5284484, 2812, respectively) in ChemBioOffice software (ver. 12.0, CambridgeSoft, Waltham, MA, USA). GLYCAM-Web Modeling Tools (available at https://glycam.org) were used to prepare Chitin dimer, Chitin octadecamer, and Galactosaminogalactan structures.
The final structures in PDBQT format were obtained using AutoDockTools (as part of MGLTools ver. 1.5.6, available at https://mgltools.scripps.edu/) [7,25].
Calculation of the enzyme–ligand interactions were performed using the Supercomputer “Lomonosov-2” (available at the Supercomputing Center of Lomonosov Moscow State University) utilizing up to 4 Intel Haswell-EP E5-2697v3 2.6 GHz CPUs with Intel MPI Library (ver. 2019.9, Intel, Santa Clara, CA, USA) and 4 NVIDIA Tesla K40M GPUs with Cuda (ver. 8.0, NVIDIA, Santa Clara, CA, USA), in addition to AutoDock Vina (ver. 1.1.2, available at http://vina.scripps.edu/) [7,26,27]. Based on our previous studies, the best 8 poses with minimal energy were selected.
Calculated interaction models were visualized in a PyMOL Molecular Graphics System (ver. 1.7.6, Schrodinger Inc., New York, NY, USA). The “get_area” function was used to obtain the values of area occupied on the enzymes’ surfaces.

2.3. Enzymatic Activity and Physical-Chemical Characteristics

His6-OPH enzymatic activity alone or in combination was measured spectrophotometrically at 405 nm [7] with a UV-visible spectroscopy system (Agilent 8453, Agilent Technology, Waldbronn, Germany). Reactions were carried with 0–10 mM paraoxon solution in a 100 mM Na-carbonate buffer (pH 10.5) with His6-OPH at a concentration of ~2.5 nM.
Activity of metallo-β-lactamase NDM-1 alone or in combination was measured as described previously [28]. Briefly, the enzyme with final concentration ca. 1 nM was added to 0–100 μM aqueous meropenem (Oxoid, Cambridge, UK) solution in 50 mM phosphate buffer with 20 μM ZnCl2 (pH 7.0) and the activity was measured at spectrophotometrically 297 nm. The concentration of NDM-1 in the reaction cuvette was ca. 1 nM.
The lactonase activity of AiiA alone or in combination was measured spectrophotometrically at 577 nm using a cresol purple colorimetric assay using the method found in [29]. Enzyme (100 nM) was incubated with 0–1 mM N-(3-oxohexanoyl)-l-homoserine lactone and 0.2 mM pH indicator in 0.2 mL at pH 8.3 (2.5 mM Bicine buffer, 150 mM NaCl, 1 mM CoCl2). Concentration of AiiA in the reaction cuvette was ca. 10 nM.
Chitinase activity of ChiC alone or in combination was measured spectrophotometrically at 570 nm using previously published procedure with minor modifications [30]. Briefly 50 µL (0.2 U) of enzyme or its combinations were incubated with 0–1 mg/mL chitin azure (pH 6, 200 mM PBS) in 950 μL tubes at 37 °C for 24 h. The reaction was stopped by boiling for 15 min and the final samples were centrifuged at 16,000× g for 10 min. One unit of enzymatic activity was defined as the variation in optical density at 570 nm during 24 h.
Activity of 1,3–1,4-β-d-glucanase alone or in combination was measured using 4-MUF-3-NAG (4-methylumbelliferyl-β-d-N,N′,N″-triacetylchitotrioside) as fluorogenic substrate. Enzyme (50 μL, 200 µg/mL) was incubated with substrate (150 μL, 1 mM stock solution in dimethyl sulfoxide (DMSO)) in sodium acetate buffer (pH 7.0) at 37 °C for 4 h.
The fluorescence intensity was detected using Varian Cary Eclipse (Agilent Technology, Waldbronn, Germany) using an excitation wavelength of 360 nm and a read-out of 455 nm. One enzyme unit was defined as a change in the fluorescence value in 3 h.
The parameters of enzyme kinetics (Michaelis constant (Km) and the maximum rate of the enzymatic reaction (Vmax)) were evaluated in Origin Pro (ver. 8.1 SR3, OriginLab, Northampton, MA, USA) using the least squares method.
The kinetics of thermoinactivation of enzymes activity was studied at 8 °C, 25 °C, and 37 °C by periodic sampling and measuring the residual activity
Hydrodynamic size of nanoparticles was determined by nanoparticle tracking analysis (NTA) using a NanoSight NS500 instrument (Malvern Panalytical, Malvern, UK) with an 80 mW 532 nm laser. Size distributions were calculated with NanoSight software (ver. 2.3, Malvern Panalytical) based on data from five independent experiments.

2.4. Antifungal Activity

The effectiveness of antifungal action of Colistin (10 mg/mL), Polymyxin B (10 mg/mL), Zineb (10 mg/mL), Clotrimazole (5 mg/mL), and their combinations with enzymes was assessed against the cells of the filamentous fungi Aspergillus niger F679, Trichoderma atroviride F207, Fusarium solani F819, and Rhizopus oryzae F814 and the yeasts Saccharomyces cerevisiae Y-1234 and Candida tropicalis Y-2245.
Microorganism cells were cultured in the appropriate growth media as described previously [7] using a thermostatically controlled Adolf Kuhner AG shaker (Basel, Switzerland) at 28 °C with constant stirring at 150 rpm. All microorganisms were separated from the nutrition media after cultivation by centrifugation for 5 min at 10,000× g (Beckman Avanti J-25, Palo Alto, CA, USA). Yeast cell growth was monitored spectrophotometrically at 540 nm with an Agilent UV-8453 (Agilent Technology, Waldbronn, Germany). The dry weight of fungal cells was determined gravimetrically. The cell biomass was suspended in 9 g × L−1 NaCl prepared using 50 mM phosphate buffer (pH 7.5).
Further, antimicrobial agents alone or in combinations with enzymes were incubated with cells at 25 °C for 24 h. The concentration of intracellular adenosine triphosphate (ATP) was quantified in exposed samples employing the luciferin–luciferase bioluminescence method.
The residual ATP content was calculated as a percentage of the initial ATP concentration in control samples lacking antifungal treatment [7,31]. Intracellular ATP was extracted by adding 900 μL of DMSO to 100 μL of sample. After 24 h of extraction at 25 °C, 50 μL of the extract was mixed with 50 μL of luciferin–luciferase reagent (Lumtek, Moscow, Russia), and the bioluminescence intensity was measured using a Microluminometer 3560 (New Horizons Diagnostic, Arbutus, MD, USA).
The intracellular ATP concentration was determined at the beginning and after completion of exposure to AMPs, fungicide or antifungal enzyme combinations, using a calibration curve prepared from standard ATP solutions (10−10–10−7 M). All assays were carried out in triplicate.
Statistical analysis was conducted using SigmaPlot (ver. 12.5, Systat Software Inc., San Jose, CA, USA). Unless otherwise specified, data are reported as means ± standard deviation (±SD) from a minimum of three independent experiments. One-way ANOVA followed by the Holm–Sidak method, and paired t-tests were used for pairwise comparisons, with p < 0.05 considered to be indicative of statistical significance.

3. Results

3.1. Computational Modeling of the Interactions of Hydrolytic Enzymes with the Fungal Cell Wall Components

Based on a literature review, four hydrolytic enzymes, Bgy6, ChiC, Ega3, and Lysozyme (Table 1), were chosen for in silico simulations.
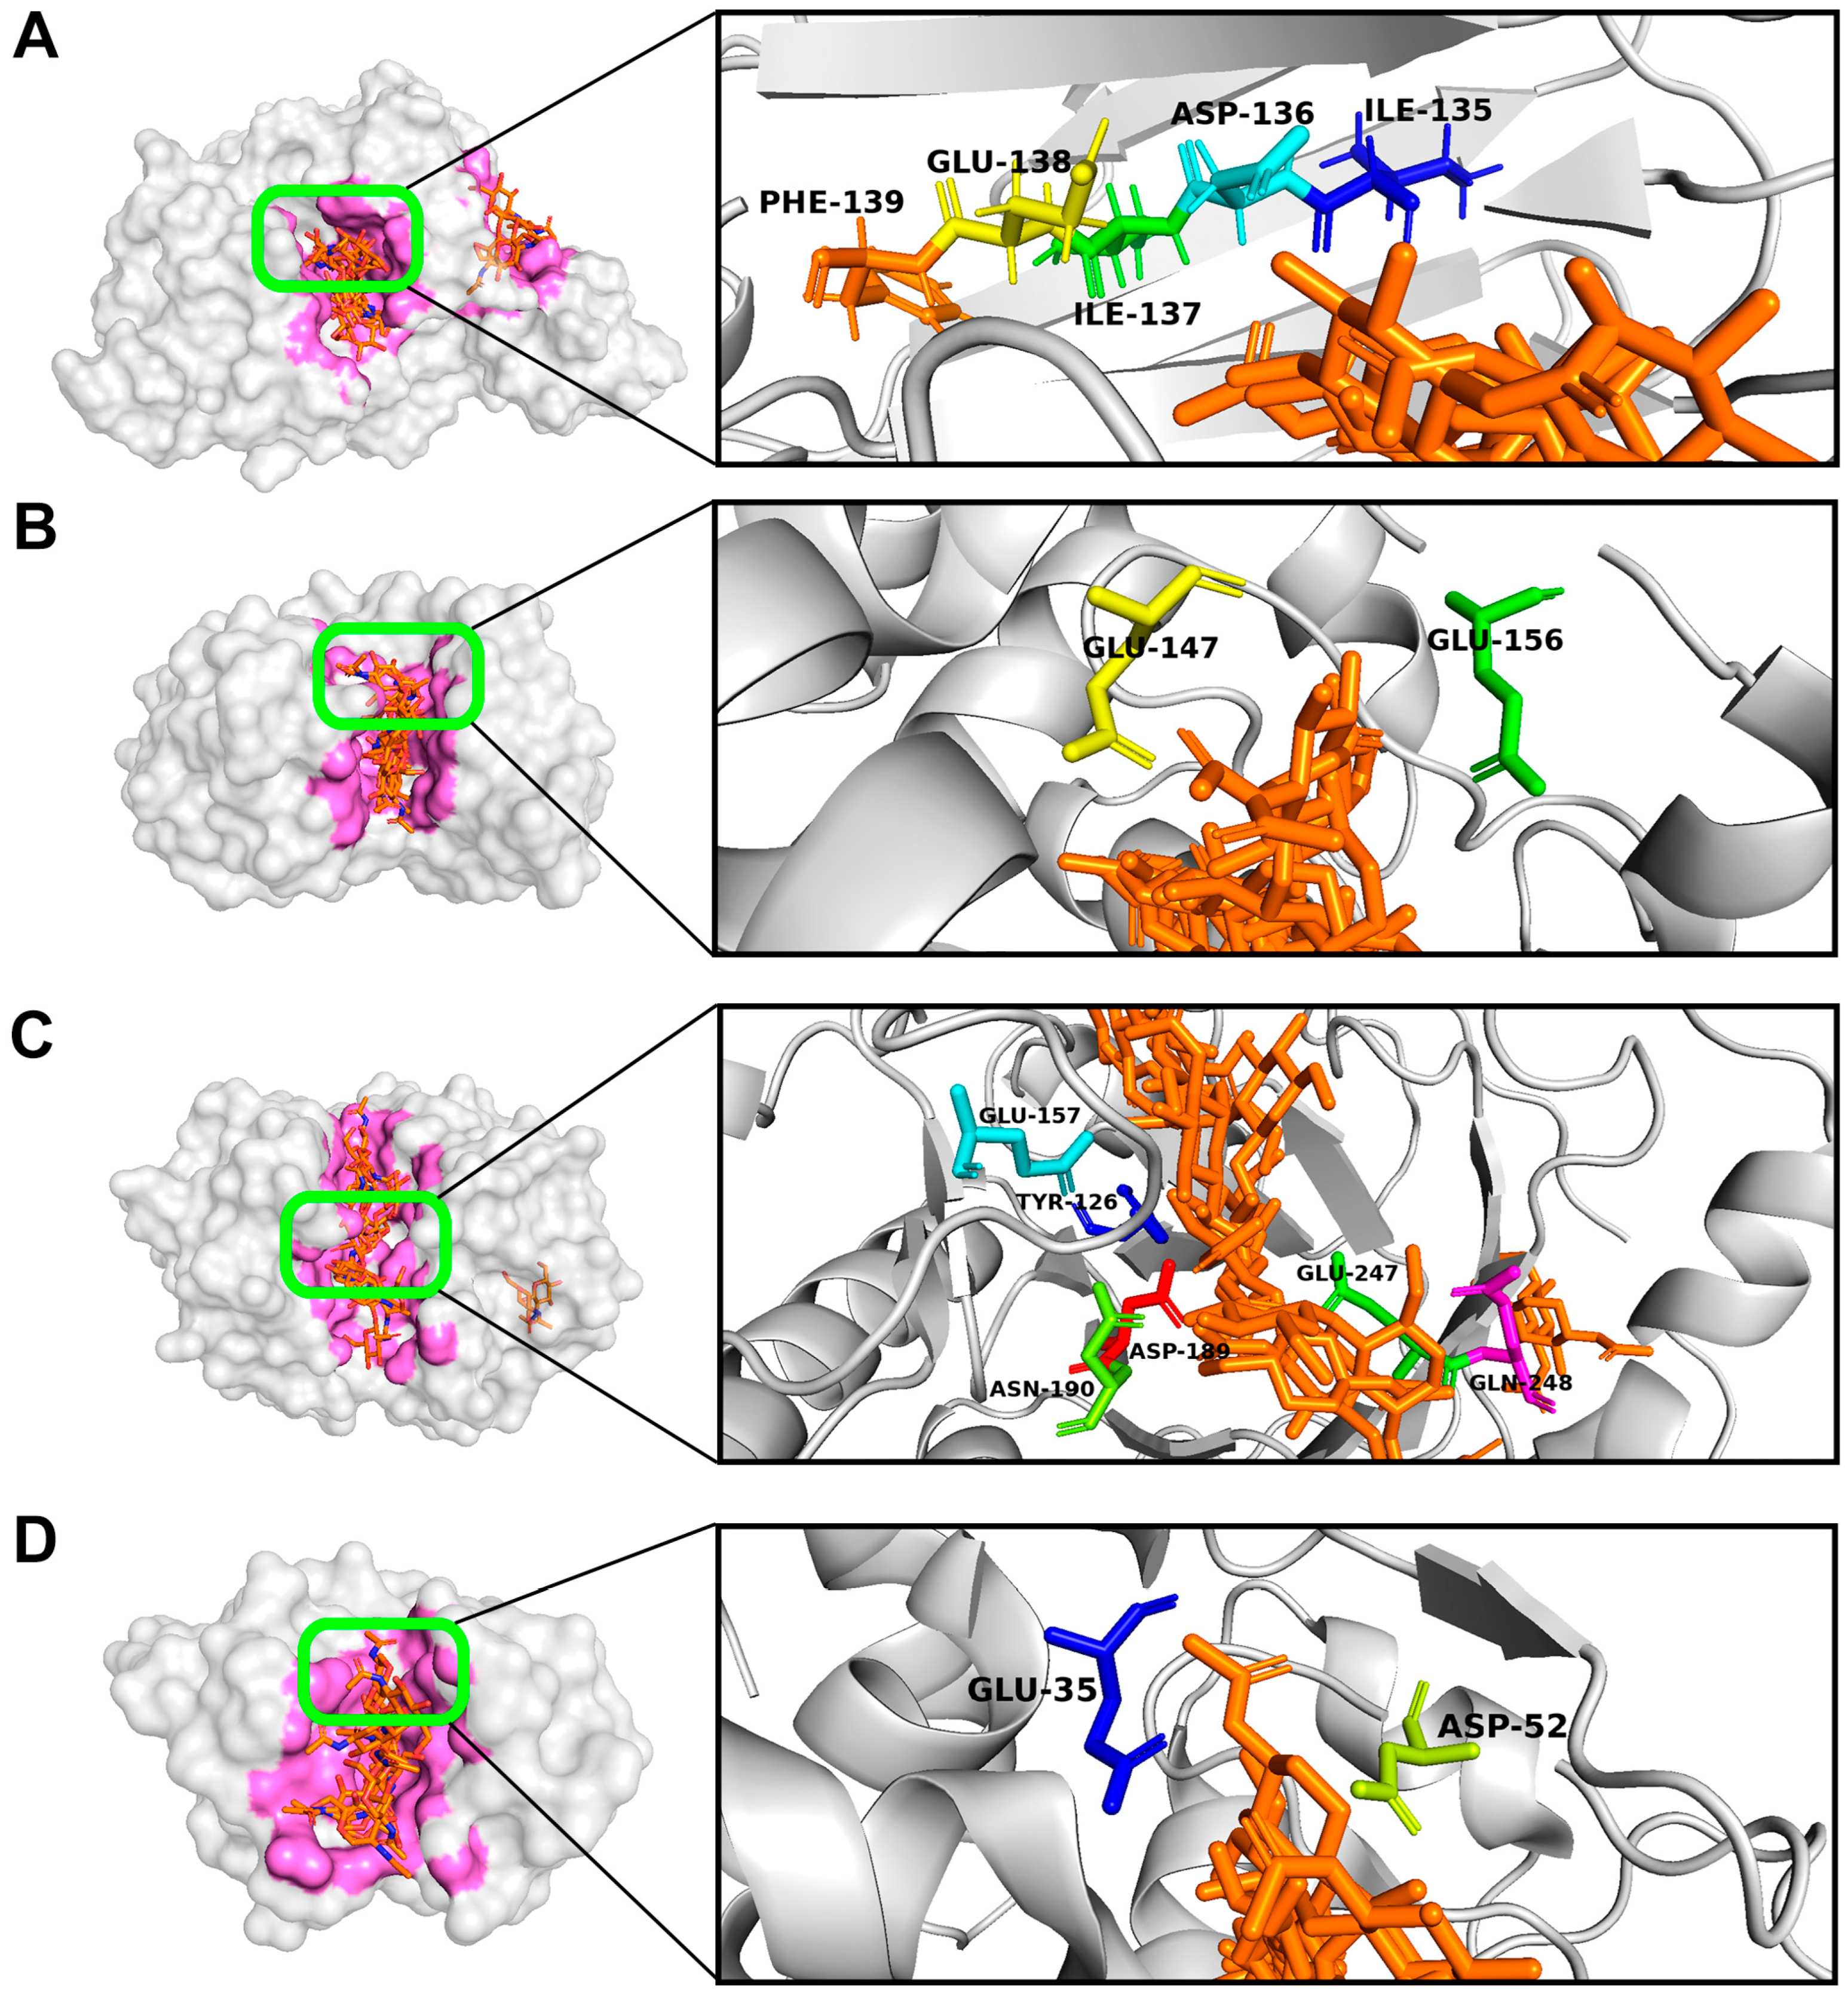
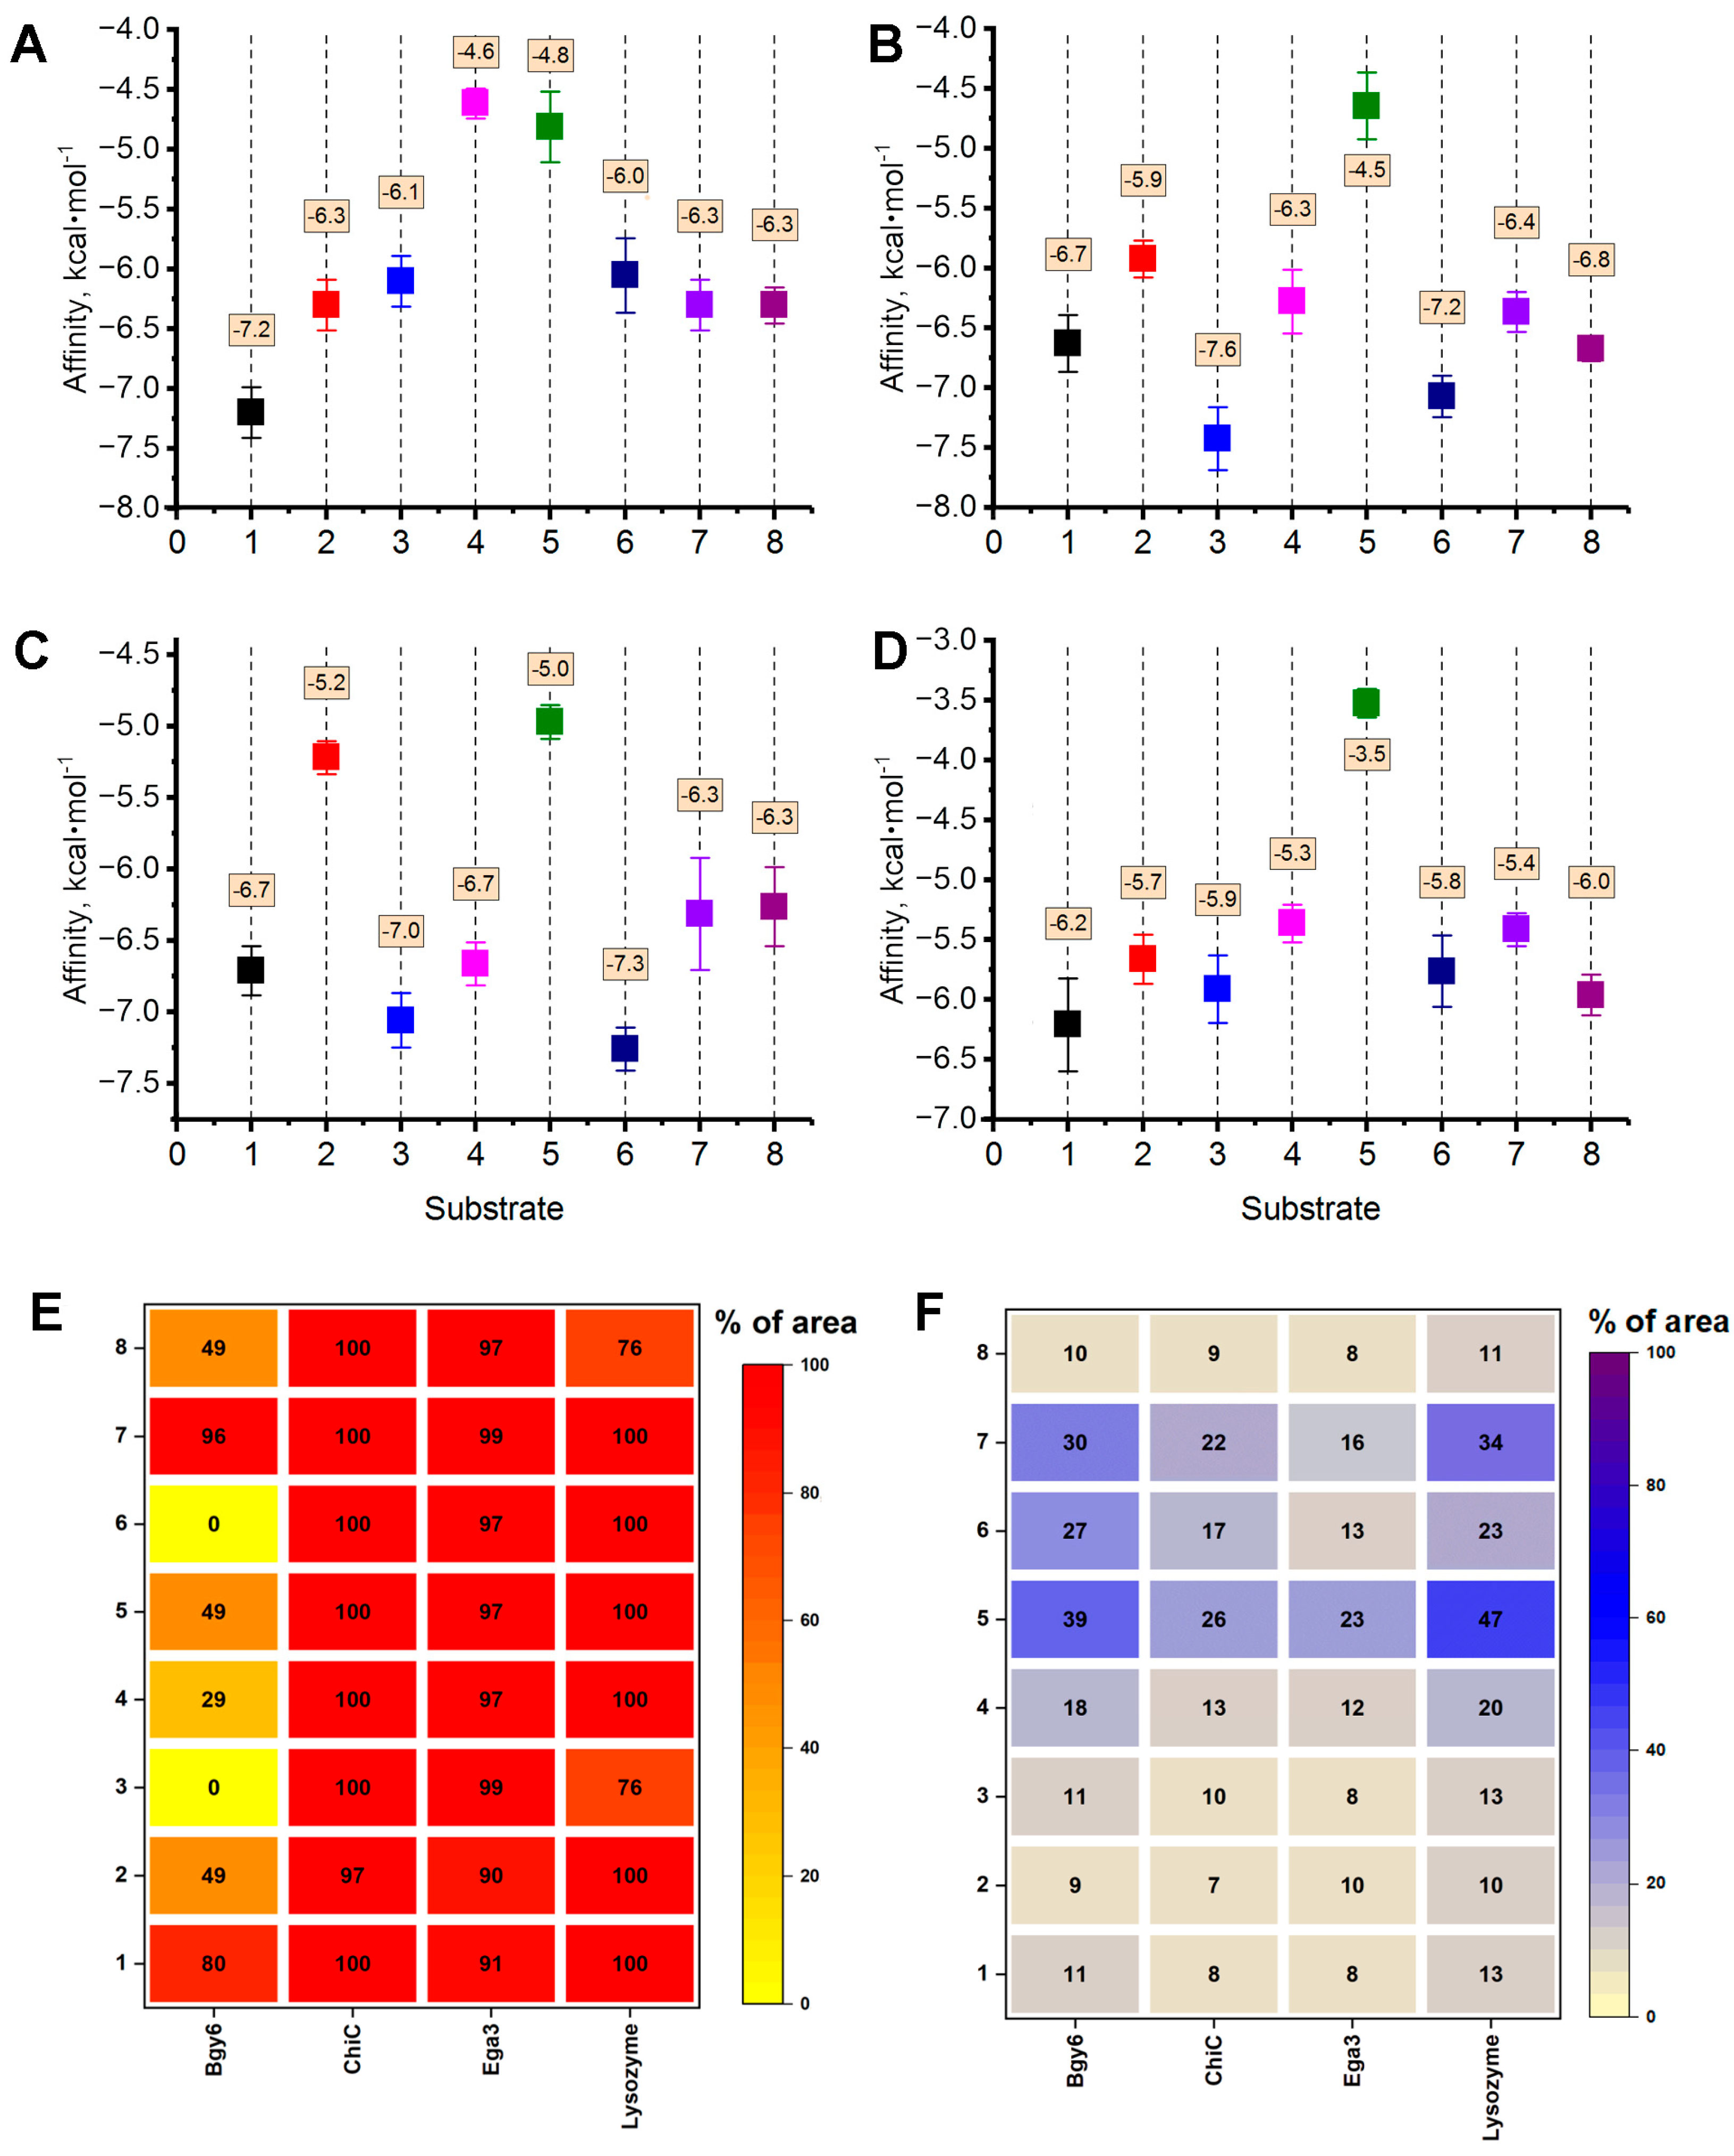
The interactions of these enzymes with eight different model molecules representing fungal cell wall components (Figure S1) were investigated using the molecular docking method (Figure 2 and Figures S2–S5). Interaction characteristics, including the area occupied by the fungal cell wall molecules on the enzyme’s total surface and near the active site, as well as the affinity (binding energy) values of the fungal cell wall molecules to the enzyme’s surface, were analyzed across the 32 resulting “enzyme–cell wall component” interaction models (Figure 3).
Analysis of the areas occupied by the substrate molecules (cell wall components) near the active sites on the surface of the studied enzymes indicated a high probability of biocatalysis (>50%) for all molecules in three of the four hydrolases (Ega3, Lysozyme, and ChiC).
For the Bgy6 enzyme, a high probability of biocatalysis was established for six out of the eight fungal cell wall molecules, with Chitin tetramer and Chitosan being the exceptions.
A comparison of the affinity values revealed that the strongest interactions with the enzymes’ surfaces were typically observed for the allosamidin molecule (Bgy6, Lysozyme), while the weakest binding occurred for the Chitin octadecamer molecule (ChiC, Ega3). Notably, the strongest interaction with the Ega3 surface was observed for the Chitosan molecule, whereas the Chitosan binding to Lysozyme surface was the weakest.
Overall, the in silico analysis of the interactions between eight model molecules of the fungal cell wall components and the surfaces of four hydrolytic enzymes indicated that these enzymes merit further study in combination with AMPs or PAAs.

3.2. Computational Modeling of the Interactions of Enzymes Degrading the Fungal Cell Wall Components with AMPs or PAAs

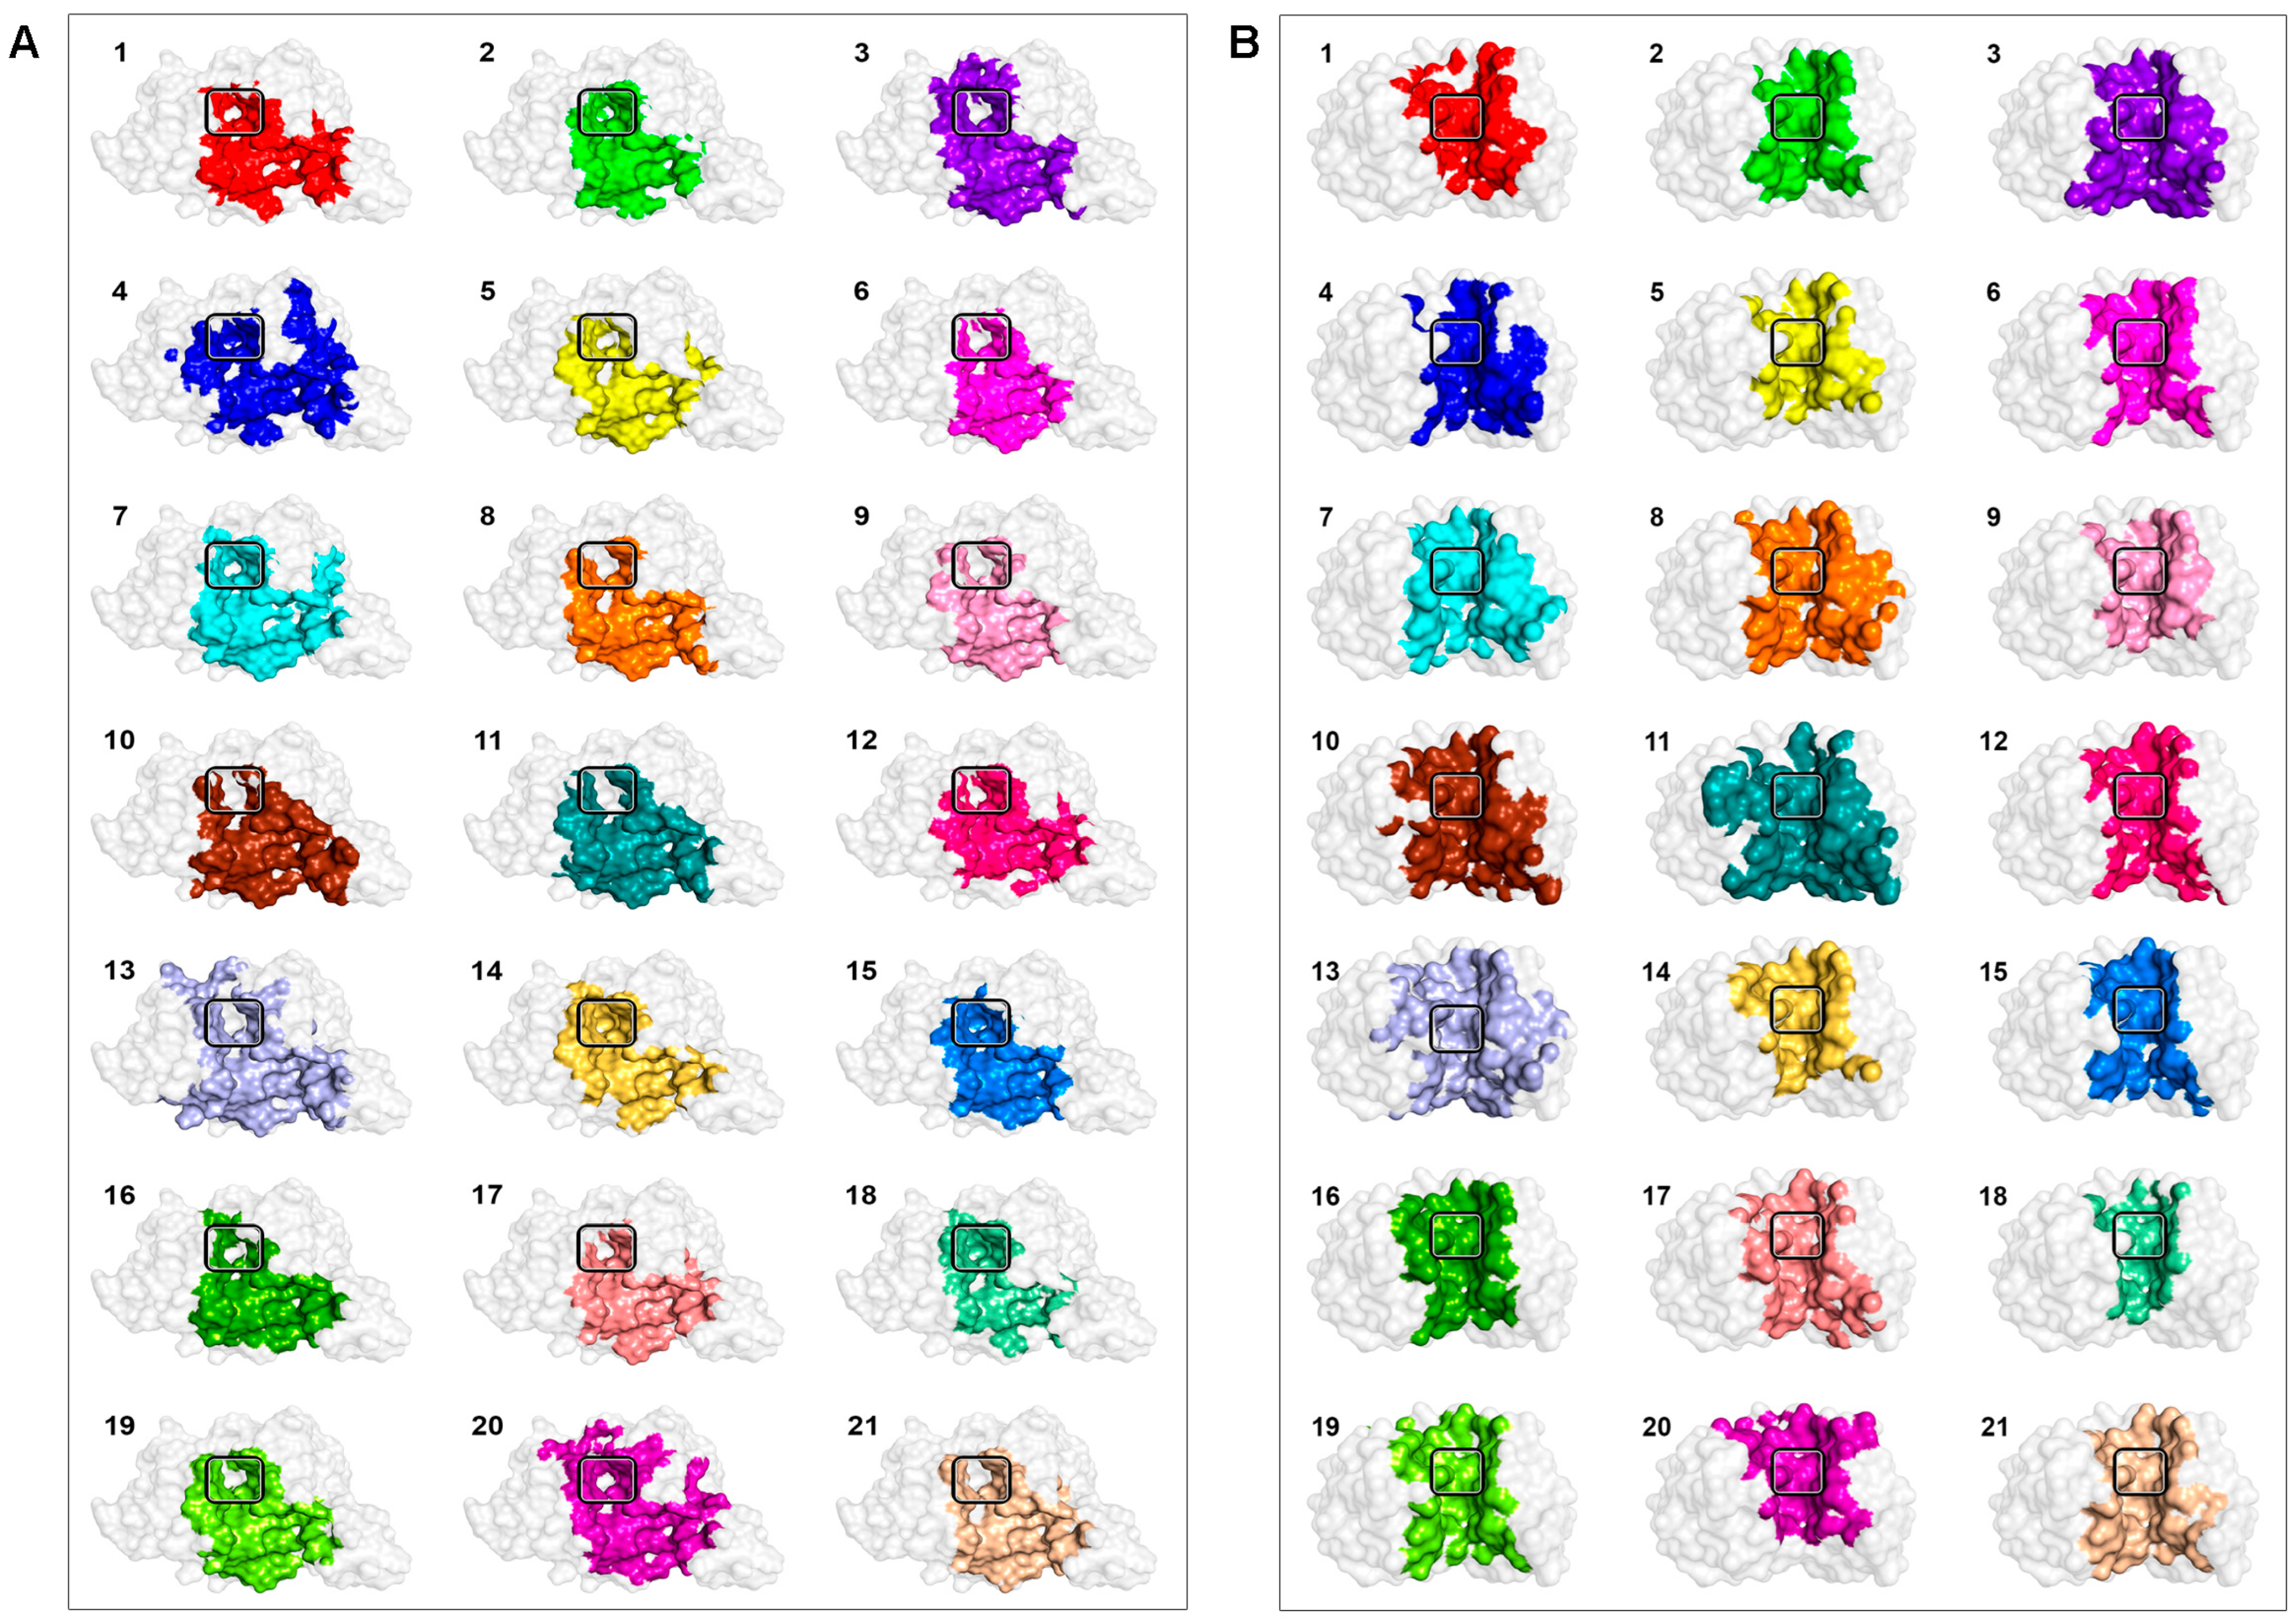
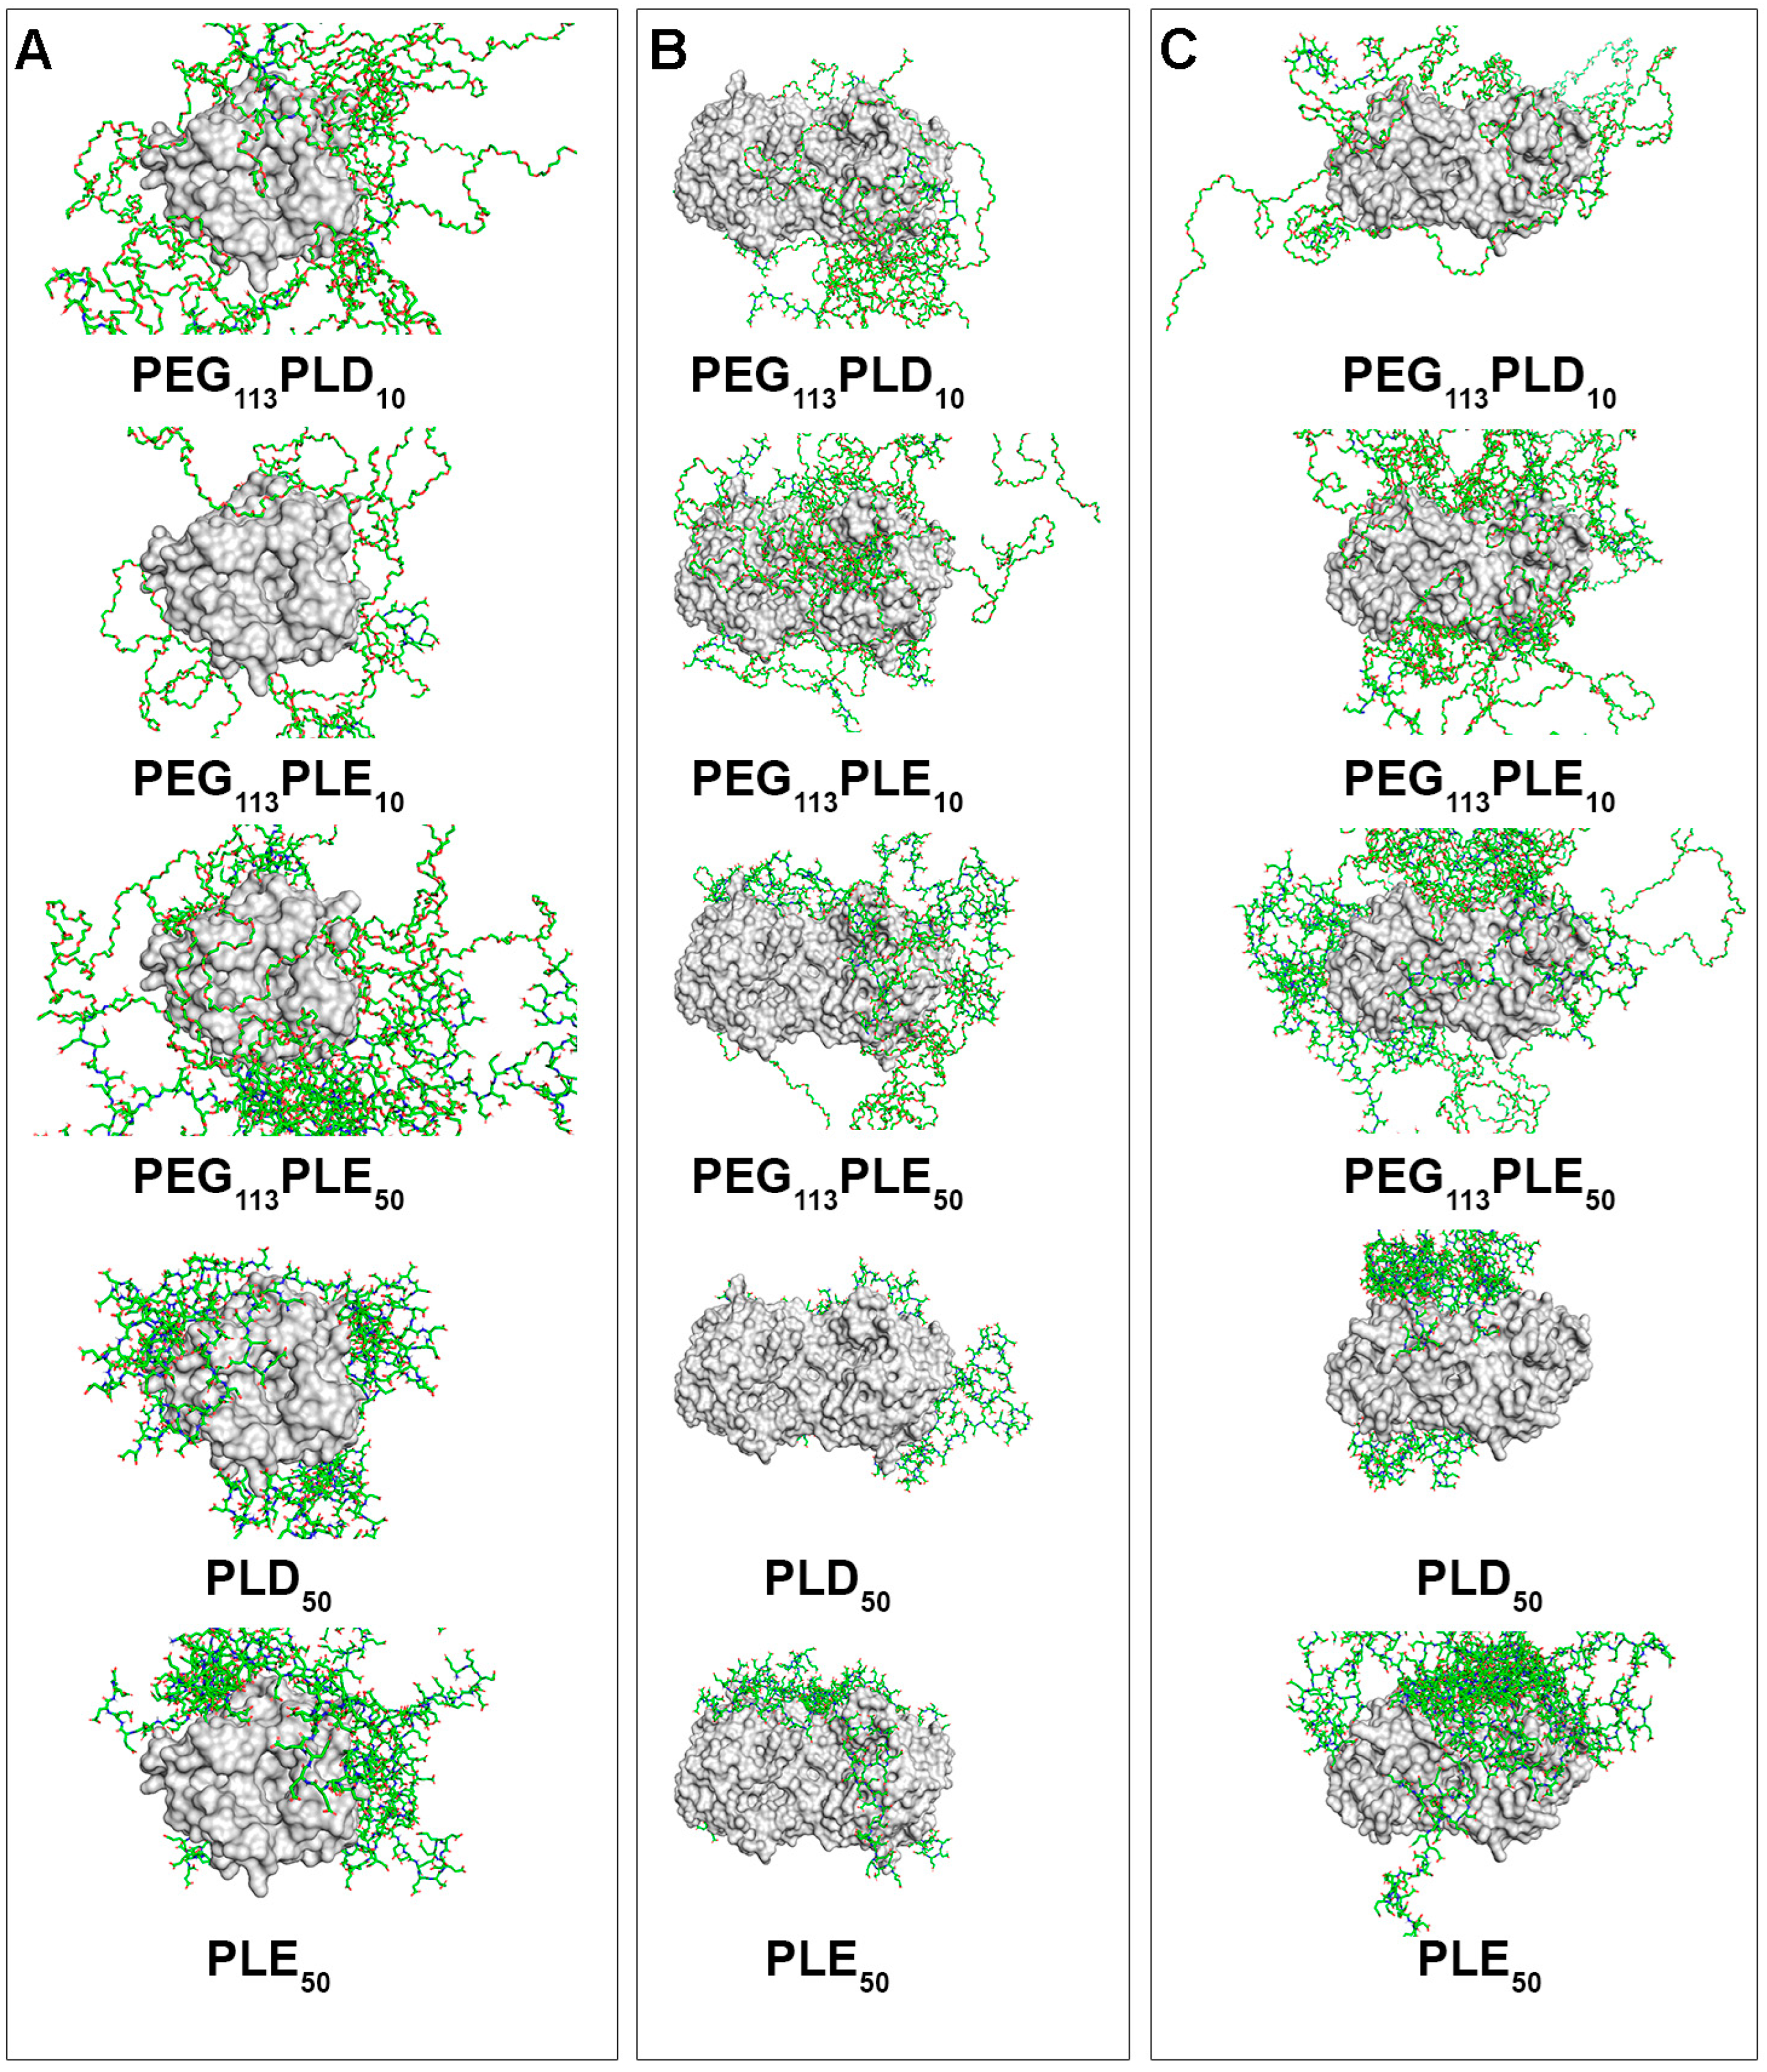
In silico studies were conducted to evaluate the interactions between Bgy6, ChiC, Ega3, and Lysozyme with 21 different AMP molecules (previously studied with lactonase enzymes [7]) and 14 different PAA molecules [19]. Molecular docking simulations were performed to assess the interactions of these AMPs and PAAs with the surface of the four selected enzymes (Figure 4, Figure 5, Figure 6 and Figure 7 and Figures S6–S11).

3.2.1. Interaction of AMPs with the Enzymes Degrading Fungal Cell Wall Components

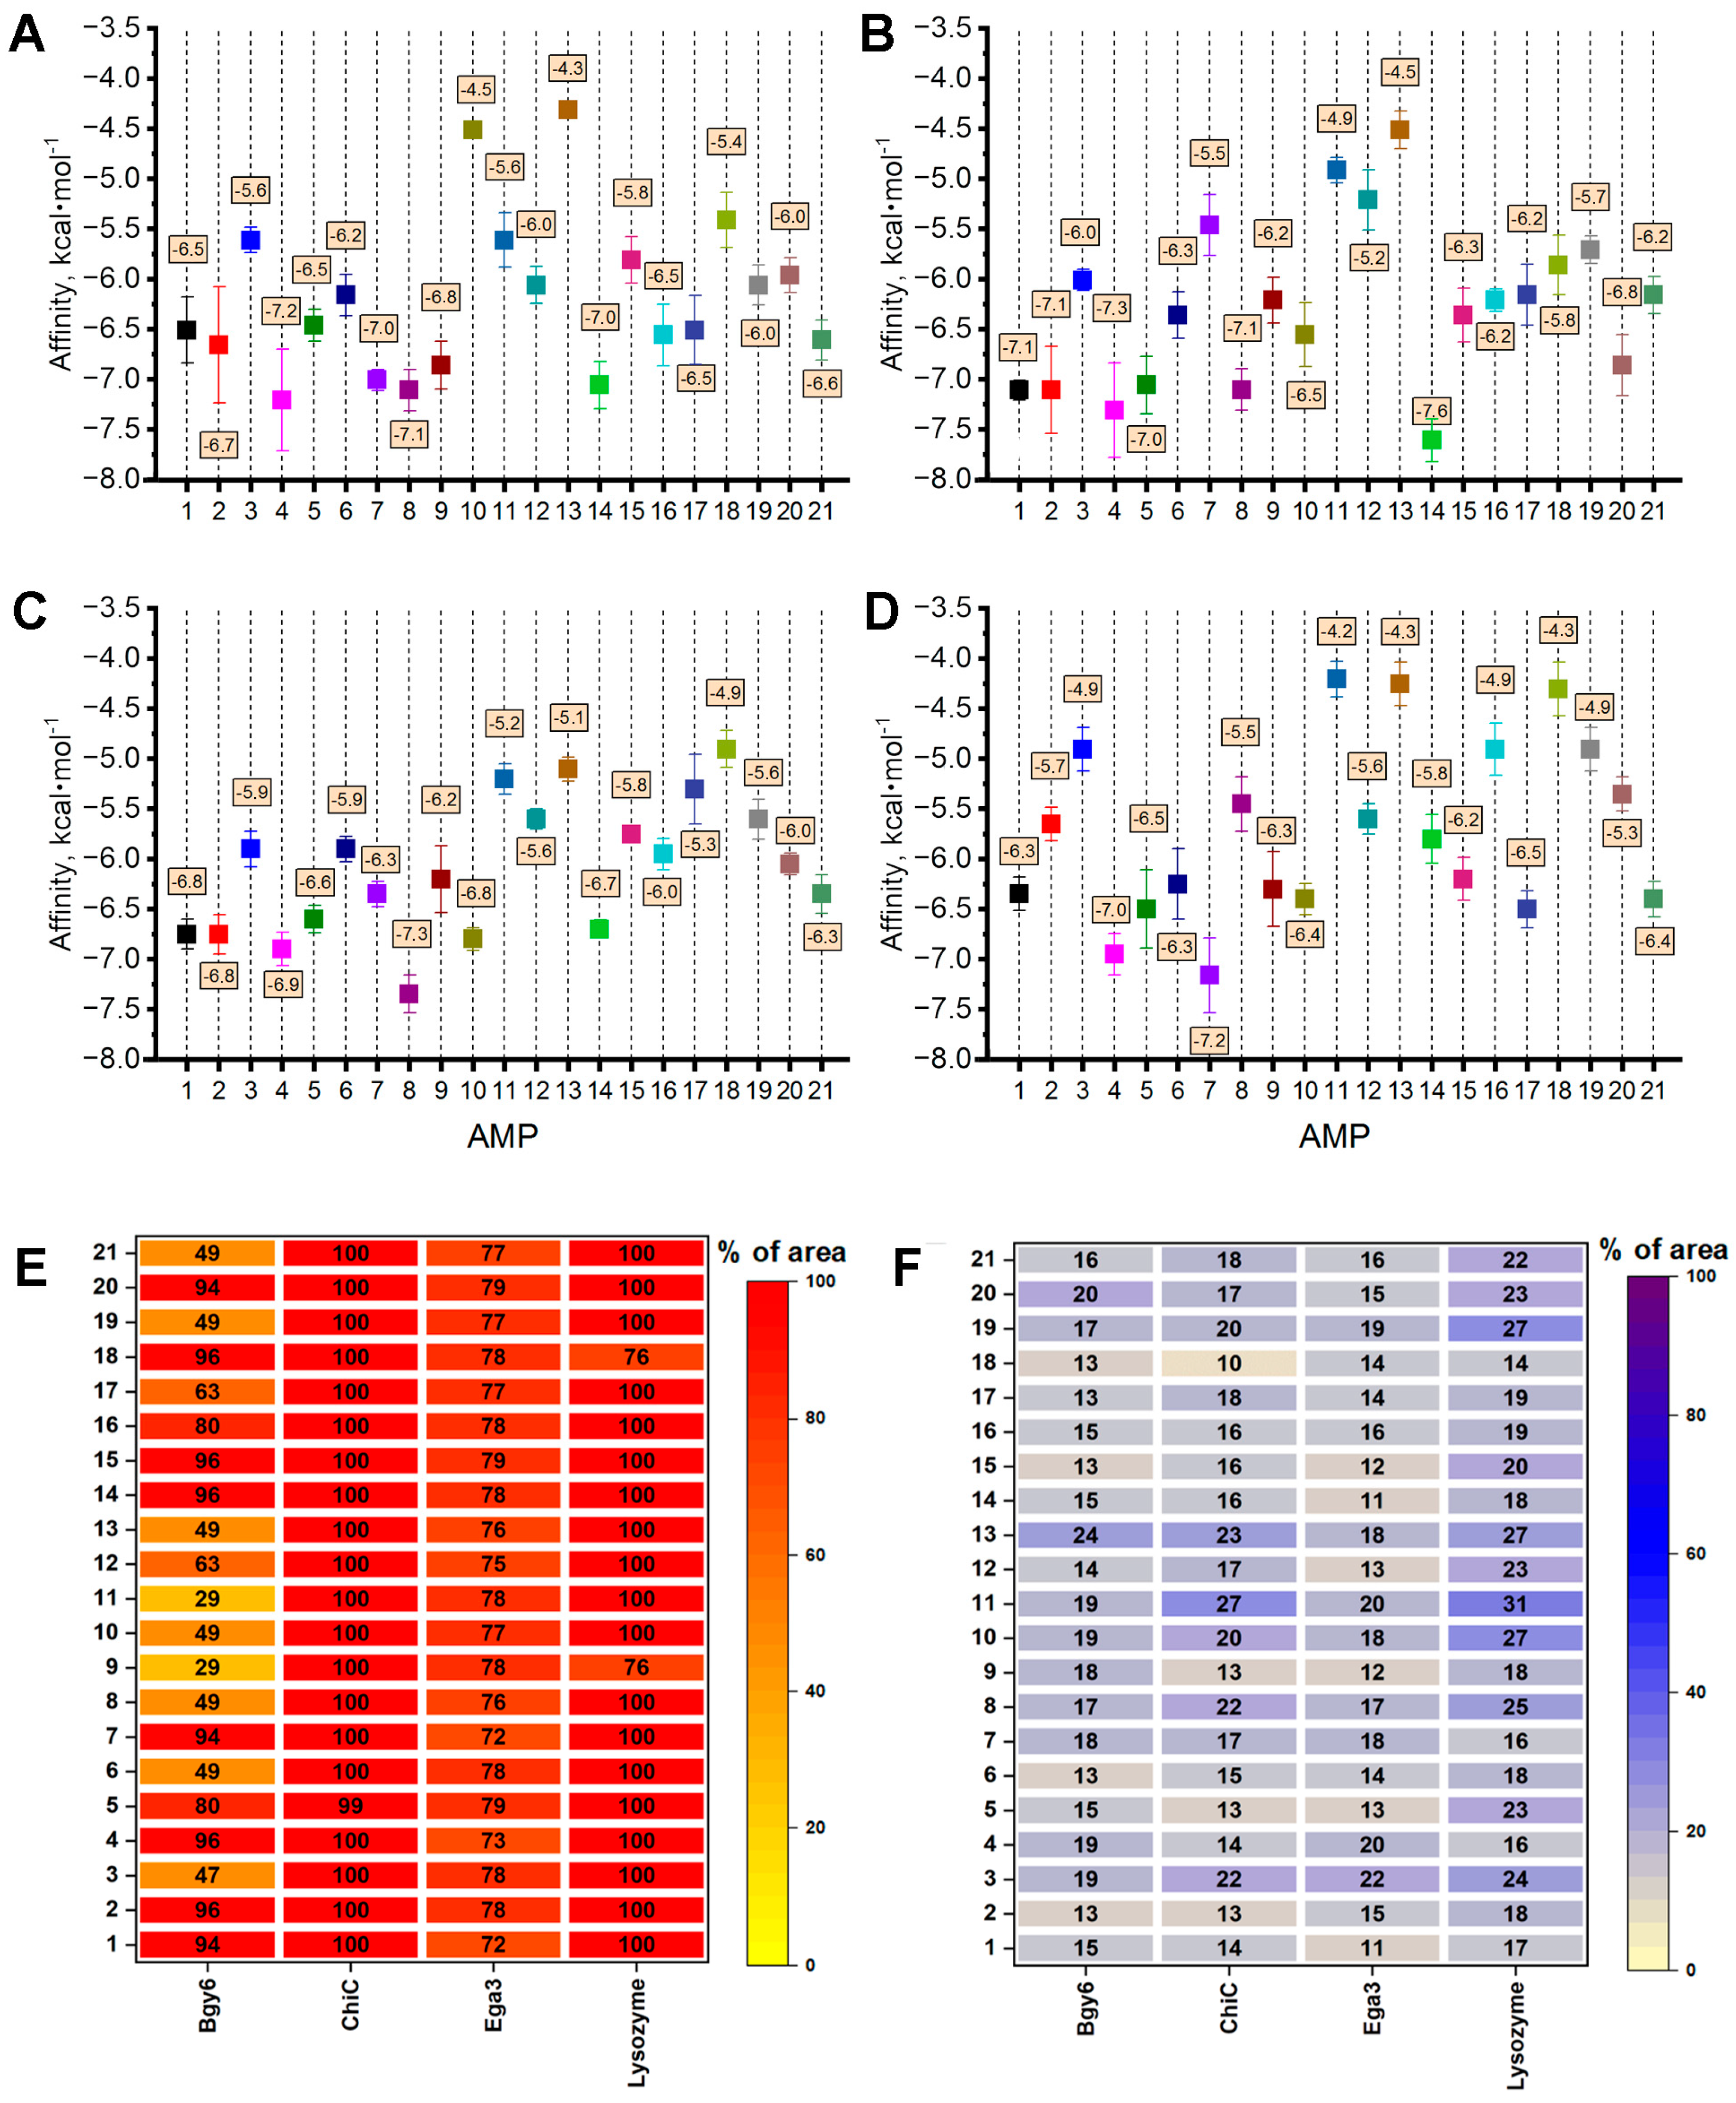
A total of 84 “enzyme–AMP” interaction models were generated from the in silico docking of 21 AMPs with the four enzymes. Interaction characteristics, including the surface area occupied by AMP molecules and their affinity values to the enzyme surfaces, were analyzed (Figure 4, Figure 5, Figures S6 and S7). Analysis of the areas occupied by AMP molecules near the enzymes’ active sites revealed that the active site entrances of ChiC, Ega3, and Lysozyme were completely blocked by all 21 AMP molecules.
In contrast, Bgy6 maintained partial access to its active site in interactions with 9 of the 21 AMPs (BMAP-18 (3), Colistin (6), Indolicidin (8), Iturin A (9), KK14 (10), Leg2 (11), Lfampin B (13), TC3 (19), and Temporin G (21)), while complete blockage was observed in the remaining cases.
Affinity analysis showed the strongest binding for the PAF26 molecule (14) with the surface of ChiC enzyme, and the weakest for the Leg2 molecule with the surface of Lysozyme (−7.6 and −4.2 kcal × mol−1, respectively).
Overall, these interactions were generally unfavorable for preserving the catalytic activity of enzymes. This is due to the fact that significant blocking of active sites occurred in nearly all cases, with the exception of the two AMPs interacting with Bgy6.

3.2.2. Interaction of PAAs with the Molecules of Enzymes Degrading Fungal Cell Wall Components

Molecules of the 14 different PAA molecules mentioned in Section 2.2 were docked to the surface of Bgy6, ChiC, Ega3, and Lysozyme, resulting in 56 “enzyme–PAA” interaction models (Figure 6, Figure 7 and Figures S8–S11). The same interaction characteristics as in the “enzyme–AMP” models, were analyzed, including occupied surface area and affinity values (Figure 7).
Analysis of the surface areas occupied by PAA molecules revealed that 23 of the 56 models showed complete occupation of the active sites of the enzymes that were completely occupied by PAA molecules. Further 3D visualization in PyMOL indicated that, in an additional nine models, the PAA molecules were located close enough to partially block access to the enzymes’ active sites, potentially reducing or abolishing the efficiency of catalytic reactions.
Thus, in total, 32 of the 56 models exhibited significant or complete blockage of the active sites.
Binding affinities of PAA molecules to the enzymes’ surfaces were generally low, averaging −2.2 kcal × mol−1, with exceptions for the PLD10 and PLE10 molecules, which exhibited higher affinities −5.9 ± 0.36 and −5.8 ± 0.4 kcal × mol−1, respectively.
Among the enzymes studied, Lysozyme showed the strongest interaction with PAA molecules, whereas ChiC showed the weakest, which may influence the enzymes’ stabilization and their long-term catalytic potential.
Therefore, the molecular docking identified Bgy6 and ChiC as the enzymes with the highest number of “positive” “enzyme–PAA” interactions (7 out of 16). The most suitable PAA molecules for these combinations were PEG113PLD50 (3), PEG113PLE10 (5), PEG113PLE50 (6), PLD50 (9), PLE50 (12), and PLE50PEG113PLE50 (13).

3.3. Computational Modeling of the Interactions of PAAs with Enzymes Exhibiting Lactonase Activity

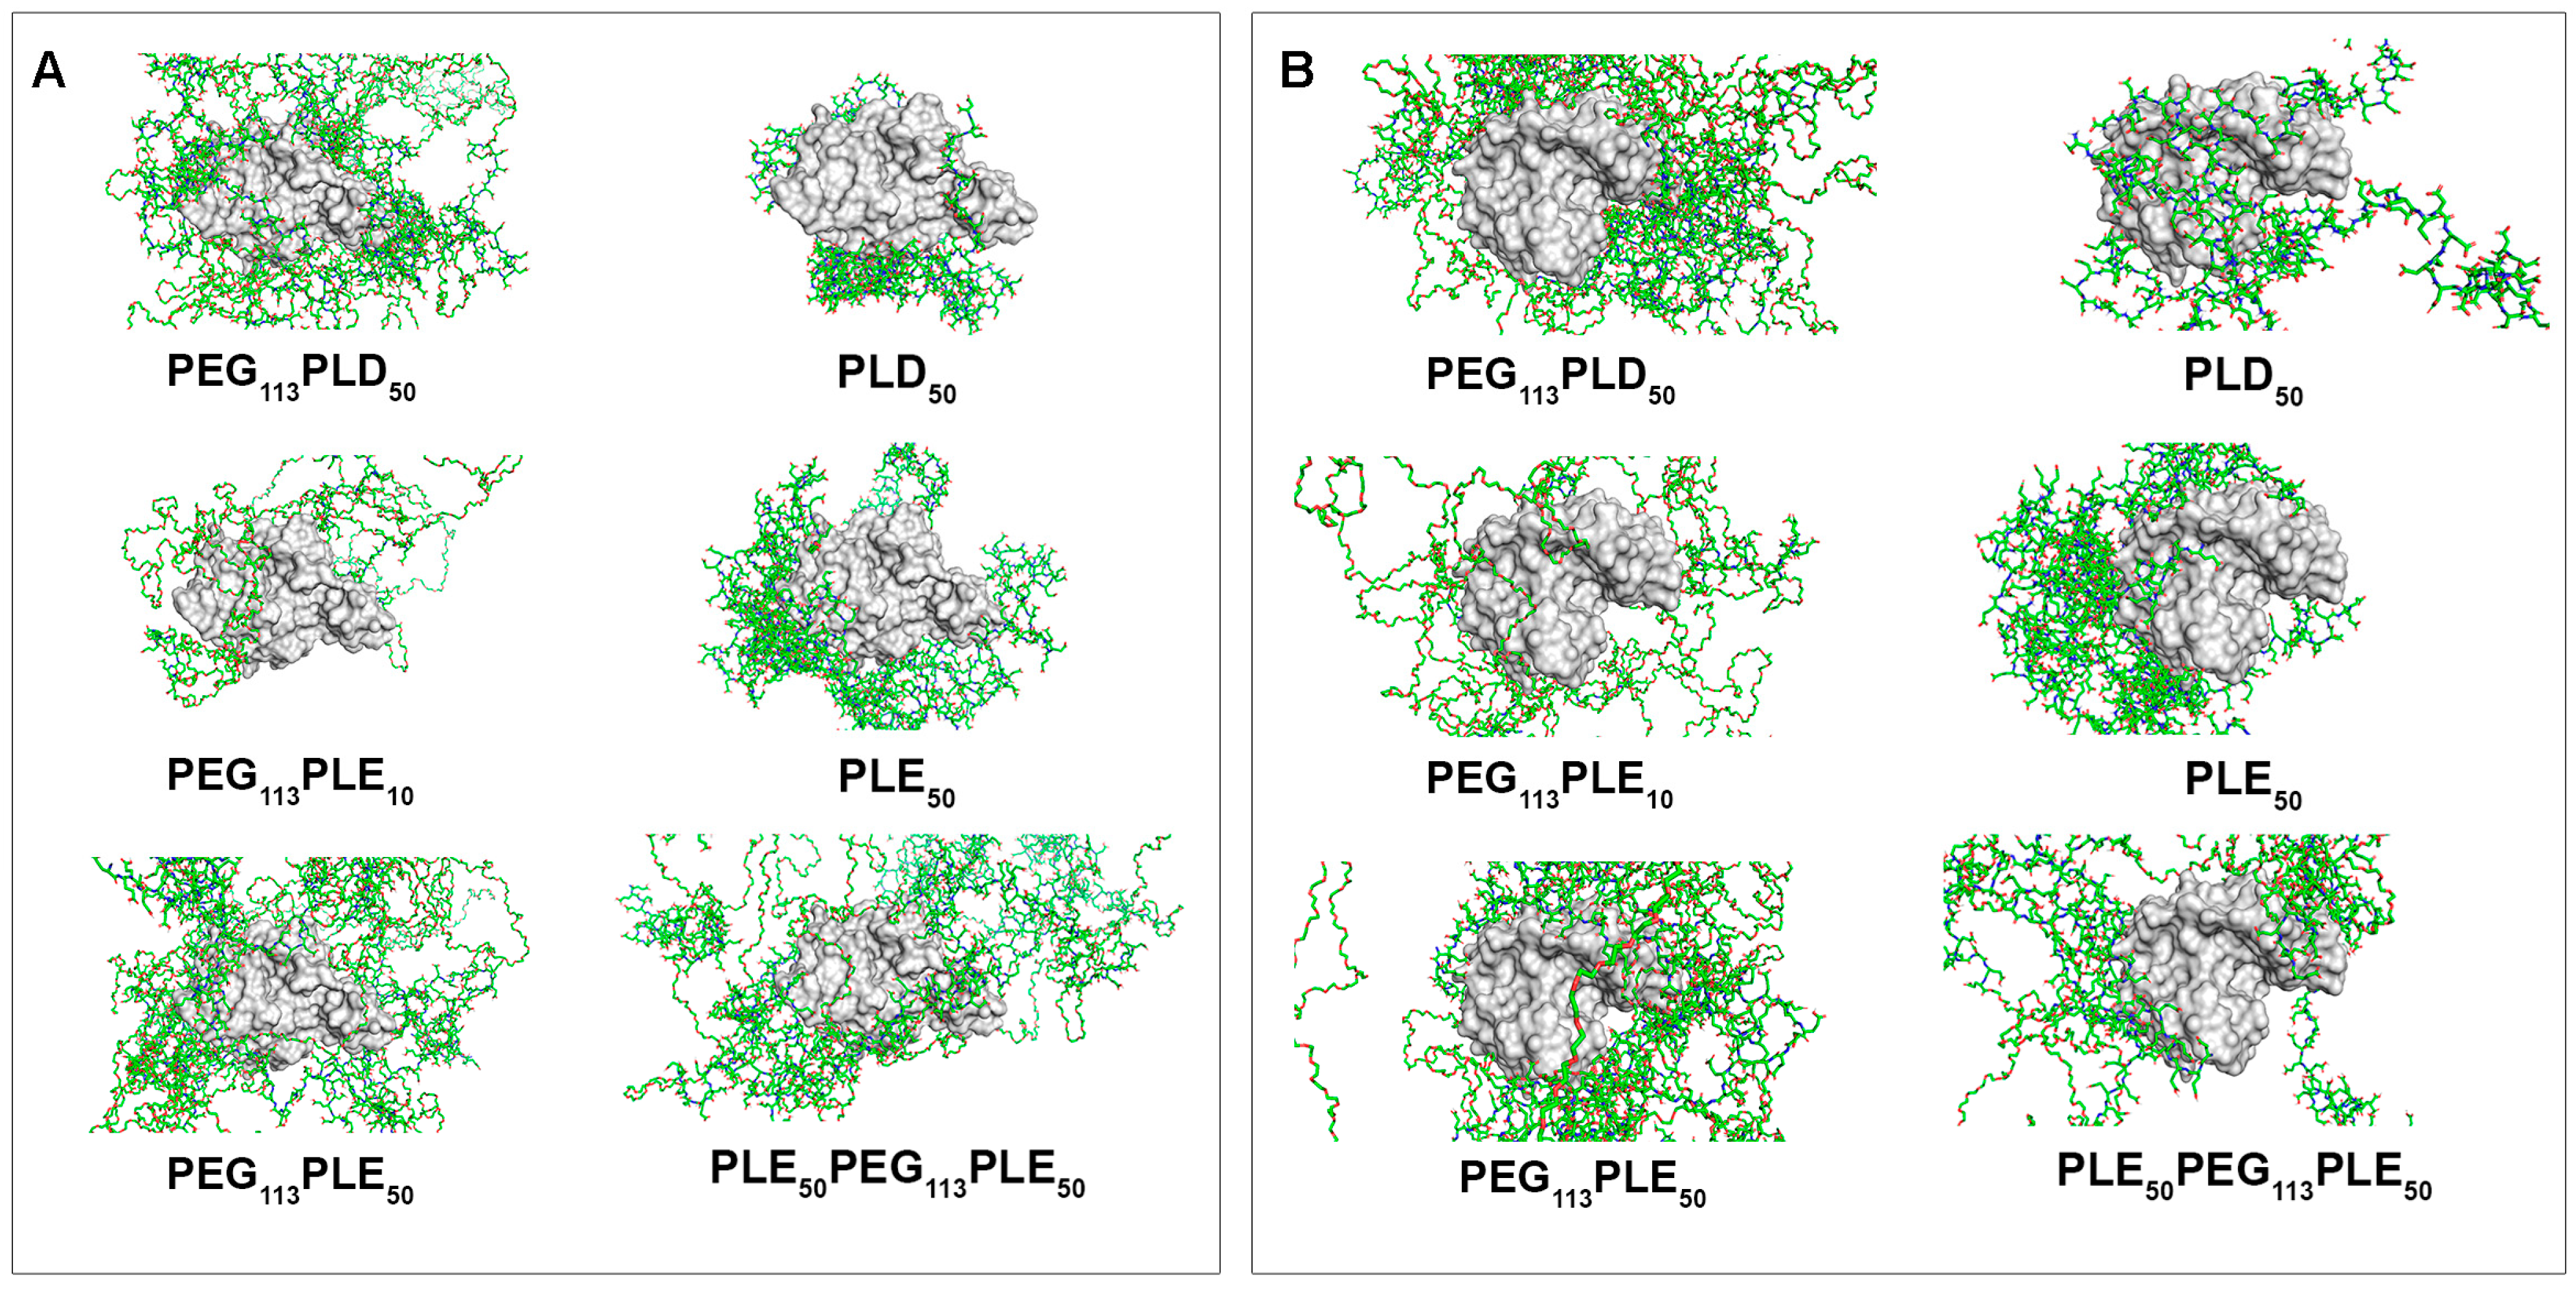
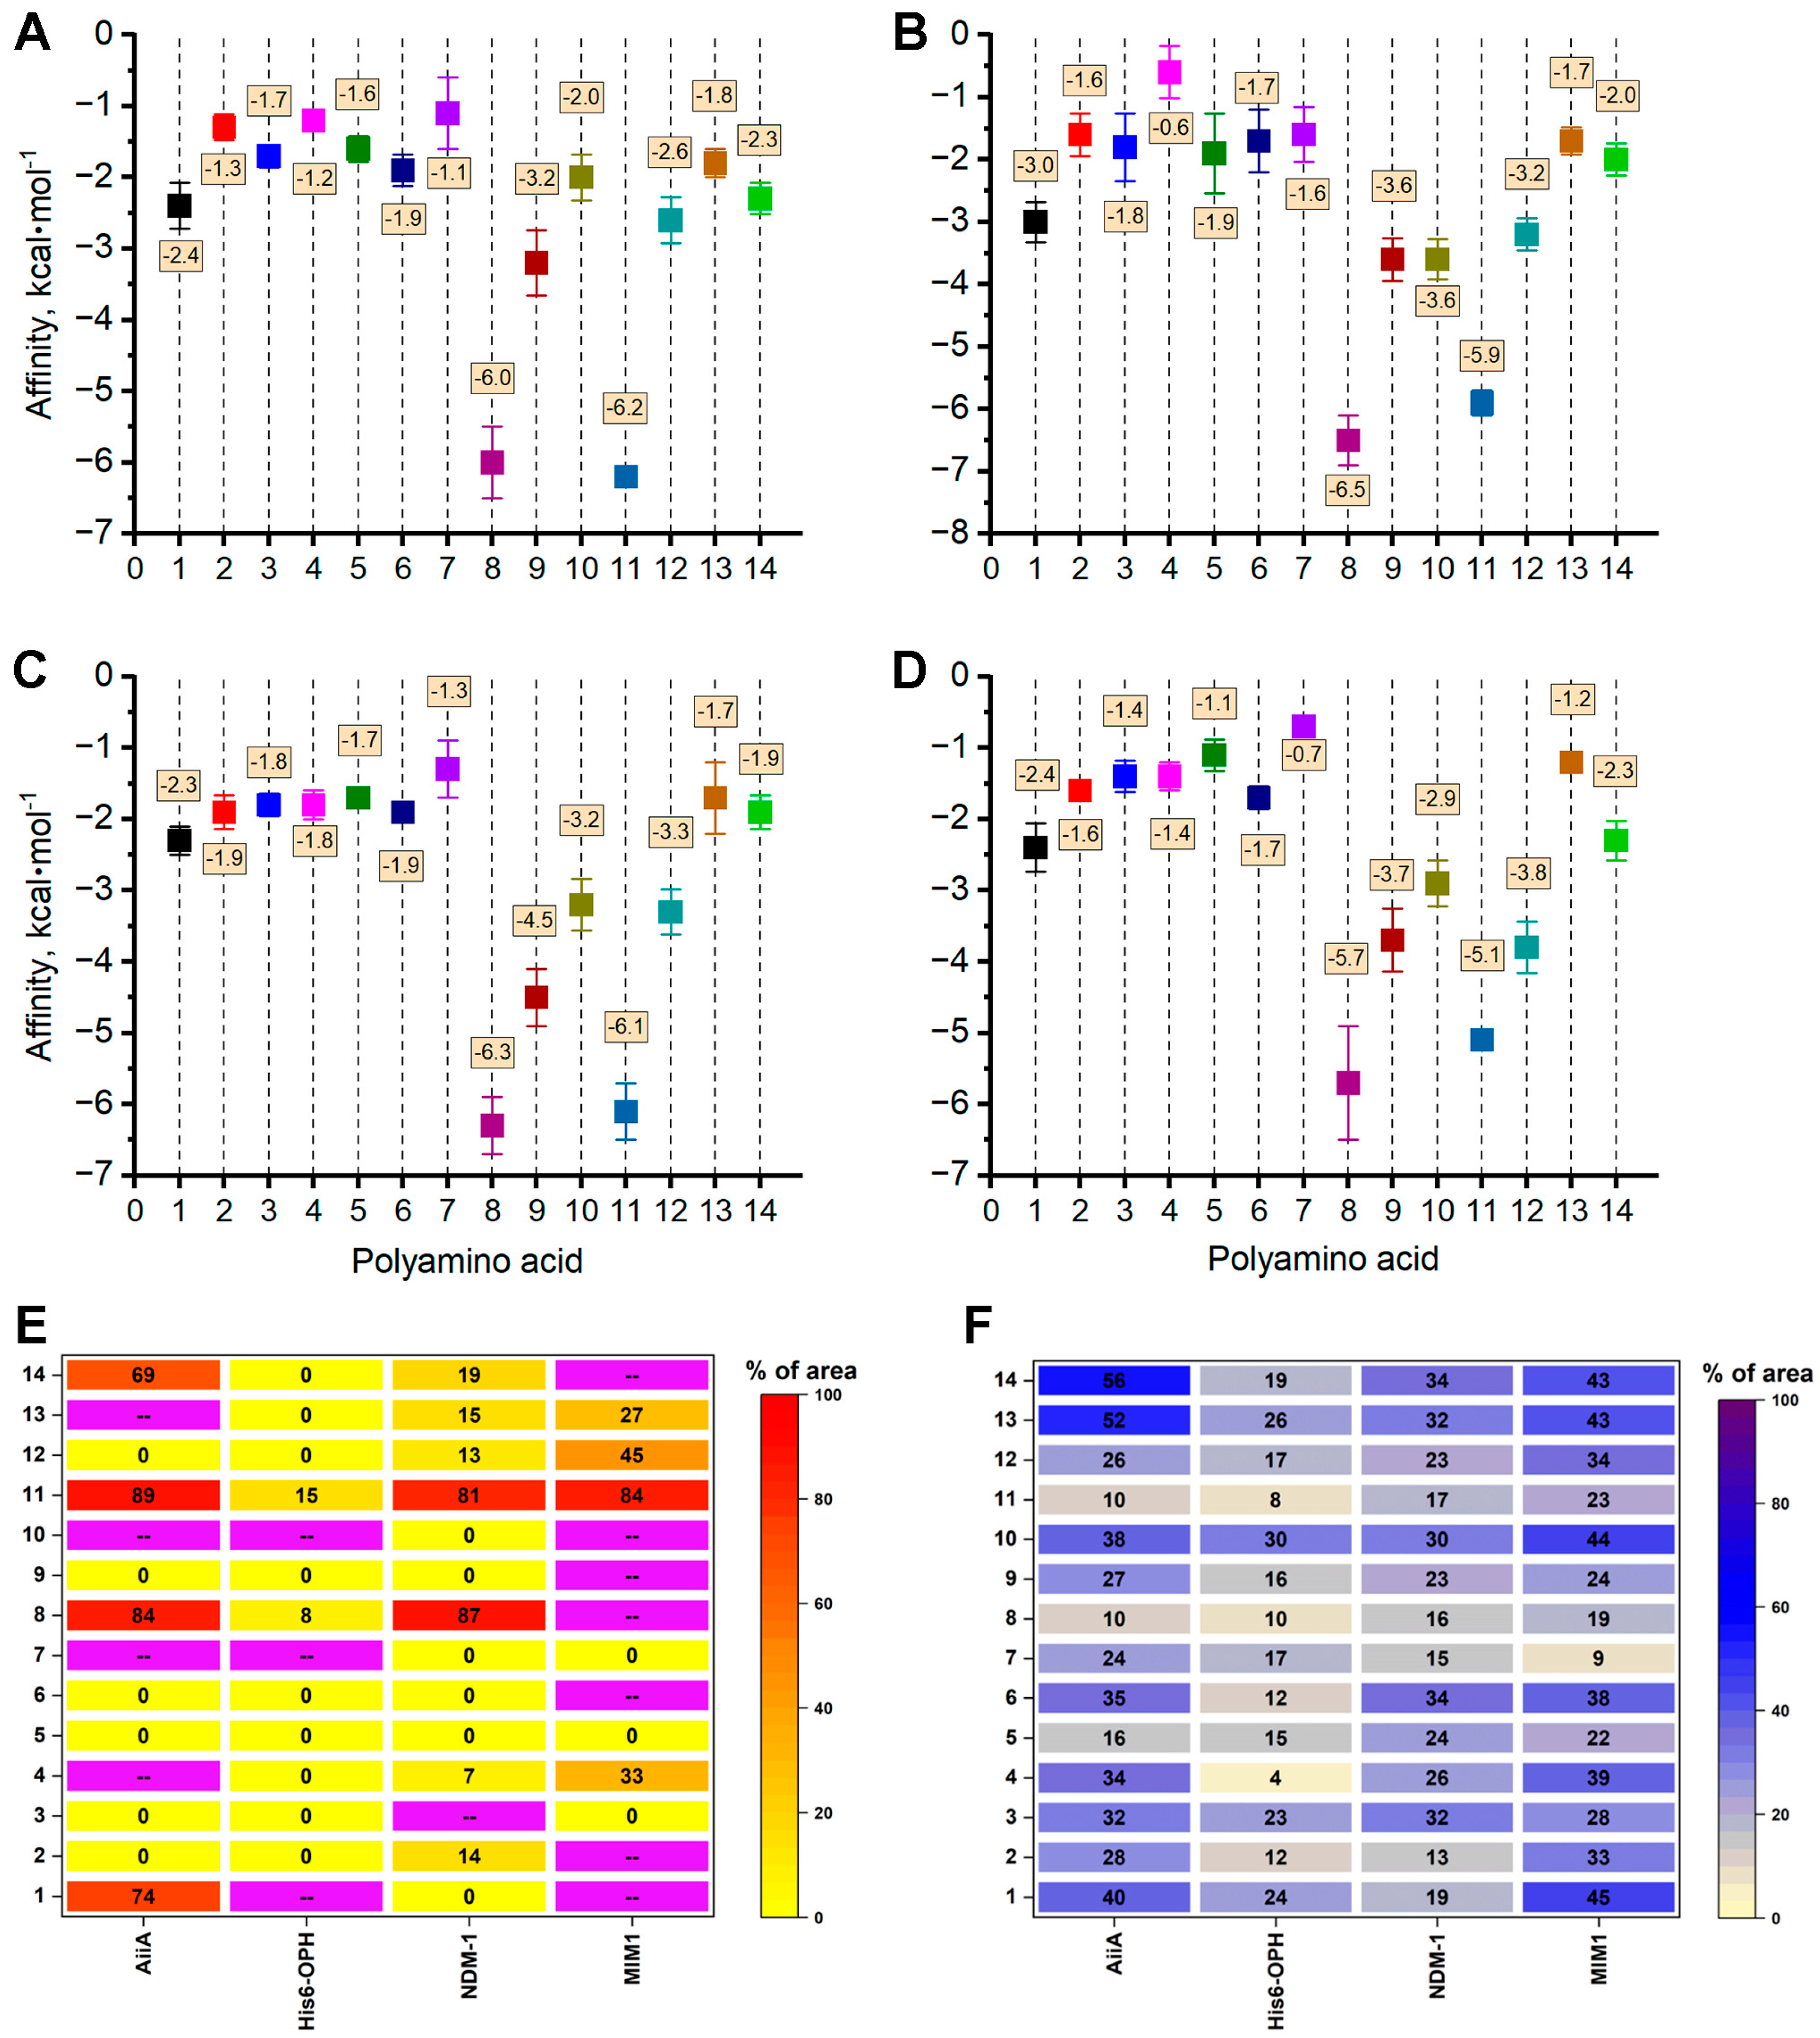
As already mentioned, the interactions of various AMPs with enzymes exhibiting lactonase activity toward lactone-containing fungal Quorum molecules were studied in our earlier work [7]. In the present study, we assessed the interactions of these enzymes with the same 14 PAA molecules described in Section 2.2 and Section 3.2. Molecular docking of these PAA molecules to the surfaces of four lactonase enzymes (AiiA, His6-OPH, NDM-1, and MIM-1) was performed, resulting in 56 corresponding interaction models (Figure 8 and Figures S12–S15). The interaction characteristics were analyzed as in previous studies (Figure 9).
Analysis of the surface areas near the active sites occupied by PAA molecules revealed complete active site occupation in 7 of the 56 models. Similarly to the enzymes degrading fungal cell wall components, 3D visualization using PyMOL identified an additional 14 cases in which access to the active sites was partially blocked. Overall, significant or complete active site blockage was observed in 21 of the 56 “enzyme–PAA” models for lactonase enzymes.
The affinity values of the PAAs to the enzymes’ surfaces varied slightly, averaging 2.8 kcal × mol−1. Among the lactonase enzymes studied, the strongest interaction was observed for the PLD10 molecule with the His6-OPH surface, whereas the weakest was observed for the PEG113PLE10 with MIM-1.
Analysis of the favorable interactions indicated the highest number of “positive” “enzyme–PAA” models for AiiA (6 of 14), His6-OPH (9 of 14), and NDM-1 (10 of 14), while only four PAAs exhibited favorable interactions with MIM1. The most suitable molecules for combination with this enzyme group were PEG113PLD10 (2), PEG113PLE10 (5), PEG113PLE50 (6), PLD50 (9), and PLE50 (12).

3.4. Catalytic and Physical-Chemical Characteristics of Antifungal Enzyme Combinations

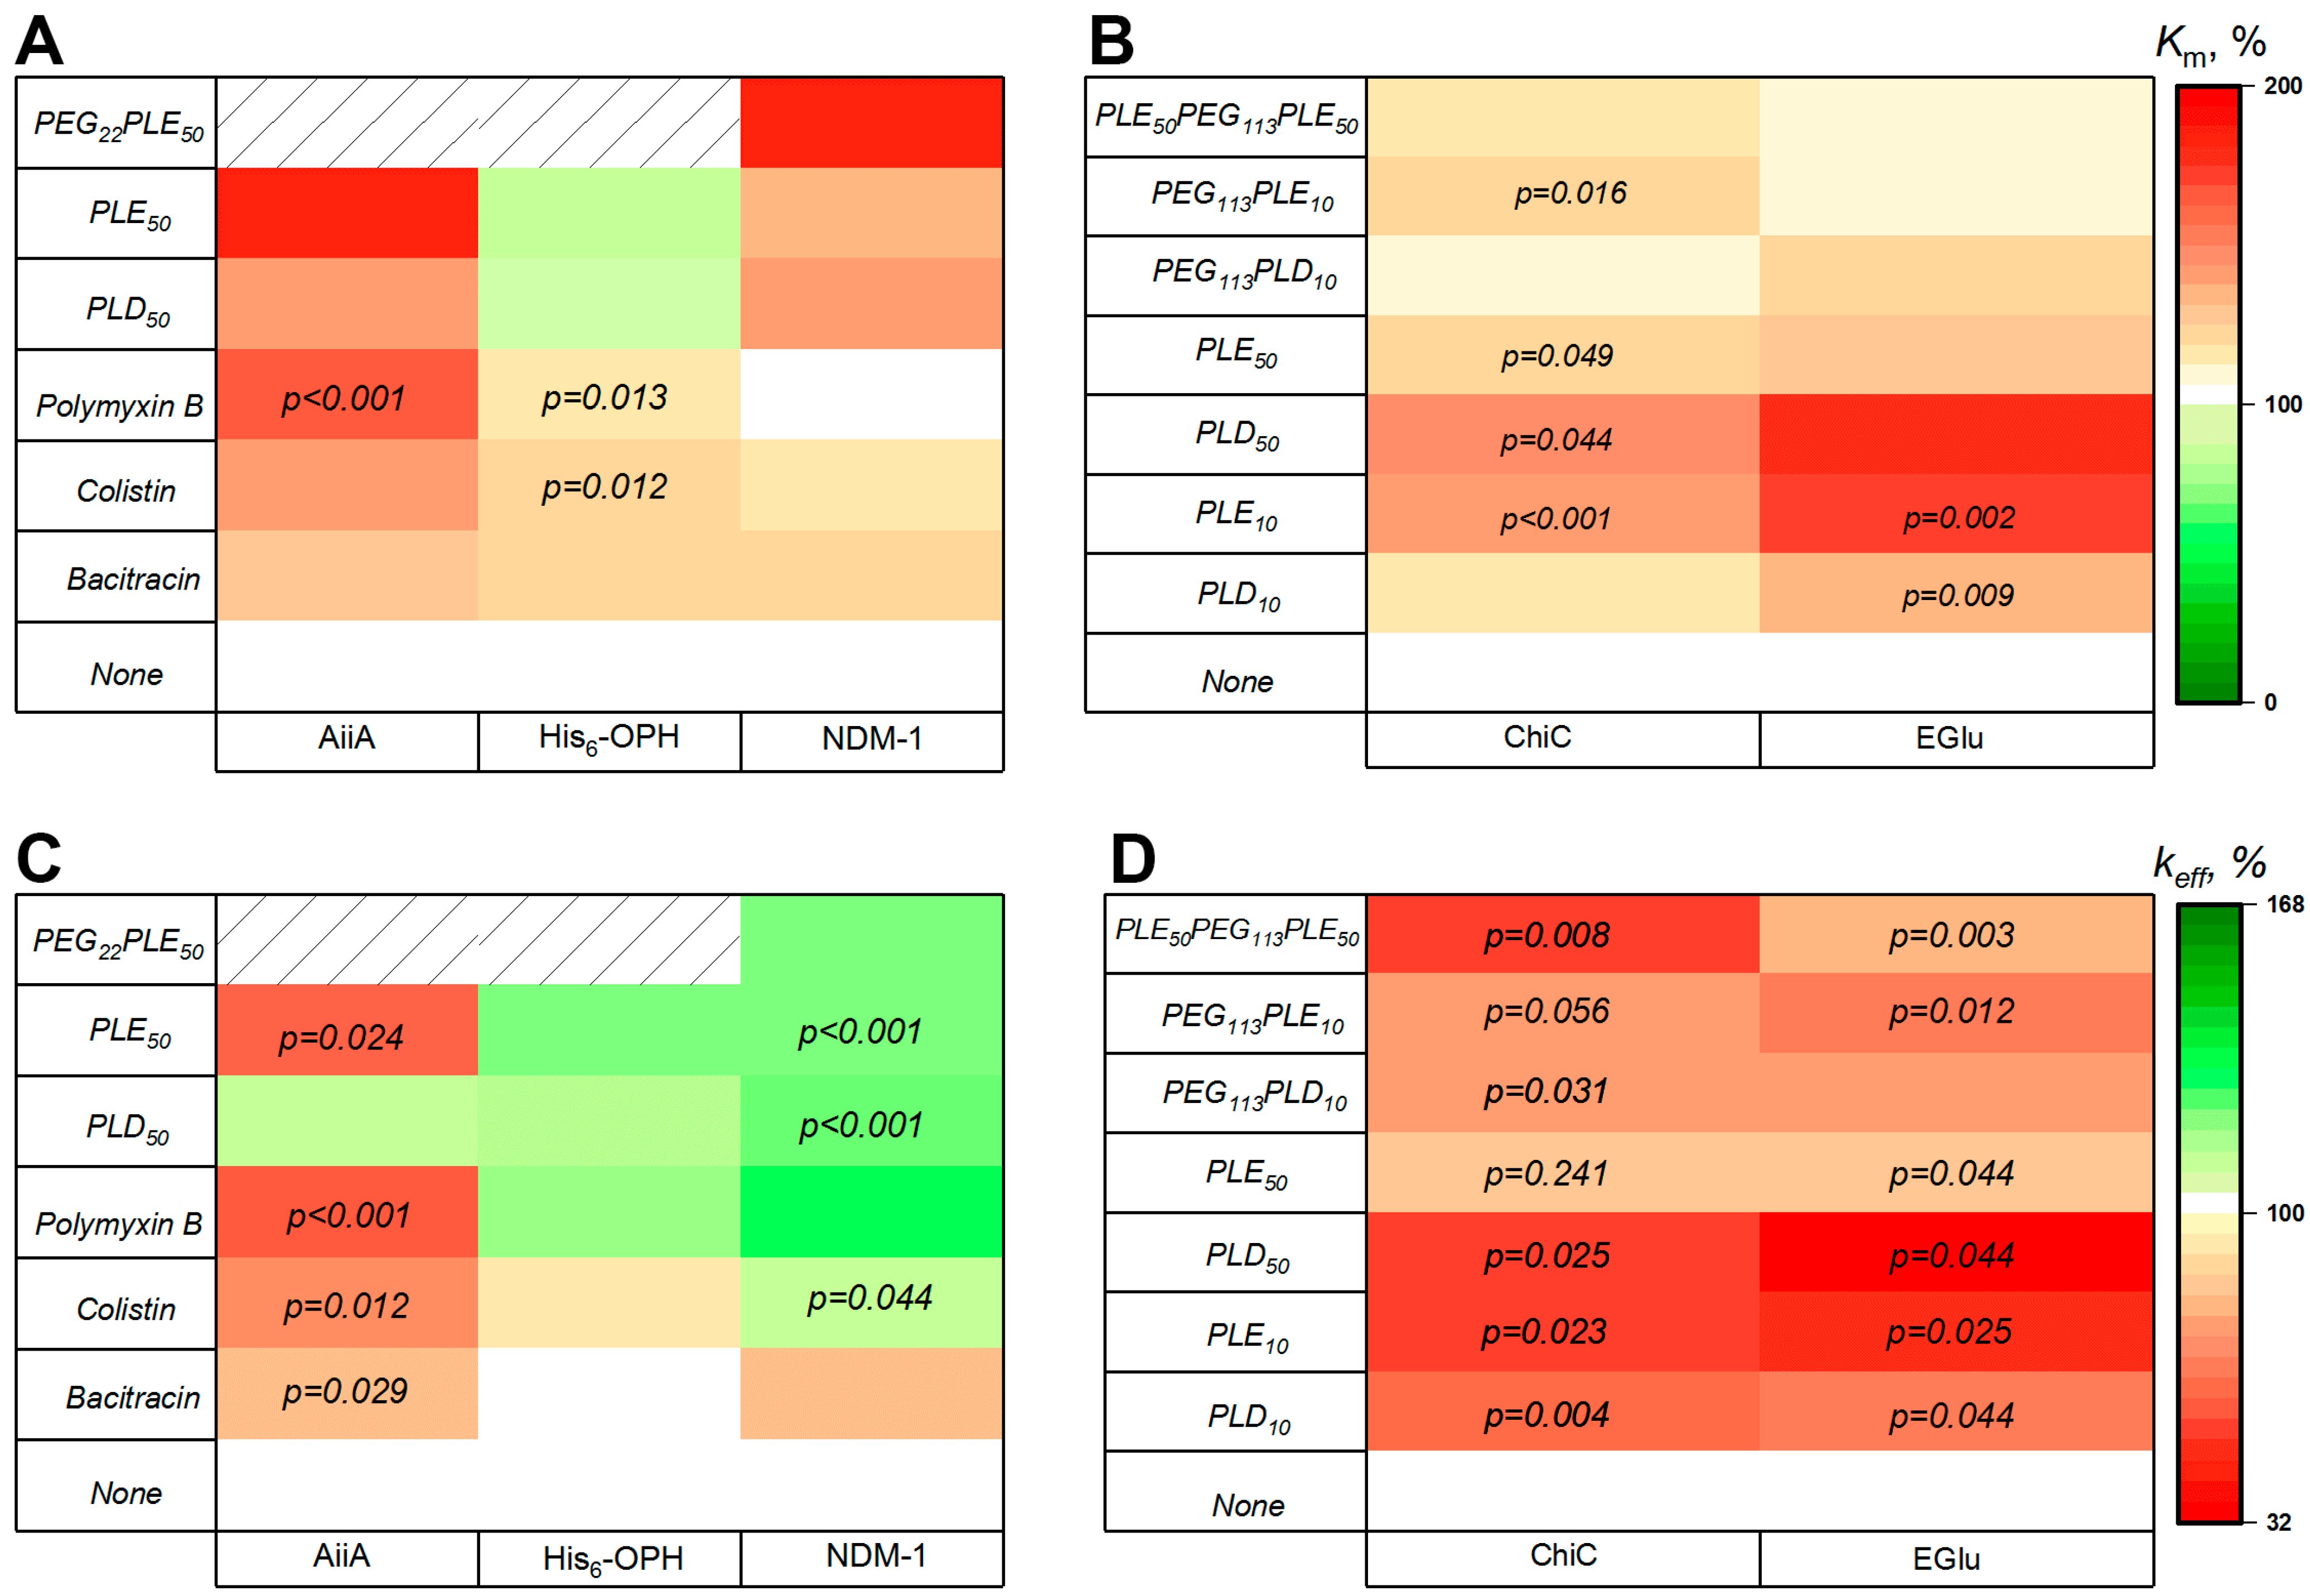
Selected combinations of AiiA, His6-OPH, NDM-1, 1,3–1,4-β-d-glucanase (Bgy6-like), and ChiC with PAAs were prepared, and their catalytic characteristics (Km (Michaelis constant), Vmax (the maximum velocity of the enzymatic reaction and the corresponding catalytic efficiency constant (keff = Vmax/(E0 × Km)) were determined using the following typical substrates: N-(3-hydroxy-hexanoyl)-l-homoserine lactone (3OHC6-HSL), meropenem, paraoxon, chitin azure, and 4-Methylumbelliferyl β-d-N,N′,N″-triacetylchitotrioside (4-MUF-3-NAG), respectively (Tables S1 and S2, Figure 10).
For AiiA combinations, Km increased 1.4–1.8-fold compared to the native enzyme. The catalytic constant kcat (Vmax/E0) for the AiiA/PLD50 and AiiA/PLE50 was 1.1–1.4 times higher than that of the enzyme alone. The keff of the AiiA/PLD50 combination was comparable to the native enzyme, while the AiiA/PLE50 combination showed a 1.6-fold decrease.
For the His6-OPH/PLD50 and His6-OPH/PLE50 combinations, Km decreased by 20% relative to the enzyme alone, and kcat for the His6-OPH/PLD50 increased by 10%. A similar effect was previously observed during PEGylation of the OPH molecule without a modified His6 sequence [32]. It is possible that a more catalytically active enzyme conformation is stabilized by multipoint non-covalent interactions with PAAs molecules. As a result, keff increased up 1.2-fold for His6-OPH/PLD50 and His6-OPH/PLE50 combinations.
The NDM-1 combinations exhibited 1.3–1.8-fold higher Km and 1.5–2.3-fold higher kcat, resulting in increased catalytic efficiency compared to the native enzyme.
Combinations of ChiC and Bgy6-like enzymes with all PAAs generally showed increased Km (up to 1.4–1.7-fold) and/or a decreased kcat (up to 1.5), resulting in reduced catalytic efficiency. Minimal decreases (1.1–1.2-fold) were observed for ChiC and Bgy6-like with PLD50 or PLE50. Overall, despite the favorable in silico predictions, in vitro studies revealed that PAAs negatively affected ChiC and Bgy6-like enzymes, making such combinations impractical, both from the point of view of stabilizing their enzymatic activity and increasing their catalytic action efficiency.
Based on these results, the physical-chemical characteristics of the combinations of AiiA, His6-OPH, and NDM-1 with PLD50 and/or PLE50 PAAs showing the most positive effects were further investigated (Figure 11, Tables S3–S6).
Thermal stability studies showed that, after 48 h at 8–37 °C, the residual activity of AiiA alone was 10–20% of its initial level (Figure 11A). Combinations with PAAs retained slightly higher activity, with the least decline at 37 °C. The study of the inactivation of enzyme activity revealed that, after 15 min exposure at 65 °C, AiiA/PLD50 retained approximately twice the activity of AiiA alone, with statistically significant differences (p < 0.05) between the values of residual enzymatic activity of AiiA and its combinations at different temperatures in most cases (Figure 11D, Table S3).
In the case of His6-OPH, the residual activity was ~50% for the enzyme alone and 60–70% in combinations with PAAs across all temperatures (Figure 11B). Unlike AiiA, the inactivation studies at 65 °C for 15 min showed a similar residual activity for both enzyme and combinations (Figure 11E).
NDM-1 retained ~30% activity alone at 8 °C, with combinations demonstrating higher stability, particularly NDM-1/PLD50 (Figure 11C). Short-term exposure at 50–65 °C confirmed the superior stability of NDM-1/PLD50, while NDM-1/PLE50 was less stable (Figure 11F).
The differences between the values of residual enzymatic activity of AiiA, His6-OPH, and NDM-1 and their combinations with PAAs at different temperatures and exposure times were statistically significant (p < 0.05) in almost all cases (Tables S3–S6).
These results indicate that PLD50 is the most suitable PAA for stabilizing lactonase enzymes while maintaining high catalytic activity. Nanoparticle tracking analysis (NTA) confirmed that the enzyme–PAA complexes had average sizes of 35–45 nm (Table S7).

3.5. The Effect of Antifungal Enzyme Combinations on Fungi

3.5.1. Modeling of Interactions of Fungicides with Enzyme–PAA Combinations

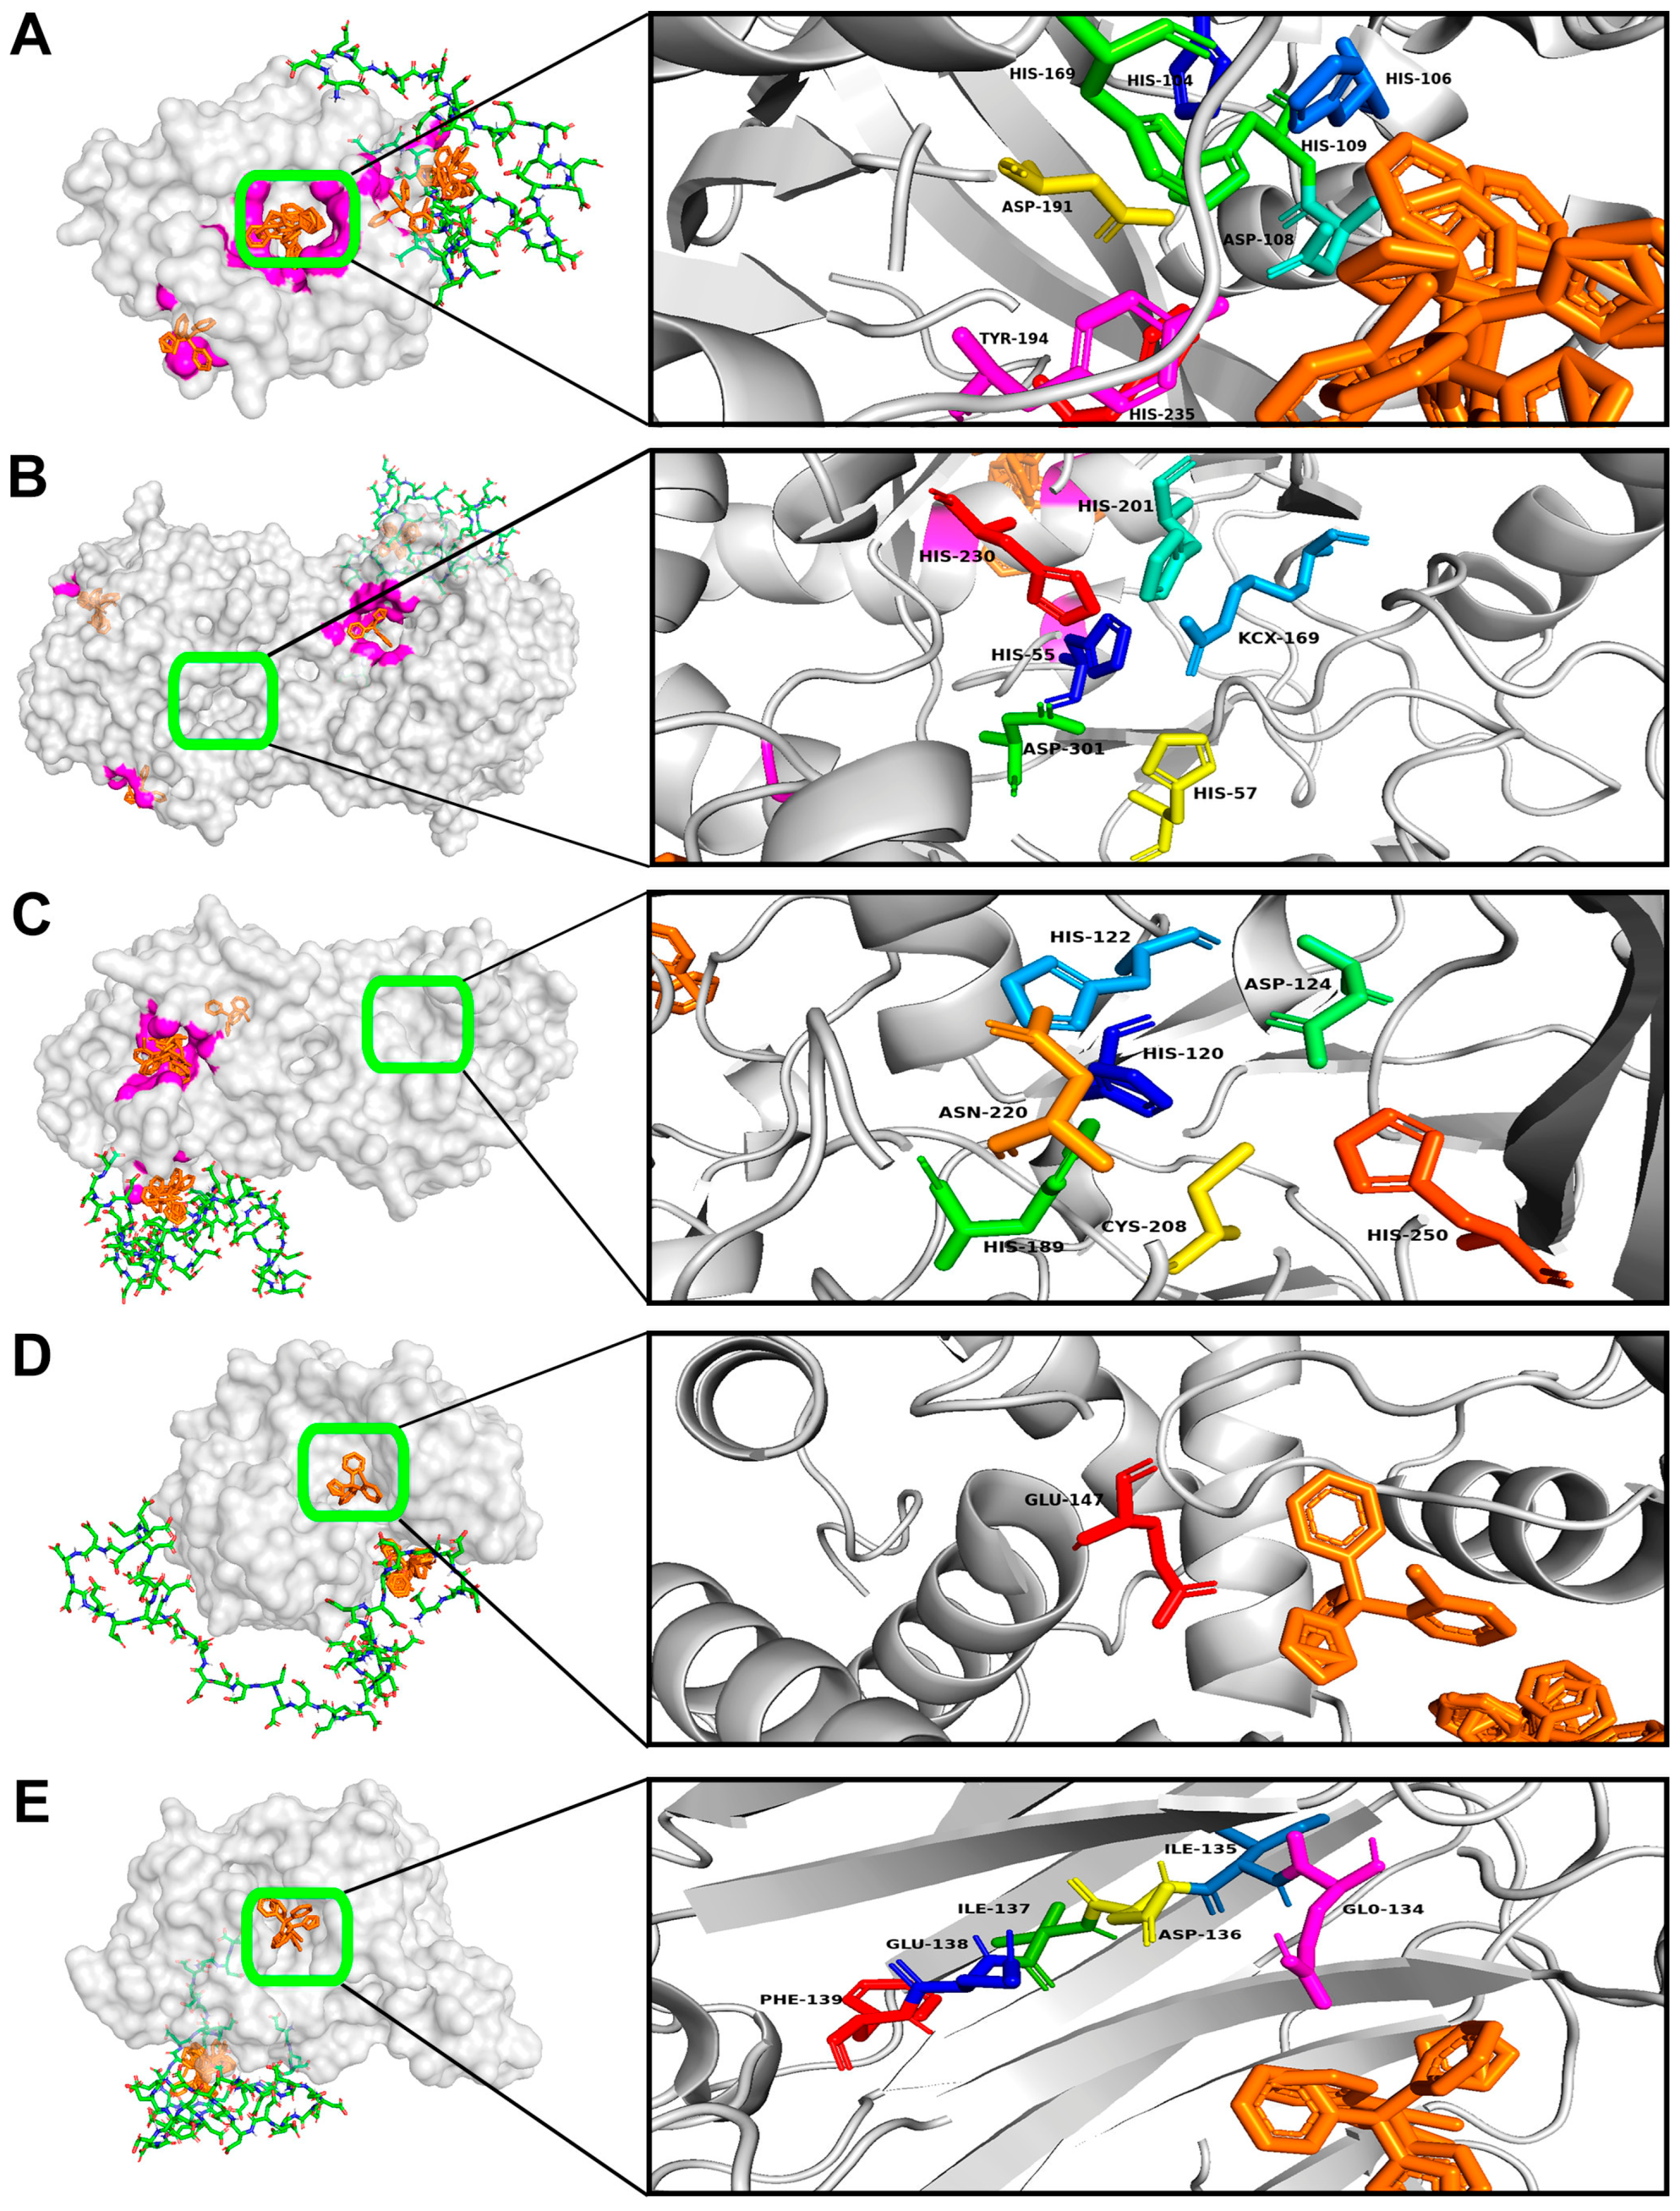
Unlike AMPs, which act both as stabilizers of enzymatic activity and as antimicrobial agents, PAAs lack antifungal properties. In this regard, to impart antimicrobial activity to enzyme–PAA combinations, the fungicides zineb and clotrimazole [33,34,35,36] were considered. In silico modeling of the interactions of these fungicides with combinations of AiiA, His6-OPH, and NDM-1 with PLD50 and/or PLE50 was performed using and molecular docking method (Figure 12A–C and Figure S16).
Although the combinations of enzymes degrading fungal cell wall components with PAAs were non-preferred, their antifungal action efficiency was also assessed for comparison. Interaction models of selected fungicides with Bgy6 and ChiC combined with PLD50 and/or PLE50 were obtained (Figure 12D,E and Figure S17).
Analysis of surface interactions showed that clotrimazole and zineb did not block the active sites of lactonase enzymes (Table S8). In the NDM-1/Zineb model, fungicide molecules mainly localized on the back side from the active sites’ location on the surface of the enzyme.
For Bgy6 and ChiC, zineb completely occupied the active sites. In contrast, clotrimazole slightly occupied the Bgy6 active site and fully blocked the active sites of the ChiC. Notably, the clotrimazole exhibited approximately twice the affinity to the surface compared to zineb, making it the preferred supplementing fungicide for antifungal enzyme combinations.

3.5.2. Antifungal Activity of the Combinations

The in vitro effect of antifungal enzyme combinations with AMPs or PAAF was assessed on various filamentous fungi and yeast cells (Table 2 and Tables S9–S13) [8]. The results obtained for the antifungal combinations of lactonase enzymes with AMPs [7] were also included into Table 2 for comparison.
The most effective combination against the cells of the filamentous fungi A. niger was AiiA/PLD50/clotrimazole, increasing antimicrobial action efficiency over 600-fold relative to the clotrimazole itself.
In addition, a significant increase in the action efficiency against A. niger cells (residual ATP concentration <1%) was also observed in the case of combinations of AiiA/PLE50/clotrimazole, NDM-1/PLE50/clotrimazole, and Bgy6-like/PLD50/clotrimazole.
The maximum action efficiency against F. solani cells was observed for combinations of AiiA/PLD50/clotrimazole (antimicrobial action efficiency increased 21-fold compared to clotrimazole) and NDM-1/polymyxin B (antimicrobial action efficiency increased 9-fold compared to polymyxin B).
For T. atroviride cells, His6-OPH/polymyxin B and His6-OPH/colistin were most effective (antimicrobial action efficiency increased up to 5000-fold compared to these AMPs themselves), with additional significant action efficiency for ChiC/polymyxin B, AiiA/PLD50, and AiiA/PLE50 with clotrimazole (residual intracellular ATP concentration <1%).
The R. oryzae cells was highly susceptible to His6-OPH or Bgy6-like with polymyxin B (up to a 2000-fold increase compared to polymyxin B alone). A significant increase in antimicrobial action efficiency (residual intracellular ATP concentration <1%) was also noted in the presence of combinations: AiiA/polymyxin B, AiiA/colistin, His6-OPH/colistin, NDM-1/polymyxin B, ChiC/colistin.
For S. cerevisiae yeast cells, the ChiC/colistin and ChiC/PLE50/clotrimazole combinations achieved residual intracellular ATP concentration <1.5%. In the case of the C. tropicalis yeast cells, comparatively higher antimicrobial action efficiency (a 5.5-fold increase in antimicrobial action efficiency compared to clotrimazole) was only observed for the ChiC/PLE50/clotrimazole combination. It should be noted here that, in the presence of clotrimazole alone, a significant decrease in ATP concentration was observed in the cells of both yeast cultures (residual intracellular ATP concentration was 6–40% of the control).
It is noteworthy that, in some cases, the antifungal enzyme combinations with PAAs exhibited antimicrobial properties without the addition of clotrimazole. For example, combinations with the AiiA enzyme, like the native AiiA enzyme, exhibited antimicrobial properties in the case of all filamentous fungi cells used in the work without the addition of clotrimazole. Moreover, in the case of C. tropicalis yeast cells, the AiiA/PLE50 combination exhibited antimicrobial properties, despite the fact that no antimicrobial properties were detected for the native enzyme itself. The His6-OPH/PLD50 combination also exhibited antimicrobial properties against A. niger cells (<5%) in the absence of any antimicrobial agents. This was discovered for the first time.

4. Discussion

The primary goal of this study was to identify the most promising candidates for inclusion in antifungal agents among combinations of enzymes with distinct targets and various AMPs or PAAs. Combining polypeptides with enzymes to stabilize the latter is recognized as one of the most effective approaches, making this strategy highly relevant for the development of antifungal enzyme combinations. While PAAs generally serve as stabilizing polypeptides, AMPs merit special attention due to their exceptional bifunctionality. In addition to stabilizing enzymes, AMPs exhibit intrinsic antimicrobial efficacy against a wide variety of microbial species [37,38], making them indispensable components of antifungal formulations.
Initially, it was necessary to select the most favorable enzyme–polypeptide combinations in terms of preserving enzyme catalytic activity. Molecular docking was employed as an effective in silico method to investigate the potential interactions between biomolecules, providing valuable insights into enzyme stabilization [39,40]. In silico studies of hydrolytic enzymes Bgy6, ChiC, Ega3, and Lysozyme with various AMPs—previously studied with lactonases [7]—revealed that, in most cases, such interactions were unfavorable for preserving catalytic activity. These enzymes had been selected as the most appropriate candidates after analyzing their interactions with fungal cell wall component molecules. Subsequent in silico studies with various PAAs identified several “positive” interaction models, primarily involving Bgy6 and ChiC. Similar analyses with lactonase enzymes (AiiA, His6-OPH, NDM-1, and MIM-1) also identified multiple favorable “enzyme–PAA” interaction models.
Experimental studies of the catalytic and physicochemical characteristics of hydrolytic enzymes in combination with AMPs or PAAs revealed that, despite favorable in silico predictions, these partners negatively impacted catalytic efficiency. This indicated that such combinations were impractical. These findings highlight the necessity of experimental validation of computational predictions, since in silico methods alone cannot fully determine practical outcomes. In contrast, the molecular modeling results for lactonase enzymes (AiiA, His6-OPH, NDM-1) were confirmed experimentally, and combinations with PLD50 and PLE50 were identified as the most appropriate.
The next stage involved evaluating the effect of antifungal combinations of both lactonase and fungal-cell-wall-degrading enzymes on various fungal species. For PAA-containing combinations, it was necessary to supplement the formulations with antifungal agents. Two widely used fungicides, zineb and clotrimazole, were considered due to their proven efficacy and low cost in treating fungal infections in humans, animals, and plants. However, these fungicides have limitations; for example, clotrimazole, a widely used azole effective against Candida, Trichophyton, Microsporum, and Malassezia furfur, exhibits notable nephrotoxicity [41,42,43]. In silico modeling indicated that clotrimazole was the most suitable fungicide for combination with enzyme–PAA formulations. Assessments of the antimicrobial efficiency of enzyme–AMP or enzyme–PAA/clotrimazole combinations revealed several promising candidates for antifungal agents. These combinations significantly enhanced the activity of both AMPs and fungicides (Table 2 and Tables S9–S13), suggesting that their use could reduce the effective concentrations of AMPs and fungicides in practice, thereby minimizing potential toxicity.
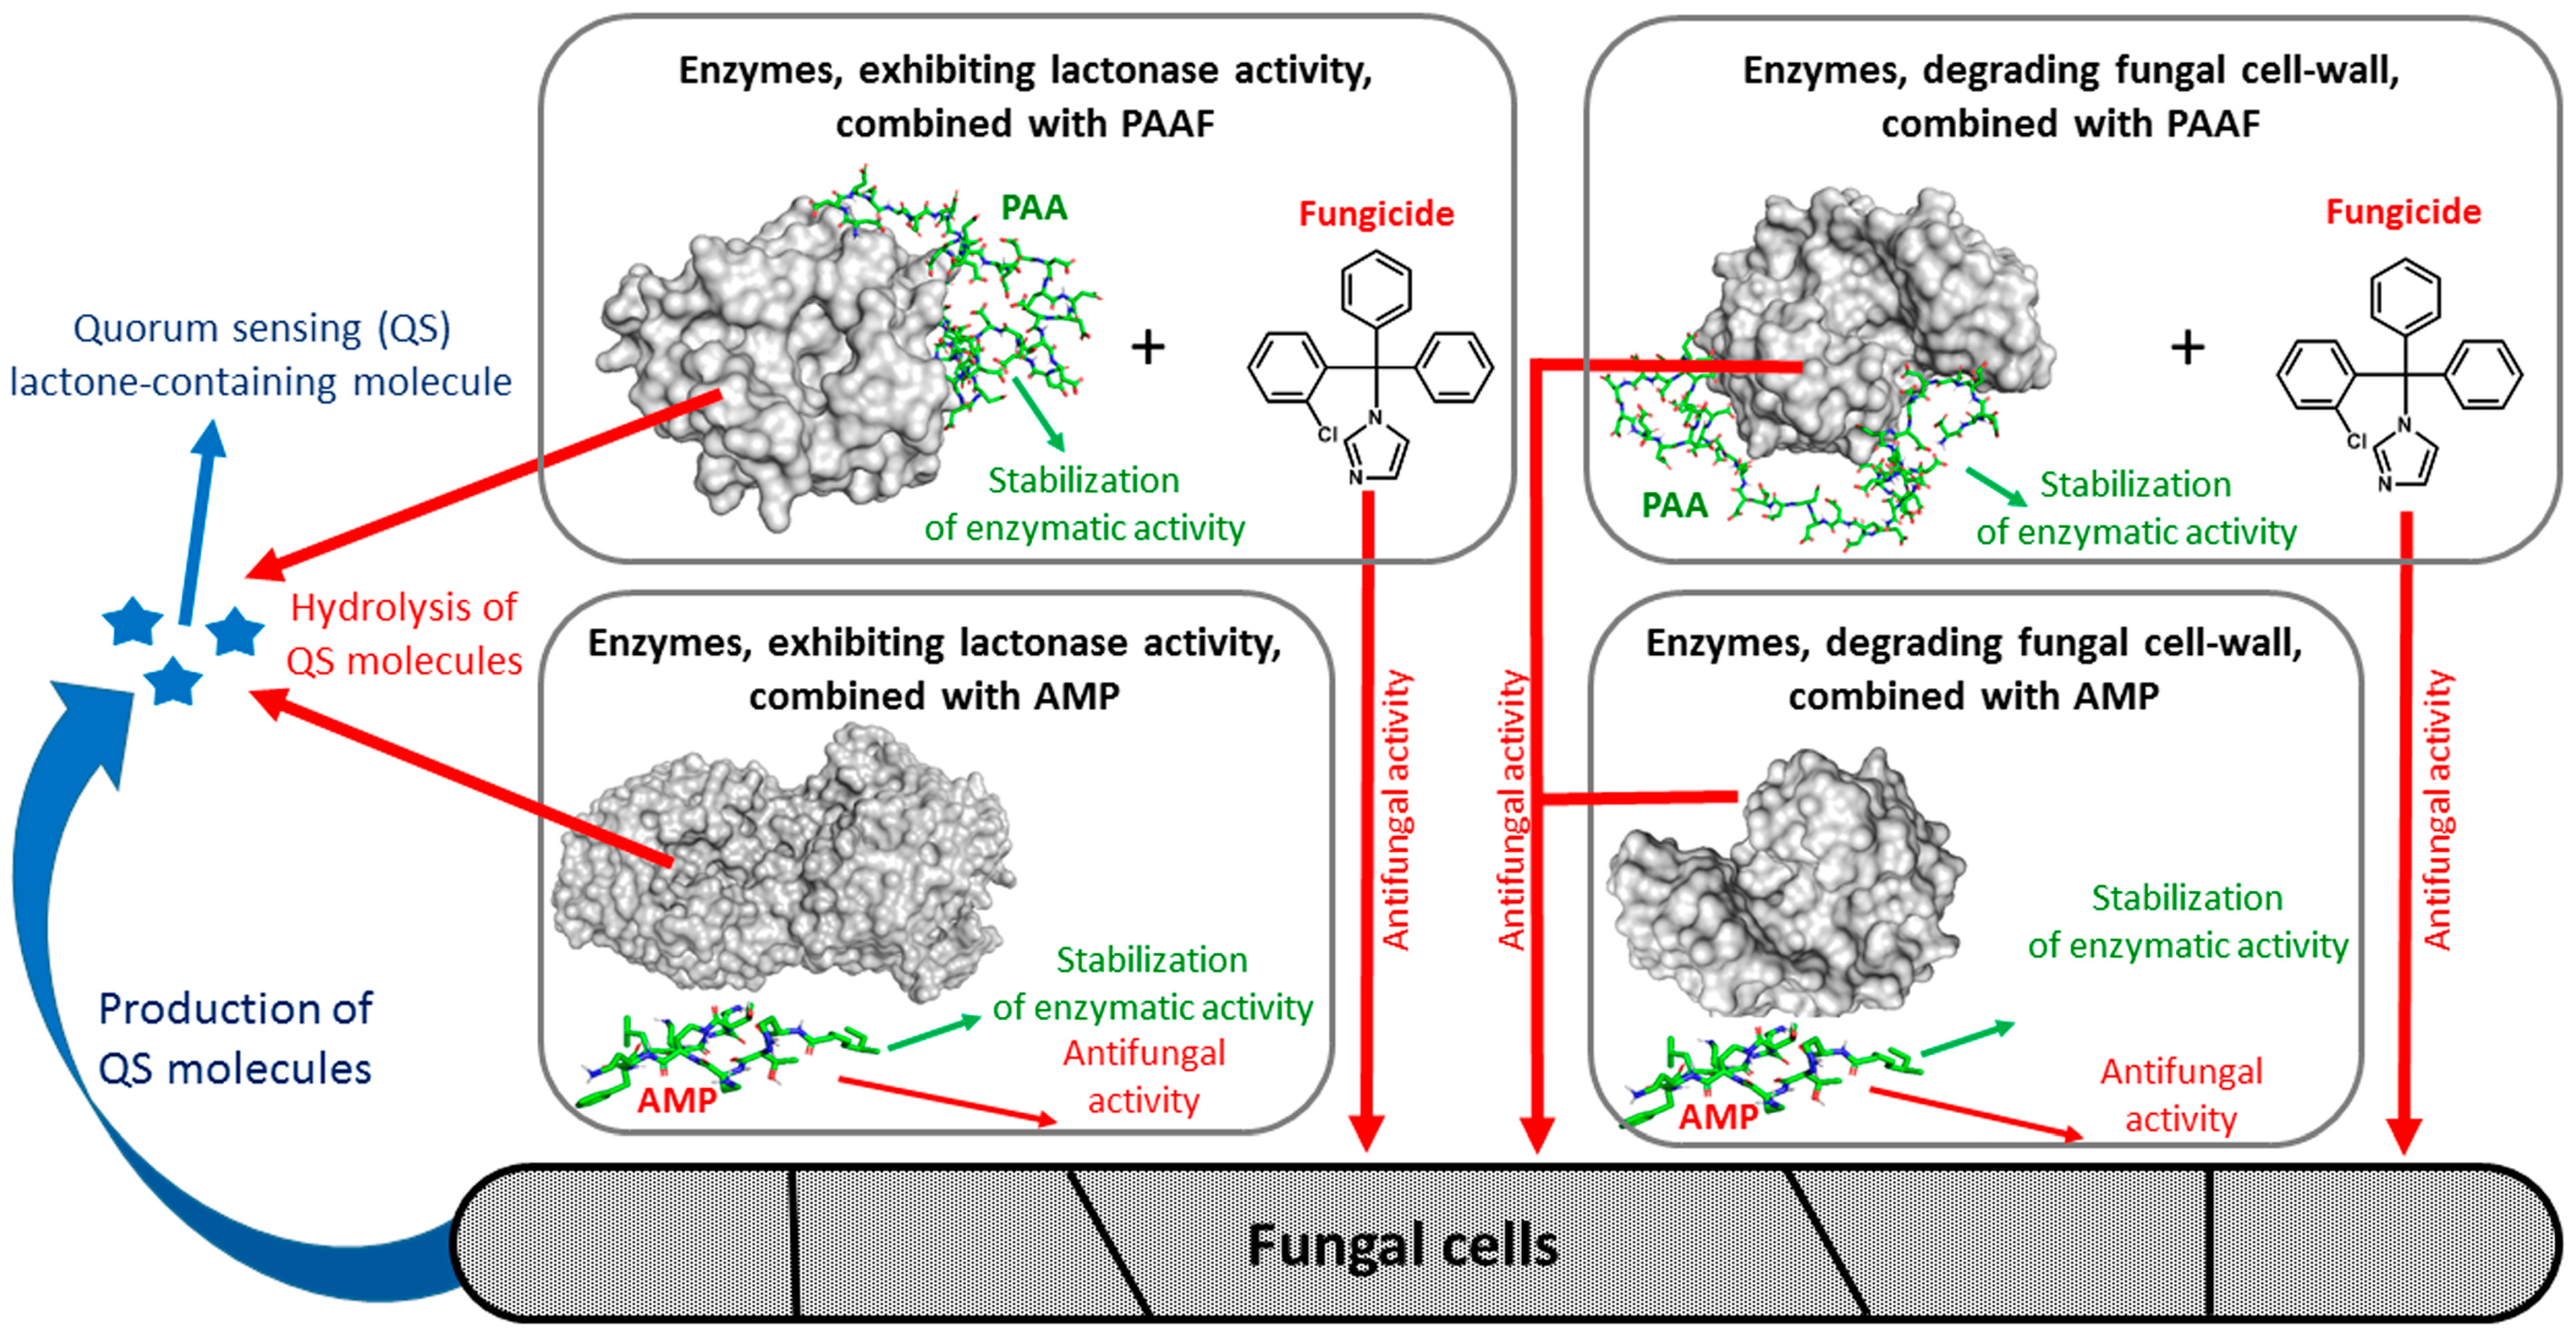
The overall conceptual framework of this study is summarized in Figure 13.
In this context, we hypothesize that two complementary enzymatic strategies can contribute to antifungal activity: (i) enzymes exhibiting lactonase activity can indirectly inhibit fungal growth by disrupting lactone-mediated Quorum-sensing mechanisms; and (ii) enzymes degrading fungal cell wall components can directly damage fungal structural integrity. When combined with AMPs or PAAF, these enzymes are expected to demonstrate enhanced catalytic stability and antifungal efficiency due to the synergistic stabilization and amplification of their biochemical effects.
It is important to note that the substrates used to study fungal-cell-wall-degrading enzymes were simpler than the native polysaccharides present in fungal cell walls. In vivo, these polysaccharides form a dense, heterogeneous, and highly cross-linked matrix, presenting a different physicochemical environment [44,45]. Therefore, the results of this study represent predictions of potential activity and mechanisms rather than fully replicating real environmental conditions. Nonetheless, this approach is a reliable and effective method for identifying and selecting the most promising antifungal candidates for further in vivo studies.

5. Conclusions

The results obtained in this study provides new mechanistic insights into two complementary enzymatic strategies for antifungal action. First, combinations of enzymes exhibiting lactonase activity in most cases (especially in the case of mycelial fungi) were shown to indirectly suppress fungal growth by disrupting lactone-mediated Quorum-sensing communication, thereby affecting fungal resistance. Second, enzymes degrading fungal cell wall components were confirmed to act through direct structural destabilization of fungal cell walls, although their combinations with polypeptides demonstrated limited catalytic compatibility compared with lactonases. Although cell-wall-degrading enzymes currently attract more attention from scientists as antimicrobial agents, lactonases, which disrupt fungal Quorum-sensing, represent a valuable alternative for antifungal strategies. Importantly, the discovery that certain lactonase–PAA combinations exhibit antifungal activity even in the absence of traditional fungicides, which suggests a synergistic mechanism involving the polymer-induced stabilization and expansion of the enzyme’s substrate specificity. Together, these findings suggest that both Quorum-sensing disruption and cell wall degradation can be rationally combined and tuned via an enzyme–polypeptide formulation to achieve enhanced stability and antifungal efficacy. Future studies should focus on microscopic and biochemical validations of these mechanisms to further refine the proposed antifungal model.

Supplementary Materials

The following supporting information can be downloaded at https://www.mdpi.com/article/10.3390/sci7040169/s1. Table S1: Catalytic characteristics of combinations of enzymes exhibiting lactonase activity with PAAs in reactions of hydrolysis of corresponding substrates; Table S2: Catalytic characteristics of combinations of enzymes degrading fungal cell wall components with PAAs in reactions of hydrolysis of corresponding substrates; Table S3: Pairwise comparisons of the residual enzymatic activity of lactone-hydrolyzing enzymes alone or in combinations with PAAs when studying thermal inactivation of their enzymatic activity as a function of temperature of the medium after 15 min exposure; Table S4: Pairwise comparisons of the residual enzymatic activity of AiiA alone and in combinations with PAAs when studying thermal inactivation of its enzymatic activity as a function of temperature of the medium after 48 h exposure at 8 °C, 25 °C and 37 °C; Table S5: Pairwise comparisons of the residual enzymatic activity of His6-OPH alone and in combinations with PAAs when studying thermal inactivation of its enzymatic activity as a function of temperature of the medium after 48 h exposure at 8 °C, 25 °C and 37 °C; Table S6: Pairwise comparisons of the residual enzymatic activity of NDM-1 alone and in combinations with PAAs when studying thermal inactivation of its enzymatic activity as a function of temperature of the medium after 48 h exposure at 8 °C, 25 °C and 37 °C; Table S7: Nanoparticles tracking analysis of particle size of enzyme–PAA combinations; Table S8: The area occupied by the fungicides molecules near the active site on the surface of the enzyme or on its total surface and the affinity of the fungicides molecules to the surface of enzymes; Table S9: Residual intracellular ATP levels (%) in filamentous fungi and yeasts were measured after 24 h of treatment with enzymes exhibiting lactonase activity [8] and enzymes degrading fungal cell wall components themselves (activity in the absence of AMPs and PAAs). The residual concentration of ATP in control samples with cells without the addition of antimicrobial agents was taken as 100%; Table S10: Pairwise comparisons of the residual concentrations of intracellular ATP in different filamentous fungi and yeasts in the presence of combinations of lactonases with AMPs [8]; Table S11: Pairwise comparisons of the residual concentrations of intracellular ATP in different filamentous fungi and yeasts in the presence of combinations of lactonases with PAAs supplemented with Clotrimazole; Table S12. Pairwise comparisons of the residual concentrations of intracellular ATP in different filamentous fungi and yeasts in the presence of combinations of cell-wall-degrading enzymes with AMPs; Table S13: Pairwise comparisons of the residual concentrations of intracellular ATP in different filamentous fungi and yeasts in the presence of combinations of cell-wall degrading enzymes with PAAs supplemented with Clotrimazole; Figure S1: 3D structure of model molecules of fungal cell wall components: Allosamidin (1), Chitin dimer (2), Chitin tetramer (3), Chitin octamer (4), Chitin octadecamer (5), Chitosan (6), Galactosaminogalactan (7), Triacetylchitotriose (8); Figure S2: The localization of molecules of fungal cell wall components (Allosamidin (1), Chitin dimer (2), Chitin tetramer (3), Chitin octamer (4), Chitin octadecamer (5), Chitosan (6), Galactosaminogalactan (7), Triacetylchitotriose (8)) on the surface of fungal-cell-wall-degrading enzyme Bgy6. The molecular surface of the enzymes is colored gray. The molecules of fungal cell wall components are shown as sticks. Atoms of the enzyme situated within 4 Å of substrate molecules, along with the corresponding molecular surface regions, are depicted in purple. The entrances to the enzymatic active sites are marked with green boxes; Figure S3: The localization of molecules of fungal cell wall components (Allosamidin (1), Chitin dimer (2), Chitin tetramer (3), Chitin octamer (4), Chitin octadecamer (5), Chitosan (6), Galactosaminogalactan (7), Triacetylchitotriose (8)) on the surface of fungal-cell-wall-degrading enzyme ChiC. The molecular surface of the enzymes is colored gray. The molecules of fungal cell wall components are shown as sticks. The atoms located within 4 Å of any substrate atom and the corresponding molecular surface of enzymes is depicted in purple. The entrances to the enzymatic active sites are marked with green boxes; Figure S4: The localization of molecules of fungal cell wall components (Allosamidin (1), Chitin dimer (2), Chitin tetramer (3), Chitin octamer (4), Chitin octadecamer (5), Chitosan (6), Galactosaminogalactan (7), Triacetylchitotriose (8)) on the surface of fungal-cell-wall-degrading enzyme Ega3. The molecular surface of the enzymes is depicted in gray. The molecules of fungal cell wall components are shown as sticks. Atoms of the enzyme situated within 4 Å of substrate molecules, together with the corresponding molecular surface regions, are depicted in purple. The entrances to the enzymatic active sites are marked with green boxes; Figure S5: The localization of molecules of fungal cell wall components (Allosamidin (1), Chitin dimer (2), Chitin tetramer (3), Chitin octamer (4), Chitin octadecamer (5), Chitosan (6), Galactosaminogalactan (7), Triacetylchitotriose (8)) on the surface of fungal-cell-wall-degrading enzyme Lysozyme. The enzymes’ molecular surfaces are rendered in gray, and fungal cell wall component molecules are represented as sticks. Atoms situated within 4 Å of substrate molecules, along with the corresponding molecular surface regions, are depicted in purple. Active site entrances are marked with green boxes; Figure S6: The localization of AMP molecules (Aculeacin A (1), Bacitracin (2), BMAP-18 (3), Bralicidin (4), Caspofungin (5), Colistin (6), Fengycin (7), Indolicidin (8), Iturin A (9), KK14 (10), Leg2 (11), hLF 1-11 (12), Lfampin B (13), PAF26 (14), PepGAT (15), PepKAA (16), Polymyxin B (17), RcAlb-PepII (18), TC3 (19), Temporin A (20), Temporin G (21)) on the surface of fungal-cell-wall-degrading enzyme Ega3. The enzyme’s molecular surface is shown in gray. Enzyme atoms within 4 Å of AMP molecules, together with the associated molecular surface, are color-coded individually for each AMP. Active site entrances are indicated by black boxes; Figure S7: The localization of AMP molecules (Aculeacin A (1), Bacitracin (2), BMAP-18 (3), Bralicidin (4), Caspofungin (5), Colistin (6), Fengycin (7), Indolicidin (8), Iturin A (9), KK14 (10), Leg2 (11), hLF 1-11 (12), Lfampin B (13), PAF26 (14), PepGAT (15), PepKAA (16), Polymyxin B (17), RcAlb-PepII (18), TC3 (19), Temporin A (20), Temporin G (21)) on the surface of fungal-cell-wall-degrading enzyme Lysozyme. The molecular surface of the enzyme is depicted in gray. Atoms located within 4 Å of AMP molecules, together with the corresponding molecular surface regions, are highlighted in distinct colors for each AMP. The entrances to the enzymatic active sites are marked with black boxes; Figure S8: The localization of PAAs molecules (PEG22PLE50 (1), PEG113PLD10 (2), PEG113PLD50 (3), PEG113PLD100 (4), PEG113PLE10 (5), PEG113PLE50 (6), PEG113PLE100 (7), PLD10 (8), PLD50 (9), PLD100 (10), PLE10 (11), PLE50 (12), PLE50PEG113PLE50 (13), PLE100 (14)) on the surface of Bgy6. The molecular surface of the enzyme is depicted in gray. Molecules of PAAs are shown as green sticks. The entrances to the active sites of enzymes are highlighted with blue boxes; Figure S9: The localization of PAAs molecules (PEG22PLE50 (1), PEG113PLD10 (2), PEG113PLD50 (3), PEG113PLD100 (4), PEG113PLE10 (5), PEG113PLE50 (6), PEG113PLE100 (7), PLD10 (8), PLD50 (9), PLD100 (10), PLE10 (11), PLE50 (12), PLE50PEG113PLE50 (13), PLE100 (14)) on the surface of ChiC. The molecular surface of the enzyme is depicted in gray. Molecules of PAAs are shown as green sticks. The entrances to the active sites of enzymes are highlighted with blue boxes; Figure S10: The localization of PAAs molecules (PEG22PLE50 (1), PEG113PLD10 (2), PEG113PLD50 (3), PEG113PLD100 (4), PEG113PLE10 (5), PEG113PLE50 (6), PEG113PLE100 (7), PLD10 (8), PLD50 (9), PLD100 (10), PLE10 (11), PLE50 (12), PLE50PEG113PLE50 (13), PLE100 (14)) on the surface of Ega3. The molecular surface of the enzyme is depicted in gray. Molecules of PAAs are shown as green sticks. The entrances to the active sites of enzymes are highlighted with blue boxes; Figure S11: The localization of PAAs molecules (PEG22PLE50 (1), PEG113PLD10 (2), PEG113PLD50 (3), PEG113PLD100 (4), PEG113PLE10 (5), PEG113PLE50 (6), PEG113PLE100 (7), PLD10 (8), PLD50 (9), PLD100 (10), PLE10 (11), PLE50 (12), PLE50PEG113PLE50 (13), PLE100 (14)) on the surface of Lysozyme. The molecular surface of the enzyme is depicted in gray. Molecules of PAAs are shown as green sticks. The entrances to the enzymatic active sites are marked with blue boxes; Figure S12: The localization of PAAs molecules (PEG22PLE50 (1), PEG113PLD10 (2), PEG113PLD50 (3), PEG113PLD100 (4), PEG113PLE10 (5), PEG113PLE50 (6), PEG113PLE100 (7), PLD10 (8), PLD50 (9), PLD100 (10), PLE10 (11), PLE50 (12), PLE50PEG113PLE50 (13), PLE100 (14)) on the surface of AiiA. The molecular surface of the enzyme is colored gray. Molecules of PAAs are shown as green sticks. The entrances to the active sites of enzymes are highlighted with blue boxes; Figure S13: The localization of PAAs molecules (PEG22PLE50 (1), PEG113PLD10 (2), PEG113PLD50 (3), PEG113PLD100 (4), PEG113PLE10 (5), PEG113PLE50 (6), PEG113PLE100 (7), PLD10 (8), PLD50 (9), PLD100 (10), PLE10 (11), PLE50 (12), PLE50PEG113PLE50 (13), PLE100 (14)) on the surface of His6-OPH. The molecular surface of the enzyme is depicted in gray. Molecules of PAAs are shown as green sticks. The entrances to the active sites of enzymes are highlighted with blue boxes; Figure S14: The localization of PAAs molecules (PEG22PLE50 (1), PEG113PLD10 (2), PEG113PLD50 (3), PEG113PLD100 (4), PEG113PLE10 (5), PEG113PLE50 (6), PEG113PLE100 (7), PLD10 (8), PLD50 (9), PLD100 (10), PLE10 (11), PLE50 (12), PLE50PEG113PLE50 (13), PLE100 (14)) on the surface of NDM-1. The molecular surface of the enzyme is depicted in gray. Molecules of PAAs are shown as green sticks. The entrances to the active sites of enzymes are highlighted with blue boxes; Figure S15: The localization of PAAs molecules (PEG22PLE50 (1), PEG113PLD10 (2), PEG113PLD50 (3), PEG113PLD100 (4), PEG113PLE10 (5), PEG113PLE50 (6), PEG113PLE100 (7), PLD10 (8), PLD50 (9), PLD100 (10), PLE10 (11), PLE50 (12), PLE50PEG113PLE50 (13), PLE100 (14)) on the surface of MiM-1. The molecular surface of the enzyme is colored gray. Molecules of PAAs are shown as green sticks. The entrances to the active sites of enzymes are highlighted with blue boxes; Figure S16: The localization of fungicides zineb (A,C,E,G,I,K) and clotrimazole (B,D,F,H,J,L) molecules on the surface of enzymes exhibiting lactonase activity AiiA (AD), His6-OPH (EH), NDM-1 (IL) combined with PLD50 (A,B,E,F,I,J) and PLE50 (C,D,G,H,K,L). The molecular surface of the enzymes is depicted in gray. The atoms located within 4 Å of any fungicide atom and the corresponding molecular surface of enzymes is colored orange (zineb) or purple (clotrimazole). Molecules of PAAs are shown as green sticks. The entrances to the active sites of enzymes are highlighted with blue boxes; Figure S17: The localization of fungicides zineb (A,C,E,G) and clotrimazole (B,D,F,H) molecules on the surface of fungal-cell-wall-degrading enzymes Bgy6 (AD) and ChiC (EH) combined with PLD50 (A,B,E,F) and PLE50 (C,D,G,H). The molecular surface of the enzymes is depicted in gray. The atoms located within 4 Å of any fungicide atom and the corresponding molecular surface of enzymes is colored orange (zineb) or purple (clotrimazole). Molecules of PAAs are shown as green sticks. The entrances to the active sites of enzymes are highlighted with blue boxes.

Author Contributions

Conceptualization, E.E.; investigation, M.D., A.A., O.S., N.S., and E.E.; data curation, M.D. and A.A.; software, M.D. and A.A.; formal analysis, M.D. and A.A.; writing—original draft preparation, M.D., A.A., O.S., N.S., and E.E.; writing—review and editing, M.D., A.A., and E.E.; supervision, E.E.; funding acquisition, E.E. All authors have read and agreed to the published version of the manuscript.

Funding

This research was financially supported by Russian Science Foundation (23-14-00092).

Institutional Review Board Statement

Not applicable.

Informed Consent Statement

Not applicable.

Data Availability Statement

Data is contained within the article or the Supplementary Materials.

Acknowledgments

This research was carried out using the equipment of the shared research facilities of HPC computing resources at Lomonosov Moscow State University [26] and Zetasizer Nano ZS (Malvern Instruments Ltd., Malvern, UK) purchased under the Moscow State University Development Program.

Conflicts of Interest

The authors declare no conflicts of interest.

Abbreviations

The following abbreviations are used in this manuscript:
3OHC6-HSLN-(3-hydroxy-hexanoyl)-l-homoserine lactone
AMPAntimicrobial polypeptide
ANOVAAnalysis of variance
APBSAdaptive Poisson-Boltzmann solver
ATPAdenosine triphosphate
Bgy6-like1,3–1,4-β-d-glucanase
BMAP-18Bovine Myeloid Antimicrobial Peptide-18
DMSODimethyl sulfoxide
Ega3Endo-α-1,4-galactosaminidase
His6-OPHHexahistidine containing organophosphate hydrolase
hLFHuman lactoferrin
I-TASSERIterative Threading ASSEmbly Refinement
Lfampin BLactoferrampin B
MUF-3-NAG4-Methylumbelliferyl β-d-N,N′,N″-triacetylchitotrioside
NDM-1New Delhi metallo-beta-lactamase 1
NTANanoparticle tracking analysis
PAAPolyamino acid
PAAFPolyamino acids supplemented with fungicides
PEGPolyethylene glycol
PLDPoly-l-aspartic acid
PLEPoly-l-glutamic acid
RcAlb-PepIIPeptide based on the structure of 2S albumin from Ricinus communis

References

  1. WHO. WHO Fungal Priority Pathogens List to Guide Research, Development and Public Health Action. 2022. Available online: https://www.who.int/publications/i/item/9789240060241 (accessed on 22 September 2025).
  2. Denning, D.W. Global incidence and mortality of severe fungal disease. Lancet Infect. Dis. 2024, 24, e428–e438. [Google Scholar] [CrossRef] [PubMed]
  3. Lockhart, S.R.; Chowdhary, A.; Gold, J.A. The rapid emergence of antifungal-resistant human-pathogenic fungi. Nat. Rev. Microbiol. 2023, 21, 818–832. [Google Scholar] [CrossRef]
  4. Logan, A.; Wolfe, A.; Williamson, J.C. Antifungal resistance and the role of new therapeutic agents. Curr. Infect. Dis. Rep. 2022, 24, 105–116. [Google Scholar] [CrossRef]
  5. Rhijn, N.v.; Rhodes, J. Evolution of antifungal resistance in the environment. Nat. Microbiol. 2025, 10, 1804–1815. [Google Scholar] [CrossRef]
  6. Bédard, C.; Pageau, A.; Fijarczyk, A.; Mendoza-Salido, D.; Alcañiz, A.J.; Després, P.C.; Durand, R.; Plante, S.; Alexander, E.M.M.; Rouleau, F.D.; et al. FungAMR: A comprehensive database for investigating fungal mutations associated with antimicrobial resistance. Nat. Microbiol. 2025, 10, 2338–2352. [Google Scholar] [CrossRef]
  7. Aslanli, A.; Domnin, M.; Stepanov, N.; Senko, O.; Efremenko, E. Action enhancement of antimicrobial peptides by their combination with enzymes hydrolyzing fungal quorum molecules. Int. J. Biol. Macromol. 2024, 280, 136066. [Google Scholar] [CrossRef]
  8. Efremenko, E.; Aslanli, A.; Domnin, M.; Stepanov, N.; Senko, O. Enzymes with Lactonase Activity against Fungal Quorum Molecules as Effective Antifungals. Biomolecules 2024, 14, 383. [Google Scholar] [CrossRef]
  9. Naga, N.G.; El-Badan, D.; Ghanem, K.M.; Shaaban, M.I. It is the time for quorum sensing inhibition as alternative strategy of antimicrobial therapy. Cell Commun. Signal. 2023, 21, 133. [Google Scholar] [CrossRef]
  10. Ma, X.; Wang, Q.; Ren, K.; Xu, T.; Zhang, Z.; Xu, M.; Rao, Z.; Zhang, X. A Review of Antimicrobial Peptides: Structure, Mechanism of Action, and Molecular Optimization Strategies. Fermentation 2024, 10, 540. [Google Scholar] [CrossRef]
  11. Mufida, D.R.A.; Putra, I.P.; Nawangsih, A.A.; Krishanti, N.P.R.A.; Wahyudi, A.T. Glucanase enzyme activity from rhizospheric Streptomyces spp. inhibit growth and damage the cell wall of Fusarium oxysporum. Rhizosphere 2024, 32, 100991. [Google Scholar] [CrossRef]
  12. Zhang, L.; Li, W.; Tao, Y.; Zhao, S.; Yao, L.; Cai, Y.; Niu, Q. Overexpression of the key virulence factor 1,3–1,4-β-D-glucanase in the endophytic bacterium Bacillus halotolerans Y6 to improve Verticillium resistance in cotton. J. Agric. Food Chem. 2019, 67, 6828–6836. [Google Scholar] [CrossRef] [PubMed]
  13. Kezuka, Y.; Ohishi, M.; Itoh, Y.; Watanabe, J.; Mitsutomi, M.; Watanabe, T.; Nonaka, T. Structural studies of a two-domain chitinase from Streptomyces griseus HUT6037. J. Mol. Biol. 2006, 358, 472–484. [Google Scholar] [CrossRef] [PubMed]
  14. Watanabe, T.; Kanai, R.; Kawase, T.; Tanabe, T.; Mitsutomi, M.; Sakuda, S.; Miyashita, K. Family 19 chitinases of Streptomyces species: Characterization and distribution. Microbiology 1999, 145, 3353–3363. [Google Scholar] [CrossRef]
  15. Bamford, N.C.; Le Mauff, F.; Subramanian, A.S.; Yip, P.; Millán, C.; Zhang, Y.; Zacharias, C.; Forman, A.; Nitz, M.; Codée, J.D.C.; et al. Ega3 from the fungal pathogen Aspergillus fumigatus is an endo-α-1,4-galactosaminidase that disrupts microbial biofilms. J. Biol. Chem. 2019, 294, 13833–13849. [Google Scholar] [CrossRef]
  16. Wang, A.; Paul, J.; Weldrick, P.J.; Madden, L.A.; Paunov, V.N. Enhanced clearing of Candida biofilms on a 3D urothelial cell in vitro model using lysozyme-functionalized fluconazole-loaded shellac nanoparticles. Biomater. Sci. 2021, 9, 6927–6939. [Google Scholar] [CrossRef]
  17. Hernández-Téllez, C.N.; Rodríguez-Córdova, F.J.; Rosas-Burgos, E.C.; Cortez-Rocha, M.O.; Burgos-Hernández, A.; Lizardi-Mendoza, J.; Torres-Arreola, W.; Martínez-Higuera, A.; Plascencia-Jatomea, M. Activity of chitosan-lysozyme nanoparticles on the growth, membrane integrity, and β-1,3-glucanase production by Aspergillus parasiticus. 3 Biotech 2017, 7, e279. [Google Scholar] [CrossRef]
  18. Numata, K. Poly(amino acid)s/polypeptides as potential functional and structural materials. Polym. J. 2015, 47, 537–545. [Google Scholar] [CrossRef]
  19. Lyagin, I.V.; Efremenko, E.N. Biomolecular engineering of biocatalysts hydrolyzing neurotoxic organophosphates. Biochimie 2018, 144, 115–121. [Google Scholar] [CrossRef]
  20. Sivasankaran, R.P.; Snell, K.; Kunkel, G.; Georgiou, P.; Puente, E.G.; Maynard, H.D. Polymer-mediated protein/peptide therapeutic stabilization: Current progress and future directions. Prog. Polym. Sci. 2024, 156, 101867. [Google Scholar] [CrossRef]
  21. Efremenko, E.; Votchitseva, Y.; Plieva, F.; Galaev, I.; Mattiasson, B. Purification of His6-organophosphate hydrolase using monolithic supermacroporous polyacrylamide cryogels developed for immobilized metal affinity chromatography. Appl. Microbiol. Biotechnol. 2006, 70, 558–563. [Google Scholar] [CrossRef]
  22. Roy, A.; Kucukural, A.; Zhang, Y. I-TASSER: A unified platform for automated protein structure and function prediction. Nat. Protoc. 2010, 5, 725–738. [Google Scholar] [CrossRef]
  23. Baker, N.A.; Sept, D.; Joseph, S.; Holst, M.J.; McCammon, J.A. Electrostatics of nanosystems: Application to microtubules and the ribosome. Proc. Natl. Acad. Sci. USA 2001, 98, 10037–10041. [Google Scholar] [CrossRef]
  24. Dolinsky, T.J.; Czodrowski, P.; Li, H.; Nielsen, J.E.; Jensen, J.H.; Klebe, G.; Baker, N.A. PDB2PQR: Expanding and upgrading automated preparation of biomolecular structures for molecular simulations. Nucleic Acids Res. 2007, 35 (Suppl. 2), W522–W525. [Google Scholar] [CrossRef] [PubMed]
  25. Morris, G.M.; Huey, R.; Lindstrom, W.; Sanner, M.F.; Belew, R.K.; Goodsell, D.S.; Olson, A.J. AutoDock4 and AutoDockTools4: Automated docking with selective receptor flexibility. J. Comput. Chem. 2009, 30, 2785–2791. [Google Scholar] [CrossRef]
  26. Voevodin, V.; Antonov, A.; Nikitenko, D.; Shvets, P.; Sobolev, S.; Sidorov, I.; Stefanof, K.; Voevodin, V.; Zhumatiy, S. Supercomputer Lomonosov-2: Large scale, deep monitoring and fine analytics for the user community. Supercomput. Front. Innov. 2019, 6, 4–11. [Google Scholar] [CrossRef]
  27. Trott, O.; Olson, A.J. AutoDock Vina: Improving the speed and accuracy of docking with a new scoring function, efficient optimization, and multithreading. J. Comput. Chem. 2010, 31, 455–461. [Google Scholar] [CrossRef]
  28. Grigorenko, V.G.; Khrenova, M.G.; Andreeva, I.P.; Rubtsova, M.Y.; Lev, A.I.; Novikova, T.S.; Detusheva, E.V.; Fursova, N.K.; Dyatlov, I.A.; Egorov, A.M. Drug repurposing of the unithiol: Inhibition of metallo-β-lactamases for the treatment of carbapenem-resistant Gram-negative bacterial infections. Int. J. Mol. Sci. 2022, 23, 1834. [Google Scholar] [CrossRef]
  29. Bergonzi, C.; Schwab, M.; Elias, M. The quorum-quenching lactonase from Geobacillus caldoxylosilyticus: Purification, characterization, crystallization and crystallographic analysis. Acta Crystallogr. Sect. Struct. Biol. Commun. 2016, 72, 681–686. [Google Scholar] [CrossRef]
  30. Shen, C.R.; Chen, Y.S.; Yang, C.J.; Chen, J.K.; Liu, C.L. Colloid chitin azure is a dispersible, low-cost substrate for chitinase measurements in a sensitive, fast, reproducible assay. SLAS Discov. Adv. Sci. Drug Discov. 2010, 15, 213–217. [Google Scholar] [CrossRef]
  31. Ismayilov, I.T.; Stepanov, N.A.; Efremenko, E.N.; Abbasov, V.M. Evaluation of biocidal properties of vegetable oil-based corrosion inhibitors using bioluminescent enzymatic method. Mosc. Univ. Chem. Bull. 2015, 70, 197–201. [Google Scholar] [CrossRef]
  32. Efremenko, E.; Lyagin, I.; Aslanli, A.; Stepanov, N.; Maslova, O.; Senko, O. Carrier variety used in immobilization of His6-OPH extends its application areas. Polymers 2023, 15, 591. [Google Scholar] [CrossRef]
  33. Kaul, L.; Süss, R.; Zannettino, A.; Richter, K. The revival of dithiocarbamates: From pesticides to innovative medical treatments. iScience 2021, 24, 102092. [Google Scholar] [CrossRef]
  34. Haq, M.; Deshmukh, P. Review of recurrent otomycosis and clotrimazole in its treatment. Cureus 2022, 14, e30098. [Google Scholar] [CrossRef]
  35. Ladetto, M.F.; Ancarola, M.E.; Lamas, D.G.; Kollrich, B.A.; Cucher, M.A.; Álvarez, V.A.; Glisoni, R.J.; Castro, G.R.; Islan, G.A.; Cuestas, M.L. Enhanced antifungal efficacy of clotrimazole and itraconazole delivered via solid lipid nanoparticles for potential otomycosis therapy. J. Drug Deliv. Sci. Technol. 2025, 113, 107401. [Google Scholar] [CrossRef]
  36. Karpe, S.C.; Kiran, M.; Majhi, S.; Meena, J.; Kumar, R.; Chander, H.; Anvikar, A.R.; Kasana, H. Clotrimazole as a new frontier: Drug repurposing and its efficacy in cancer therapy. Cancer Pathog. Ther. 2025, 3, E14–E23. [Google Scholar] [CrossRef]
  37. Bucataru, C.; Ciobanasu, C. Antimicrobial peptides: Opportunities and challenges in overcoming resistance. Microbiol. Res. 2024, 286, 127822. [Google Scholar] [CrossRef] [PubMed]
  38. Oliveira Junior, N.G.; Souza, C.M.; Buccini, D.F.; Cardoso, M.H.; Franco, O.L. Antimicrobial peptides: Structure, functions and translational applications. Nat. Rev. Microbiol. 2025, 23, 687–700. [Google Scholar] [CrossRef]
  39. London, N.; Raveh, B.; Schueler-Furman, O. Druggable protein–protein interactions–from hot spot to hot segments. Curr. Opin. Chem. Biol. 2013, 17, 952–959. [Google Scholar] [CrossRef]
  40. Hashemi, Z.S.; Zarei, M.; Fath, M.K.; Ganji, M.; Farahani, M.S.; Afsharnouri, F.; Pourzardosht, N.; Khalesi, B.; Jahangiri, A.; Rahbar, M.R.; et al. In silico Approaches for the Design and Optimization of Interfering Peptides Against Protein–Protein Interactions. Front. Mol. Biosci. 2021, 8, 669431. [Google Scholar] [CrossRef] [PubMed]
  41. Zhou, T.; Chen, C.; Chen, X.; Wang, B.; Sun, F.; Li, W.; Liu, D.; Jin, H. Possible adverse events of imidazole antifungal drugs during treatment of vulvovaginal candidiasis: Analysis of the FDA Adverse Event Reporting System. Sci. Rep. 2024, 14, 14560. [Google Scholar] [CrossRef]
  42. Dalal, A.; Kumar, P.; Bansal, R.; Tushir, R.; Chauhan, A. A descriptive review on pharmacokinetics and pharmacodynamics profile of an antifungal agent: Clotrimazole. Eur. J. Pharm. Med. Res. 2022, 9, 204–216. [Google Scholar] [CrossRef]
  43. Malik, N.A.; Nazir, N.; Manzoor, M.; Gull, F. Fungicide-albumin interactions: Unraveling the complex relationship—A comprehensive review. Biophys. Rev. 2024, 16, 417–439. [Google Scholar] [CrossRef] [PubMed]
  44. Gow, N.A.; Latge, J.P.; Munro, C.A. The fungal cell wall: Structure, biosynthesis, and function. Microbiol. Spectr. 2017, 5, 10–1128. [Google Scholar] [CrossRef] [PubMed]
  45. Latgé, J.P.; Wang, T. Modern biophysics redefines our understanding of fungal cell wall structure, complexity, and dynamics. mBio 2022, 13, e01145-22. [Google Scholar] [CrossRef]
Figure 1. The general scheme of experiments undertaken in this work.
Sci 07 00169 g001
Figure 2. Predicted localization of the fungal cell wall component Chitin dimer (2) on the surface of the fungal-cell-wall-degrading enzymes Bgy6 (A), ChiC (B), Ega3 (C), and Lysozyme (D). The molecular surfaces of the enzymes are shown in gray, with residues located within 4 Å of the substrate and the corresponding regions highlighted in purple. Active-site entrances are marked with green boxes, and close-up views on the right illustrate the positioning of the Chitin dimer molecules (orange sticks) near catalytic residues. The catalytic residues are labeled and colored differently.
Sci 07 00169 g002
Figure 3. Comparative affinity values (AD) and the area occupied by the molecules of fungal cell wall components (E,F) (Allosamidin (1), Chitin dimer (2), Chitin tetramer (3), Chitin octamer (4), Chitin octadecamer (5), Chitosan (6), Galactosaminogalactan (7), and Triacetylchitotriose (8)) near catalytic residues (E) or on the total surface (F) of fungal-cell-wall-degrading enzymes Bgy6 (A), ChiC (B), Ega3 (C) and Lysozyme (D), calculated in silico using molecular docking. The relative surface areas of the enzymes’ active sites (E) and total surfaces (F) were normalized to 100%.
Sci 07 00169 g003
Figure 4. Predicted localization of AMP (Aculeacin A (1), Bacitracin (2), BMAP-18 (3), Bralicidin (4), Caspofungin (5), Colistin (6), Fengycin (7), Indolicidin (8), Iturin A (9), KK14 (10), Leg2 (11), hLF 1-11 (12), Lfampin B (13), PAF26 (14), PepGAT (15), PepKAA (16), Polymyxin B (17), RcAlb-PepII (18), TC3 (19), Temporin A (20), and Temporin G (21)) on the surfaces of fungal-cell-wall-degrading enzymes Bgy6 (A) and ChiC (B). The molecular surfaces of the enzymes are shown in gray, and residues within 4 Å of the AMP molecules, as well as the corresponding regions, are individually color-coded. Active-site entrances are marked with black boxes.
Sci 07 00169 g004
Figure 5. Comparative affinity values (AD) and the area occupied by the AMP molecules (Aculeacin A (1), Bacitracin (2), BMAP-18 (3), Bralicidin (4), Caspofungin (5), Colistin (6), Fengycin (7), Indolicidin (8), Iturin A (9), KK14 (10), Leg2 (11), hLF 1-11 (12), Lfampin B (13), PAF26 (14), PepGAT (15), PepKAA (16), Polymyxin B (17), RcAlb-PepII (18), TC3 (19), Temporin A (20), and Temporin G (21)) near catalytic residues (E) or on the total surface (F) of fungal-cell-wall-degrading enzymes Bgy6 (A), ChiC (B), Ega3 (C) and Lysozyme (D), calculated in silico using molecular docking. The relative surface areas of the enzymes’ active sites (E) and total surfaces (F) were normalized to 100%.
Sci 07 00169 g005
Figure 6. Predicted localization of PAA molecules on the surfaces of the fungal-cell-wall-degrading enzymes Bgy6 (A) and ChiC (B). The molecular surfaces of the enzymes are shown in gray, and PAA molecules are represented as green sticks.
Sci 07 00169 g006
Figure 7. Comparative affinity values (AD) and the area occupied by the PAA molecules (PEG22PLE50 (1), PEG113PLD10 (2), PEG113PLD50 (3), PEG113PLD100 (4), PEG113PLE10 (5), PEG113PLE50 (6), PEG113PLE100 (7), PLD10 (8), PLD50 (9), PLD100 (10), PLE10 (11), PLE50 (12), PLE50PEG113PLE50 (13), and PLE100 (14)) near catalytic residues (E) or on the total surface (F) of fungal-cell-wall-degrading enzymes Bgy6 (A), ChiC (B), Ega3 (C) and Lysozyme (D), calculated in silico using molecular docking. The cases in which the blocking of the entrances to the active sites of the enzyme by the studied molecules occurs in the absence of direct interactions with the amino acids on the surface, highlighted in purple. The relative surface areas of the enzymes’ active sites (E) and total surfaces (F) were normalized to 100%.
Sci 07 00169 g007
Figure 8. Predicted localization of PAA molecules on the surfaces of lactonases AiiA (shown in (A)), His6-OPH (shown in (B)), and NDM-1 (shown in (C)). The molecular surfaces of the enzymes are shown in gray, and PAA molecules are represented as green sticks.
Sci 07 00169 g008
Figure 9. Comparative affinity values (AD) and the area occupied by the PAA molecules (PEG22PLE50 (1), PEG113PLD10 (2), PEG113PLD50 (3), PEG113PLD100 (4), PEG113PLE10 (5), PEG113PLE50 (6), PEG113PLE100 (7), PLD10 (8), PLD50 (9), PLD100 (10), PLE10 (11), PLE50 (12), PLE50PEG113PLE50 (13), and PLE100 (14)) near catalytic residues (E) or on the total surface (F) of lactonase enzymes AiiA (A), His6-OPH (B), NDM-1 (C) and MIM1 (D), calculated in silico using molecular docking. The cases in which the blocking of the entrances to the active sites of the enzyme by the studied molecules occurs in the absence of direct interactions with the amino acids on the surface are highlighted in purple. The relative surface areas of the enzymes’ active sites (E) and total surfaces (F) were normalized to 100%.
Sci 07 00169 g009
Figure 10. Effect of different polypeptides on kinetic parameters of AiiA, His6-OPH, NDM-1, ChiC, and EGlu enzymes in hydrolysis reactions of the corresponding substrates. Panels show relative changes in Michaelis constant (A,B) and catalytic efficiency (C,D), white boxes indicate no significant difference, and patterned boxes denote untested combinations. The p values were shown when statistically significant differences were identified between Km or keff values. Values for native enzymes (without polypeptides) were set to 100%. The data are presented as the means of at least three independent experiments ± standard deviation (SD).
Sci 07 00169 g010
Figure 11. Thermal inactivation profiles of lactonase enzymes AiiA (A,D), His6-OPH (B,E), and NDM-1 (C,F) alone and in combinations with PAAs (PLD50 and PLE50). Panels (AC) show residual activity after 48 h at 8 °C, 25 °C, and 37 °C; panels (DF) show short-term exposure (15 min) at higher temperatures. The initial activity of each enzyme or combination was taken as 100%. The data are presented as the means of at least three independent experiments ±SD.
Sci 07 00169 g011
Figure 12. Predicted localization of clotrimazole molecules on the surfaces of enzymes AiiA (A), His6-OPH (B), NDM-1 (C), ChiC (D), and Bgy6 (E) combined with PLD50. The molecular surfaces of the enzymes are shown in gray, with residues located within 4 Å of the fungicide and the corresponding regions highlighted in purple. Molecules of PAA are shown as green sticks. Active-site entrances are marked with green boxes, and close-up views on the right illustrate the positioning of the clotrimazole molecules (orange sticks) near catalytic residues. The catalytic residues are labeled and colored differently.
Sci 07 00169 g012
Figure 13. Schematic representation of the proposed model, illustrating the interactions between enzymes, AMPs and PAAF within the antifungal framework. The molecular surfaces of the enzymes are shown in gray. PAA and AMP molecules are shown as green sticks.
Sci 07 00169 g013
Table 1. Hydrolytic enzymes degrading fungal cell wall components.
Enzyme, Origin [Reference]Object of ActionMechanism of Action
β-(1-3)-glucanase Bgy6 from Bacillus halotolerans [12]Verticillium dahliaePronounced inhibition of both spore germination and mycelial growth in fungal cultures.
Chitinase ChiC from Streptomyces griseus [13,14]Trichoderma reeseiAbility to inhibit hyphal extension of T. reesei.
Endo-α-1,4-galactosaminidase Ega3 from Aspergillus fumigatus [15] Aspergillus fumigatusThe enzyme catalyzes the breakdown of the exopolysaccharide galactosaminogalactan, which is a major structural component of A. fumigatus matrix.
Lysozyme from hen egg white [16,17] Biofilm of C. albicans; Aspergillus parasiticusBiofilm clearing effect was observed. The decrease in fungal cell viability was 100%; an inhibitory effect on the germination of spores was confirmed.
Table 2. Residual intracellular ATP levels (%) in filamentous fungi and yeasts were measured after 24 h exposure to combinations of enzymes with AMPs or PAAF *.
MicroorganismPolymyxin BColistinClotrimazole
no enzyme
Aspergillus niger23.4 ± 1.460.6 ± 4.1100 ± 4.1
Fusarium solani1.8 ± 0.23.4 ± 0.548.1 ± 1.2
Trichoderma atroviride100 ± 4.3100 ± 5.42.3 ± 0.3
Rhizopus oryzae100 ± 4.656.1 ± 4.322.7 ± 3.1
Saccharomyces cerevisiae84.0 ± 3.288.5 ± 1.439.7 ± 1.2
Candida tropicalis93.0 ± 2.892.2 ± 4.96.6 ± 1.3
AiiA+PLD50+PLE50
Aspergillus niger15.7 ± 2.725.2 ± 2.30.15 ± 0.040.27 ± 0.04
Fusarium solani4.1 ± 0.94 ± 0.22.3 ± 0.13.5 ± 0.05
Trichoderma atroviride4.0 ± 0.33.9 ± 1.00.11 ± 0.030.13 ± 0.02
Rhizopus oryzae0.9 ± 0.10.8 ± 0.115.2 ± 1.414.1 ± 0.12
Saccharomyces cerevisiae78.3 ± 3.982.9 ± 4.170.1 ± 3.196.4 ± 2.3
Candida tropicalis91.2 ± 2.891.2 ± 5.733.8 ± 1.35.5 ± 1.2
His6-OPH+PLD50+PLE50
Aspergillus niger5.0 ± 0.83.4 ± 0.56.2 ± 0.710.9 ± 0.8
Fusarium solani21.7 ± 1.715.2 ± 1.6100 ± 2.5100 ± 3.6
Trichoderma atroviride0.02 ± 0.0010.05 ± 0.00138.3 ± 1.2100 ± 4.1
Rhizopus oryzae0.05 ± 0.0010.6 ± 0.02100 ± 4.596.5 ± 1.4
Saccharomyces cerevisiae70.0 ± 1.473.8 ± 5.779.4 ± 2.2100 ± 3.4
Candida tropicalis67.9 ± 4.367.3 ± 1.328.8 ± 1.332.3 ± 0.7
NDM-1+PLD50+PLE50
Aspergillus niger100 ± 5.535.7 ± 1.82.9 ± 0.40.72 ± 0.08
Fusarium solani0.2 ± 0.0716.6 ± 0.734 ± 1.111.4 ± 0.4
Trichoderma atroviride100 ± 6.5100 ± 4.41.9 ± 0.0918.9 ± 1.7
Rhizopus oryzae0.6 ± 0.02100 ± 3.10.67 ± 0.031.5 ± 0.08
Saccharomyces cerevisiae100 ± 4.196.1 ± 4.1100 ± 4.445.5 ± 2.1
Candida tropicalis100 ± 5.9100 ± 5.3100 ± 3.4100 ± 2.8
ChiC+PLD50+PLE50
Aspergillus niger32.4 ±1.81.3 ± 0.1100 ± 2.741.4 ± 3.1
Fusarium solani3.4 ± 0.338.8 ± 1.5100 ± 2.68.4 ± 0.4
Trichoderma atroviride0.6 ± 0.063.7 ± 0.410.5 ± 2.532.8 ± 1.6
Rhizopus oryzae3.9 ± 0.50.2 ± 0.071.2 ± 0.267.1 ± 1.2
Saccharomyces cerevisiae23.6 ± 0.81.4 ± 0.036.6 ± 0.31.5 ± 0.02
Candida tropicalis51.2 ± 1.72.9 ± 0.026.7 ± 0.31.2 ± 0.06
Bgy6-like+PLD50+PLE50
Aspergillus niger43.8 ± 1.116.4 ± 2.30.7 ± 0.156.7 ± 2.8
Fusarium solani4.2 ± 0.23.9 ± 1.2100 ± 3.383.1 ± 3.2
Trichoderma atroviride100 ± 2.540.7 ± 2.174.2 ± 3.710.6 ± 2.5
Rhizopus oryzae0.1 ± 0.0115.9 ± 1.1100 ± 2.78.8 ± 0.9
Saccharomyces cerevisiae100 ± 1.47.6 ± 0.85.6 ± 0.215.8 ± 0.7
Candida tropicalis94.2 ± 4.710.5 ± 0.510.5 ± 0.593.9 ± 3.2
* The pink highlights indicate the most effective combinations (residual concentration of intracellular ATP <1.5%) for individual microorganisms. The residual concentration of ATP in control samples with cells without the addition of antimicrobial agents was taken as 100%. The results for AMPs themselves or in combination with lactonases [7] are presented in this table for comparison.
Disclaimer/Publisher’s Note: The statements, opinions and data contained in all publications are solely those of the individual author(s) and contributor(s) and not of MDPI and/or the editor(s). MDPI and/or the editor(s) disclaim responsibility for any injury to people or property resulting from any ideas, methods, instructions or products referred to in the content.