Abstract
Melia azedarach L. (Meliaceae) exhibits potential as a source of bioactive antibacterial compounds. In this study, the effect of solvent polarity on ultrasound-assisted extraction of M. azedarach leaves and twigs was evaluated in relation to their phytochemical composition and antibacterial activity against both non-resistant and multidrug-resistant bacteria. The results showed that solvent polarity significantly affected the extraction yield, with methanol and water producing yields above 10%. The methanol extracts of twigs and leaves exhibited the strongest antibacterial activity, showing greater potency against Escherichia coli than Bacillus subtilis. Consistent with these findings, the methanol extracts inhibited the growth of multidrug-resistant enteropathogenic E. coli K1-1, resulting in inhibition zone diameters of 10.93 mm (leaf) and 7.73 mm (twig). Furthermore, the methanol extract contained the highest levels of phenolic, flavonoid, and hydroxyl-rich compounds, which were associated with its antibacterial properties. In silico analysis further revealed that isofucosterol, meliasenin, and melianone exhibited strong predicted binding affinities to key antibacterial proteins, particularly those involved in multidrug-resistant bacterial mechanisms.
1. Introduction
Bacterial infections remain one of the leading causes of death worldwide, affecting both antibiotic-susceptible and antibiotic-resistant cases. In fact, 33 bacterial pathogens (both resistant and susceptible to antimicrobials) were responsible for an estimated 7.7 million deaths in 2019 [1]. Among these, Escherichia coli ranked as the second most common cause of bacterial infection–related mortality [1]. More recent reports also highlight that E. coli is among the most extensively studied bacteria, while Bacillus subtilis ranks sixth in terms of publications indexed in PubMed [2].
The current global health crisis is also driven by the rising prevalence of multidrug-resistant (MDR) bacteria. According to the WHO GLASS Report 2022, MDR E. coli cases showed a marked increase between 2016 and 2020, with the highest prevalence observed in bloodstream and urinary tract infections [3]. MDR strains compromise the effectiveness of antibiotics, resulting in prolonged illness, higher treatment costs, and increased mortality. Among the various E. coli pathotypes, enteropathogenic Escherichia coli (EPEC) is of clinical importance. EPEC was the first E. coli pathotype recognized as a cause of watery diarrhea, primarily in infants and young children living in resource-limited regions and has been implicated in both sporadic and epidemic outbreaks [4]. Although infections have been mostly reported in infants, recent evidence shows that EPEC can also cause disease in adults and has been associated with hyponatremia [5]. The growing challenge of MDR highlights the urgent need for alternative strategies to combat bacterial infections, particularly through the discovery and development of novel antibacterial agents derived from natural products.
Antibacterial agents continue to be extensively researched and developed, driven by the increasing prevalence of bacterial resistance to existing antibiotics. Natural products offer significant potential for exploration and development, as many currently available antibiotics, such as penicillin, streptomycin, and artemisinin, are derived from natural sources [6]. Extensive research on natural compounds with antibacterial properties has yielded promising results, with plant-derived antibacterials being the most extensively developed [7]. This growing interest highlights the importance of natural products as a resource for discovering novel antibacterial agents to address the global challenge of antibiotic resistance.
Melia azedarach L., commonly known as Chinaberry, is a fast-growing tree species extensively cultivated in Indonesia. According to Statistics Indonesia 2019 [8], the production of M. azedarach tree logs reached 15,995 m3 in 2019. Ethnobotanically, various parts of this plant have been used to treat a wide range of ailments, and research has demonstrated its potential as an anti-inflammatory, analgesic, insecticidal, rodenticidal, anti-diarrheal, deobstruent, diuretic, antidiabetic, cathartic, emetic, antirheumatic, and antihypertensive agent [9,10]. M. azedarach has also been extensively studied for its antibacterial properties. The leaf extracts of M. azedarach have shown antibacterial activity against both Gram-positive and Gram-negative bacteria [11,12,13]. Studies using seed methanol extracts and their fractions have shown effectiveness against human pathogenic bacteria [14], while bark and flower extracts have also exhibited antibacterial properties [15,16]. Collectively, these findings highlight the richness of bioactive compounds in various parts of M. azedarach, underscoring their significant antibacterial potential.
The antibacterial activity of M. azedarach is undoubtedly linked to its phytochemical constituents. Various phytocompounds have been identified from different parts of M. azedarach, with unique isolates predominantly belonging to the terpenoid class, particularly limonoids and tirrucallane-type triterpenoids [17,18]. The exploration of antibacterial activity in this plant reveals substantial potential for further development. This study focuses on the application of ultrasound-assisted extraction (UAE) to extract phytocompounds and investigates the effects of solvent polarity on antibacterial activity. To date, no studies have addressed the impact of different extraction solvents using UAE on antibacterial activity and chemical profiles of M. azedarach. Additionally, antibacterial activity and phytochemical components of the M. azedarach twig have not been reported yet. Moreover, there is a lack of research on the phytochemical compounds of M. azedarach leaves and twigs using in silico analysis. Therefore, this research aims to evaluate the antibacterial activity of M. azedarach leaves and twigs through both in vitro (against MDR and non-MDR E. coli) and in silico methods, while also characterizing their phytochemical profiles as influenced by stepwise ultrasound-assisted extraction.
2. Materials and Methods
2.1. Plant Materials
The leaves and twigs were collected from a 10-year-old Melia azedarach tree in the Cikabayan Forest, IPB University, located at 6°32′25.47″ N and 106°42′53.22″ E, with an altitude of 142.60 m, Bogor, Indonesia. The voucher specimen was deposited under voucher number BMK0085082016. The leaves and twigs (Figure 1) were cleaned and separated from each other. For the leaf samples, only the leaf blades were used (without the petioles). Meanwhile, the twig samples consisted of whole twigs without peeling the bark. Both samples were chopped and dried in an oven at 45 °C for 24 h. The dried samples were then ground into powder and sieved using a 40–60 mesh sieve, yielding leaf and twig powders with particle sizes ranging from 0.25 to 0.425 mm.
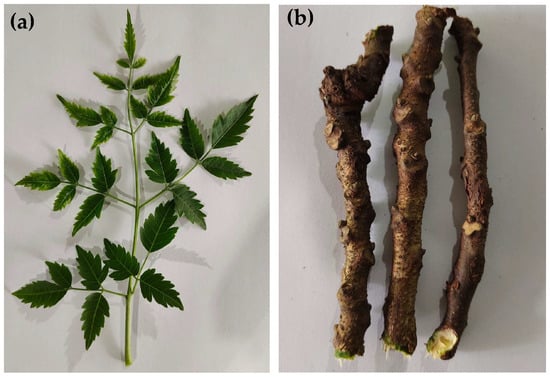
Figure 1.
The M. azedarach leaves (a), and twigs (b) used as samples.
2.2. Extraction
Ultrasound-assisted extraction was performed to extract compounds from leaf and twig powders. The extraction was carried out for 30 min at a temperature of 40 °C, with different solvent polarities using hexane, ethyl acetate (EtOAc), methanol (MeOH), and water. The ratio of powder to solvent used was 1:10 (w/v). The filtrates obtained from the extraction process were centrifuged at 3000 rpm for 15 min at room temperature. The supernatant was separated and concentrated using a rotary evaporator (Heidolph, Schwabach, Germany) to produce a concentrated extract. The extract was then weighed to determine the extraction yield.
2.3. Qualitative Phytochemical Analysis
- (a)
- Alkaloid
The 0.1 g of extract was placed into a test tube, followed by the addition of 2 drops of concentrated NH4OH and 2 mL of chloroform. The solution was homogenized using a vortex mixer. After homogenization, 1 mL of H2SO4 2 M was added. This resulted in the formation of two layers: an acidic layer and an organic layer. The acidic layer was dropped into three wells of a spot plate. Each well was then treated with Mayer’s, Wagner’s, and Dragendorff’s reagents. A positive alkaloid reaction is indicated by a yellowish-cream color with Mayer’s reagent, brown with Wagner’s, and orange with Dragendorff’s.
- (b)
- Flavonoid, Tannin, and Saponin
The 0.2 g of extract was placed into a test tube, followed by the addition of 5 mL of distilled water, and then heated in a water bath. Once the solution became homogeneous and the water in the bath reached boiling point (with the temperature of 100 °C), the hotplate was turned off, and the solution was allowed to cool to room temperature. For flavonoid detection, a portion of the solution was transferred to another test tube, followed by the addition of 2–3 drops of HCl 37.5%, 10–20 mg of magnesium powder, and 0.5 mL of amyl alcohol, resulting in two layers; a positive result is indicated by the amyl alcohol layer appearing denser than the filtrate with a cream-to-red color range. For tannin detection, 2 drops of the solution were placed on a spot plate and treated with 1 drop of FeCl3 5%, with a color change to blue, green, or black indicating a positive result. For saponin detection, the solution was shaken horizontally, and the formation of foam indicated a positive reaction.
- (c)
- Phenolic
The 0.1 g of extract was placed into a test tube, followed by the addition of 2 mL of methanol, and then heated in a water bath. Once the solution became homogeneous and the water in the bath reached boiling point (~100 °C), the hotplate was turned off, and the solution was allowed to cool to room temperature. The solution was then dropped onto a spot plate, and 1 drop of NaOH 10% was added. The presence of phenolic compounds is indicated by a color change to cream or reddish tones.
- (d)
- Triterpenoid and Steroid
The 0.1 g of extract was placed into a test tube, followed by the addition of 2 mL of ethanol, and then heated in a water bath. Once the solution became homogeneous and the water in the bath reached boiling point (~100 °C), the hotplate was turned off, and the solution was allowed to cool to room temperature. Any non-homogeneous solution was separated and reheated until a dry residue formed. Two milliliters of diethyl ether was then added to the residue. The resulting solution was dropped onto a spot plate, followed by the addition 3 drops of acetic anhydride and 1 drop of concentrated H2SO4 in a 3:1 ratio. The presence of steroids was indicated by the formation of a bluish-green outer ring, while the presence of triterpenoids was shown by a red, brown, or violet inner ring.
2.4. Total Phenolic Content
Total phenolic content (TPC) was determined according to Batubara et al. (2020) [19]; a total of 10 µL of extract solution was added to the microplate well, along with 150 of aqua bidest, 10 µL of 10% Folin–Ciocâlteu reagent, and 20 µL of 10% Na2CO3. The mixture was homogenized and incubated for 30 min at room temperature. Absorbances were measured at 750 nm using a microplate reader (Epoch Biotek, Winooski, VT, USA). A gallic acid calibration curve was generated, and the phenolic content was reported in milligrams of gallic acid equivalent per gram of dried extract (mg GAE/g DE).
2.5. Total Flavonoid Content
Total flavonoid content (TFC) was determined according to Batubara et al. (2020) [19]. A total of 60 µL of extract solution was mixed with 10 µL of 10% AlCl3, 10 µL of CH3COOK, and 120 µL of aqua bidest. Then, the sample solution was incubated at room temperature for 30 min. Measurements were carried out using a microplate reader at 415 nm. Calibration curves were prepared using quercetin standards, and total flavonoid levels were expressed as milligrams of quercetin equivalent per gram of dried extract (mg QE/g DE).
2.6. Antibacterial Activity Assay
The bacteria used in this antibacterial assay were E. coli (ATCC 8739) and B. subtilis (ATCC 19659). A total of 100 μL of extract at varying concentrations, dissolved in 20% DMSO, was added. Then, 100 μL of sterile Nutrient Broth (NB) medium and 5 μL of bacterial inoculum were introduced into each well of the microplate. The first and second columns of the microplate were filled with 100 μL of 20% DMSO (negative control) and chloramphenicol (Kalmicetine, Kalbe Farma, Indonesia) as the positive control, respectively. The plate was then incubated at 37 °C for 24 h. The results were visually observed, and extract concentrations that remained clear (not turbid) were identified as the minimum inhibitory concentration (MIC), indicating the absence of bacterial growth. Subsequently, 10 μL of media from wells showing no bacterial growth was inoculated into 100 μL of fresh medium and incubated again for 18–22 h at 37 °C. Concentrations that still showed no bacterial growth (no turbidity) after the second inoculation were defined as the minimum bactericidal concentration (MBC).
The multidrug resistance bacteria (EPEC K1-1) were obtained from animal biotechnology laboratory (IPB University). Bacterial inoculants were cultured on Nutrient Agar media, then transferred into 10 mL of nutrient broth media. The cultures were incubated for 24 h at 37 °C. The extracts at concentrations of 10,000 µg/mL were used in the tests. The bacterial cultures at a concentration of 108 CFU/mL were spread onto solid Nutrient Agar. The Whatman no. 1 filter papers were immersed and soaked, then placed on the dried bacterial cultures. The bacteria and sample were incubated at 37 °C for 18–24 h. The clear zones that appeared around the bacteria were measured with a caliper to determine the antibacterial effect. Amoxicillin (Amoxan, Kalbe Farma, Jakarta, Indonesia) was used as the positive control.
2.7. FTIR Analysis
All extracts were subjected to Fourier transform infrared spectral analysis (FTIR) to identify and characterize the chemical bonds and functional groups present. The spectra were obtained using a Bruker Tensor 37 FTIR spectrophotometer equipped with a deuterated triglycine sulfate detector (Bruker, Karlsruhe, Germany) and the KBr-pellet method. Absorbance measurements were recorded across a wavenumber range of 600–4000 cm−1, with a resolution of 4 cm−1 and 32 scans.
2.8. GCMS Analysis
For GC-MS analysis, 1–2 mg of dried hexane extracts was placed into glass vials and silylated with 50 μL of BSTFA/TMSCl (99/1), followed by heating at 70 °C for 12 h. The derivatizing reagent was then evaporated, and the extract derivatives were diluted in 1 mL of ethyl acetate before being transferred for gas chromatography. The analysis was performed using a Clarus 680 gas chromatograph coupled to a Clarus SQ8 quadrupole mass spectrometer (Perkin Elmer Inc., Waltham, MA, USA) with a fused-silica capillary column (DB-5ms, 30 m × 0.25 mm, 0.25 μm film thickness, J&W Scientific, Folsom, CA, USA) containing 5% diphenyl and 95% dimethyl polysiloxane. Helium was used as the carrier gas at a constant flow rate of 1 mL/min. Sample injection (1 μL) was conducted at 250 °C in splitless mode. The oven temperature program began at 80 °C (held for 2 min), increased to 190 °C at 10 °C/min, then to 280 °C at 15 °C/min (held for 5 min), and finally to 300 °C at 10 °C/min (held for 14 min). Ionization was achieved in electron impact mode at 70 eV, with source and transfer line temperatures of 180 °C and 250 °C, respectively. Detection was performed in scan mode (molecular weight of 45–700 Da), with a 2 min solvent delay. Compounds were identified by comparing their spectra with the NIST Mass Spectral Library (2011 edition).
2.9. LCMS Analysis
The EtOAc, MeOH, and water extracts were analyzed to identify their components using Liquid chromatography-mass spectrometry (LC-MS). LCMS analyses were conducted using a Shimadzu LC-20A ultra-HPLC system equipped with an autosampler, a PDA UV detector SPD-20A, and a LC-MS 8030 triple-quadrupole mass spectrometer. Separation was achieved on a Luna C18 analytical column (150 mm × 3 mm, Phenomenex, Le Pecq, France) at a flow rate of 0.4 mL/min using a 20 min gradient: starting with 5% acetonitrile (0.1% formic acid) in water (0.1% formic acid), the acetonitrile proportion was linearly increased to 30% over 10 min, then to 80% over 8 min, held for 1 min, and returned to initial conditions within 1 min. The injection volume was 1 μL. UV-Visible spectra were recorded between 190 and 800 nm. Positive and negative ion electrospray mass spectrometric analyses were performed at unit resolution over molecular weight range of 100–2000 Da with a scan speed of 15,000 amu/s. The heat block and desolvation line temperatures were set at 400 °C and 250 °C, respectively. Nitrogen was used as the drying gas (15 L/min) and nebulizing gas (3 L/min), with an ion spray voltage of ±4500 V. Data acquisition and analysis were performed using MSDial version 5.4.241021 (RIKEN, Wako, Japan). The compound annotation database was obtained from MS-DIAL, PubChem, and KNApSAcK, with the aid of previous scientific publications related to compounds isolated from the genus Melia.
2.10. Molecular Docking
The phytochemical compounds identified through GC-MS and LC-MS were evaluated for their binding mechanisms with antibacterial target proteins. Six target proteins associated with antibacterial activity were selected: FabI (PDB ID: 6AH9), FtsZ (PDB ID: 2VXY), TolC (PDB ID: 1TQQ), AcrB (PDB ID: 5ENQ), AcrD (PDB ID: 8F4R), and AcrA (PDB ID: 2F1M). The 3D structures of these proteins were retrieved from the Protein Data Bank (https://www.rcsb.org/ (accessed on 18 February 2025)). The grid center values for each receptor are provided in Table 1. Molecular docking was performed using the AutoDock Vina v1.2.0 algorithm [20,21] and the docking results were visualized using Discovery Studio Visualizer v21.1.0.20298 (Biovia, San Diego, CA, USA).

Table 1.
Grid center for molecular docking analysis.
3. Results
3.1. Extraction Yield and Phytochemical Profile of Extracts
The distribution of phytochemical compounds in leaf and twig extracts shows differences in the number of phytochemical compounds based on polarity. The yield values vary, with the percentage yield range of leaves and twigs being 1.24–10.75% and 3.81–18.61%, respectively (Table 2). Previous research showed that the acetone extract yield of leaves was 10% [10]. The extraction yield of leaves follows a trend from low to high as leaf hexane (LH), leaf ethyl acetate (LE), leaf methanol (LM), and leaf water (LW). Meanwhile, the extraction yield trend of twigs from low to high is twig hexane (TH), twig ethyl acetate (TE), twig methanol (TW), and twig methanol (TM). Water and methanol extracts produced higher extraction yields compared to hexane and ethyl acetate extracts in both parts of the tree used. This indicates that M. azedarach leaves and twigs contain more polar phytochemical compounds compared to nonpolar phytochemical compounds. Leaf extracts contain more highly polar phytochemical compounds, indicated by the higher LW yield compared to LM, although not significantly different. Conversely, TW extracts have a higher yield compared to TM, indicating that M. azedarach twigs contain fewer highly polar phytochemical compounds.
Table 2.
Extraction yield using different extraction solvent polarity.
Leaf and twig extracts contain alkaloids, flavonoids, hydroquinone phenols, steroids, triterpenoids, tannins, and saponins, with varying compositions depending on the type of solvent used for extraction. Methanol extracts from both leaves and twigs were found to contain all these compounds (Table 3). A similar pattern was observed in the presence of alkaloids, steroids, and triterpenoids. Ethyl acetate extracts from both plant parts did not contain alkaloids, while water extracts lacked both steroids and triterpenoids. This is likely due to the polarity of the solvents, as steroids and terpenoids are hydrocarbon compounds dominated by carbon and hydrogen atoms, making them non-polar and less soluble in water.
Table 3.
Phytochemical content in leaf and twig extract.
Quantitative analysis showed that phenolic and flavonoid compounds were more abundant in the more polar extracts. The highest levels of phenolic compounds were observed in the methanol extracts of both leaves and twigs, which were significantly different from the other extracts (Table 4). The trend in phenolic content for both leaf and twig extracts followed a similar pattern from lowest to highest: LE < LW < LM. Meanwhile, the highest flavonoid levels were found in the methanol leaf extract and the ethyl acetate twig extract.
Table 4.
Total phenolic and flavonoid content in leaf and twig extract.
The type of extraction solvent influences the chemical composition of the resulting extracts, as evidenced by the FTIR spectra obtained from the twig and leaf extracts. In general, the FTIR spectra of the twig and leaf extracts show similarities (Figure 2). These similarities are also observed among extracts prepared with specific solvents. For instance, the hexane extract exhibits similarities with the ethyl acetate (EtOAc) extract, while the methanol extract resembles the water extract. Differences between the FTIR spectra of the extracts, as well as between tree parts, are observed in the peaks within the wavenumber ranges of 2500–4000 cm−1 and below 2000 cm−1. These variations suggest the presence of highly polar compounds such as carbohydrates, tannins, and water-soluble phenolic acids. Overall, the spectra reflect a polarity trend, with hexane extracting non-polar components and water extracting highly polar compounds.
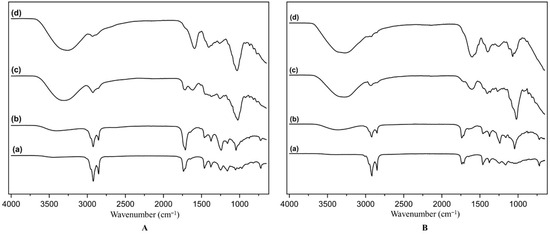
Figure 2.
FTIR Spectra of hexane (a), ethyl acetate (b), methanol (c), and water (d) extracts of twig (A) and leaf (B).
The hexane and ethyl acetate extracts exhibit characteristic peaks corresponding to C–H and C = O groups (Figure 2a,b). Peaks in the wavenumber range of 2800–3000 cm−1 represent C–H stretching vibrations of alkanes. Additionally, peaks at 1450–1470 cm−1 correspond to C–H bending vibrations. These peaks are prominent in both twig and leaf extracts, indicating the presence of hydrocarbons or non-polar compounds, which are typically extracted by hexane. Both extracts also exhibit peaks in the range of 1500–1750 cm−1, attributed to C = O stretching in esters or ketones. The C–H peaks have higher absorbance in the ethyl acetate extract, while C = O peaks show greater absorbance in the same extract. Furthermore, a broad peak with low absorbance in the range of 3000–3750 cm−1, characteristic of O–H functional groups, indicates that hexane and EtOAc extracts are dominated by non-polar hydrocarbons with minor contributions of compounds containing O–H groups in the ethyl acetate extracts of twigs and leaves.
The methanol and water extracts of twigs and leaves contain polar compounds, as indicated by the presence of O–H and C–O absorption peaks (Figure 2c,d). C–O stretching vibrations are observed in the wavenumber range of 1000–1300 cm−1, while broad and intense peaks around 3000–3750 cm−1 correspond to O–H stretching. Peaks near 1600–1650 cm−1 may correspond to C = C stretching in aromatic compounds. These peaks suggest the presence of polar compounds such as tannins, phenolics, carboxylic acids, or polysaccharides, consistent with the polar nature of methanol and water as solvents. These FTIR spectrum profiles confirm the alignment of the relationship with high TPC and TFC values in methanol extracts.
Hexane and ethyl acetate extracts contain long-chain alkanes, fatty acids and their derivatives. GC-MS analysis reveals that leaf extracts contain longer-chain hydrocarbons compared to twig extracts (Table 5). This is evidenced by higher concentrations of eicosane and heptacosane in leaf extracts, whereas twig extracts contain higher levels of tricosane and hexacosane. Consistent with the FTIR spectra, which showed absorption bands corresponding to O–H, C = O, and ester groups, the ethyl acetate twig extract was hypothesized to contain compounds such as tricosanol, palmitic acid, and methyl palmitate. Meanwhile, the ethyl acetate leaf extract exhibited functional groups that may be associated with phytol, tocopherol, and isofucosterol, which possess O–H and C–O–C structures. Based on GC-MS results, the dominant compounds for each extract were tetradecane (TH), tridecane (TE), heptacosane (LH), and isofucosterol (LE).
Table 5.
Phytochemical component of hexane and ethyl acetate extracts from leaf and twig based on GCMS analysis.
The three leaf extracts, obtained using different solvents, exhibit significant variations in their chemical composition based on LC-MS analysis (Table 6). The LE extract is presumed to have higher concentrations of meliasenin I and K compared to the LM and LW extracts. These compounds were previously isolated from the fruits of M. azedarach [27]. The compounds 3′,4′-Dihydroinfectopyrone, HME, and (-)-loliolide are more abundant in the LM extract. While no prior reports have identified 3′,4′-Dihydroinfectopyrone and HME, (-)-loliolide has been identified in the roots of M. azedarach [28]. Meanwhile, the LW extract contains a relatively high abundance of succinic acid, which has also been reported in the leaves of M. azedarach [29].
Table 6.
Phytochemical component of ethyl acetate, methanol, and water extracts from leaf and twig based on LCMS analysis.
Compounds in the twig extract exhibit limited similarity in terms of their most abundant components. 3′,4′-Dihydroinfectopyrone was found to have relatively higher abundance compared to other compounds in the ethyl acetate, methanol, and water extracts, with a trend of increasing abundance from TW, TM, to TE (Table 6). This compound has not been previously identified in Melia azedarach. Additionally, meliasenin M/N/O was detected in the LE extract. These three compounds are indistinguishable due to their identical molecular weights and were previously identified in the ethanol extract of M. azedarach fruit [27]. In the TM extract, melazolide B, loliolide, and methyl dihydrojasmonate were detected with relatively higher abundance compared to other compounds. Melazolide B and loliolide have been isolated from the ethyl acetate extract of M. azedarach roots and methanol extract of its leaves, respectively [30,31]. Loliolide is also suggested to have considerable abundance in the TW extract. Furthermore, 15-O-deacetyl-15-O-methylnimbolidin A was identified with a relative abundance of 2.25%, and this compound has been previously reported in the methanol extract of M. azedarach fruit [32].
3.2. Antibacterial Activity
In general, leaf and twig extracts of M. azedarach exhibited antibacterial activity against E. coli and B. subtilis (Table 7). The leaf and twig extracts showed a similar trend in MIC and MBC values against E. coli. Meanwhile, the leaf extract exhibited stronger antibacterial activity against B. subtilis than the twig extract, as indicated by their respective MIC and MBC values. The MIC values ranged from 1 to >20 mg/mL, while the MBC values ranged from 2 to >20 mg/mL. Compared to the positive control (chloramphenicol), all extracts showed higher MIC and MBC values, indicating that the antibacterial activity of the extracts was weaker than that of the control. The strongest extract was 40 times less effective than chloramphenicol in killing E. coli. In contrast, the M. azedarach extract was 400 times less effective in killing B. subtilis compared to chloramphenicol.
Table 7.
Minimum inhibitory concentration (MIC), and minimum bactericidal concentration (MBC) of M. azedarach extracts against B. subtilis and E. coli.
Differences in plant parts led to more specific antibacterial effects. Twig extracts showed better activity against E. coli, while leaf extracts were more effective against B. subtilis. Specifically, methanol extracts from both leaves and twigs exhibited the strongest activity against E. coli. Meanwhile, the bactericidal activity against B. subtilis was demonstrated by the methanol leaf extract and the ethyl acetate twig extract. Methanol leaf extracts of M. azedarach have previously been reported to exhibit antibacterial activity against Staphylococcus aureus, Staphylococcus epidermidis, E. coli, and Pseudomonas aeruginosa [13].
Consistent with their activity against non-MDR E. coli, the methanol extracts from both leaves and twigs exhibited the strongest antibacterial effects. A similar trend was observed against enteropathogenic E. coli K1-1, with activity following the order methanol > ethyl acetate > hexane > water extracts (Table 8). The methanol leaf extract produced a greater inhibition zone compared with the methanol twig extract. In addition, the inhibition zone diameters of the leaf extracts were larger than those of the twig extracts. However, the relative inhibition zone diameter displayed a different trend, with the twig extract showing a higher average percentage than the leaf extract.
Table 8.
Inhibition zone diameter of M. azedarach extracts against enteropathogenic E. coli K1-1.
The chemical composition of the extracts, which is influenced by the type of extraction solvent, also affected their antibacterial activity. Non-polar compounds from the leaves did not show strong antibacterial activity compared to other leaf extracts. This was indicated by the weak antibacterial effect of the hexane leaf extract against both E. coli and B. subtilis. A similar trend was observed in the hexane twig extract, which showed the weakest activity against E. coli among all twig extracts. However, an opposite pattern was found in the aqueous twig extract, which showed poor activity against B. subtilis.
The phenolic and flavonoid contents of the extracts are related to their antibacterial properties. Methanol extracts of leaves and twigs exhibited stronger antibacterial activity compared to other extracts, which is associated with their higher TPC and TFC values (Table 4). This phenomenon was not clearly observed in the antibacterial activity against B. subtilis. The methanol extracts of leaves and twigs, despite having high phenolic and flavonoid contents, did not show a positive correlation with antibacterial activity against B. subtilis. However, a unique phenomenon was observed regarding the flavonoid content in the leaves. The methanol extract of the leaves, characterized by the highest and statistically significant flavonoid concentration, demonstrated the most pronounced antibacterial activity against E. coli K1-1.
3.3. Binding Mechanism of Phytocompounds
The antibacterial activity of various chemical compounds involves diverse mechanisms targeting specific bacterial proteins. Several proteins examined in this study are critical for bacterial survival and serve as potential targets for inhibition. The enoyl-[acyl-carrier-protein] reductase (FabI) is involved in bacterial fatty acid synthesis, and its inhibition disrupts lipid metabolism [33]. FtsZ, a key protein in bacterial cell division, is another promising target for antibacterial agents that aim to interfere with cytokinesis [33]. The AcrAB-TolC efflux pump, a multidrug resistance complex, expels toxic compounds from the bacterial cytoplasm, playing a significant role in antibiotic resistance [34]. Similarly, AcrD, an RND-type efflux pump, specializes in removing aminoglycosides and other toxic substances from bacterial cells [35].
Phytochemical compounds from twig and leaf extracts exhibit varying binding affinities to these target proteins. Compounds with the highest binding affinity for each protein include meliasenin O for ACP reductase, meliasenin N for FtsZ, melianone for TolC, meliasenin M for AcrA and AcrD, and isofucosterol for AcrB (Table 9). These best-docked phytocompounds resulted in numerous interactions with the targeted protein, namely hydrogen bonds, van der Waals forces, alkyl interactions, and pi-sigma interactions (Figure 3). Notably, meliasenin M/N/O compounds, abundant in the TE extract, have not been previously reported for their antibacterial activity. Studies indicate that an isomer of isofucosterol, fucosterol, exhibits significant antibacterial activity against E. coli [36]. Additionally, melianone has been reported to inhibit Salmonella typhi by binding to the periplasmic opening of the FocA channel protein, increasing formate concentration, reducing bacterial populations, and causing severe membrane disruption [37]. These findings suggest that the antibacterial activity of the extracts may involve multiple mechanisms and synergistic interactions among various phytochemical components.
Table 9.
Binding affinity of phytocompounds against six antibacterial targeted proteins.
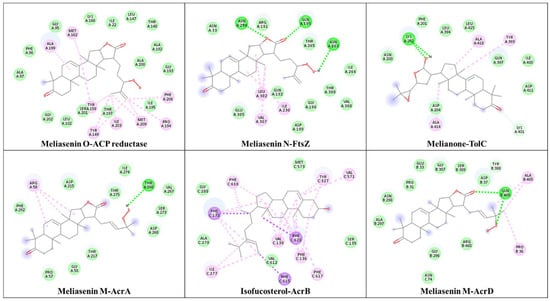
Figure 3.
The best docked phytocompound interaction to the protein. Hydrogen bond (green), van der Waals (light green), alkyl interaction (pink), and pi-sigma (violet), dotted line (interaction between amino acid and ligand molecular structure), red line (polar bond), and red circle (oxygen atom).
The binding affinity values of each phytocompound can serve as an initial indication of the antibacterial mechanism of the leaf extract. Several compounds with relatively high abundance in specific extracts also exhibit significant binding affinity to certain proteins. Isofucosterol, for example, is relatively abundant in the LE extract. Additionally, meliasenin I and K, which are also present in relatively high concentrations in the LE extract, demonstrates high binding affinity to the ACP reductase protein. This suggests a potential antibacterial mechanism of LE through the inhibition of ACP reductase, although the antibacterial activity of LE against E. coli and B. subtilis are not superior to those of LM. However, several phytocompounds in the LM extract with relatively high abundance (e.g., loliolide, meliazolide B, HME, and 3′,4′-dihydroinfectopyrone), as identified in this study, do not exhibit superior binding affinity to the tested proteins. This suggests that other unidentified compounds may be responsible for the antibacterial activity of the LM extract.
Phytocompounds with relatively high abundance in twig extracts did not show superior binding affinity compared to other compounds. The TH and TE extracts contained a high proportion of long-chain alkanes based on GC–MS analysis; however, these compounds did not demonstrate significant binding affinity relative to other phytocompounds. A similar observation was obtained from the LC–MS analysis, in which the TE, TM, and TW extracts were found to contain relatively high levels of 3′,4′-dihydroinfectopyrone. Nevertheless, this compound also did not exhibit strong binding affinity. The TE and TM extracts exhibited the highest antibacterial activity against E. coli and B. subtilis. Meliasenin M/N/O, which had a relative abundance of 1.5%, was higher than that of other compounds and showed strong binding affinity toward several target proteins. Meanwhile, the TM extract contained relatively high levels of meliazolide B and (-)-loliolide compared to other compounds, but these phytocompounds did not exhibit binding affinities as high as those of other compounds. Based on these findings, the antibacterial activity of the twig extracts was likely the result of synergistic effects among various compounds within the extracts. It is also possible that other unidentified compounds in the twig extracts played a significant role in their antibacterial activity.
In relation to the antibacterial activity of the methanol extracts against EPEC K1-1, other compounds potentially responsible for this activity may not yet have been identified in the extracts. The leaf methanol extract was dominated by (-)-loliolide, methyl dihydrojasmonate, HME, and 3′,4′-dihydroinfectopyrone, whereas the twig methanol extract was primarily composed of 3′,4′-dihydroinfectopyrone, melazolide B, (-)-loliolide, and methyl dihydrojasmonate. However, none of these compounds showed strong predicted binding affinities toward the targeted proteins. This may also suggest that their antibacterial mechanisms do not involve interactions with the specific proteins investigated in this study.
Overall, the in silico analysis indicates that the antibacterial activity of M. azedarach extracts is not solely related to the dominant compounds. Although several phytocompounds, such as isofucosterol and meliasenin derivatives, exhibited strong binding affinities to antibacterial target proteins, other compounds with relatively high abundance showed weaker interactions. This suggests that the antibacterial activity of both leaf and twig extracts is likely associated with synergistic or complementary effects among multiple compounds. In addition, the antibacterial activity may also be influenced by other unidentified compounds present in the extracts.
4. Conclusions
Both the twig and leaf extracts of Melia azedarach exhibited inhibitory effects against E. coli and B. subtilis, although their antibacterial profiles differed noticeably. The leaf extract showed stronger activity against B. subtilis, whereas the twig extract displayed comparable or slightly weaker effects against both bacterial strains. Among the tested solvents, methanol extracts from both organs demonstrated the highest antibacterial potency, particularly against E. coli K1-1, which correlated with their elevated levels of phenolic and flavonoid compounds.
Spectroscopic analyses reinforced these findings. Methanol and water extracts, especially those from the leaves, contained more hydroxyl-rich compounds linked to phenolics and flavonoids, while twig extracts were relatively enriched in hydrocarbon-based constituents. Limonoids typical of the Meliaceae family were identified in both plant parts but with varying relative abundances, suggesting distinct organ-specific metabolic profiles. Among these, meliasenins M, N, and O were predicted to possess the strongest binding affinities to antibacterial target proteins such as ACP reductase, TolC, AcrA, and AcrD. Additionally, isofucosterol, detected in the ethyl acetate leaf extract by GC-MS analysis, showed the highest predicted binding affinity to the AcrB protein.
From a practical standpoint, these results suggest that M. azedarach leaves represent a more potent antibacterial herbal source, whereas twigs offer a complementary reservoir of bioactive compounds with a unique phytochemical composition. Differentiating these two morphological parts is therefore warranted in pharmaceutical and phytochemical applications to optimize the utilization of M. azedarach’s bioactive potential.
Author Contributions
Conceptualization, investigation, methodology: I.B., Y.H.P., S.D., C.G., P.G. and W.D. Data curation, formal analysis: I.B., Y.H.P., S.D., I.R. and M.C.R. Visualization: I.B. and Y.H.P. Validation: I.B., Y.H.P. and I.R. Resources: I.B. Writing—original draft: I.B. and Y.H.P. Writing—review and editing: I.B., Y.H.P., S.D., C.G., P.G., A.I., H.K. and M.R. Funding: I.B. Project administration: I.B. and I.R. All authors have read and agreed to the published version of the manuscript.
Funding
This research was supported by Ministry of Education, Ministry of Education, Culture, Research and Technology (Kementerian Pendidikan, Kebudayaan, Riset, dan Teknologi) and Indonesia Endowment Fund for Education Agency (Lembaga Pengelola Dana Pendidikan) through Program Pendanaan PRPB No 007/E5/PG.02.00/PRPB batch 2/2024 and Scheme For Academic Mobility And Exchange (SAME) Nusantara 2024.
Institutional Review Board Statement
Not applicable.
Informed Consent Statement
Not applicable.
Data Availability Statement
Not applicable.
Acknowledgments
The authors thank to Nabila Hana Astari and Natasya Arsy Putri for preparing the extract.
Conflicts of Interest
The authors declare no conflicts of interest.
References
- Ikuta, K.S.; Swetschinski, L.R.; Aguilar, G.R.; Sharara, F.; Mestrovic, T.; Gray, A.P.; Weaver, N.D.; Wool, E.E.; Han, C.; Hayoon, A.G.; et al. Global mortality associated with 33 bacterial pathogens in 2019: A systematic analysis for the Global Burden of Disease Study 2019. Lancet 2022, 400, 2221–2248. [Google Scholar] [CrossRef]
- Callaway, E. These are the 20 most-studied bacteria—The majority have been ignored. Nature 2025, 637, 770–771. [Google Scholar] [CrossRef] [PubMed]
- World Health Organization. Global Antimicrobial Resistance and Use Surveillance System (GLASS) Report 2022; World Health Organization: Geneva, Switzerland, 2022; Available online: https://www.who.int/publications/i/item/9789240062702 (accessed on 25 February 2025).
- Ochoa, T.J.; Contreras, C.A. Enteropathogenic Escherichia coli infection in children. Curr. Opin. Infect. Dis. 2011, 24, 478–483. [Google Scholar] [CrossRef]
- Chen, S.; Feuille, C. Enteropathogenic Escherichia coli (EPEC) causes chronic diarrhea and hyponatremia in an adult. Clin. Case Rep. 2025, 13, e70288. [Google Scholar] [CrossRef]
- Song, F. Antimicrobial natural products. Antibiotics 2022, 11, 1765. [Google Scholar] [CrossRef]
- Stan, D.; Enciu, A.M.; Mateescu, A.L.; Ion, A.C.; Brezeanu, A.C.; Stan, D.; Tanase, C. Natural compounds with antimicrobial and antiviral effect and nanocarriers used for their transportation. Front. Pharmacol. 2021, 12, 723233. [Google Scholar] [CrossRef]
- Badan Pusat Statistik. Statistik Produksi Kehutanan 2019; Badan Pusat Statistik: Jakarta, Indonesia, 2020. [Google Scholar]
- Disha, N.S.; Karthikeyan, E. An eye-catching and comprehensive review of Melia azedarach Linn’s (Paradise Tree). Pharmacogn. Res. 2024, 16, 211–218. [Google Scholar] [CrossRef]
- Prayogo, Y.H.; Putra, R.I.; Hadiyanto, I.F.; Nihayah, E.; Syafii, W.; Sari, R.K.; Batubara, I. Anti-termite activity of Melia azedarach extracts. J. Sylva Lestari 2022, 10, 1–11. [Google Scholar] [CrossRef]
- Akacha, M.; Lahbib, K.; Remadi, M.D.; Boughanmi, N.G. Antibacterial, antifungal and anti-inflammatory activities of Melia azedarach ethanolic leaf extract. Bangladesh J. Pharmacol. 2016, 11, 666–674. [Google Scholar] [CrossRef]
- Hemdan, B.A.; Mostafa, A.; Elbatanony, M.M.; El-Feky, A.M.; Paunova-Krasteva, T.; Stoitsova, S.; El-Liethy, M.A.; El-Taweel, G.E.; Mraheil, M.A. Bioactive Azadirachta indica and Melia azedarach leaves extracts with anti-SARS-CoV-2 and antibacterial activities. PLoS ONE 2023, 18, e0282729. [Google Scholar] [CrossRef]
- Touzout, S.N.; Merghni, A.; Laouani, A.; Boukhibar, H.; Alenazy, R.; Alobaid, A.; Alenazy, M.; Ben-Attia, M.; Saguem, K.; El-Bok, S. Antibacterial properties of methanolic leaf extracts of Melia azedarach L. against Gram-positive and Gram-negative pathogenic bacteria. Microorganisms 2023, 11, 2062. [Google Scholar] [CrossRef] [PubMed]
- Khan, A.V.; Ahmed, Q.U.; Mir, M.R.; Shukla, I.; Khan, A.A. Antibacterial efficacy of the seed extracts of Melia azedarach against some hospital isolated human pathogenic bacterial strains. Asian Pac. J. Trop. Biomed. 2011, 1, 452–455. [Google Scholar] [CrossRef] [PubMed]
- Muhammad, T.M.; Lubna; Fayyaz, N.; Tauseef, S.; Razaq, U.; Versiani, M.A.; Ahmad, A.; Faizi, S.; Rasheed, M. Antibacterial activity of flower of Melia azedarach Linn. and identification of its metabolites. J. Korean Soc. Appl. Biol. Chem. 2015, 58, 219–227. [Google Scholar] [CrossRef]
- Zahoor, M.; Ahmed, M.; Naz, S.; Ayaz, M. Cytotoxic, antibacterial and antioxidant activities of extracts of the bark of Melia azedarach (China Berry). Nat. Prod. Res. 2015, 29, 1170–1172. [Google Scholar] [CrossRef] [PubMed]
- Akihisa, T.; Pan, X.; Nakamura, Y.; Kikuchi, T.; Takahashi, N.; Matsumoto, M.; Ogihara, E.; Fukatsu, M.; Koike, K.; Tokuda, H. Limonoids from the fruits of Melia azedarach and their cytotoxic activities. Phytochemistry 2013, 89, 59–70. [Google Scholar] [CrossRef]
- Zhang, S.N.; Huang, L.; Ma, R.J.; Yang, M.F.; Wei, B.F.; Song, H.Z.; Wang, H.S.; Tan, Q.G. Chemical constituents from the barks of Melia azedarach and their PTP1B inhibitory activity. Nat. Prod. Res. 2020, 35, 4442–4447. [Google Scholar] [CrossRef]
- Batubara, I.; Komariah, K.; Sandrawati, A.; Nurcholis, W. Genotype selection for phytochemical content and pharmacological activities in ethanol extracts of fifteen types of Orthosiphon aristatus (Blume) Miq. leaves using chemometric analysis. Sci. Rep. 2020, 10, 20945. [Google Scholar] [CrossRef]
- Eberhardt, J.; Santos-Martins, D.; Tillack, A.F.; Forli, S. AutoDock Vina 1.2.0: New docking methods, expanded force field, and Python bindings. J. Chem. Inf. Model. 2021, 61, 3891–3898. [Google Scholar] [CrossRef]
- Trott, O.; Olson, A.J. AutoDock Vina: Improving the speed and accuracy of docking with a new scoring function, efficient optimization, and multithreading. J. Comput. Chem. 2010, 31, 455–461. [Google Scholar] [CrossRef]
- Haydon, D.J.; Stokes, N.R.; Ure, R.; Galbraith, G.; Bennett, J.M.; Brown, D.R.; Baker, P.J.; Barynin, V.V.; Rice, D.W.; Sedelnikova, S.E.; et al. An inhibitor of FtsZ with potent and selective anti-staphylococcal activity. Science 2008, 321, 1673–1675. [Google Scholar] [CrossRef]
- Higgins, M.K.; Eswaran, J.; Edwards, P.; Schertler, G.F.X.; Hughes, C.; Koronakis, V. Structure of the ligand-blocked periplasmic entrance of the bacterial multidrug efflux protein TolC. J. Mol. Biol. 2004, 342, 697–702. [Google Scholar] [CrossRef] [PubMed]
- Sjuts, H.; Vargiu, A.V.; Kwasny, S.M.; Nguyen, S.T.; Kim, H.S.; Ding, X.; Ornik, A.R.; Ruggerone, P.; Bowlin, T.L.; Nikaido, H.; et al. Molecular basis for inhibition of AcrB multidrug efflux pump by novel and powerful pyranopyridine derivatives. Proc. Natl. Acad. Sci. USA 2016, 113, 3509–3514. [Google Scholar] [CrossRef] [PubMed]
- Zhang, Z.; Morgan, C.E.; Cui, M.; Yu, E.W. Cryo-EM structures of AcrD illuminate a mechanism for capturing aminoglycosides from its central cavity. mBio 2023, 14, e03383-22. [Google Scholar] [CrossRef]
- Mikolosko, J.; Bobyk, K.; Zgurskaya, H.I.; Ghosh, P. Conformational flexibility in the multidrug efflux system protein AcrA. Structure 2006, 14, 577–587. [Google Scholar] [CrossRef]
- Wu, S.B.; Su, J.J.; Sun, L.H.; Wang, W.X.; Zhao, Y.; Li, H.; Zhang, S.P.; Dai, G.H.; Wang, C.G.; Hu, J.F. Triterpenoids and steroids from the fruits of Melia toosendan and their cytotoxic effects on two human cancer cell lines. J. Nat. Prod. 2010, 73, 1898–1906. [Google Scholar] [CrossRef]
- Faizi, S.; Wasi, A.; Siddiqui, B.S.; Naz, A. New terpenoids from the roots of Melia azedarach. Aust. J. Chem. 2002, 55, 291–296. [Google Scholar] [CrossRef]
- Dias, M.C.; Pinto, D.C.G.A.; Costa, M.; Araújo, M.; Santos, C.; Silva, A.M.S. Phytochemical and antioxidant profile of the medicinal plant Melia azedarach subjected to water deficit conditions. Int. J. Mol. Sci. 2022, 23, 13611. [Google Scholar] [CrossRef]
- D’Ambrosio, M.; Guerriero, A. Degraded limonoids from Melia azedarach and biogenetic implications. Phytochemistry 2002, 60, 419–424. [Google Scholar] [CrossRef]
- Inada, A.; Kobayashi, M.; Nakanishi, T. Phytochemical studies on meliaceous plants. III. Structures of two new pregnane steroids, toosendansterols A and B, from leaves of Melia toosendan Sieb. et Zucc. Chem. Pharm. Bull. 1988, 36, 609–612. [Google Scholar] [CrossRef]
- Zhou, H.; Hamazaki, A.; Fontana, J.D.; Takahashi, H.; Wandscheer, C.B.; Fukuyama, Y. Cytotoxic limonoids from Brazilian Melia azedarach. Chem. Pharm. Bull. 2005, 53, 1362–1365. [Google Scholar] [CrossRef] [PubMed]
- Belete, T.M. Novel targets to develop new antibacterial agents and novel alternatives to antibacterial agents. Hum. Microbiome J. 2019, 11, 100052. [Google Scholar] [CrossRef]
- Nolivos, S.; Cayron, J.; Dedieu, A.; Page, A.; Delolme, F.; Lesterlin, C. Role of AcrAB-TolC multidrug efflux pump in drug-resistance acquisition by plasmid transfer. Science 2019, 364, 778–782. [Google Scholar] [CrossRef] [PubMed]
- Pletzer, D.; Weingart, H. Characterization of AcrD, a resistance-nodulation-cell division-type multidrug efflux pump from the fire blight pathogen Erwinia amylovora. BMC Microbiol. 2014, 14, 13. [Google Scholar] [CrossRef] [PubMed]
- da Silva, F.E.F.; Ávila, F.N.; Pereira, N.M.O.; de Freitas, M.D.; Pessoa, O.D.L.; da Fonseca, A.M.; da Costa, J.G.M.; Santiago, G.M.P. Semisynthesis, in silico study and in vitro antibacterial evaluation of fucosterol derivatives. Steroids 2023, 189, 109137. [Google Scholar] [CrossRef] [PubMed]
- Veni, A.; Lokeswari, T.S.; Krishna Kumari, G.N.; Gayathri, D.; Sudandiradoss, C. Bioactivity of melianone against Salmonella and in silico prediction of a membrane protein target. 3 Biotech 2020, 10, 460. [Google Scholar] [CrossRef]


Disclaimer/Publisher’s Note: The statements, opinions and data contained in all publications are solely those of the individual author(s) and contributor(s) and not of MDPI and/or the editor(s). MDPI and/or the editor(s) disclaim responsibility for any injury to people or property resulting from any ideas, methods, instructions or products referred to in the content. |
© 2025 by the authors. Licensee MDPI, Basel, Switzerland. This article is an open access article distributed under the terms and conditions of the Creative Commons Attribution (CC BY) license (https://creativecommons.org/licenses/by/4.0/).