1. Introduction
The integration of distributed energy resources (DERs) into modern power networks is reshaping the operation and planning of electrical systems. Renewable technologies such as photovoltaic (PV) and wind generation significantly reduce fossil fuel dependence and greenhouse-gas (GHG) emissions. However, their intermittent and variable nature causes voltage deviations, higher technical losses, and reduced system stability, challenges that are especially relevant in distribution networks strongly affected by local demand and generation patterns. Recent studies introduce distributed control strategies for BESS, which are shown to effectively regulate voltage in distribution networks with high PV penetration, minimizing instability caused by renewable variability [
1]. In this context, microgrids (MGs) have emerged as a versatile and reliable solution for managing local generation, storage, and loads. Their capability to operate in both grid-connected mode (GCM) and islanded mode (IM) enables flexible operational strategies depending on main grid availability and the local balance between supply and demand. Unified dispatch strategies enable seamless transition between grid-connected and islanded microgrid operation, improving reliability and operational flexibility in complex power networks [
2].
Battery energy storage systems (BESS) are fundamental to enhancing both the technical and environmental performance of MGs. When optimally scheduled, these systems can reduce active power losses, support voltage regulation, and decrease reliance on high-emission generation units. Several optimization strategies have been developed using master–slave architectures, where a metaheuristic optimizer computes the control setpoints and a power flow model verifies technical feasibility. Parallel implementations have shown faster convergence and improved scalability for real-time energy management in microgrids [
3,
4]. For example, one study proposed a Gray Wolf Optimizer (GWO) combined with Successive Approximations (SA) to manage wind generation, BESS, and D-STATCOM units, achieving notable cost reductions and improved voltage regulation in a 33-node MG under both GCM and IM [
5]. Another work developed a parallel implementation of the Multi-Verse Optimizer (MVO) integrated with SA, aiming to minimize energy losses and
emissions, and reported significant performance improvements over other metaheuristics in both operational scenarios [
6].
Recent work demonstrates that coordinated control strategies can enhance the multifunctional performance of BESS. Advanced control architectures achieve simultaneous frequency regulation, voltage stabilization, and power loss reduction, improving power quality in large-scale networks [
7]. Hybrid energy management systems (EMS) combining rule-based logic with optimization modules reduce operational costs by over 20% and
emissions by up to 30%, while dynamically managing reactive power through BESS and PV inverters [
8]. This capability aligns with broader energy transition goals, where inverter-based resources (IBRs) are expected to replace conventional synchronous machines as the leading providers of reactive power in future grids [
9]. New research in AI-driven control strategies also complements the development of optimization-based scheduling. For example, Akarne et al. [
10] proposed a robust PI controller tuned with the sparrow search algorithm for photovoltaic integration in smart microgrids, achieving improved dynamic stability and power quality. Such contributions highlight the increasing role of bio-inspired and AI-based approaches
Beyond operational control, the role of BESS in low-carbon network planning is also gaining prominence. Integrated models that combine carbon emission flow (CEF) analysis with robust optimization under uncertainty have proven effective in enhancing the spatial and temporal distribution of carbon emissions while improving system economics [
11]. Moreover, the coordinated use of BESS for network reconfiguration and reactive power compensation, when coupled with optimization algorithms such as Kruskal-based topology reconfiguration and Simulated Annealing, has shown significant potential to minimize active power losses while respecting operational switching constraints [
12].
Technical advances in converter control are also expanding the operational envelope of BESS. For example, strategies that decouple battery packs from the power conversion system to boost DC-link voltage have been shown to triple the reactive power capability of BESS-STATCOM units at low state-of-charge levels, without additional hardware [
13]. Hierarchical model predictive control strategies have been successfully applied to both grid-connected and islanded microgrids, efficiently coordinating multiple distributed resources for improved resilience and operational flexibility [
14]. Similarly, current-constrained active and reactive power scheduling methods for PV–BESS inverters have demonstrated notable improvements in reducing inverter losses, extending lifetime, and mitigating voltage-dependent underperformance in real-world conditions [
15].
Research has also focused on the economic optimization of MG operation. A comparative analysis of four metaheuristics for managing wind-based distributed generators identified the population-based genetic algorithm (PGA) as the most cost-effective and stable option under realistic variability conditions [
16]. In another approach, PV and D-STATCOM units were optimally integrated using a discrete–continuous variant of MVO with a matrix power flow method, producing superior results compared to alternative master–slave strategies in both 33- and 69-node systems [
17]. Further studies have applied the Generalized Normal Distribution Optimizer (GNDO) for BESS scheduling, targeting the simultaneous optimization of technical, economic, and environmental metrics, and benchmarking against other well-established algorithms to confirm its robustness [
18]. Additionally, the integration of lithium-ion batteries with varying technical characteristics has been addressed using a hybrid PDVSA–PSO strategy, achieving measurable reductions in both energy losses and emissions [
19]. Another important issue is cybersecurity. Recent studies, such as [
20], have highlighted the vulnerability of microgrids to cyberattacks and the necessity for optimization frameworks that simultaneously address operational efficiency and resilience. However, the integration of safety constraints in adversarial scenarios has not been thoroughly explored.
Despite the variety of methodologies proposed, gaps remain in the literature. First, many studies focus on a single objective function (often cost minimization) without isolating and independently evaluating technical and environmental indicators such as losses and emissions. Second, the robustness of optimization algorithms under variable demand and generation conditions in both GCM and IM has been less frequently explored, particularly with large-scale statistical validation. Finally, while several metaheuristics have been tested in MG optimization, comparative assessments of parallelized implementations remain limited, even though parallelization can significantly improve computational performance for real-time applications.
Motivated by these gaps, this study investigates optimal BESS scheduling in a 33-node AC microgrid modeled with real load and PV generation data from Medellín, Colombia. Two independent objectives are analyzed: (i) minimization of technical energy losses and (ii) minimization of emissions. Three parallel metaheuristic optimizers, PPSO, PCSA, and PJAYA, are implemented and compared. Each method is tested in both GCM and IM, with 100 independent runs per scenario to assess solution quality, repeatability, and computational efficiency under realistic variability in load and PV generation.
Unlike previous studies that often focus on a single objective or employ serial implementations of optimization algorithms, this work explores a parallelized framework that enhances convergence speed and robustness, which is essential for real-time microgrid scheduling. The novelty also resides in combining this methodological approach with real-world operational data from Medellín, Colombia, enabling an assessment that reflects both technical and environmental realities of a specific urban microgrid. This dual contribution—methodological advancement and contextual application—distinguishes the present study from prior work.
The main contributions of this study are:
Development of an optimization framework for BESS scheduling in AC microgrids under both GCM and IM, with independent objectives for loss and emission minimization.
Systematic comparison of three parallel metaheuristic algorithms, assessing best, average, and variability metrics, as well as computational performance.
Incorporation of realistic demand and PV generation profiles, enabling a more practical evaluation of algorithm performance.
Comprehensive statistical analysis to validate robustness and consistency across multiple independent simulations.
By combining mode-specific operational constraints, real-world data, and parallelized metaheuristic optimization, this work provides a balanced technical and environmental evaluation of BESS scheduling strategies. The findings offer practical guidance for selecting optimization methods in microgrid applications, supporting both operational efficiency and emissions reduction.
2. Mathematical Formulation
This section presents the mathematical model used to determine the optimal hourly operation of battery energy storage systems (BESS) in an AC microgrid over a 24-h horizon. Two independent optimization problems are formulated: one minimizes total network energy losses, and the other minimizes emissions from dispatchable generation units. Both formulations include the complete set of operational and physical constraints to ensure technical feasibility and compliance with system limits.
The first objective minimizes resistive power losses in the distribution lines, which depend on the current magnitude
flowing through the
L branches at each time step
. Line resistances are represented by the diagonal matrix
, where each diagonal entry corresponds to the ohmic resistance of a branch. The total losses across the entire scheduling horizon are calculated as:
In this expression,
h is the interval duration and
represents the vector of decision variables, including active and reactive power dispatch, voltages
, phase angles
, and BESS power flows. The quadratic form in (
1) reflects how energy loss increases with the square of the current, which is physically consistent with Joule’s law.
The second objective minimizes the total emissions over the 24-h horizon. Emissions originate from conventional generators (CG) and diesel-based distributed generators (DG), represented by active power vectors and , respectively. Each generator type is characterized by an emission coefficient vector or in . The solar availability factor for each DG unit is captured by , which modulates their effective generation capacity at each time step. The objective function for emissions minimization is:
The Hadamard product (∘) represents element-wise multiplication. This formulation allows the emissions from CG and DG units to be separately evaluated, accounting for both dispatch levels and availability constraints.
Both optimization problems share identical network and equipment constraints. Power balance is enforced at each node
i for both active and reactive components, as expressed below:
Here, and represent the active power produced by CG and PV generators at node i, is the power injected (positive) or absorbed (negative) by the BESS, and is the local load demand. The right-hand side models the active power injected into the network using voltage magnitudes , the real part of the admittance matrix , and the angle difference between nodes with being the admittance phase angle.
The corresponding reactive power balance is expressed by:
In this equation, is the reactive power from CG units, is the reactive demand, and is the reactive exchange from the BESS. This term is bounded by the converter’s capacity and allows for power factor correction.
Conventional generator outputs are constrained to operate within minimum and maximum limits for both active and reactive power:
Under islanded operation, the diesel generator at the slack bus acts as the main energy supplier, constrained between 40% and 80% of its nominal capacity:
PV generation is bounded by availability and device rating, expressed as:
where
reflects the hourly solar irradiance profile in per-unit terms.
The BESS is modeled with power limits for both charging and discharging, given by:
These limits are computed from the battery energy capacity
and predefined charge/discharge times
and
:
To prevent inverter overload, the reactive power is limited by the converter’s apparent-power rating
:
The battery’s state of charge (SoC) evolves according to the power exchanged and the battery’s energy rating
:
Initial and final SoC levels are fixed to maintain operational consistency and extend battery lifespan:
To maintain power quality and protect the infrastructure, node voltages must stay within prescribed limits:
In addition, line currents must not exceed their thermal ratings:
This mathematical formulation supports two distinct optimization problems: one focused on technical efficiency through loss minimization, and the other on environmental sustainability through emission reduction. Both share the same physical and operational constraints.
3. Optimization Framework
This section formulates the optimal active P and reactive Q dispatch of BESS in a 33-bus AC microgrid. Two objectives are solved independently: minimization of technical energy losses and minimization of emissions, each under grid-connected (GCM) and islanded (IM) operation.
To address this problem, three metaheuristic algorithms were implemented in parallel form: Parallel Particle Swarm Optimization (PPSO), Parallel Crow Search Algorithm (PCSA), and Parallel JAYA (PJAYA). In all cases, the optimization process is coupled with an AC power flow solver based on the Successive Approximations (SA) method. This master–slave architecture allows the master stage (the optimizer) to generate candidate operating schedules, while the slave stage (the SA solver) evaluates their technical feasibility and computes the value of the objective function.
3.1. Representation of Decision Variables
Each candidate encodes a 24-h profile per BESS with hourly
P and
Q setpoints subject to inverter and SoC limits. By convention,
indicates charging and
discharging. For reactive power,
denotes injection and
absorption. The apparent-power constraint is enforced as
Table 1 illustrates the encoding scheme adopted for representing the 24-h operating profile of a battery energy storage system (BESS) within the optimization process. The schedule is divided into two sections: the first block corresponds to the active power (
P) profile, where positive values indicate discharging periods and negative values represent charging periods. The second block corresponds to the reactive power (
Q) profile, in which positive entries denote reactive power injection and negative entries indicate absorption, depending on the voltage support requirements of the microgrid.
This encoding approach allows the optimization algorithm to simultaneously determine both energy management and voltage regulation actions for each BESS unit.
3.2. Evaluation of Candidate Solutions
For each proposed schedule, the SA power flow algorithm evaluates the network operation hour by hour:
- 1.
Input preparation: Active and reactive load demands, PV generation outputs, and BESS charging/discharging setpoints for each hour are assembled.
- 2.
Power flow solution: The SA method iteratively solves the AC nodal power balance equations until convergence is achieved for voltage magnitudes and phase angles.
- 3.
Constraint verification: The resulting voltages, line currents, and generator outputs are checked against operational limits:
Bus voltages within of nominal.
Current limits on all distribution lines.
SoC remaining between 10% and 90%.
Diesel generator output within 40–80% of nominal in IM.
- 4.
Objective function computation: The selected objective is evaluated using the SA results: total resistive losses per Equation (
1) or total emissions per Equation (
2), aggregated over 24 h.
- 5.
Penalty assignment: Violations of voltage, current, generator, or SoC limits incur additive penalties proportional to the excess (in per-unit or nameplate units), discouraging infeasible schedules.
3.3. Parallel Metaheuristic Optimization
The optimization stage runs in parallel to accelerate convergence and increase throughput:
PPSO: In the parallel particle swarm optimization framework, each particle encodes a complete 24-h charging and discharging schedule for all BESS units. The position and velocity of each particle are iteratively updated by combining its own best-known position (personal best) with the swarm’s overall best solution (global best), enabling a balance between exploration of new schedules and refinement of promising ones. The parallel implementation allows the fitness of multiple particles to be evaluated simultaneously, significantly accelerating the search process.
PCSA: In the parallel crow search algorithm, each agent (crow) represents a candidate BESS operation profile. Agents navigate the search space by following the memorized best positions of other crows, while the awareness probability controls the likelihood of exploring new regions instead of blindly following. The flight length parameter determines the step size towards a target solution. By parallelizing the evaluation stage, many candidate profiles can be assessed at once, eliminating serial computational bottlenecks and improving convergence speed.
PJAYA: The Parallel JAYA algorithm generates new candidate solutions by moving each one towards the best-performing solution found so far, while simultaneously moving away from the worst-performing one. This update rule is parameter-free, simplifying calibration and avoiding dependency on algorithm-specific tuning. The parallel execution of the evaluation stage enables simultaneous assessment of numerous candidates, reducing the total runtime while maintaining solution quality.
The three optimization approaches differ mainly in their exploration–exploitation balance and computational characteristics. PPSO relies on collective swarm intelligence, where particles share information to converge steadily towards high-quality schedules. PCSA emphasizes adaptive exploration, with agents dynamically deciding whether to exploit known good regions or investigate unexplored areas, which can help avoid premature convergence. PJAYA offers a parameter-free update mechanism, focusing on consistent improvement by leveraging the best and worst solutions in each generation. When implemented in parallel, all three algorithms benefit from substantial reductions in computational time, but their intrinsic search dynamics lead to distinct convergence behaviors and sensitivities to problem complexity.
Prior to conducting the comparative analysis, each optimization method underwent a dedicated calibration phase to identify the most effective parameter configurations. This process involved adjusting key settings such as population size, maximum number of iterations, and, when applicable, algorithm-specific coefficients. By tuning each algorithm independently under the same test conditions, a fair performance comparison was ensured while allowing every method to operate at its highest potential.
The calibration was performed using a PSO-based tuning approach configured with a swarm of eight particles and a limit of 300 generations. The inertia weight decreased linearly from 1.0 to 0.0 across iterations, while both the cognitive and social acceleration coefficients were set to 1.494. This arrangement was selected to provide a balanced trade-off between broad exploration of the search space and focused exploitation around promising regions.
The resulting optimal parameter values for PPSO, PCSA, and PJAYA are reported in
Table 2.
3.4. Stopping Criteria and Output
The optimization process terminates when either the maximum number of iterations is reached or no significant improvement in the global best solution is observed over a fixed number of generations. The final output is the BESS schedule that yields the lowest value of the selected objective function while meeting all technical constraints. Since the objectives are optimized independently, two distinct schedules are obtained: one for minimum losses and another for minimum emissions.
This framework leverages the exploration–exploitation capabilities of three different metaheuristics, the constraint-handling ability of the SA solver, and the computational advantages of parallel execution. As a result, it provides a robust tool for evaluating advanced scheduling strategies for AC microgrids under diverse operational modes and performance objectives.
The choice of PPSO, PCSA, and PJAYA was motivated by their complementary search strategies and proven effectiveness in power system optimization. PPSO exemplifies swarm-based learning with adaptive balance between exploration and exploitation, PCSA offers bio-inspired adaptive exploration through memory-based behavior, and PJAYA introduces a parameter-free mechanism that avoids dependence on tuning. These methods provide a representative spectrum of metaheuristic designs, ensuring a fair comparative analysis while maintaining computational tractability. Although hybrid strategies may further enhance performance, the present work prioritizes transparency and reproducibility by benchmarking well-established standalone approaches.
4. Test System and Considerations
To evaluate the performance of the proposed optimization methodology, this work adopts a modified version of the well-known 33-bus AC microgrid (MG) [
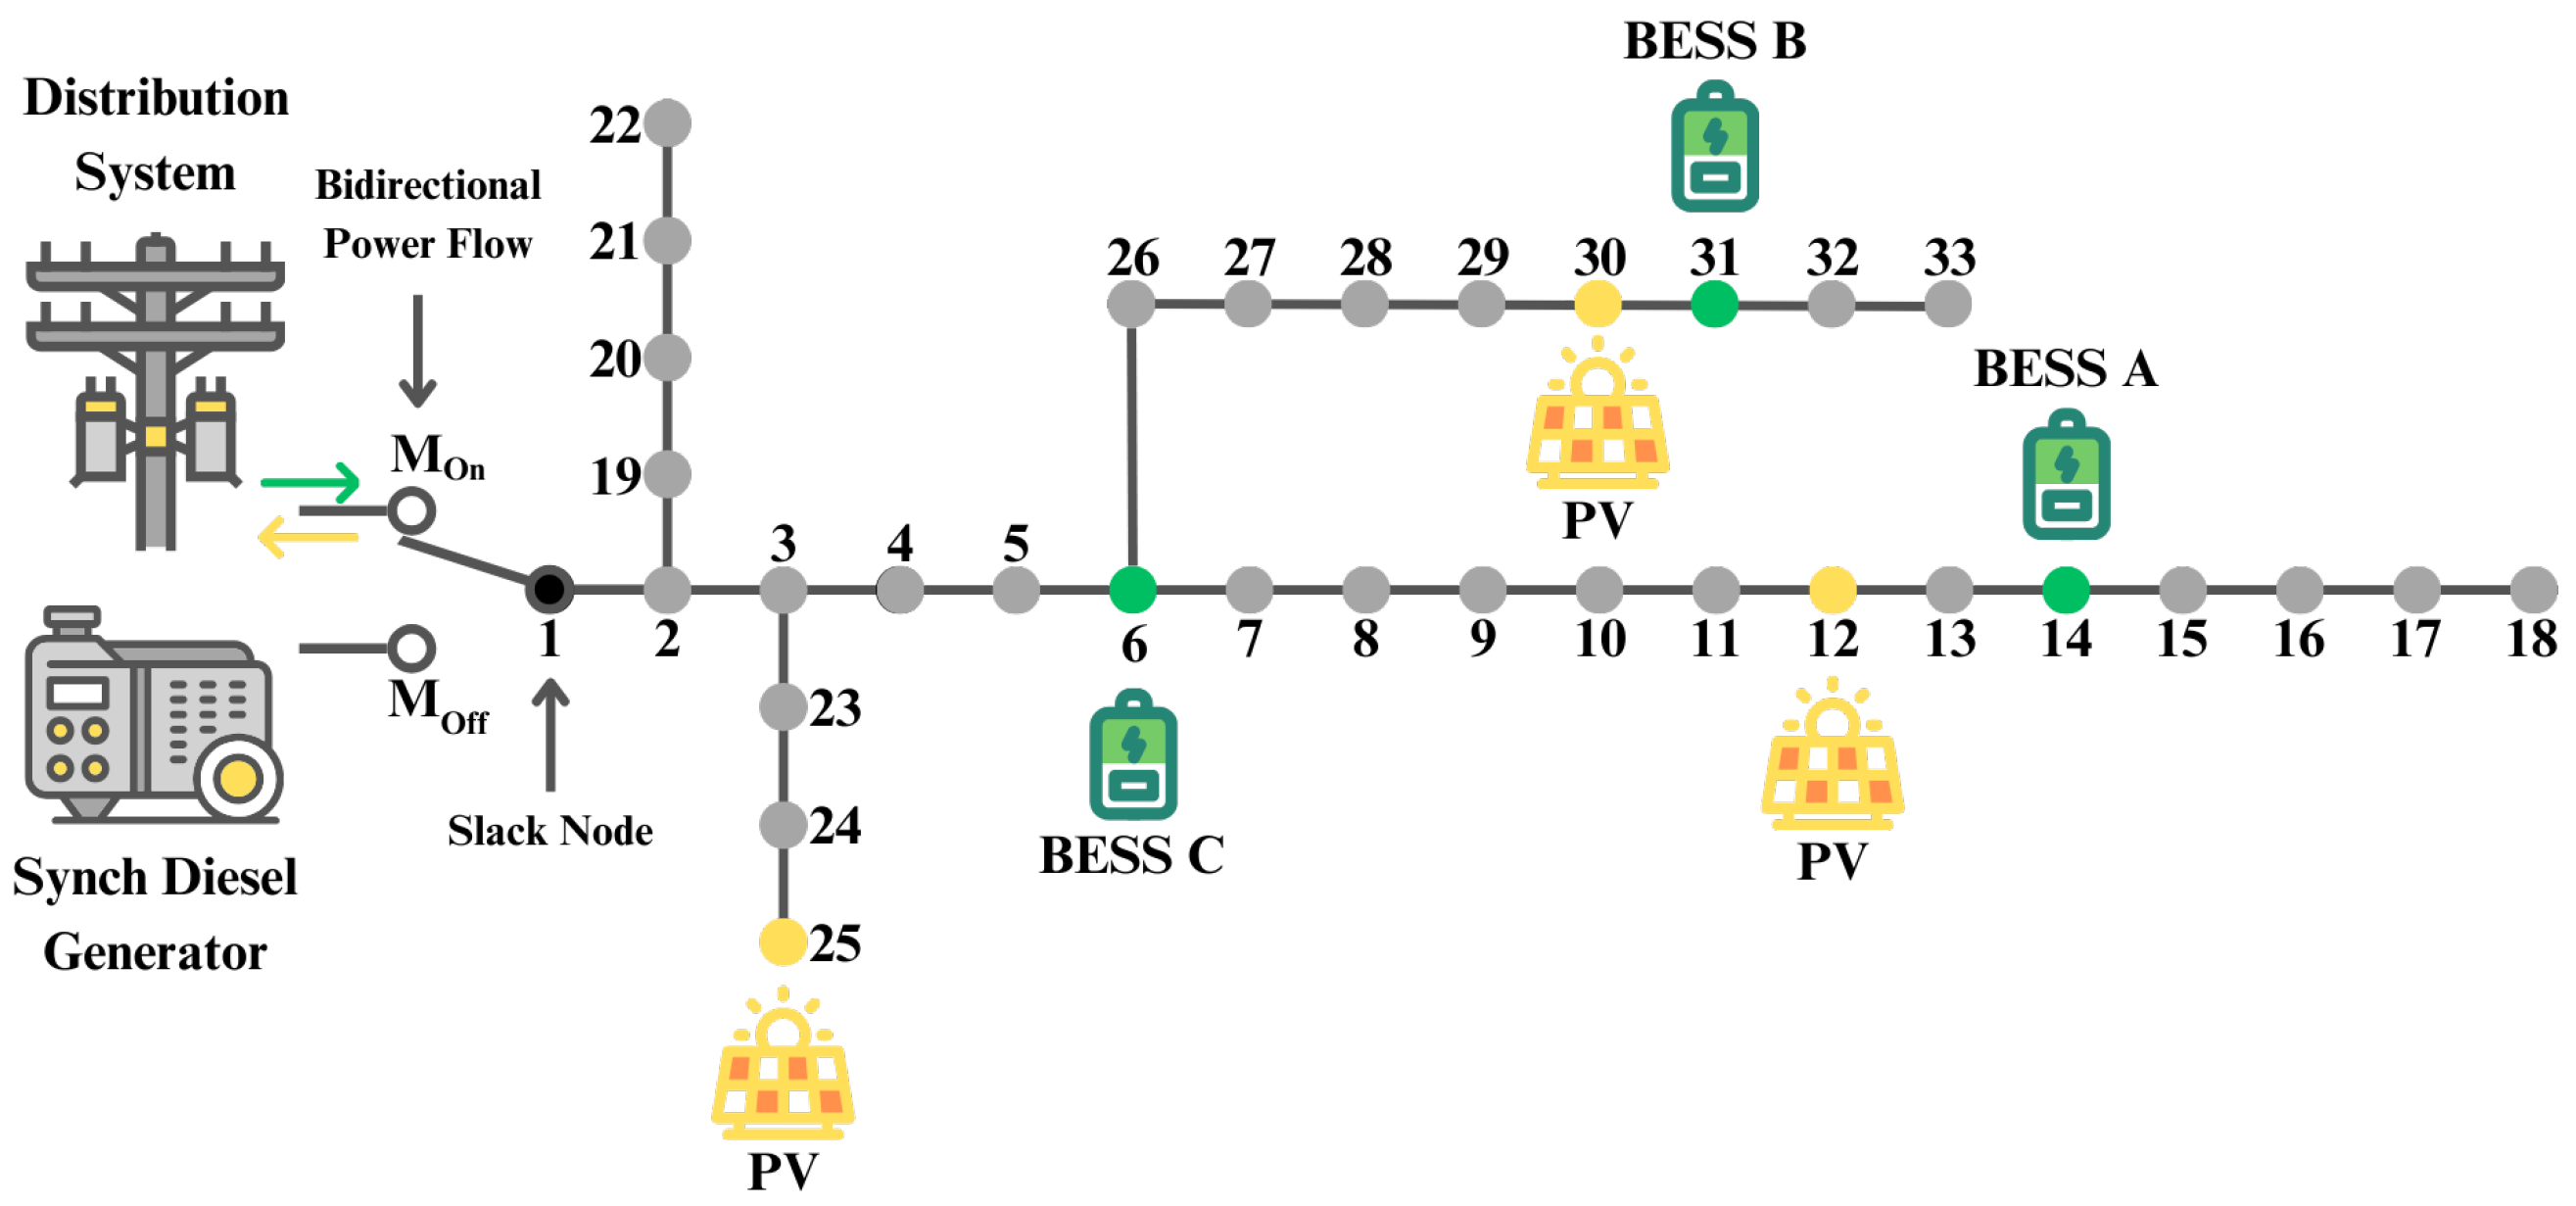
21]. The MG is tailored to represent the typical operational conditions encountered in the city of Medellín, Colombia, including its daily load patterns and solar availability. The system operates at a nominal voltage of 12.66 kV and uses a base apparent power of 100 kVA for per-unit normalization. It consists of 33 nodes interconnected by 32 distribution lines, forming a radial topology suitable for the simulation of low-voltage urban microgrids. The schematic layout of the system is presented in
Figure 1.
Within this configuration, node 1 is designated as the slack bus and serves a dual role depending on the operating mode. In the GCM, it represents the point of common coupling (PCC) to the utility grid, whereas in the IM, it is supplied by a dedicated diesel generator. This generator is rated at 4000 kW and is operated within a restricted loading range between 40% and 80% of its nominal capacity (between 1600 kW and 3200 kW) to ensure stable performance and prolong equipment life, in accordance with manufacturer recommendations [
5].
The microgrid model incorporates time-varying profiles for both power consumption and renewable energy generation. These were sourced from real-world datasets, with demand data provided by Empresas Públicas de Medellín (EPM) [
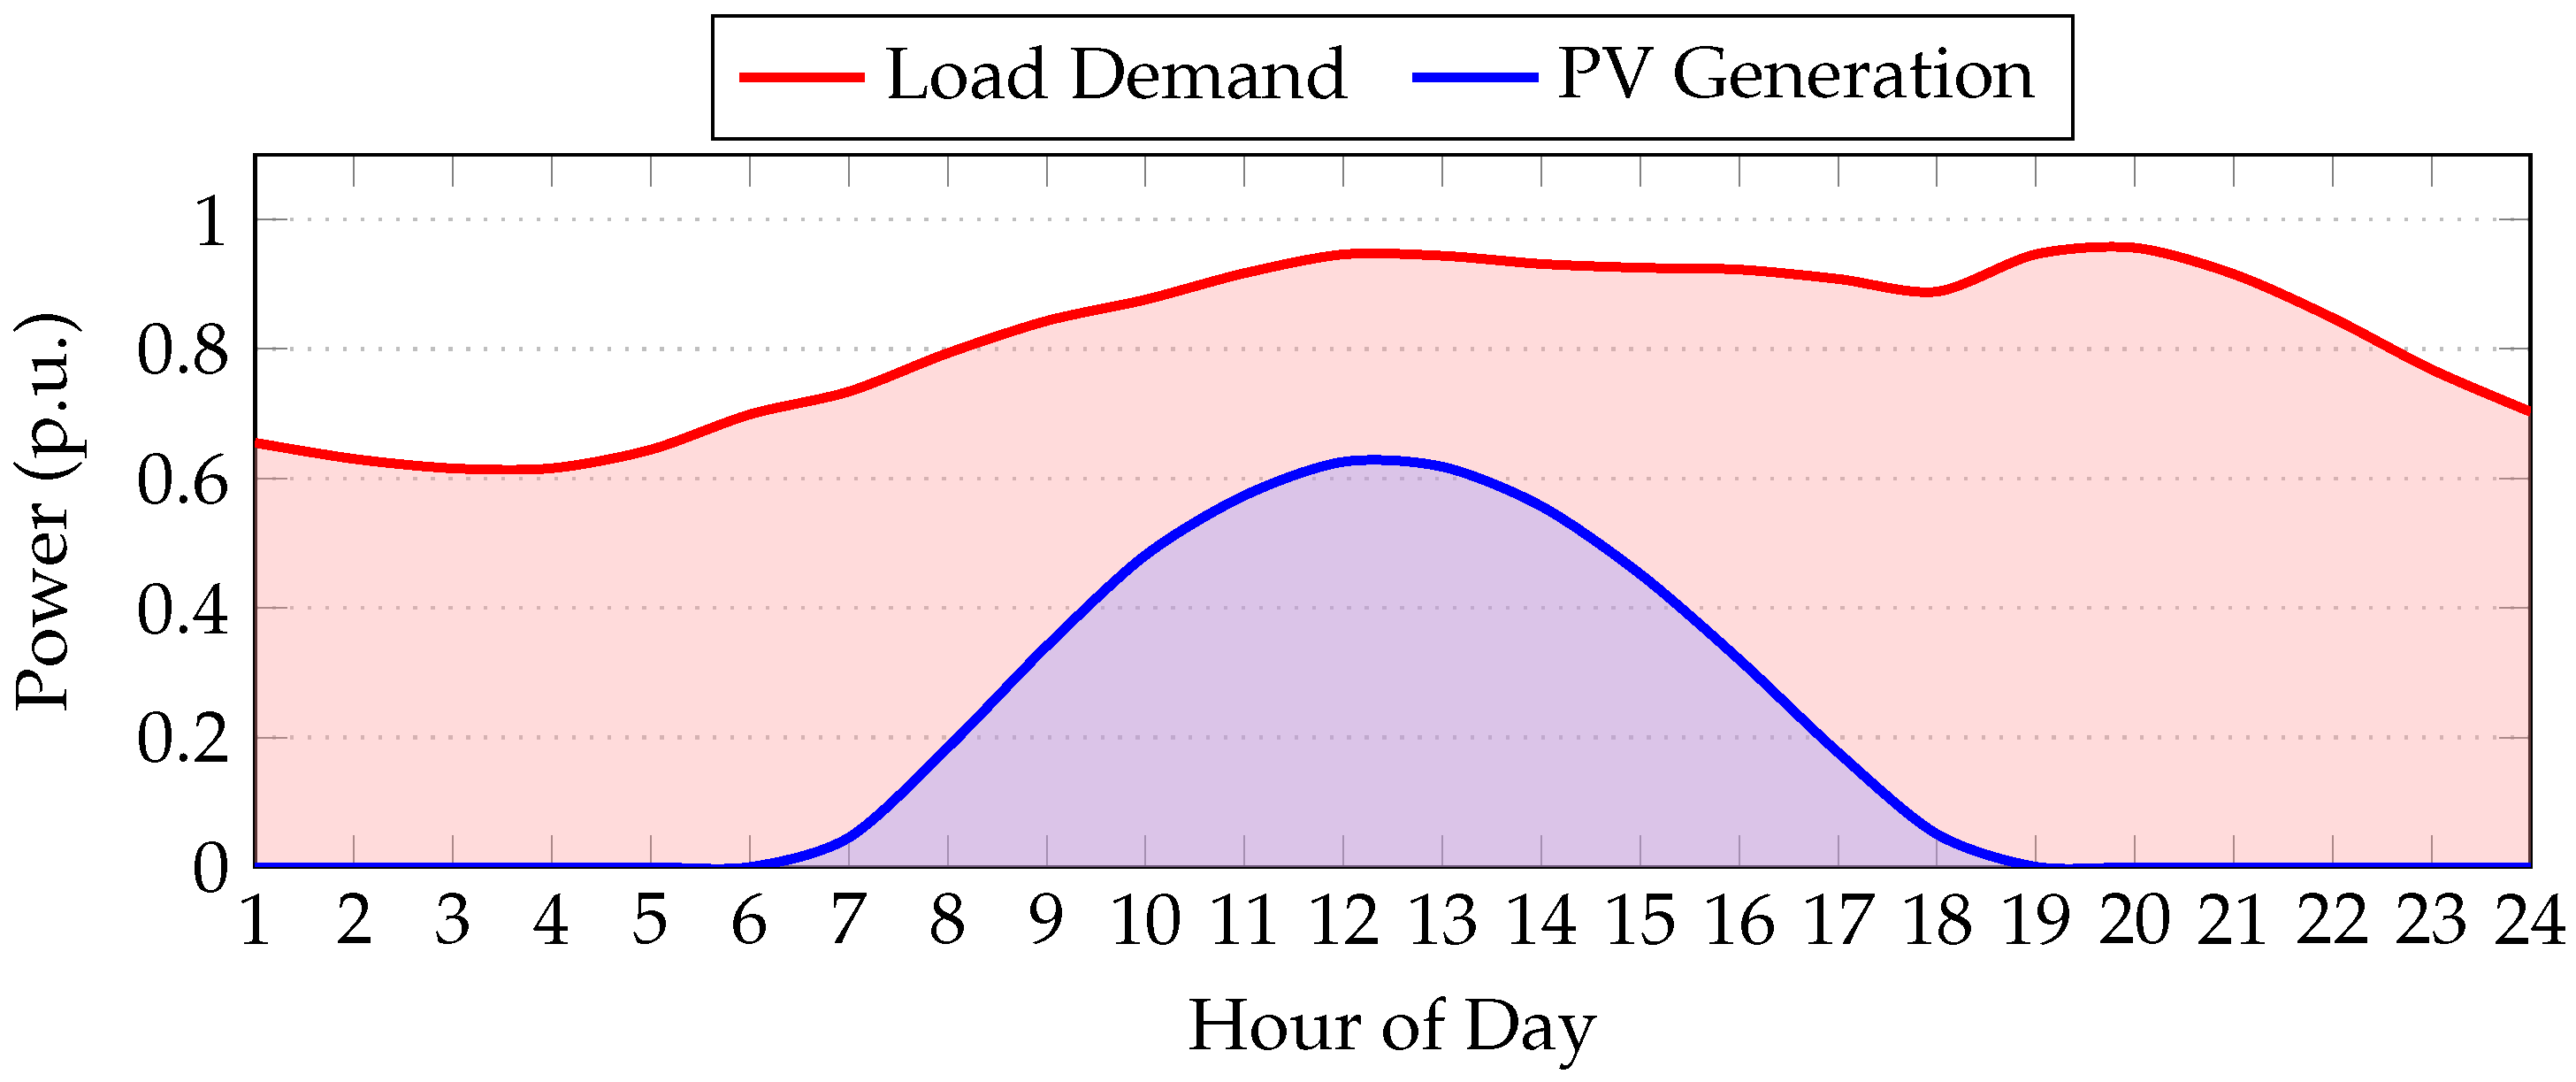
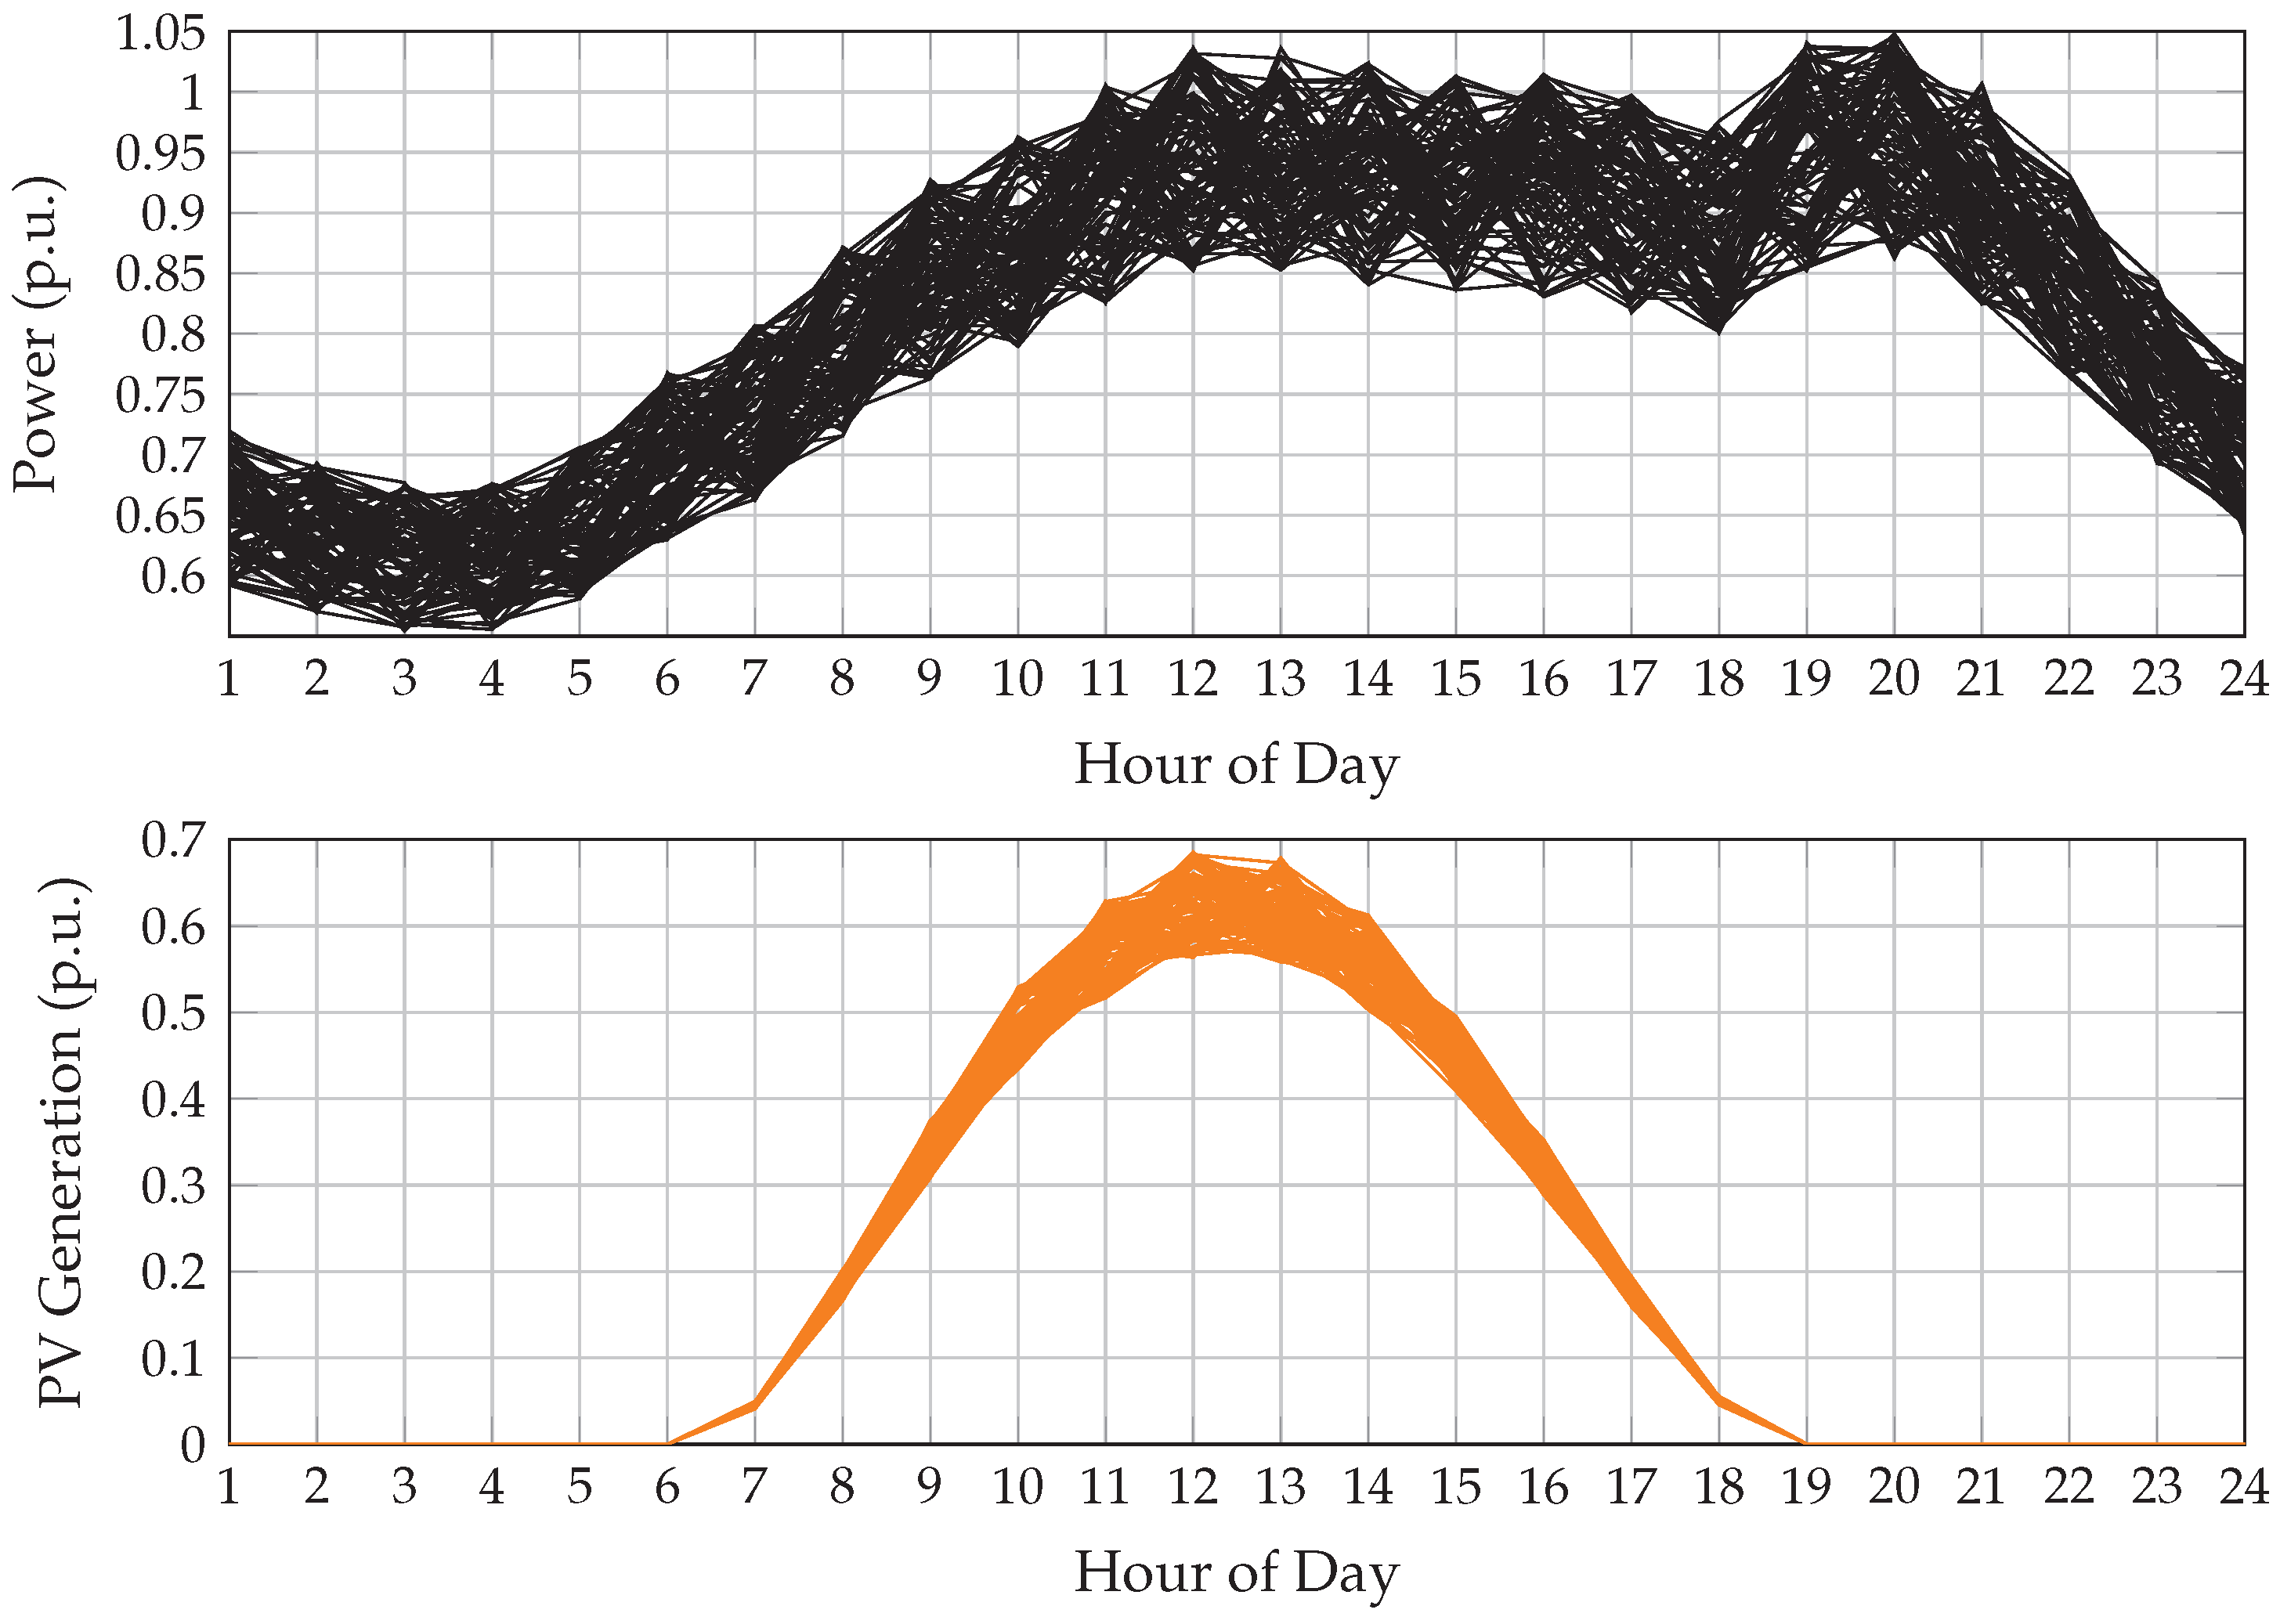
22] and solar irradiance information obtained from NASA’s climate database. The corresponding normalized hourly profiles for electricity demand and PV generation are plotted in
Figure 2. These curves reflect typical diurnal fluctuations encountered in the region, with peak demand occurring during evening hours and solar availability peaking around midday.
PV units at nodes 12, 25, and 30 are rated 1125 kW, 1320 kW, and 999 kW, respectively, and operate under Maximum Power Point Tracking (MPPT).
Energy storage is provided by three lithium-ion BESS installations, located at buses 6, 14, and 31. These systems are differentiated by capacity and cycle duration: Type A delivers 1000 kW of active power; Type B stores 1500 kWh with a 4-h charge/discharge window; and Type C provides 2000 kWh with a 5-h cycle. To protect battery integrity and ensure predictable operation, each unit maintains its state-of-charge (SoC) between 10% and 90%, with both the initial and final SoC fixed at 50%, consistent with IEEE recommendations [
23].
The electrical characteristics of the system, including line parameters (resistance, reactance), nodal power demands (active and reactive), and current ratings, are documented in [
6] to enable reproducibility of results. To comply with regulatory standards for voltage stability in Colombia, the system maintains voltage magnitudes within a
window around the nominal level, as stipulated by the NTC 1340 code [
24].
Environmental considerations differ between modes. In GCM, emissions are calculated using a grid emission factor of 0.1644 kg /kWh, whereas IM relies solely on diesel generation, yielding a higher factor of 0.2671 kg /kWh.
All simulations are carried out over a single representative day. This choice enables a fair comparison between the two operating scenarios by maintaining identical system topology and input data. Therefore, any variation in performance metrics such as energy losses and emissions can be directly attributed to changes in the control strategy or operating mode, rather than to structural differences.
Lastly, a sensitivity analysis was conducted to explore how fluctuations in demand and solar generation impact the results. This assessment quantifies the effect of temporal uncertainty on the objective function, providing insight into the robustness of the optimization algorithm under realistic daily variability.
5. Results of the Simulations
This section details the outcomes of applying the proposed optimization framework to a 33-bus AC microgrid, with a focus on evaluating the performance of BESS scheduling under two different operational paradigms: grid-connected GCM and IM. The simulations aim to quantify the benefits of the strategy in terms of technical indicators such as energy losses and carbon emissions. All computational experiments were carried out in MATLAB R2024a, running on a high-specification workstation featuring an Intel® CoreTM i9-14900HX CPU (24 cores, 32 threads at up to 5.8 GHz), an NVIDIA® GeForce RTXTM 4090 GPU, and 32 GB of DDR5-5600 RAM under a 64-bit Windows 11 system.
Two distinct simulation settings were explored to rigorously assess the methodology. First, a comparative evaluation of three metaheuristic optimization techniques was conducted to benchmark their effectiveness in controlling BESS dispatch. Second, a sensitivity analysis was performed to capture the impact of realistic variations in both power demand and solar irradiance. This dual approach provides insight into the solution quality, computational consistency, and adaptability of each optimization strategy under dynamic operating conditions.
It is worth noting that conventional PSO and JAYA have been extensively benchmarked in the literature for microgrid scheduling [
16], while GA [
25], MILP [
26], and ANN-based strategies [
27] have also shown promising results in related contexts. MILP guarantees optimality under linearized assumptions but suffers from exponential computational growth for large-scale AC formulations. GA and ANN methods can achieve competitive performance but are often limited by slow convergence or lack of generalizability. The present work complements these studies by evaluating parallel implementations of metaheuristics, which provide scalable and repeatable results with reduced computational burden under realistic load and renewable variability.
5.1. Comparative Performance Assessment Against Benchmark Methods
To ensure robustness in the results, each optimization method was executed 100 times under both GCM and IM. This Monte Carlo-based approach enables a rigorous statistical evaluation of solution quality, repeatability, and processing time. The primary performance metrics considered in this study are network energy losses and total emissions.
Under GCM,
Table 3 summarizes the maximum and average reductions in both losses and emissions obtained by the three optimization methods: PPSO, PCSA, and PJAYA. Standard deviation values are also reported to quantify consistency, alongside average computation times per simulation run. The baseline case, which includes only PV generation operating under MPPT control (without BESS intervention), results in 2484.57 kWh of energy losses and 9.8874 Ton
/kWh of emissions. These values serve as a reference to assess the benefits introduced by BESS control.
PPSO demonstrated the highest effectiveness among the three algorithms, achieving the greatest reductions in both energy losses and emissions, with average loss reductions of 1013.78 kWh (40.8%) and average emission reductions of 0.1666 Ton/kWh (1.69%). PCSA followed closely with consistent but slightly lower improvements. PJAYA, while still yielding benefits over the base case, showed the smallest gains and higher variability.
The consistency of the results is particularly evident in the standard deviation values, where PPSO achieved the lowest variability across all simulations, indicating high repeatability. Furthermore, PPSO also required the shortest average processing time, reinforcing its suitability for real-time or near-real-time microgrid control applications.
Figure 3 highlights the percentage improvements achieved by PPSO compared to PCSA and PJAYA. The most significant advantage was seen in loss reduction, where PPSO outperformed PJAYA by more than 22% on average. Emission improvements were also consistent but more modest, with relative gains under 1%. Overall, PPSO combined high performance, low variance, and reduced computational cost, making it a strong candidate for intelligent microgrid operation.
To allow all eight performance indicators to share a common radial axis, the raw values in
Table 3 were first scaled with a min–max transformation applied separately to each metric:
where
is the value of method
k for metric
m, and
is its normalized counterpart. Because lower values are desirable for every metric (less energy lost, fewer emissions, smaller variability, and shorter processing time), the numerator is inverted so that the best performer occupies the outer rim (
) and the worst collapses to the center (
). The resulting dimensionless scores are displayed in the radar plot below.
PPSO forms an almost perfect octagon that tracks the outer rim of the radar plot, revealing its dominance across every technical metric when the microgrid is tied to the primary grid. The algorithm not only yields the minimal resistive losses and the lowest
emission rate, but it also maintains unrivalled numerical stability (indicated by the minimal standard deviations) and delivers the quickest convergence in both loss and emission. In essence, PPSO provides a uniformly high-quality solution without trade-offs between accuracy and computation time. A benchmark comparison between algorithms is presented in
Figure 4.
PCSA shows a more irregular footprint. It stays competitively close to PPSO on the four spokes (maximum and average loss/emission reductions). Still, it retracts sharply toward the center on the runtime axis and collapses entirely on the variability of loss reduction ( Loss). This suggests that while PCSA can approximate PPSO’s technical improvements, it does so at the expense of longer runtimes and less repeatable outcomes. PJAYA’s polygon is confined almost entirely to the radar origin except for a small protrusion on the loss variability and runtime-loss spokes, confirming that in GCM, it remains the least attractive option for real-time microgrid optimization.
Islanded Mode Results and Analysis
The second case analyzes the microgrid operating in IM, where all power must be supplied locally by the diesel generator and PV units, with no external grid connection.
Table 4 summarizes the performance of each optimization algorithm in this configuration. Notably, the system cannot operate under this mode without the assistance of BESS. Attempting to do so leads to infeasibility due to overload conditions on the diesel generator, which would require approximately 15% load shedding and 35% PV curtailment [
6]. This observation underlines the essential role of coordinated storage in autonomous microgrids.
A detailed examination of the results in
Table 4 shows clear differences in the performance of the evaluated algorithms when operating the 33-node MG in IM. In terms of maximum reduction in energy losses, PPSO reaches the lowest value at
kWh, which represents an improvement of approximately
compared to PCSA (
kWh) and a substantial
improvement compared to PJAYA (
kWh). A similar pattern is observed for the average energy losses, where PPSO records
kWh, outperforming PCSA (
kWh) by
and PJAYA (
kWh) by
. These differences are further reinforced by the standard deviation values: PPSO maintains an exceptionally low variability of
, while PCSA and PJAYA present
and
, respectively, indicating that PPSO provides more stable and repeatable solutions under fluctuating demand and PV generation.
Regarding emissions, PPSO again delivers the best performance. In the best-case scenario, PPSO achieves Ton/kWh, marginally improving over PCSA ( Ton/kWh) by and PJAYA ( Ton/kWh) by . The average results follow the same trend, with PPSO reporting Ton/kWh, compared to Ton/kWh for PCSA () and Ton/kWh for PJAYA (). In terms of stability, PPSO’s emission variability is minimal (), markedly lower than PCSA () and PJAYA (), confirming its robustness in environmental performance.
From a computational standpoint, PPSO demonstrates a significant advantage. For the energy loss minimization runs, PPSO requires only s, which is roughly faster than PCSA ( s) and faster than PJAYA ( s). In emission minimization, PPSO completes in s, outperforming PCSA ( s) by and PJAYA ( s) by . This reduction in computational time is critical for real-time or near-real-time applications in islanded microgrids, where rapid decision-making can prevent instability or load curtailment.
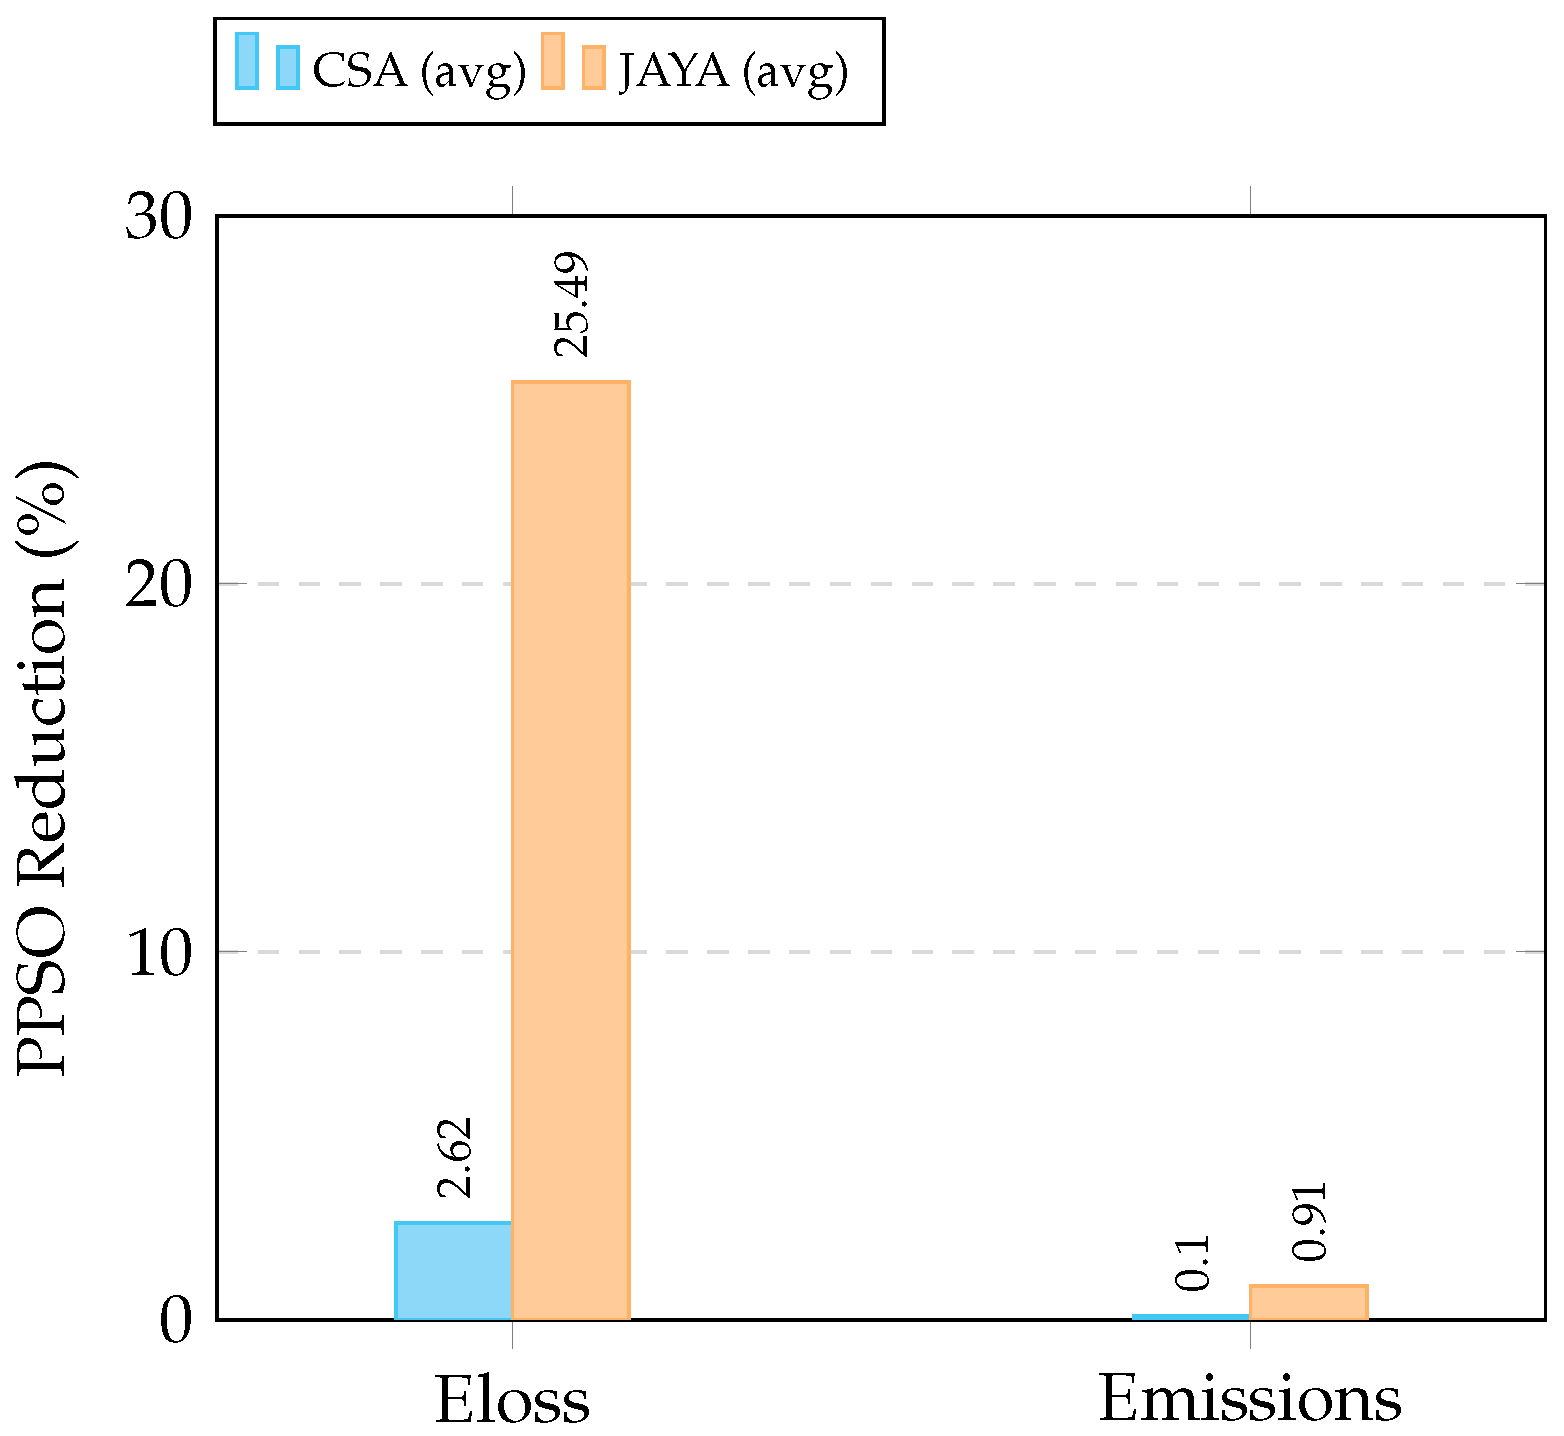
Figure 5 illustrates the percentage improvements achieved by PPSO over the average results obtained with PCSA and PJAYA in IM for both energy losses and
emissions. The plot shows that, in terms of energy loss reduction, PPSO outperforms PCSA by
and achieves a significantly larger improvement of
compared to PJAYA. For emissions, the relative gains are more modest but still consistent, with PPSO delivering
lower emissions than PCSA and
lower emissions than PJAYA. These results confirm that while all three algorithms can manage BESS operation under islanded conditions, PPSO consistently provides a measurable advantage, particularly in minimizing technical losses. The substantial improvement over PJAYA in energy loss reduction highlights PPSO’s superior ability to optimize power flows and battery dispatch in a scenario with no external grid support, where efficient internal resource management becomes critical to system stability and performance.
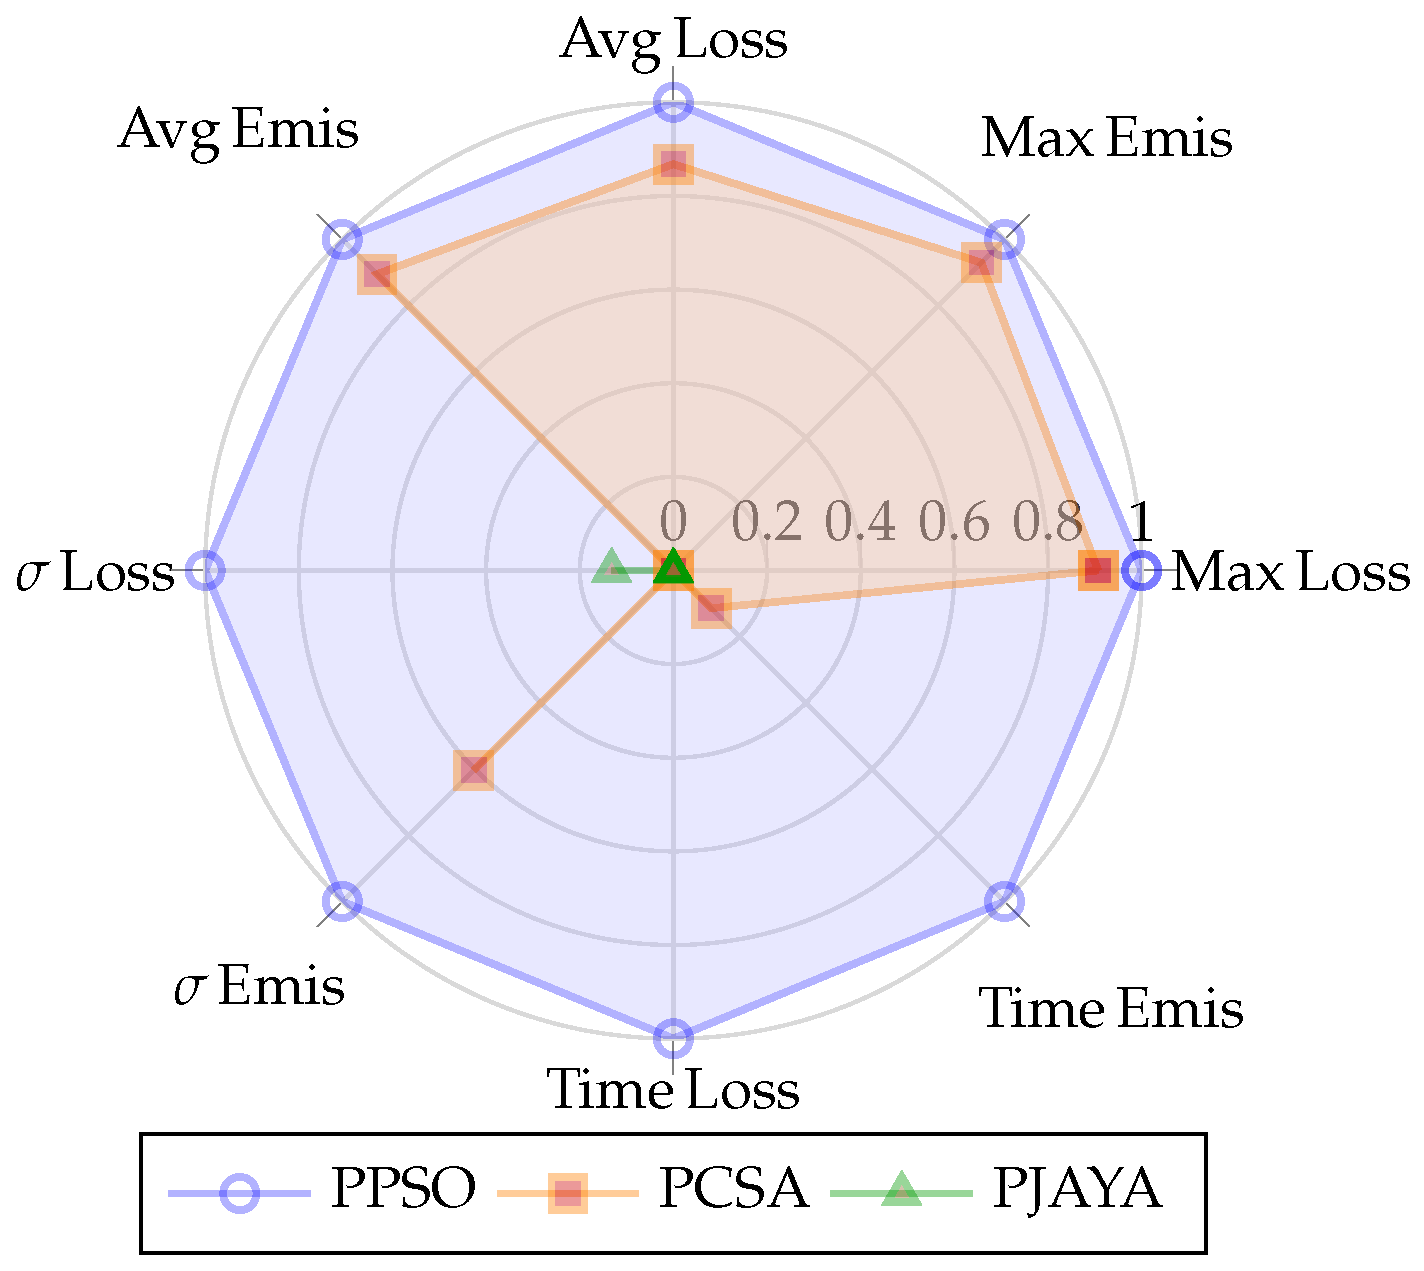
Figure 6 condenses eight technical indicators into a single visual snapshot, making it immediately apparent which optimization scheme offers the most balanced performance in islanded operation. The light-purple polygon corresponding to PPSO hugs the outer rim of the chart on every axis, confirming that this algorithm simultaneously achieves the lowest energy losses, the smallest
footprint, the tightest statistical dispersion, and the fastest execution time. In contrast, the orange PCSA contour forms a noticeably smaller octagon: it stays reasonably close to PPSO in the four axes (maximum and average loss or emission reductions). Still, it collapses toward the center on the two runtime axes and, to a lesser extent, on the variability indicators. PJAYA, shown in green, barely leaves the plot’s origin except for a modest excursion on the “Time Emis’’ spoke, indicating that it lags behind the other two methods across every metric.
Numerical evidence indicates that PPSO not only provides the most technically and environmentally efficient operation under islanded conditions but also guarantees exceptional repeatability and the fastest convergence among the evaluated algorithms. These features make it a particularly well-suited approach for autonomous microgrids, where operational reliability and rapid response are paramount.
These patterns highlight the multidimensional advantage of PPSO in standalone microgrids, where both technical efficiency and numerical robustness are fundamental. The method’s near-circular, outer-ring footprint means operators would gain lower resistive losses and smaller greenhouse-gas emissions without sacrificing computational speed. PCSA represents a workable compromise when slightly longer solution times can be tolerated, still delivering respectable loss and emission mitigation, but with greater scatter between runs. PJAYA, however, would require substantial tuning or hybridization before it could be recommended for field deployment, as its limited reach on the radar plot implies higher operating losses, larger emission rates, and unacceptable variability compared with the other contenders.
In the islanded configuration, once again, the PPSO showed the best average performance in terms of both loss reduction and emission control. It also exhibited the lowest standard deviations, indicating strong repeatability, and maintained the fastest computational times across all runs. These results confirm that even under tighter operating constraints, the proposed strategy can ensure feasible, efficient, and low-emission operation in standalone energy systems.
The comparative results reveal that PPSO achieves superior performance because its swarm intelligence dynamics exploit both individual memory and collective learning, ensuring steady convergence toward high-quality solutions with minimal variability. PCSA, although capable of competitive improvements, exhibits larger dispersion since its exploration relies heavily on stochastic awareness probabilities, making it less reliable under uncertain conditions. PJAYA, while attractive for its parameter-free formulation, tends to converge prematurely due to its lack of adaptive mechanisms, which limits its ability to escape local optima. These results confirm that the relative performance of metaheuristics is not only a function of solution quality but also of their intrinsic search dynamics, with PPSO offering the most balanced trade-off for practical microgrid scheduling.
5.2. Technical Validation of the Proposed Methodology
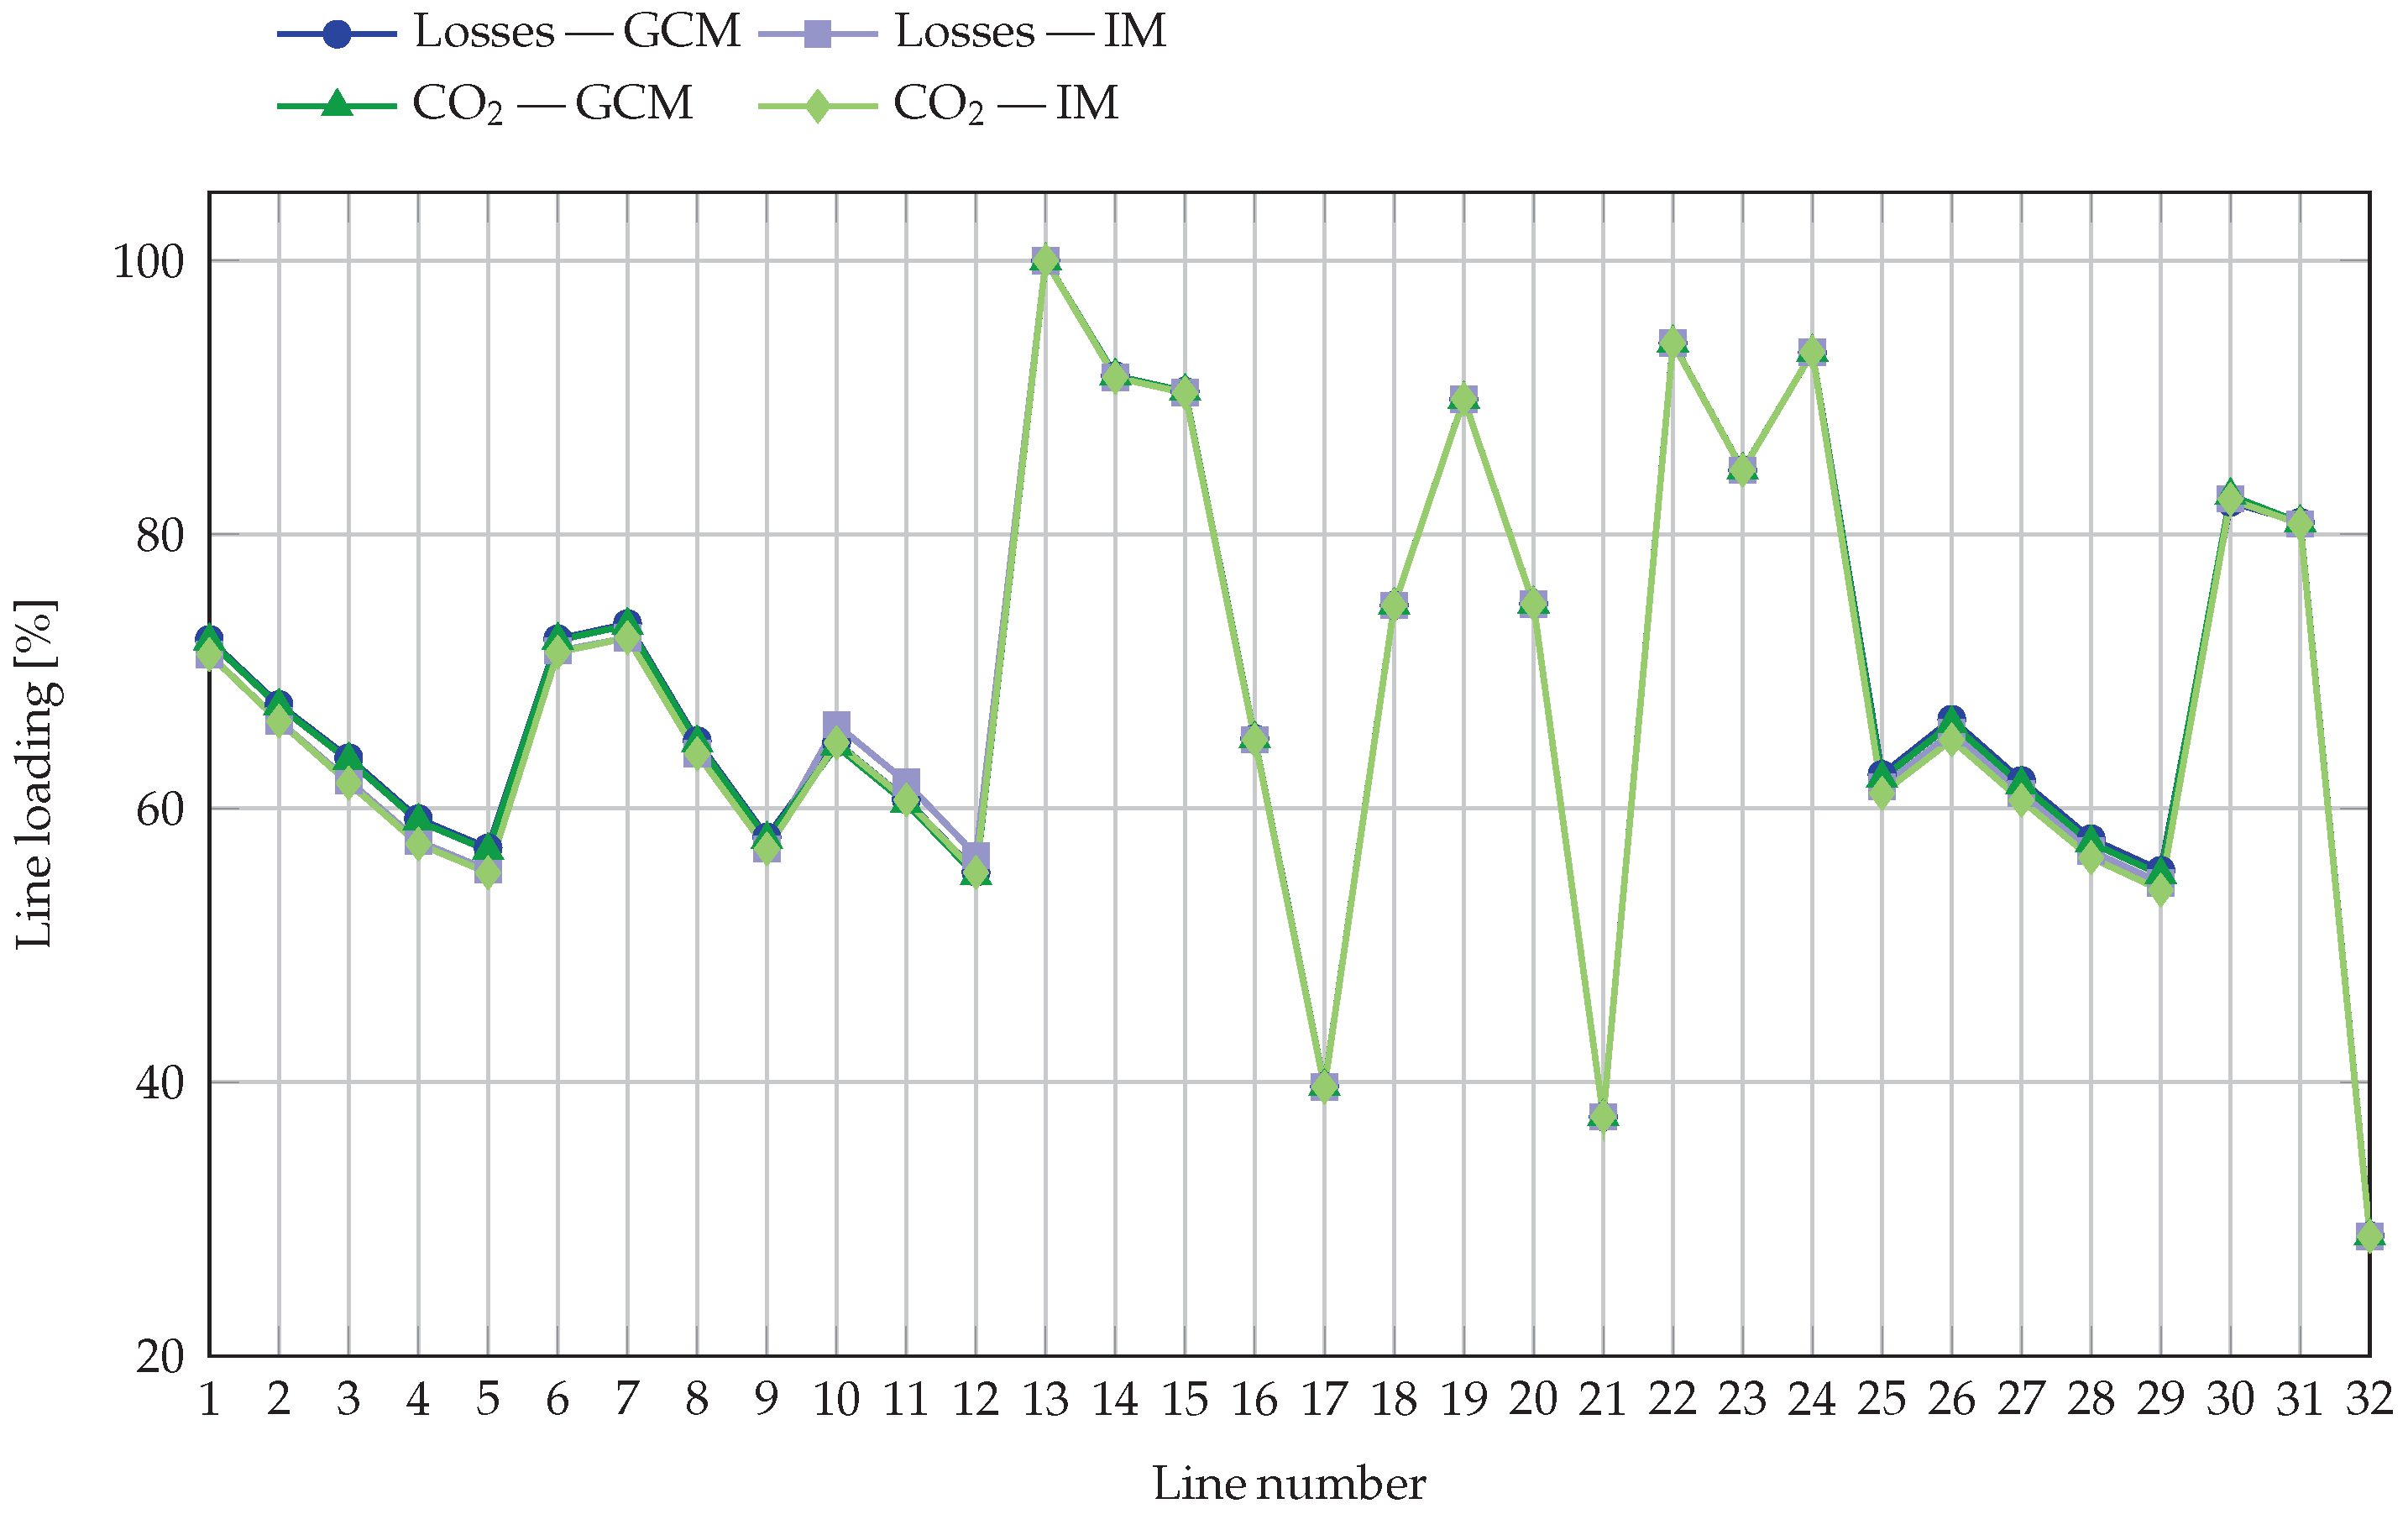
Figure 7 presents the percentage loading of the 32 distribution lines for the four analyzed cases: Losses—GCM, Losses-IM,
-GCM, and
-IM. In all situations, the results confirm that no thermal constraints are violated. The highest utilization is observed on Line 13, which remains slightly below the 100% limit in all scenarios (99.9994% for Losses-GCM and 99.999998% for
-IM). Other heavily loaded lines are 22 and 24, with loadings around 94% and 93%, respectively, followed by Lines 14, 15, and 19 (between 90% and 92%), and Lines 23, 30, and 31 (between 81% and 85%). The lowest loading values appear in Lines 21 and 32, operating at approximately 37% and 29%. These results indicate that the proposed strategy redistributes current flows without creating new thermal bottlenecks.
When comparing grid-connected and islanded operation under the same optimization objective, the differences in loading are minimal. For the loss minimization case, the maximum variation between GCM and IM is about 1.8% points across all lines. Similar differences are observed for the minimization case, also remaining below 1.8% points. This behavior indicates that removing the primary grid connection primarily results in minor adjustments to current distribution, rather than substantial changes in network stress.
For a fixed operating mode, the two objectives produce almost identical loading profiles. In GCM, the differences between the loss and cases are typically below 0.3% points. In IM, the variations are slightly larger, but still modest, with the largest change around 1.3%. This confirms that both optimization approaches maintain nearly the same operating envelope without compromising thermal headroom.
All four configurations respect the ampacity limits of every line. Even for the most loaded segment (Line 13), a positive margin to the thermal constraint is maintained in all cases, despite being numerically very small. This compliance is ensured by the SA-based power flow validation and the penalty mechanism incorporated in the optimization process. Most lines operate between 55% and 75% loading, with only a few trunk segments exceeding 90%, while downstream sections remain below 85%.
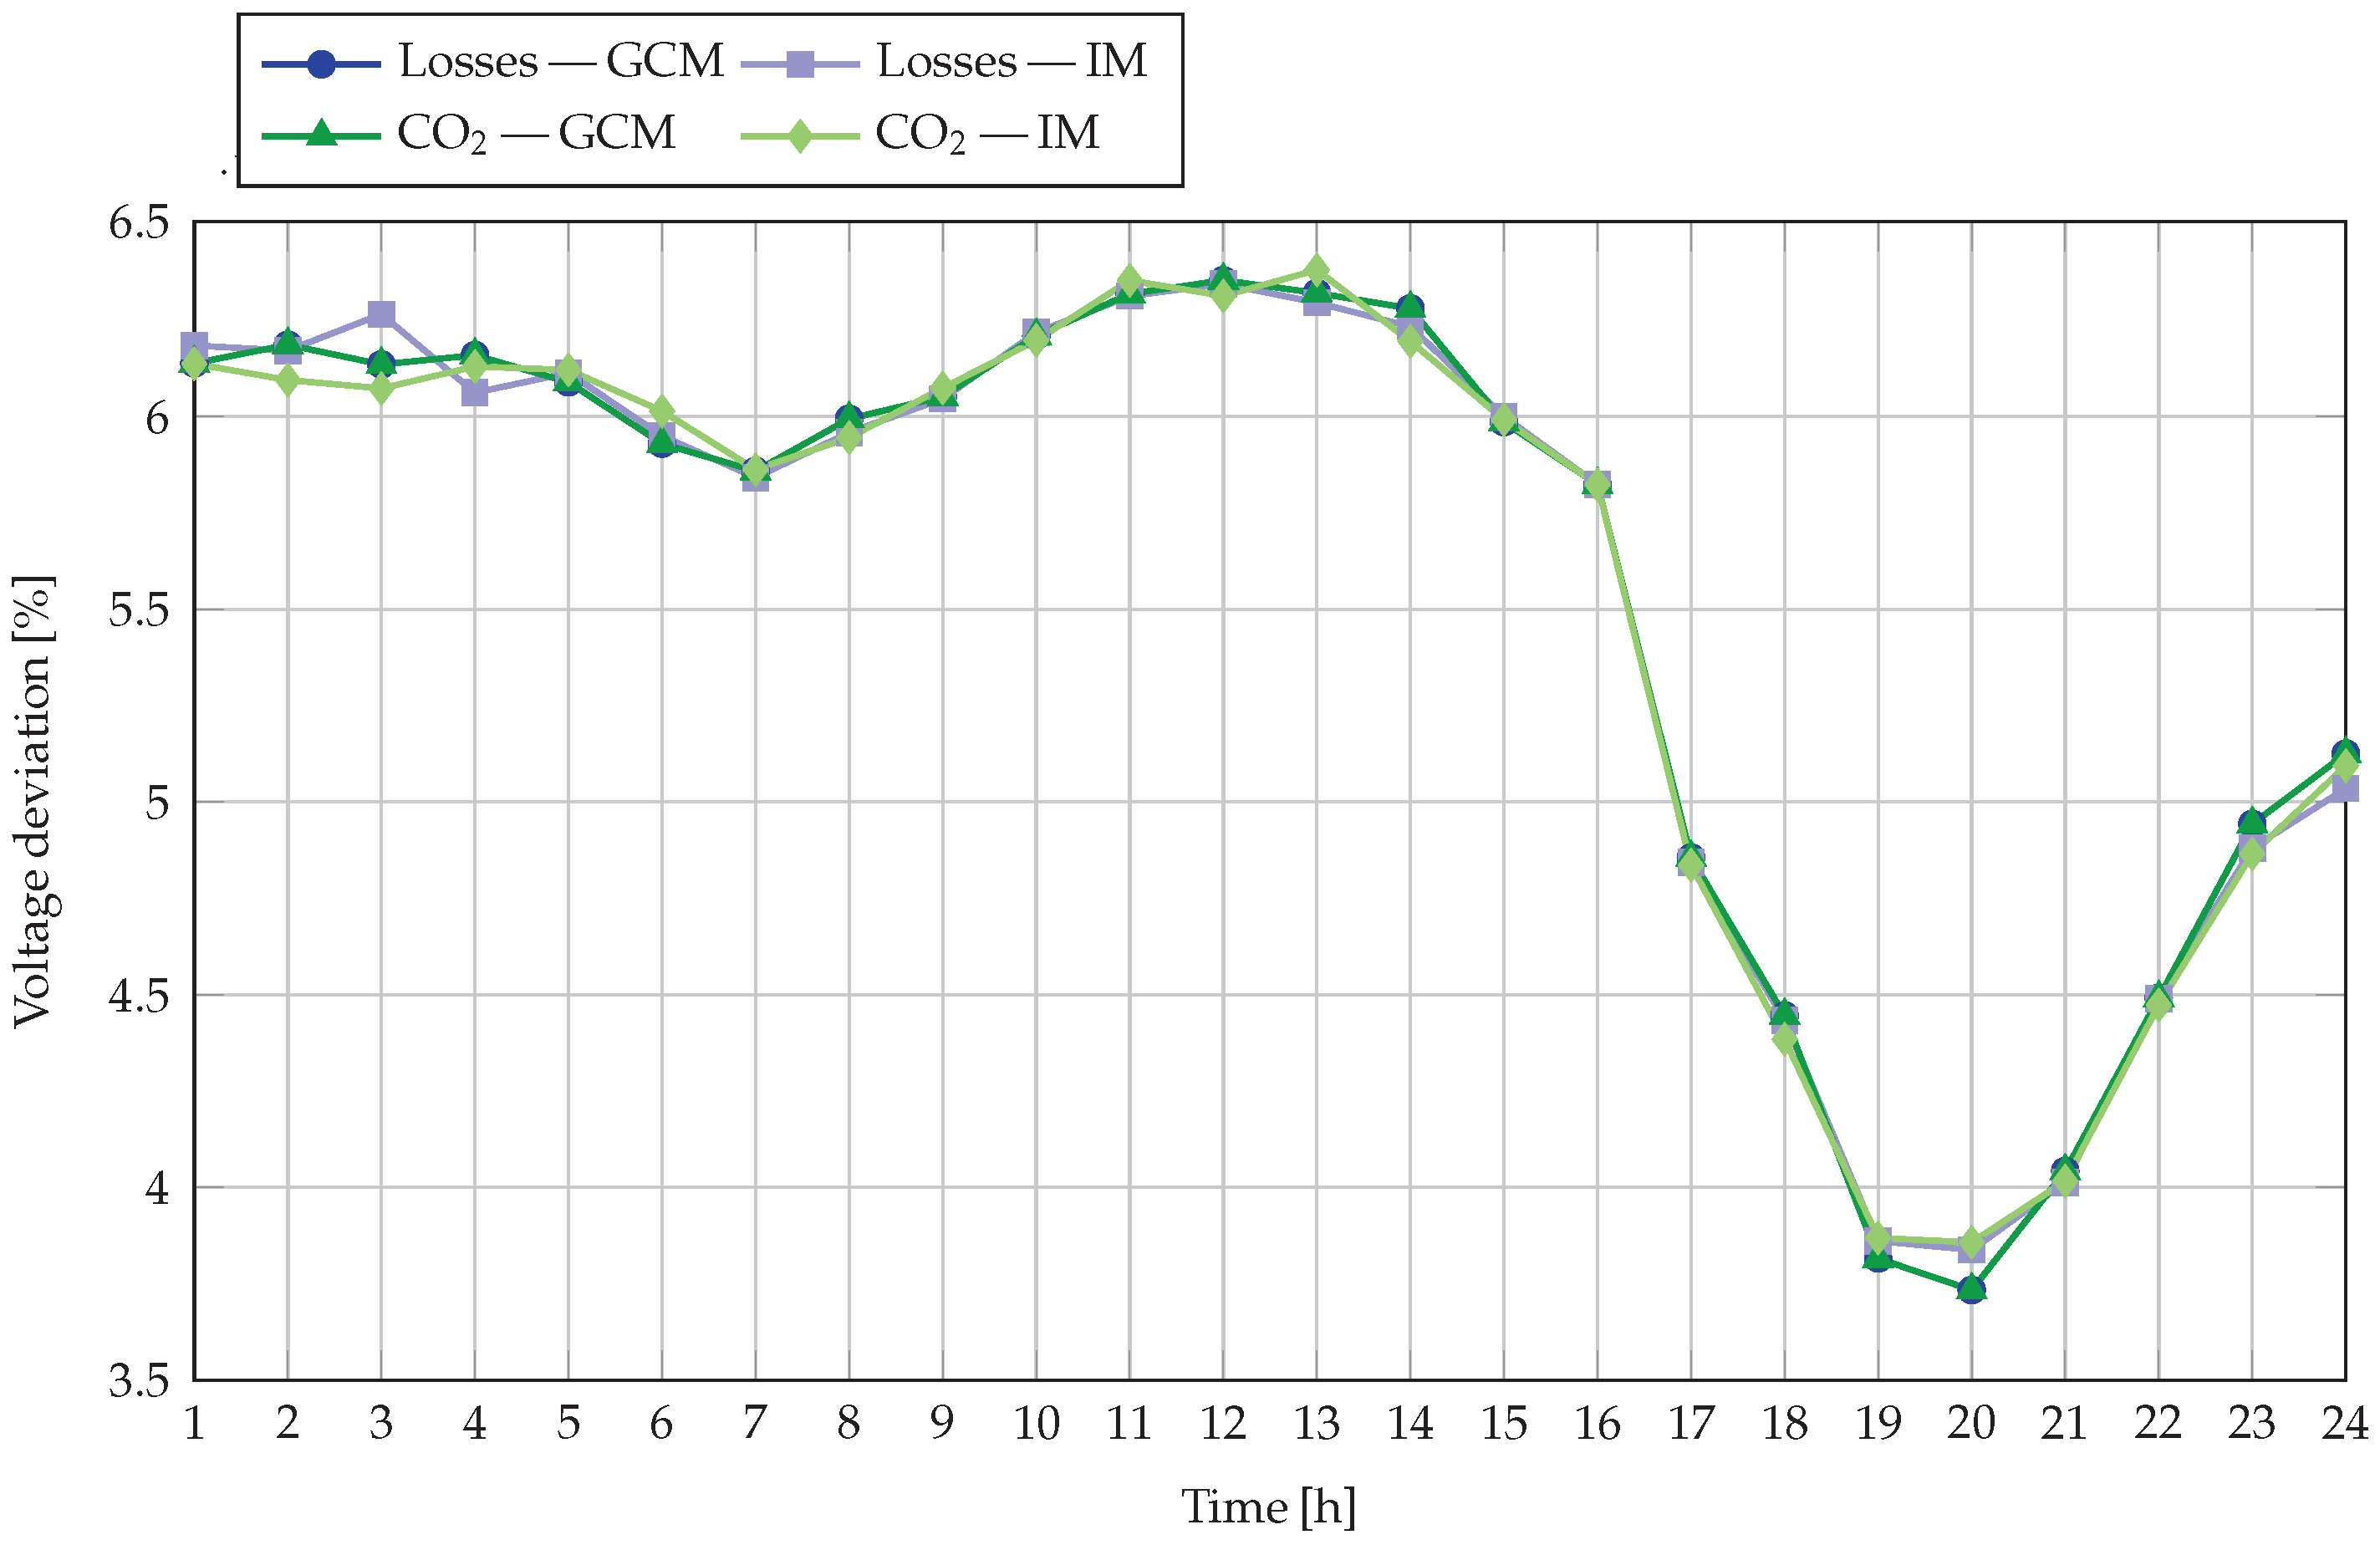
Figure 8 shows the hourly voltage deviation profiles for the four analyzed cases. In all scenarios, the deviations remain well within the acceptable range, confirming that the proposed optimization strategies maintain adequate voltage regulation throughout the 24-h period. The highest deviations occur during the early hours of the day, with values close to 6.35%, while the lowest deviations appear between hours 19 and 20, with values near 3.73%. These variations reflect the combined effect of load patterns and PV generation availability on voltage conditions.
When comparing grid-connected and islanded operation for the same objective, the differences in voltage deviation are minimal. For the loss minimization objective, the most significant difference between GCM and IM does not exceed 0.0013%. For the minimization objective, the deviations between modes follow a similar trend, with changes generally below 0.002%. This indicates that the absence of grid support has only a marginal impact on the voltage profile, as the BESS dispatch effectively compensates for local voltage fluctuations.
For a fixed operating mode, the two objectives produce almost identical deviation curves. In GCM, the loss and cases are essentially overlapping, showing that both optimization goals lead to similar voltage regulation performance. In IM, the differences are slightly more noticeable at some hours, but remain very small, confirming that the change in objective does not compromise voltage quality.
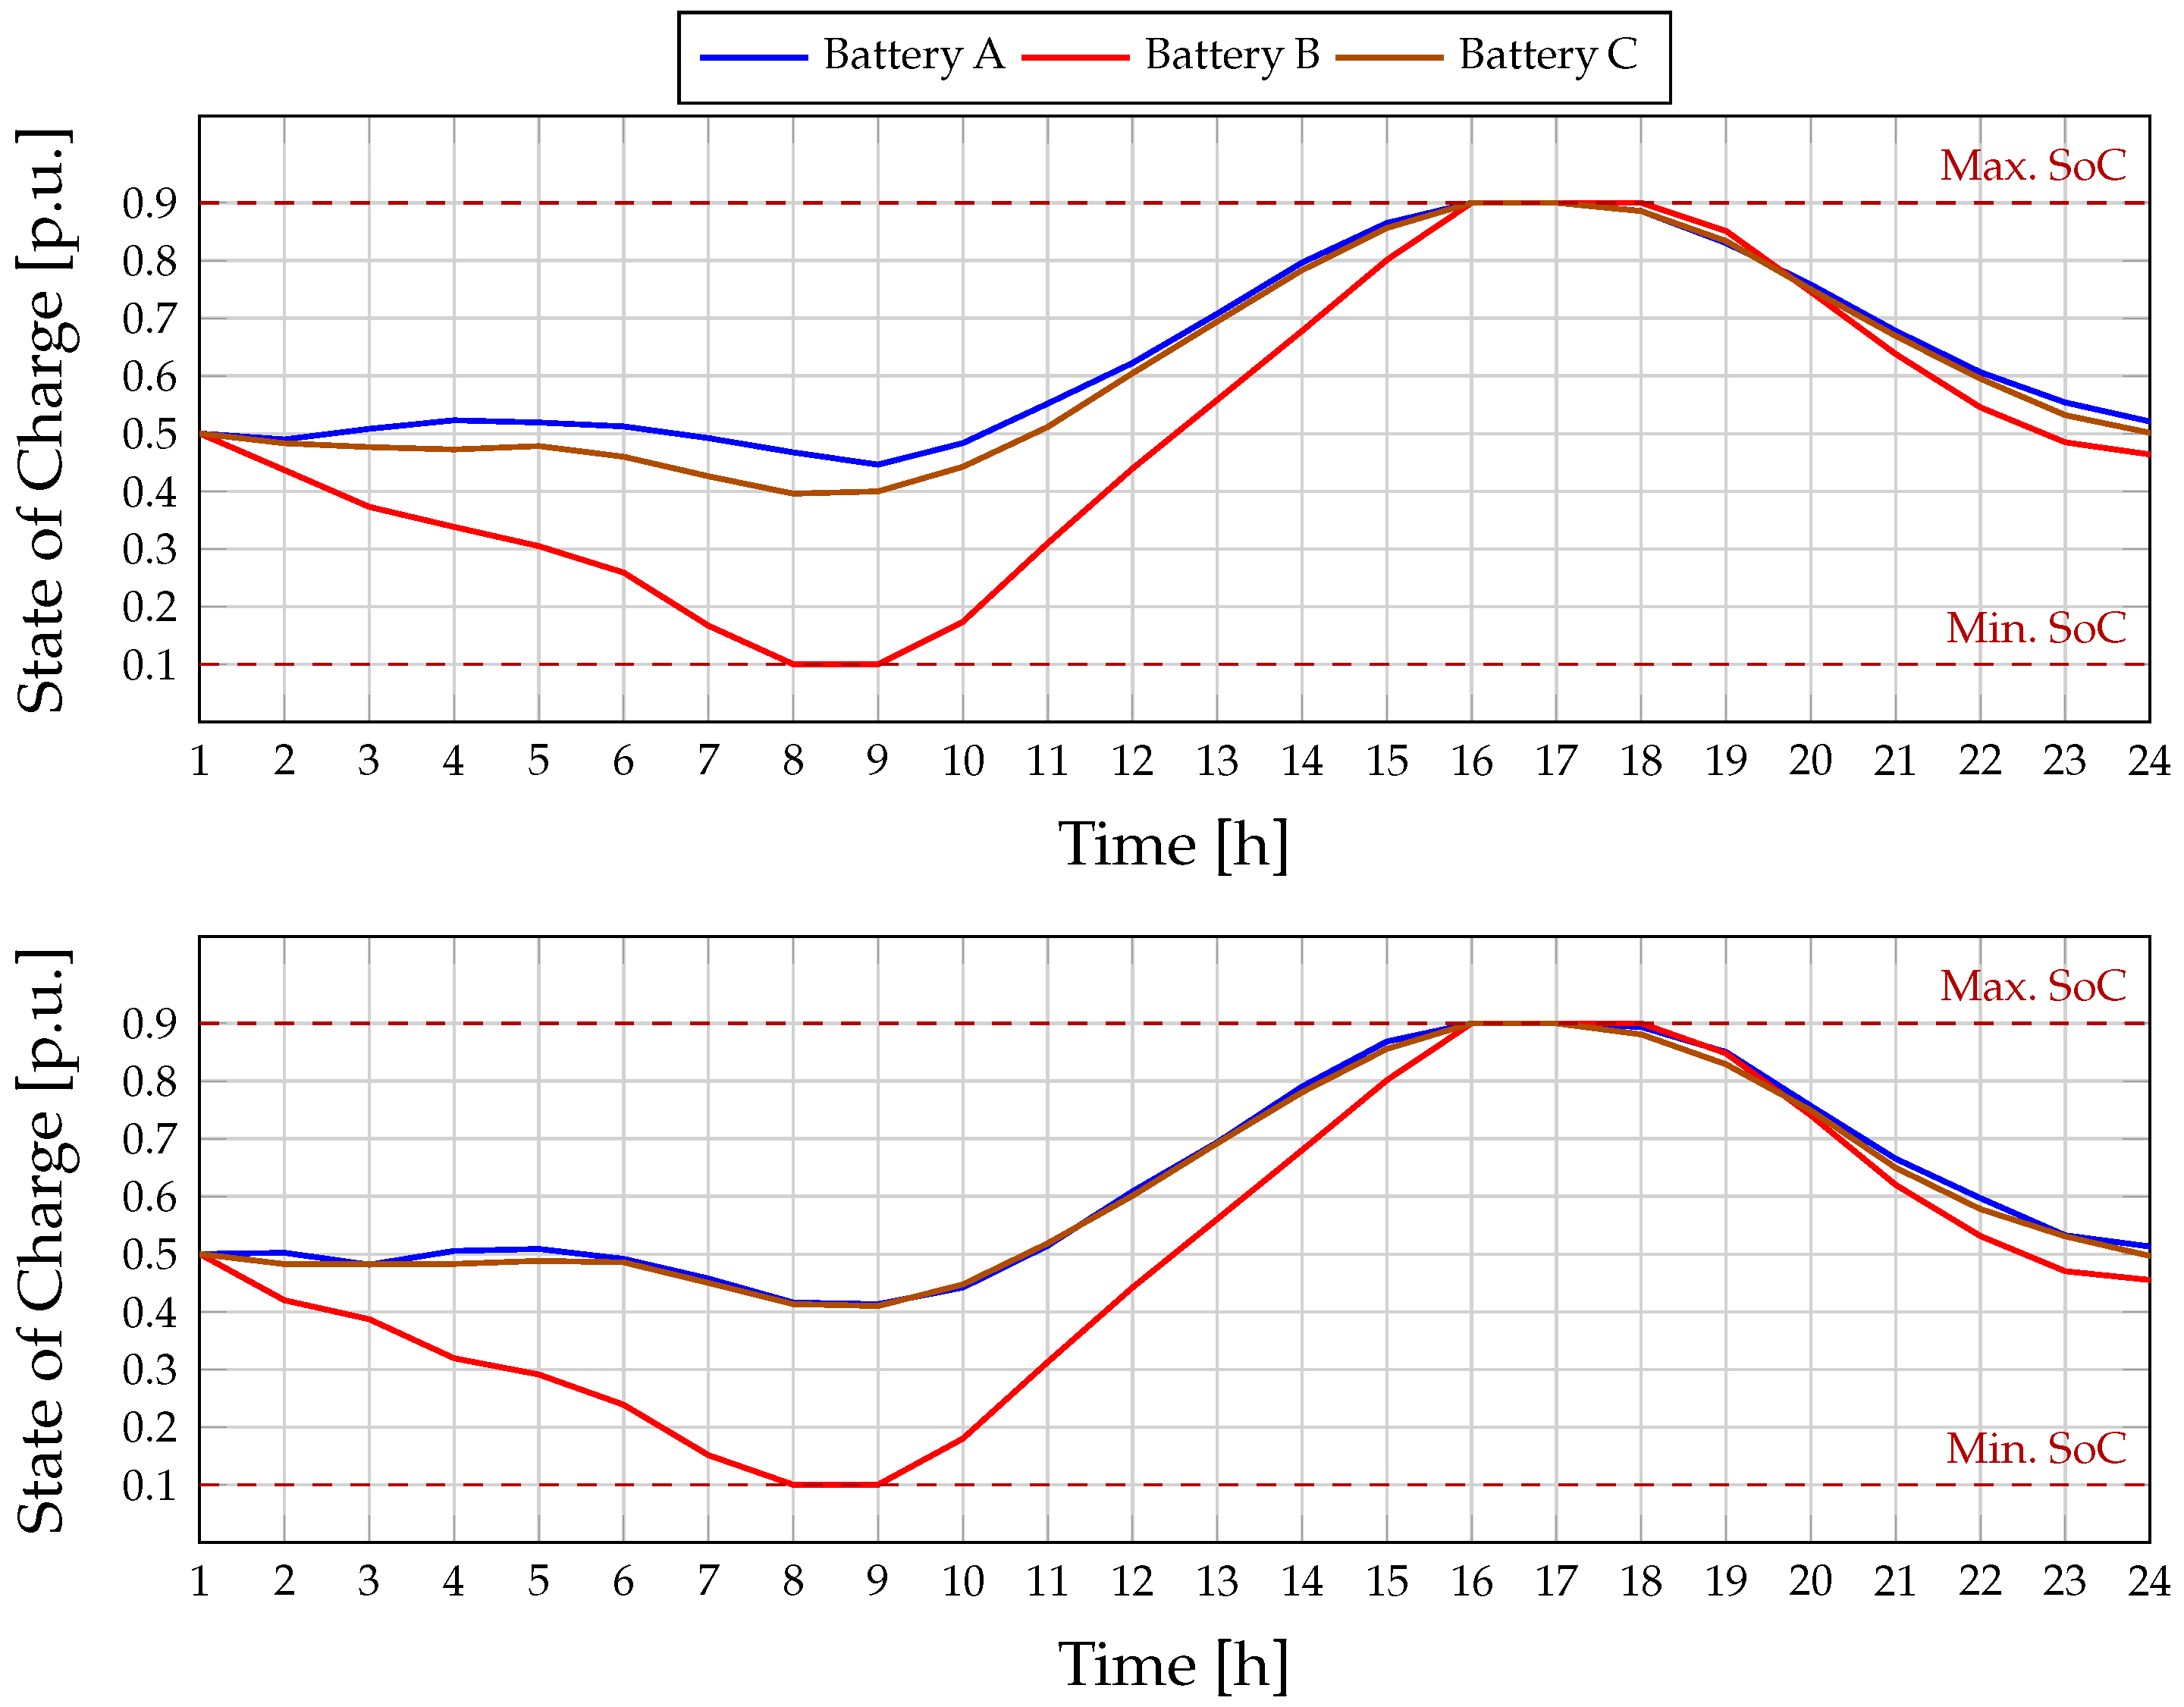
Figure 9 and
Figure 10 present the SoC trajectories of the three BESS units over the 24-h horizon for the two optimization objectives: loss minimization and
emission reduction, each evaluated in GCM and IM. In all scenarios, the batteries operate strictly within the technical band of 10–90% SoC, as defined by the dashed reference lines, and converge to the preset 50% target by the end of the day to maintain energy neutrality. This consistent adherence to operational constraints demonstrates the effectiveness of the optimization in coordinating energy use without compromising battery health.
When the objective is loss minimization, the SoC patterns reveal a coordinated discharge–charge strategy adapted to each unit’s location and capacity. In GCM, Battery A undergoes a moderate early discharge, reaching around 45% by mid-morning, then charges steadily to the upper limit in the afternoon before partially discharging toward the evening. Battery B exhibits a sharper morning discharge, touching the minimum SoC near hour 8, followed by an extended charging phase to full capacity and a gradual return to the final target. Battery C follows a more tempered profile, with a smooth descent to about 40%, a steady climb to the maximum limit, and a controlled evening discharge. In IM, these patterns are preserved but with subtle timing shifts: Battery A starts recharging earlier, Battery B spends less time at the minimum SoC, and Battery C advances its midday charging window. These adjustments help balance the more constrained generation–demand dynamics in the absence of grid support, ensuring that no unit approaches unsafe limits.
For the minimization objective, the SoC trajectories share many qualitative similarities with the loss minimization case but exhibit small differences in the depth and timing of charging and discharging, reflecting the environmental priority. In the GCM, Battery A begins with a modest discharge, quickly recovering through a steady midday charge to reach the maximum limit by late afternoon. Battery B again experiences a pronounced morning discharge to the lower bound, remains there briefly, and then charges to full capacity before tapering toward the target. Battery C adopts a smoother discharge to its minimum level, followed by a gradual and continuous charge to full capacity and a measured discharge in the final hours. In IM, the general behavior remains consistent. Still, timing shifts are evident: Battery A initiates charging earlier in the day, Battery B reaches its minimum slightly sooner, and Battery C adjusts its charging period to better align with the local PV generation profile. These adaptations ensure that demand is met efficiently while keeping SoC within safe margins, even without external grid support.
Across both objectives and operating modes, the SoC curves confirm that the scheduling strategy produces stable and well-coordinated battery operation. The differences between loss and emission optimization are subtle, suggesting that the proposed framework achieves its technical and environmental targets without introducing drastic changes to the storage behavior. This robustness is necessary for practical implementation, as it indicates that the system can switch between objectives or adapt to varying grid conditions with minimal disruption to battery operation. Moreover, the balanced use of all three BESS units demonstrates effective spatial coordination, with each unit contributing according to its rated capacity and network location to support voltage regulation, loss reduction, or emission mitigation while respecting operational and longevity constraints.
Analysis Under Solar and Demand Uncertainties
To assess the robustness of the proposed methodology under realistic operating conditions, a stochastic framework was adopted in which variable daily profiles of photovoltaic generation and active power demand replaced deterministic assumptions. Specifically, 100 distinct scenarios were constructed using historical measurements from Medellín, Colombia, capturing the natural variability and correlation between local solar irradiance and load patterns, see
Figure 11. These scenarios were evaluated using the PPSO-based scheduling strategy to determine its effectiveness in minimizing the selected objective functions under uncertain conditions.
In the GCM, the PPSO achieved an average reduction of in energy losses compared to the base case, while also lowering emissions by . These results highlight the method’s ability to preserve high technical efficiency despite the stochastic nature of renewable generation and demand, with emission reductions primarily linked to reduced reliance on high-emission generation during peak-load intervals.
In the IM, the algorithm exhibited a similar trend, with average improvements of in losses and in emissions. The slightly higher percentage reduction in losses compared to GCM can be attributed to the greater impact of optimized BESS dispatch when the diesel generator is the main dispatchable source. However, emission reductions in IM are inherently limited by the fixed emission factor of diesel generation, making technical loss minimization the dominant driver of performance gains.
In absolute terms, the proposed PPSO achieved average reductions of 927.05 kWh and 935.62 kWh in daily energy losses under grid-connected and islanded operation, respectively, corresponding to more than 39% of baseline resistive losses. In terms of environmental performance, daily emissions were reduced by 0.1667 Ton in GCM and 0.2680 Ton in IM. While the relative percentage reductions in emissions may appear modest, their impact becomes substantial when accumulated over longer horizons. For instance, the annual reduction corresponds to approximately 60.8 Ton in grid-connected operation and 97.8 Ton in islanded operation, which demonstrates the tangible and scalable benefits of the proposed scheduling framework for sustainable microgrid management.
The dispersion across scenarios was notably small, indicating that PPSO consistently identified operating schedules that adapt to the variability in both PV output and demand. This stability is necessary for microgrid operators, as it ensures predictable benefits even when weather patterns deviate from forecasts. The findings confirm that the methodology is not only effective in deterministic settings but also resilient to operational uncertainties, making it suitable for real-world deployment in microgrids exposed to renewable and demand variability.
6. Conclusions and Prospects for Future Research
This work presented a parallel population-based Particle Swarm Optimization approach for the optimal scheduling of BESS in AC microgrids, considering both grid-connected (GCM) and islanded (IM) operating modes. The methodology was evaluated using a master–slave framework, where PPSO determined the operational setpoints of the storage units and a successive approximations method guaranteed the technical feasibility of the resulting solutions.
In the deterministic case study with fixed photovoltaic generation and demand profiles, the proposed PPSO algorithm demonstrated clear superiority over alternative metaheuristics. In GCM, PPSO achieved the lowest operational indicators, reducing average energy losses by more than 21% and emissions by nearly 0.9% compared to benchmark methods. In IM, where the reliance on local resources intensifies the optimization challenge, PPSO achieved even greater improvements, with average reductions of approximately 25% in losses and nearly 1% in emissions. These results confirm that PPSO not only minimizes technical inefficiencies but also contributes to lowering the carbon footprint under constrained operating conditions.
To extend the evaluation beyond fixed conditions, an uncertainty analysis was carried out using 100 realistic daily scenarios of solar PV generation and active power demand from Medellín, Colombia. This stochastic assessment revealed that PPSO maintains consistent performance despite variations in input conditions. In GCM, PPSO achieved average reductions of 37.28% in losses and 1.69% in emissions across all scenarios, while in IM, the reductions reached 37.65% and 1.67%, respectively. The findings highlight PPSO as a reliable optimization tool for microgrid scheduling, capable of adapting to both deterministic and uncertain conditions while securing improvements in energy efficiency, emissions reduction, and computational performance.
The proposed PPSO achieved daily reductions of 927.05 kWh and 935.62 kWh in energy losses under grid-connected and islanded operation, respectively, corresponding to more than 39% of baseline resistive losses. In terms of environmental impact, daily emissions decreased by 0.1667 Ton in GCM and 0.2680 Ton in IM. When accumulated over one year, these values correspond to approximately 60.8 Ton and 97.8 Ton avoided, respectively. It is important to note that these figures were obtained under multiple uncertainty scenarios, which confirms that the proposed scheduling framework remains effective under realistic operating conditions.
The results confirm that the proposed scheduling strategy maintains the feeder within safe thermal limits for all operating modes and optimization objectives. The similarity in line loading patterns across cases demonstrates that the methodology generates robust BESS dispatch plans that are not strongly dependent on the selected objective or the operational mode. Lines 13, 22, 24, 14, 15, and 19 are consistently the most heavily loaded and should be prioritized for monitoring, while the rest of the network operates with sufficient headroom. If greater margins are desired on the most stressed segments, operational adjustments such as fine-tuning the SoC trajectory or modifying reactive power setpoints could be implemented without altering the core optimization framework.
Voltage deviation results show that all scenarios remain well within the acceptable range defined by Colombian NTC 1340 standards, ensuring regulatory compliance. The consistency of the voltage profiles between grid-connected and islanded operation highlights the ability of the BESS scheduling to provide reliable voltage support even under significant variability in demand and PV generation. Together with the line loading results, these findings confirm that the proposed methodology can meet both technical and environmental goals without compromising network operational integrity.
The robustness of the method is further supported by the SoC profiles, which remain within the defined limits as they converge to the target end-of-day value. The minimal differences between loss and emission minimization cases indicate that the optimization framework can shift priorities without causing disruptive changes to battery operation, an important feature for practical deployment in dynamic environments.
Future research could extend this work in several directions. One avenue is the inclusion of multi-objective formulations that simultaneously balance technical, economic, and environmental criteria, allowing for real-time trade-offs between competing goals. Another is the application of the methodology to larger and more complex distribution networks, incorporating uncertainty from renewable generation forecasts and demand variations through stochastic or robust optimization techniques. The integration of degradation-aware battery models would enable schedules that not only meet system constraints but also optimize asset lifetime.An interesting and promising research direction involves coupling the proposed optimization strategy with cyber-resilience mechanisms. Finally, coupling the proposed approach with advanced forecasting and adaptive control strategies could support its implementation in real-time energy management systems, enhancing its applicability to practical microgrid operations.
