Article

Valorization of Grape Pomace Through Integration in Chocolate: A Functional Strategy to Enhance Antioxidants and Fiber Content

1
Department of Technologies and Applied Sciences, Polytechnic Institute of Beja, Campus do IPBeja, 7800-295 Beja, Portugal
2
NOVA School of Sciences and Technology, Earth Sciences Department, Campus de Caparica, 2829-516 Caparica, Portugal
3
GeoBioTec Research Center, NOVA University Lisbon, 2829-516 Caparica, Portugal
4
MED—Mediterranean Institute for Agriculture, Environment and Development, University of Évora, 7006-554 Évora, Portugal
5
CHANGE—Global Change and Sustainability Institute, 7006-554 Évora, Portugal
*
Authors to whom correspondence should be addressed.
Sci 2025, 7(3), 125; https://doi.org/10.3390/sci7030125
Submission received: 31 July 2025 / Revised: 24 August 2025 / Accepted: 3 September 2025 / Published: 5 September 2025

Abstract

Grape pomace (i.e., the residual skins, seeds, and pulp left after vinification) retains up to 70% of the fruit’s original phenolic compounds and is also rich in dietary fiber. As such, because this by-product is generated in large quantities worldwide and its disposal is both technologically problematic and costly, reusing it as a food ingredient could simultaneously mitigate environmental burdens, lower winery waste-management expenses, and enhance the nutritional profile of fortified foods. In this context, this study investigated the nutritional enrichment of dark chocolate by incorporating flour produced from red (cv. Syrah) and white (cv. Arinto) grape pomace at three levels (5, 10, and 15% w/w). Formulated chocolates and controls were manufactured under industrial tempering conditions and subsequently analyzed for protein, lipids, sugars, dietary fiber, total phenolic content, antioxidant capacity (DPPH and ORAC), color, texture, and consumer perception (hedonic test). All fortified samples showed higher fiber and antioxidant activity than the control, with “White_15” showing higher fiber content (43.1%) and “Red_5” for ORAC (69,483 µmol TE/100 g) and DPPH (6587 µmol TE/100 g). Dietary fiber showed an increase in content with the increase in grape pomace incorporation, regardless of the type (red or white). Texture softening was observed in all fortified chocolates independently of the incorporation level or type (red or white). Principal Component Analysis (PCA) and hierarchical clustering confirmed clear separation between control and fortified chocolates based on the parameters analyzed. Sensory evaluation with untrained panelists revealed good overall acceptability across all formulations. These findings demonstrate that grape pomace flour can be effectively valorized as a functional ingredient in dark chocolates, supporting circular economy practices in the wine and confectionery sectors while delivering products with enhanced health-promoting attributes (nutritional and antioxidant).

1. Introduction

Grape pomace is a by-product of winemaking composed of skins, seeds, stems, and residual pulp, representing about 20% of the original grape weight [1]. It constitutes an important source of several high-value nutritional compounds [2], and depending on the grape variety, as much as 70% of the phenolic compounds remain in the pomace after vinification [3]. Grape pomace can be transformed into inexpensive, high-value ingredients or materials for cosmetics, nutraceuticals, pharmaceuticals, and food products, helping to reduce the environmental impact associated with the waste generated by wineries [4].
The high levels of polyphenols and dietary fiber in grape pomace have been associated with multiple health benefits, including reduced risk of chronic diseases, lowering of blood pressure, attenuation of cholesterol and blood glucose levels (thereby decreasing the risk of cardiovascular disease and type II diabetes), and cancer prevention [5,6]. Phenolic compounds in grape pomace have also shown antidepressant and anxiolytic properties, as well as beneficial effects in Parkinson’s and Alzheimer’s diseases. In fact, Chiavaroli et al. [7] studied the neuroprotective properties of an aqueous grape-pomace extract and suggested that its antioxidant potential could underlie the protection of hypothalamic neurons. Moreover, a study carried out by Almanza-Oliveros et al. [8] compiled research demonstrating that grape pomace exhibits significant anti-cancer activity, inhibiting the proliferation of lung, breast, and colon carcinomas, as well as melanomas. Grape pomace showed the ability to prevent problems such as cardiovascular and hyperlipidemic activity, as diets supplemented with grape pomace improved the lipid profile, notably reducing triglyceride and total cholesterol levels. Indeed, the study also showed anti-diabetic activity, attributed to grape pomace’s ability to inhibit key digestive enzymes such as α-amylase and α-glucosidase.
Over the years, different studies with different approaches have been carried out with grape pomace. For instance, Tikhonova et al. [9] analyzed the physicochemical properties and chemical composition of grape pomace of five different red pomace grape cultivars and concluded that all the cultivars analyzed contained high concentrations of phenolic compounds, vitamins, and potassium, which could be used in the production of biologically active substances in order to increase the nutritional status of the consumers.
Mainente et al. [10] studied the physical and sensory properties of meat- and fish-based products stabilized by the addition of grape pomace powder, and their results showed that the inclusion of grape pomace led to an overall improvement in both sensory and physical characteristics. The study carried out by Tseng and Zhao [11] confirmed that the addition of grape pomace to salad dressing played a key role as an antioxidant agent, preventing rancidity and extending the shelf life of the food product. Rainero et al. [12] research consisted of fortified breadsticks by partially replacing wheat flour with grape pomace powder, obtaining fiber- and antioxidant-rich products, while Hayta et al. [13] investigated the supplementation of wheat bread with white grape pomace from the Emir variety, which showed significant increases in total phenolic content and antioxidant activity, along with good sensory acceptance by panelists. Sporin et al. [14] carried out a similar study using pomace from red (Merlot) and white (Zelen) grape varieties, using only the skins and seeds to produce the flour, and both pomace types increased the phenolic content and antioxidant activity in the final bread product, despite the Merlot-based bread showing more pronounced positive effects. Still related to flour, Hoye and Ross [15] also studied the phenolic content and consumer acceptance of bread fortified with grape seed flour, and although the grape variety was not specified, the fortified bread showed a significant increase in total phenolic content. On the other hand, Nakov et al. [16] studied the effect of adding grape pomace powder to cake formulations and found improvements in sensory quality and nutritional value, with the fortified cakes showing increased levels of anthocyanins, polyphenols, dietary fiber, and antioxidant capacity compared to the control.
Considering that grape pomace is abundant yet largely undervalued, identifying applications for this by-product is becoming increasingly important, and its utilization could reduce the environmental impact associated with waste disposal and provide the food industry with a source of macro and micronutrients for the eco-friendly development of new functional foods while reducing waste [17]. There is a growing interest in functional foods, driven by rising consumer awareness of health benefits, such as foods containing substances capable of lowering disease risk and supporting physiological functions [13,18].
In this context, new studies have been carried out with grape pomace and cocoa/chocolate due to their properties.
Over the past two decades, cocoa (and particularly dark chocolate) has been investigated, and its beneficial effects on human health have been confirmed, mainly because of its high polyphenol content, being in certain beans about 6–8% of polyphenols by dry weight [19]. Thus, chocolate is no longer consumed only for pleasure, as was the case for many years [20]. Several studies report health benefits attributable to its antioxidant, cardioprotective [21], and anti-inflammatory capacities [22]. In fact, the cocoa present in chocolate, high in polyphenols, is shown to have cardiovascular-protective properties, which can lead to anti-inflammatory effects according to Khan et al. [21], being identified as one of the foods with the highest flavanol content on a per-weight basis, contributing to the total dietary intake of flavonoids in the human diet [23,24].
Currently, cocoa and its derivatives are easily accessible in a variety of forms, often combined with other ingredients such as nuts and seeds. Indeed, the market and consumer acceptance of such functional combinations are not well documented, especially regarding winemaking residue known as grape pomace.
The use of grape pomace and cocoa or chocolate has already been investigated by Acan et al. [25], who explored the incorporation of grape pomace into chocolate spreads, demonstrating that pomace could be effectively used as a partial substitute for sucrose and milk powder, and its inclusion enhanced the nutritional profile and lowered the production cost of the chocolate spread. For instance, Bursa et al. [26] assessed the use of dried grape pomace as a bulking agent for partial substitution (between 7% and 10% of inclusion) of sugar, milk powder, and whey powder in compound chocolate, being considered suitable to be used to partially substitute sucrose, milk powder, and whey powder to increase functional properties and decrease the cost of compound chocolate. The effect of grape pomace in chocolate spread formulation was also investigated in place of sugar and milk-originated powders [25]. The increase in the amount of grape pomace in the chocolate spread affected the textural parameters of the product (namely, the firmness), which may enhance the functional properties of the chocolate spread and decrease the cost of the product.
Adopting environmentally friendly measures and circular-economy models is increasingly necessary. Indeed, given its low cost and high potential, grape pomace should no longer be treated as a useless residue with high disposal costs. Therefore, the aims of the present study were to evaluate, from both a nutritional and sensory perspective, dark chocolates fortified with grape-pomace flour (white grape cv. Arinto and red grape cv. Syrah, both grown under organic practices) at three inclusion levels (5, 10, and 15% w/w).

2. Materials and Methods

2.1. Grape Pomace Flour Composition

Grape-pomace flours employed in this study were chosen on the basis of a preliminary screening conducted in the laboratory of the Department of Technologies and Applied Sciences in the Polytechnic Institute of Beja. Two flours, richest in antioxidants and both grown under organic practices, were selected: one from red pomace (cv. Syrah) and one from white pomace (cv. Arinto) (Table 1; Figure 1). The grape pomace from both cultivars was generously provided by Herdade dos Lagos, located in Beja—Alentejo, Portugal, in August 2023. The soils where both cultivars were produced were heterogeneous and clay-loam, and only organic fertilizers were used, as seaweed (Ascophyllum nodosum), as well as small corrections of micronutrients and organic matter to the soil. The growing season was generally favorable, with a rainy autumn and a mild spring, with rainfall persisting until mid-June, although it did not pose significant problems for disease development, since rising temperatures eliminated the small outbreaks of downy mildew that had appeared. During the production of both cultivars, only preventive fungicides (copper and sulfur) were applied, as well as basic substances like echinacea extract and mimosa extract. Moreover, the presence of Botrytis cinerea was not observed in either cultivar. The chemical composition present in Table 1 was carried out considering the methods described in this section of materials and methods.
The grape pomace (consisting of skins, seeds, and residual pulp) was dried at 60 °C for 12 h to 5–8% moisture content. Then ground and sieved to obtain flour with a particle size of 600 µm.

2.2. Chocolate Samples Preparation

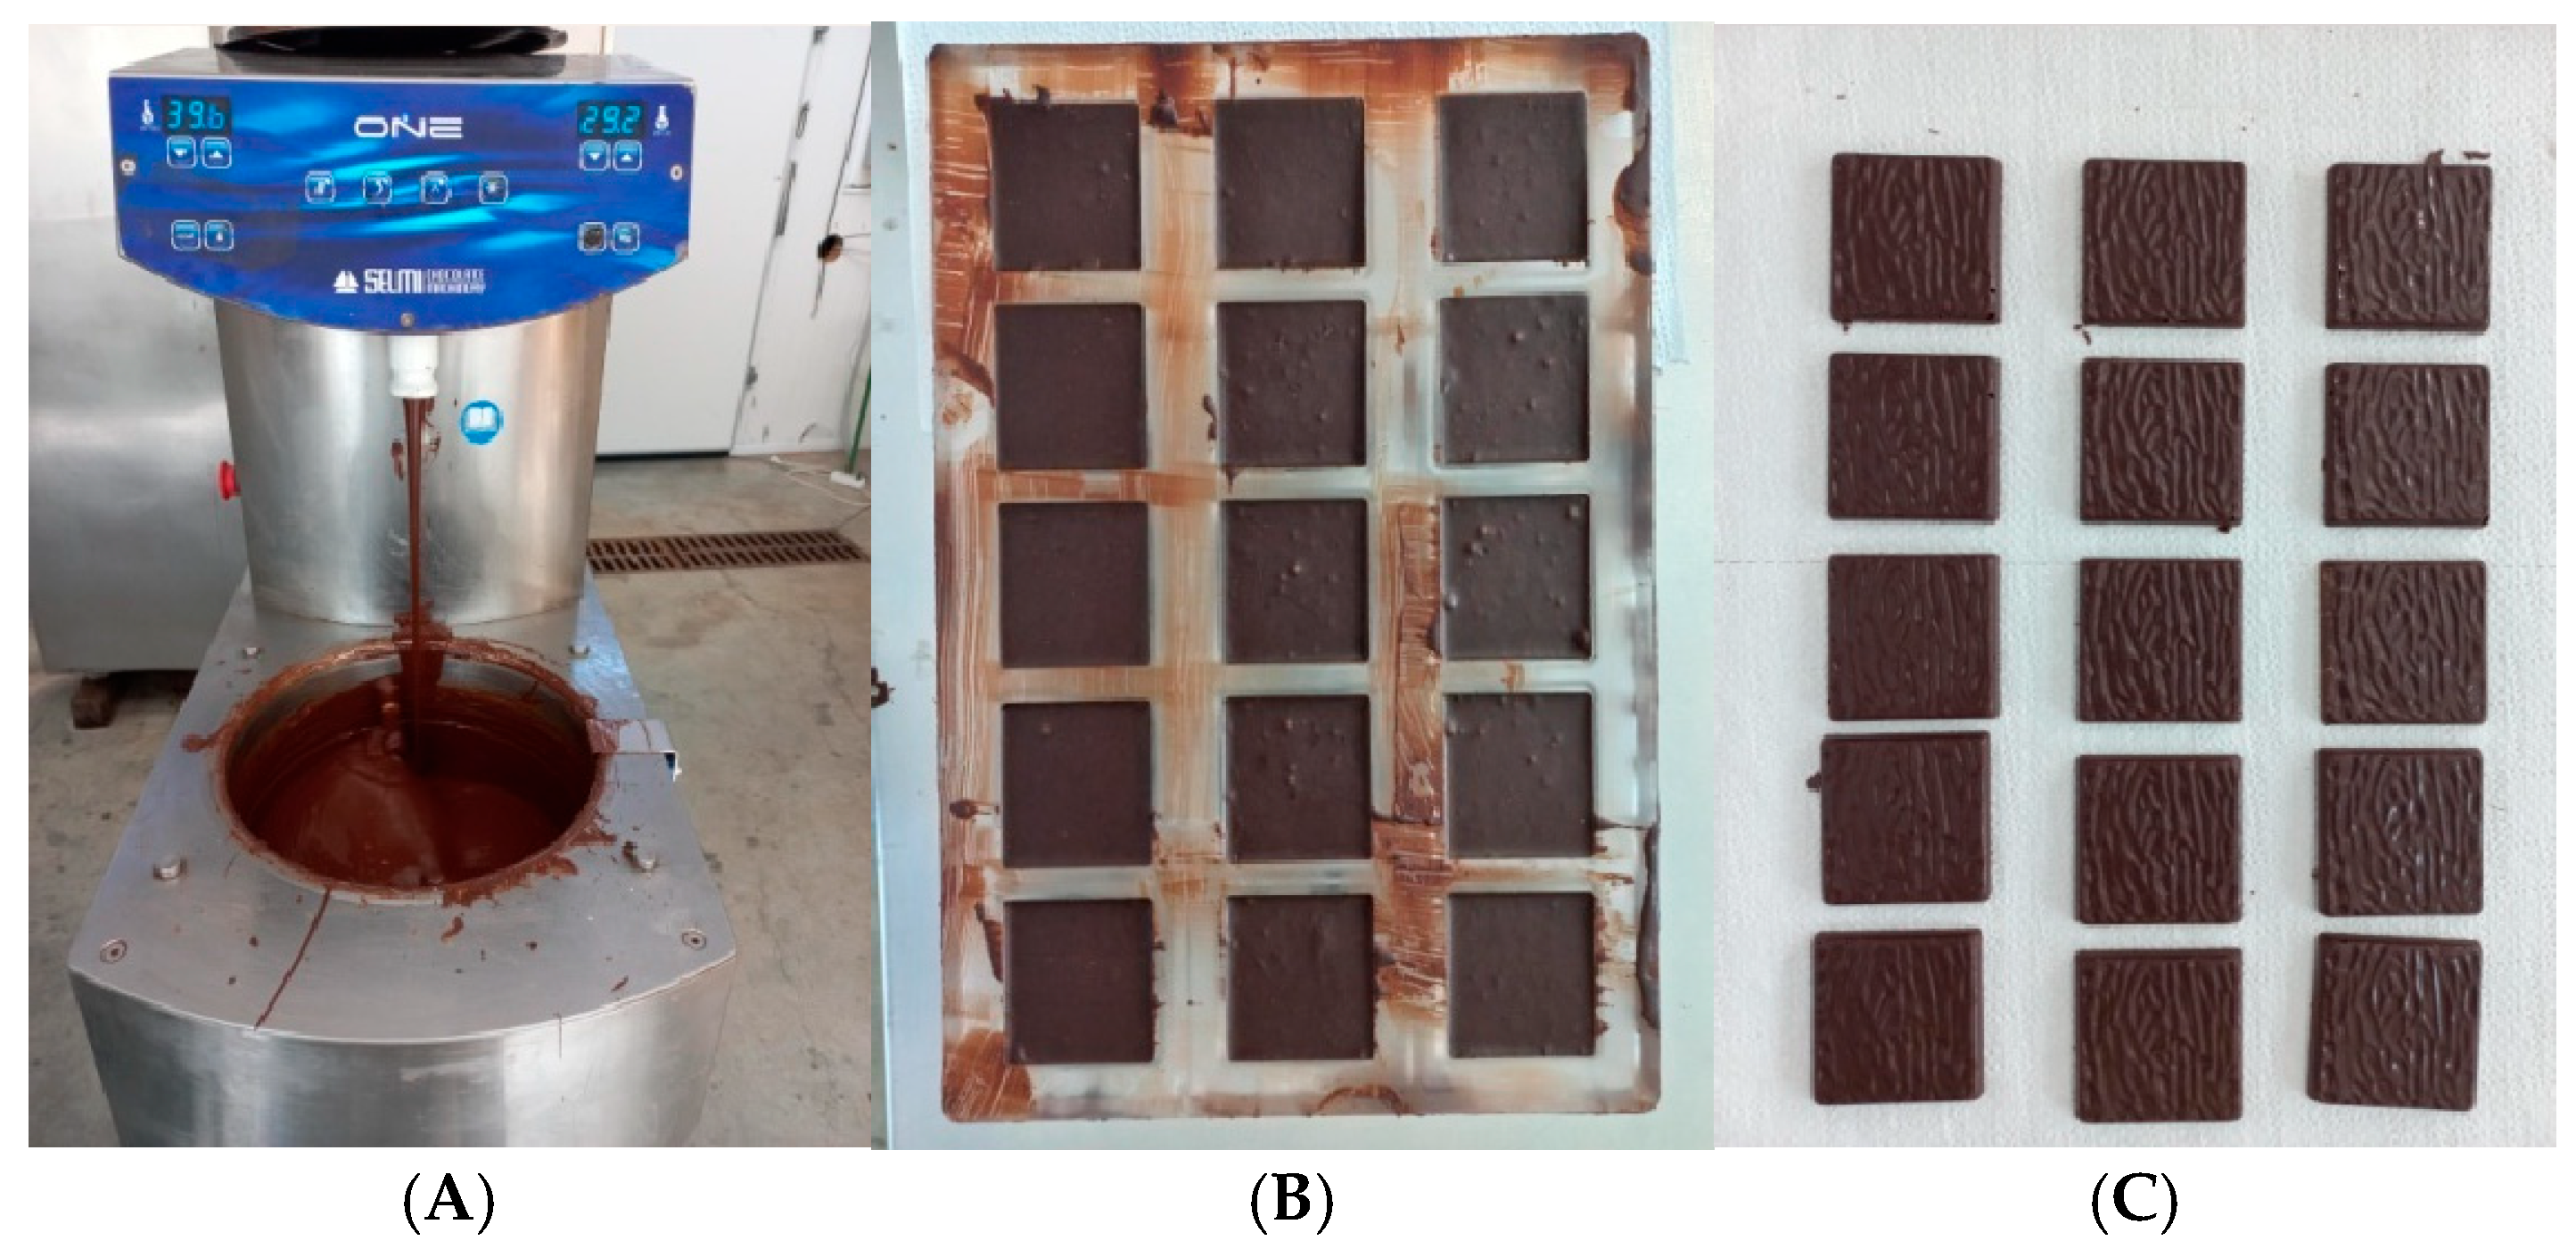
Dark chocolate (54.5% cocoa mass; Callebaut 811, Belgium) was melted at 40 °C and tempered to 30 °C in an industrial tempering machine (Selmi One, Italy) under continuous agitation. Tempered chocolate was blended with grape-pomace flour at 5, 10, and 15% w/w, yielding three experimental batches, and each batch was produced in triplicate (Figure 2A). A control batch (plain dark chocolate) was prepared under identical conditions.
The chocolate masses were deposited into polycarbonate forms (15 cavities × 7 g), cooled at 6 °C for 15 min in a refrigerated cabinet (Liebherr FKU 1800), unmolded, and analyzed (Figure 2B,C).
In Figure 3, the visual aspect of the different samples of chocolates is represented.

2.3. Chemical Analysis

2.3.1. Protein

Total nitrogen was determined by the Kjeldahl method (AOAC 970.22) [27] using a digestion unit (DK20, VelpScientifica, Usmate (MB), Italy) and a distillation unit (Kjeltec 8100, FOSS, Höganäs, Sweden). Protein content was calculated with a conversion factor of 6.25 and carried out in triplicate.

2.3.2. Fat

Fat was extracted by hot-solvent Soxhlet extraction with petroleum ether (AOAC 963.15) [27] in a FOSS ST 225 Soxtec apparatus. Extracts were dried at 100 °C for 90 min (Memmert DIN 40050 IP20, Schwabach, Germany), cooled, and weighed. The fat content was calculated and carried out in triplicate.

2.3.3. Total Sugars

Total sugars were quantified in triplicate through gravimetric after copper-oxide reduction (Munson & Walker method; Portuguese Standard NP 1419:1987) [28].

2.3.4. Total Dietary Fiber

Total dietary fiber was quantified in triplicate with the Megazyme kit K-TDFR-200A, based on AOAC 985.29 and AACC 32-05.01 [27]. It is determined on duplicate samples of dried and defatted (if fat content is >10%) material. Samples are cooked at 100 °C with heat-stable α-amylase to give gelatinization, hydrolysis, and depolymerization of starch; incubated at 60 °C with protease (to solubilize and depolymerize proteins) and amyloglucosidase (to hydrolyze starch fragments to glucose); and treated with four volumes of ethanol to precipitate soluble fiber and remove depolymerized protein and glucose (from starch). The residue is filtered, washed with ethanol and acetone, dried, and weighed. One duplicate is analyzed for protein, and the other is incubated at 525 °C to determine ash. The TDF is the weight of the filtered and dried residue less the weight of the protein and ash.

2.3.5. Preparation of Methanolic Extracts for TPC (2.3.6), DPPH (2.3.7), and ORAC (2.3.8)

For all antioxidant and phenolic determinations (TPC, DPPH, ORAC), methanolic extracts of the samples were prepared by extraction. Chocolate (0.20 g) was extracted with 20 mL of 80% methanol and centrifuged for 5 min at 15,000 rpm (Hettich MIKRO 200). Supernatants were kept at 4 °C until analysis.

2.3.6. Total Phenolic Content (TPC)

TPC was measured spectrophotometrically at 740 nm in a microplate reader (BMG LABTECH FLUOstar OPTIMA, Ortenberg, Germany) using the Folin–Ciocalteu reagent and sodium carbonate after 2 h of incubation in the dark. The results were expressed as mg gallic acid equivalents (GAE) per 100 g. The TPC was carried out in triplicate.

2.3.7. DPPH (2,2-Diphenyl-1-picrylhydrazyl)

Antioxidant activity was assessed at 517 nm after 30 min of reaction with DPPH, and data were expressed as µmol Trolox equivalents (TE) per 100 g. The measurements were carried out in triplicate per sample.

2.3.8. ORAC (Oxygen-Radical Absorbance Capacity)

ORAC was determined at 485 nm (excitation) and 520 nm (emission) using fluorescein as probe and 2,2′-Azobis (2-methylpropionamidine)dihydrochloride (AAPH) as radical generator. The results were expressed as µmol TE per 100 g, and the measurements were carried out in triplicate.

2.4. Colorimetric Analysis

The surface color (top and bottom) was measured with a Minolta CR-400 colorimeter (CIE L* a* b*), according to Coelho et al. (2021) [29]. The measurements were carried out in triplicate for both top and bottom.

2.5. Texture Analysis

Hardness was determined by penetration test on a Texture Analyzer TA-XT Plus (Stable Micro Systems, Godalming, UK) fitted with a 5 kg load cell and a 3 mm aluminum cylindrical probe. Test conditions were penetration depth of 20 mm, speed of 1.0 mm s−1, and temperature of 20 °C. The maximum force (N) was taken as the hardness. The samples were analyzed in triplicate.

2.6. Sensory Evaluation

A hedonic sensory test was carried out with untrained panelists (n = 32) using a nine-point scale (ISO 11136:2014) [30]. The panelists were invited via university email, according to the following characteristics: individuals of both sexes, of any age group, who are chocolate consumers. The invitation emails describe the product that would be tested to provide complete information to the panelists.
Samples, encoded with random letters forming three-digit codes, were served at room temperature under white light. Include the ethical approval reference number and panelist recruitment criteria. The sensory evaluation was performed by 11 men (34.4%) and 21 women (65.6%), aged between 16 and 65 years and belonging to Polytechnic Institute of Beja (IPBeja) (students and staff members), using a nine-point hedonic scale, from 1 “disliked extremely” to 9 “liked extremely”, with 5 “neither liked or disliked” to evaluate the parameters Appearance, Color, Aroma, Texture, Flavor and Overall acceptability. The panelists aged 16 years old were high school students undertaking a short-term internship at IPBeja.

2.7. Statistical Analysis and Hierarchical Clustering

Statistical analysis was performed using R software version 4.4.2. (GNU General Public License, Boston, MA, USA). One-way analysis of variance (ANOVA) was applied. When significant differences were detected (p < 0.05, i.e., with a 95% confidence level), Tukey’s post-hoc test was performed in all the parameters analyzed to identify statistically distinct groups among the different samples. Additionally, a principal component analysis (PCA) was performed, which is generally applied as the first tool to analyze multivariate data, to explore relationships among samples based on their compositional profiles, being very efficient in revealing the main contrasting regions in the plot. As such, the data from the two main principal components was plotted, considering all the different parameters analyzed. The loadings were analyzed, providing interpretation by showing positive and negative values to correlate or not with the variables. The hierarchical clustering dendrogram (Ward’s minimum variance method, Euclidean distance) and the plot of the clustering were also carried out in order to detect natural groupings among the different samples and to verify distinct clusters. Pearson’s and Spearman’s correlation coefficients were also calculated to evaluate the relationships among the variables (Pearson’s correlation measures the strength of linear associations assuming normally distributed data, whereas Spearman’s rank correlation is less sensitive to deviations from normality and outliers).

3. Results

3.1. Chemical Composition

3.1.1. Protein, Fat, Total Sugars, and Total Dietary Fiber

Protein, fat (lipids), total sugars, and total dietary fiber were assessed in control and chocolate samples with different percentages of grape pomace (red or white) (Figure 4). Significant differences were observed among samples for protein, lipids, total sugars, and total dietary fiber. Regarding protein content, the incorporation of red grape pomace showed a slight increase, most notably in Red_15 (7.2%), which was higher than the control (6.4%) and the samples containing white grape pomace (6.2–6.45%). For lipids, a gradual decrease was observed as the proportion of grape pomace increased, whether it was red or white. Indeed, the control chocolate showed the highest lipid content (36.5%), whereas “White_15” displayed the lowest (31.4%). Considering the total sugar content, Red_5 (36.3%) and Red_10 (36.6%) were significantly higher than the control (35.5%), whereas Red_15 (32.0%) had the lowest value. As with protein, the sugar content of the control was comparable to that of all white-pomace chocolates (5, 10, and 15%), ranging from 34.4 to 35.6%. On the other hand, fiber content increased by 10% and 15% grape pomace inclusion, regardless of the type (red or white). Nevertheless, white pomace at 15% showed the highest fiber content (43.1%), followed by Red_15 (35.6%), Red_10 (33.8%), and “White_10” (28%). No significant differences were found between the control (13.5%) and the 5% incorporation of red (15.6%) or white (17.1%) grape pomace in terms of fiber.
Therefore, to increase protein, red grape pomace at 15% should be used to fortify chocolate, while for maximizing dietary fiber, white grape pomace at 15% should be used.

3.1.2. Total Phenolic Content, DPPH Activity, and ORAC

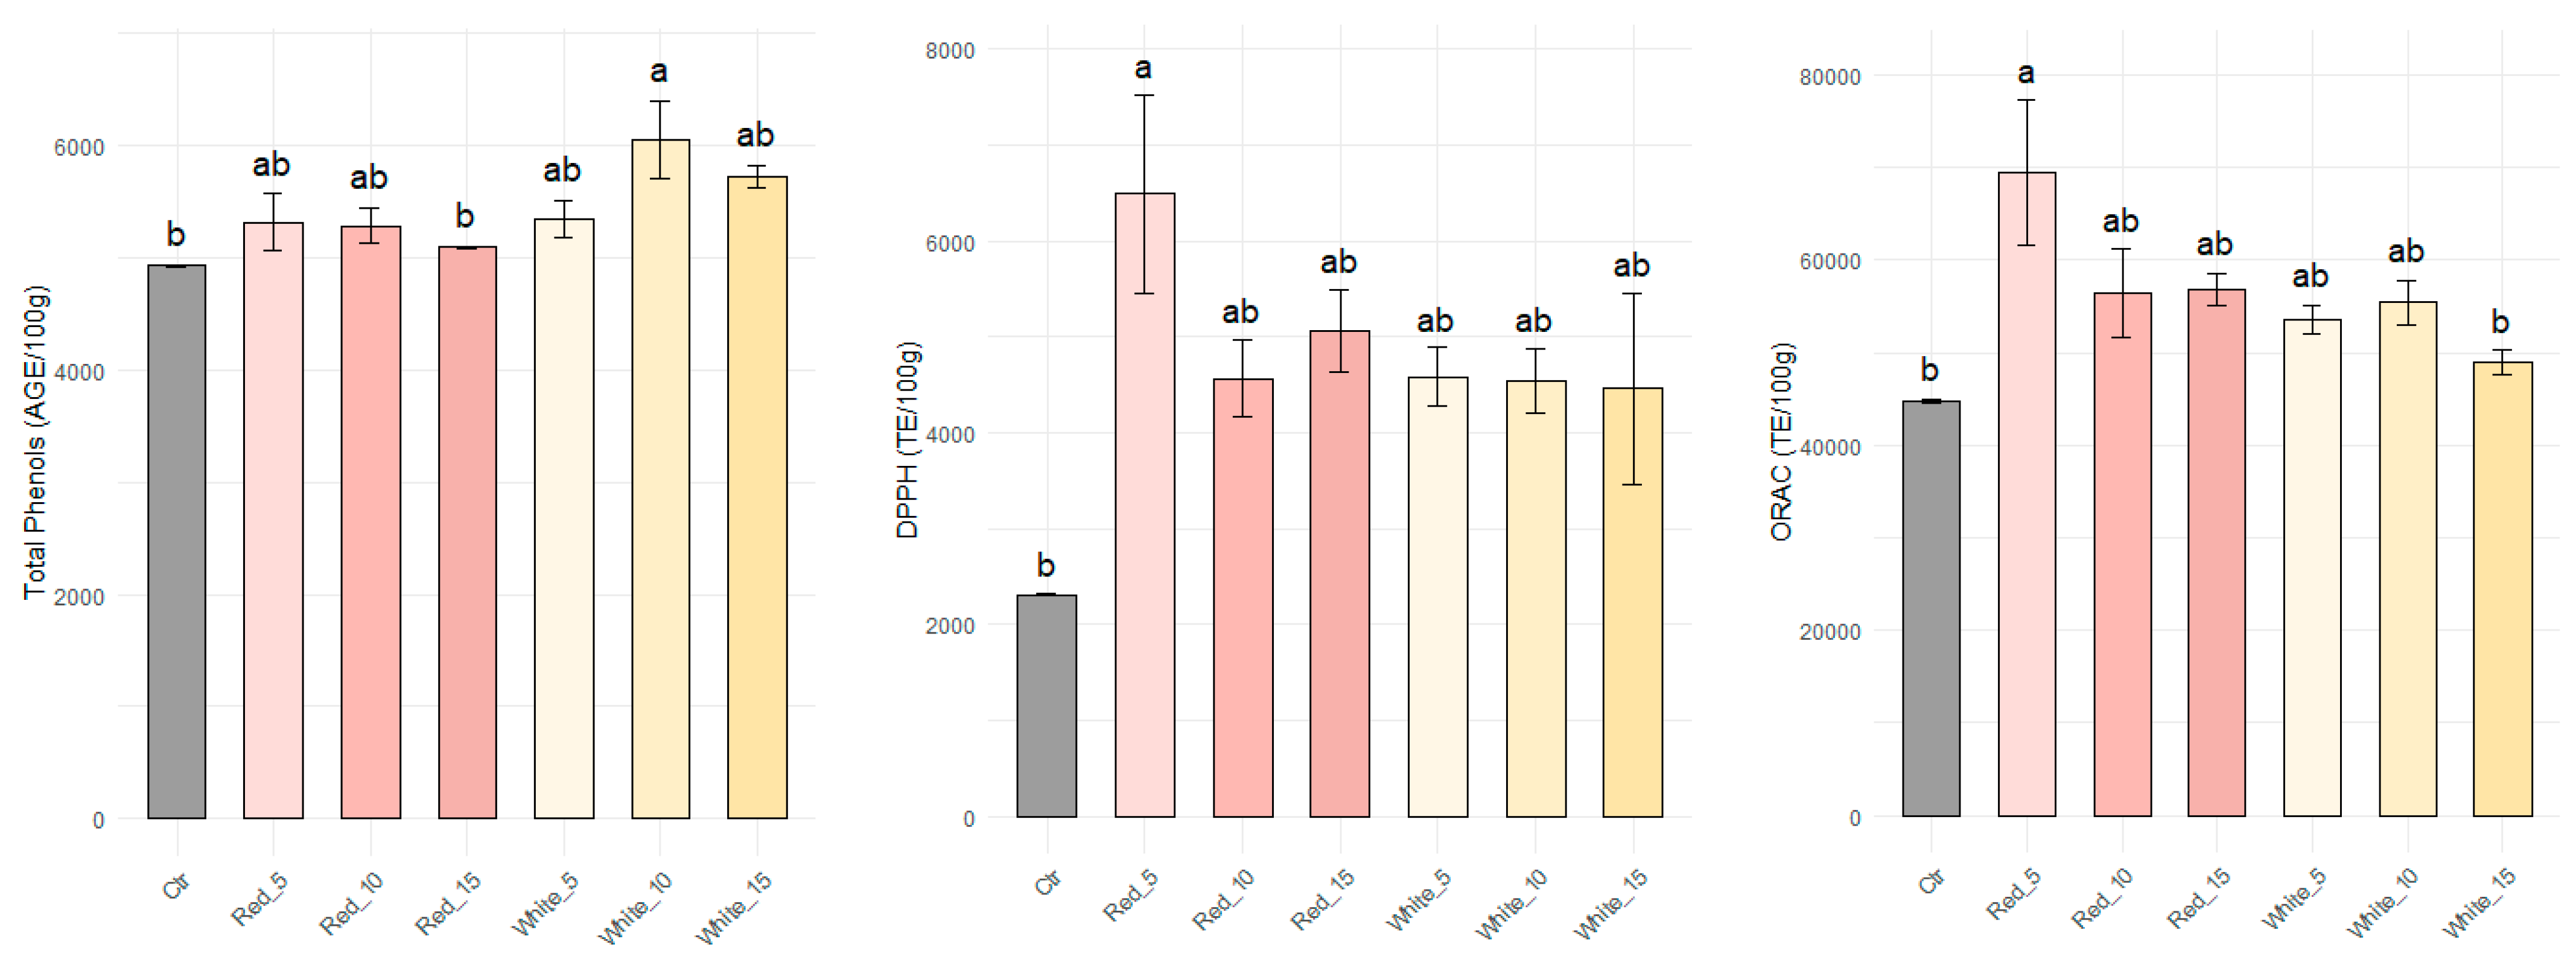
The total phenolic content, DPPH activity, and ORAC were assessed in control and chocolate samples with different percentages of grape pomace (red or white) (Figure 5). Overall, although some sample differences were not statistically significant, all chocolates enriched with grape pomace, whether red or white, displayed higher values than the control for total phenolic content, DPPH radical-scavenging activity, and ORAC. For total phenolic content, the highest level was recorded for “White_10” (6050 mg GAE/100 g). All other samples were also above the “ctr”, except “Red_15”, which was statistically equivalent to the “ctr” (4933 mg GAE/100 g). In fact, a clear trend can be observed: “White” > “Red” > “Control”. In DPPH activity, “Red_5” showed the greatest activity (6587 µmol TE/100 g), followed by “Red_15” (5061 µmol TE/100 g), “White_5” (4586 µmol TE/100 g), “Red_10” (4566 µmol TE/100 g), “White_10” (4537 µmol TE/100 g), “White_15” (4458 µmol TE/100 g), and finally the “control” (2312 µmol TE/100 g). In ORAC, the tendency was similar to DPPH activity for “Red_5” (69,483 µmol TE/100 g), and with a tendency of higher content of “Red_15”> “Red_10” > “White_10” > “White_5” > “White_15” > “Control”. The lowest ORAC and DPPH values were thus found in “White_15” and in the “ctr” sample. Moreover, overall, “White_10” showed the highest concentration of phenolic compounds, whereas “Red_5” maximized both DPPH and ORAC antioxidant activities.

3.2. Colorimetric Assessment

The colorimetric analysis was carried out for both upper and lower surfaces of the chocolates (control and fortified with red or white grape pomace flour at 5, 10, or 15% (w/w) (Table 2). Only the L* (lightness) value for the upper surface showed no significant difference from the control, remaining stable across all grape pomace incorporation (25.9–26.4). On the lower surface, “Red_10” and “Red_15” exhibited a slight decrease in L* (25.8–26.0), indicating a singly darker tone, whereas “White_5” registered the highest lightness (26.7). Chocolates enriched with white grape pomace (5, 10, and 15%) recorded the highest a* values on both the upper (5.20–5.33) and lower (5.38–5.62) surfaces of chocolates, suggesting a shift toward red, even though the flour itself contains no red pigments. In contrast, increasing the level of red grape pomace produced a progressive decline in a*, down to 4.43 (upper) and 4.58 (lower) in “Red_15”. For the b* parameter, adding red grape pomace intensified the negative values, whereas white grape pomace at 15% reduced the b* (−0.606 upper, −0.424 lower), leading to the neutral axis of the CIELAB space.

3.3. Texture Assessment

Texture analyses were carried out for control chocolate samples and the different samples of chocolate fortified with red or white grape pomace flour at different incorporations (5, 10, or 15%) (Figure 6). According to the data, the control chocolate showed higher hardness (27.3 N), which was statistically significant regarding the chocolate samples with different percentages of grape pomace (red or white). The incorporation of grape pomace, regardless of type (red or white) and incorporation (5, 10, or 15%), reduced chocolate hardness to a range of 17.7–20.3 N. In this context, “White_10” was the firmest formulation (20.3 N), while “Red_10” was the softest (17.7 N). Moreover, partially replacing with grape pomace flour in chocolates softens the product, compared with plain dark chocolate, yet the reduction in hardness is comparable across all samples of chocolate fortified with pomace.

3.4. Sensory Analysis

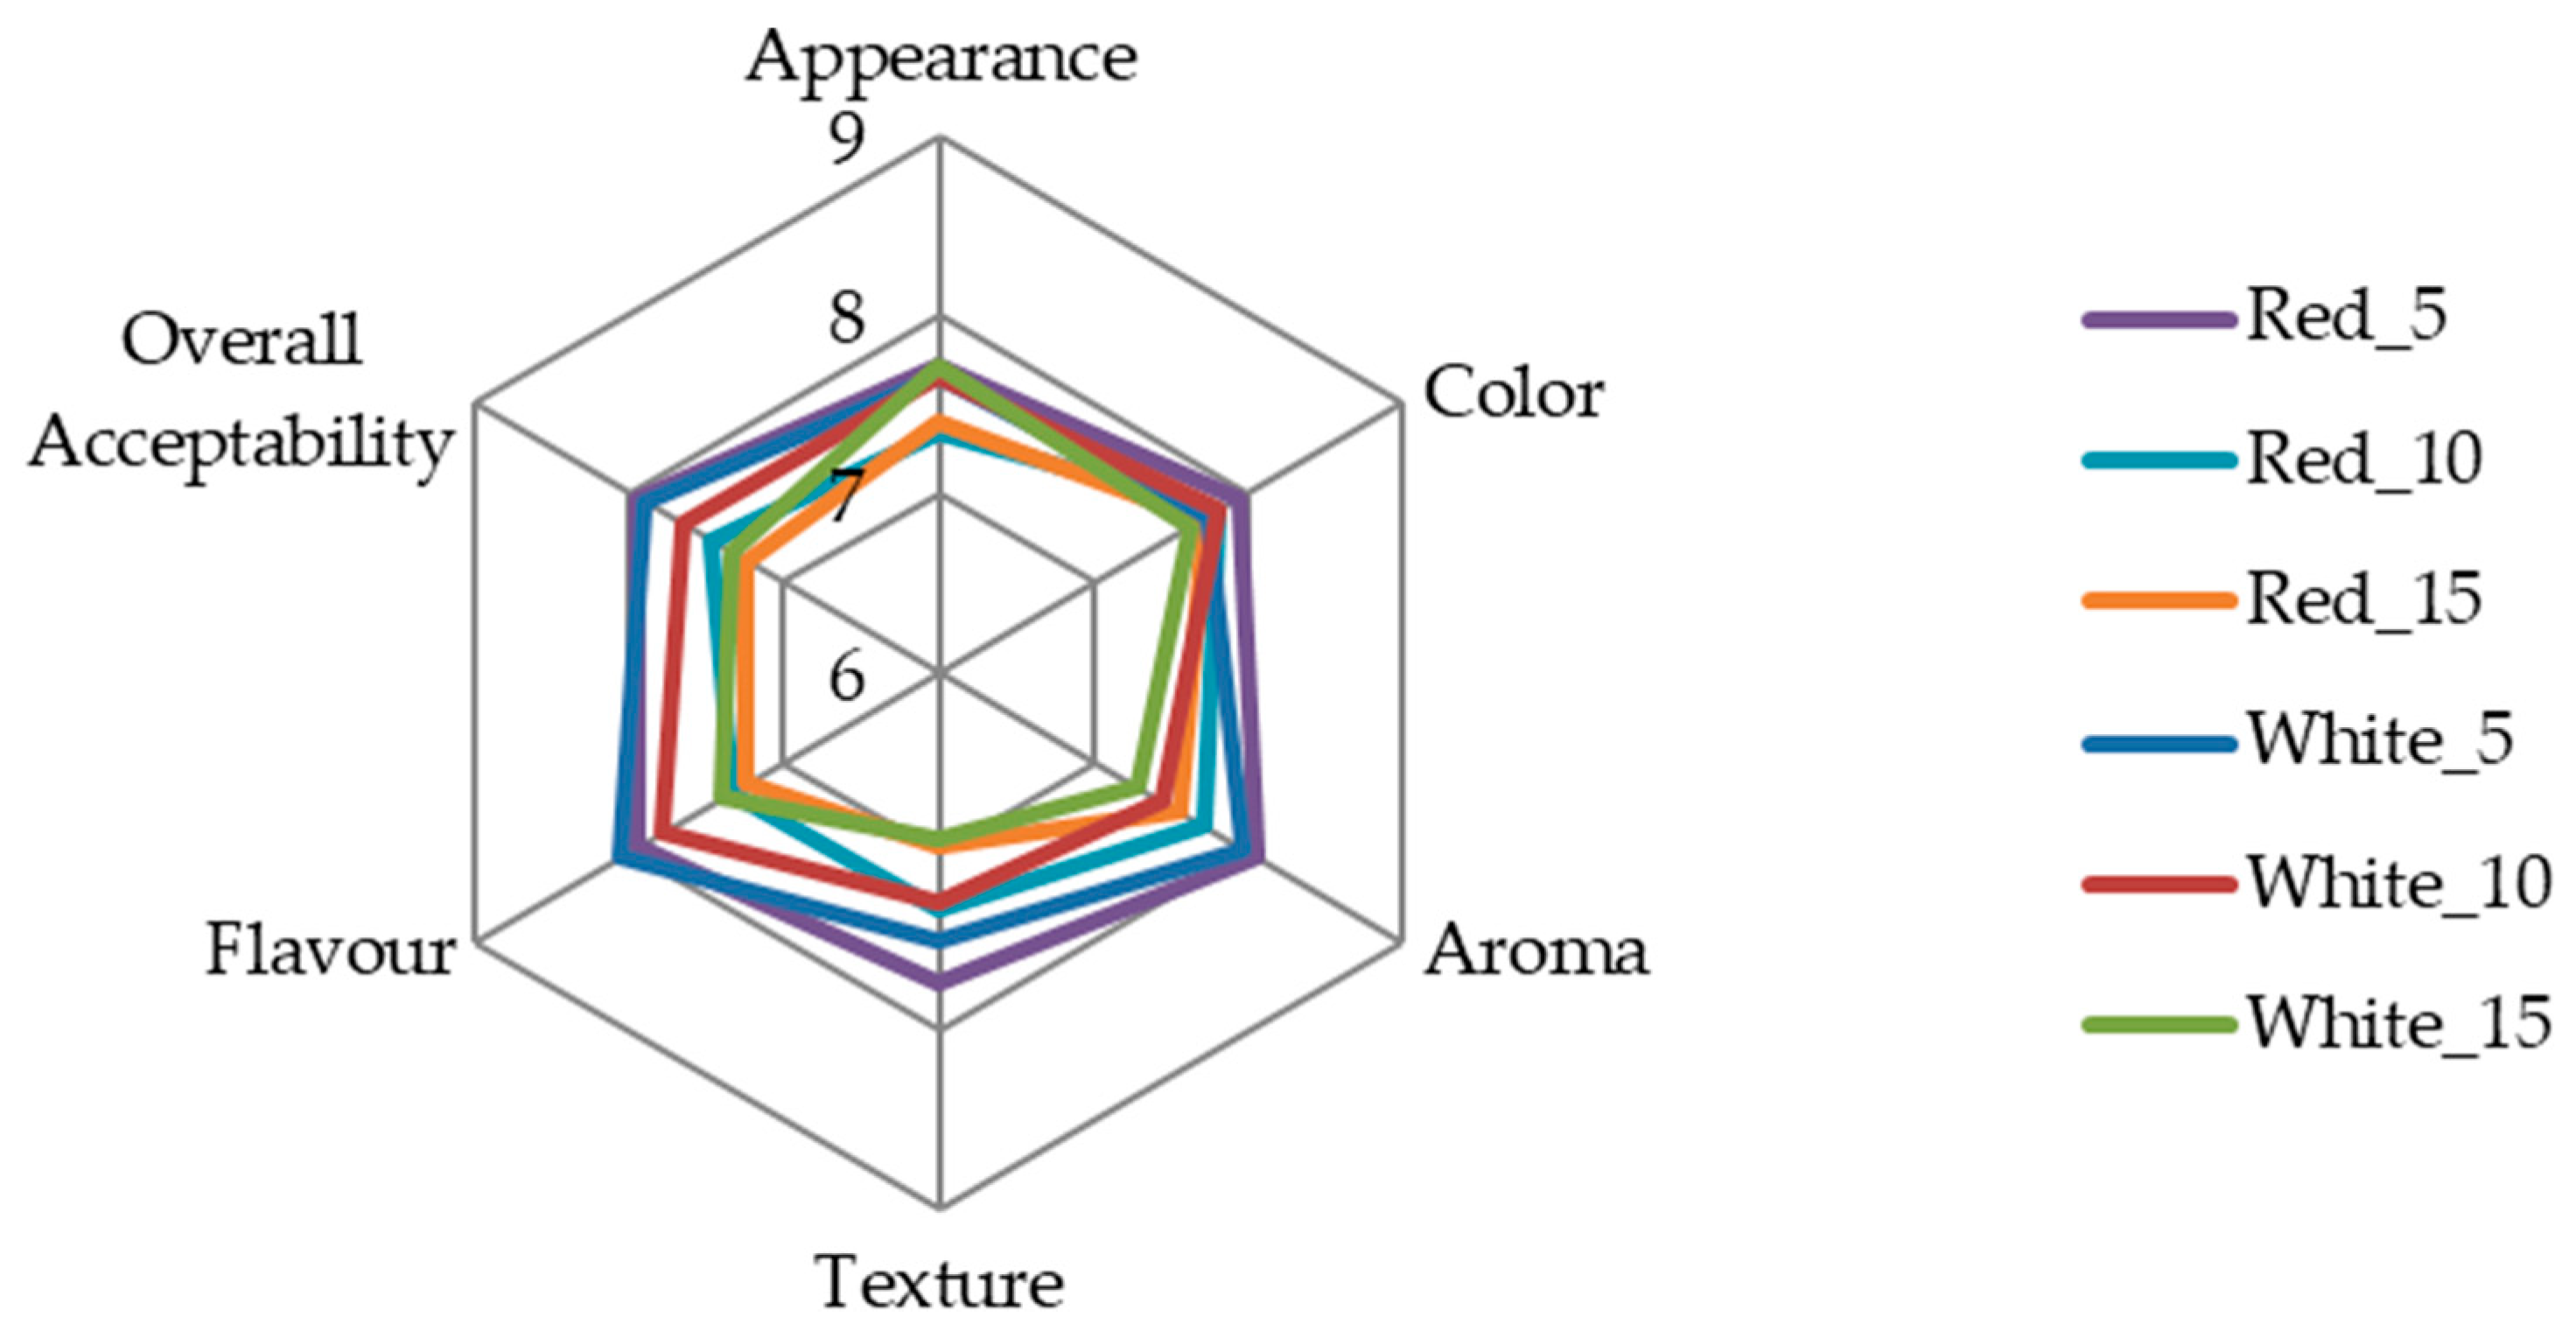
The sensory analysis of the chocolate samples was performed through a hedonic evaluation comparing chocolates with different concentrations of red and white grape pomace (Figure 7) to assess differences among the concentrations and the type of grape pomace.
Considering the different chocolate samples (Figure 7), appearance was consistently rated above 7 and color at 8, showing that the incorporation of grape pomace flours up to 15% did not affect visual quality. Texture scores fell from 8 (at 5% inclusion) to 7 (at 10% and 15%), suggesting that higher pomace levels make the chocolate slightly less appealing, probably due to a more granular mouthfeel. Additionally, at inclusion levels above 10%, flavor declined from 8 to 7 in “Red_10” and “Red_15”, whereas it remained at 8 in “White_10”. For aroma, the red pomace chocolates maintained a score of 8, while “White_10” and “White_15” dropped to 7. The overall acceptability was 8 for both 5% formulations and for “White_10”, but 7 for the remaining samples. Overall, white pomace kept a flavor score of 8 and an overall acceptability of 8 up to a 10% inclusion level, whereas red pomace showed a flavor decrease to 7 at the same concentration.
The panelists were also asked about their purchase intention regarding the fortified chocolates with grape pomace flour, with 87.5% expressing a positive response for the chocolates containing red grape pomace and 96.9% for those containing white grape pomace.

3.5. Principal Component Analysis and Hierarchical Clustering

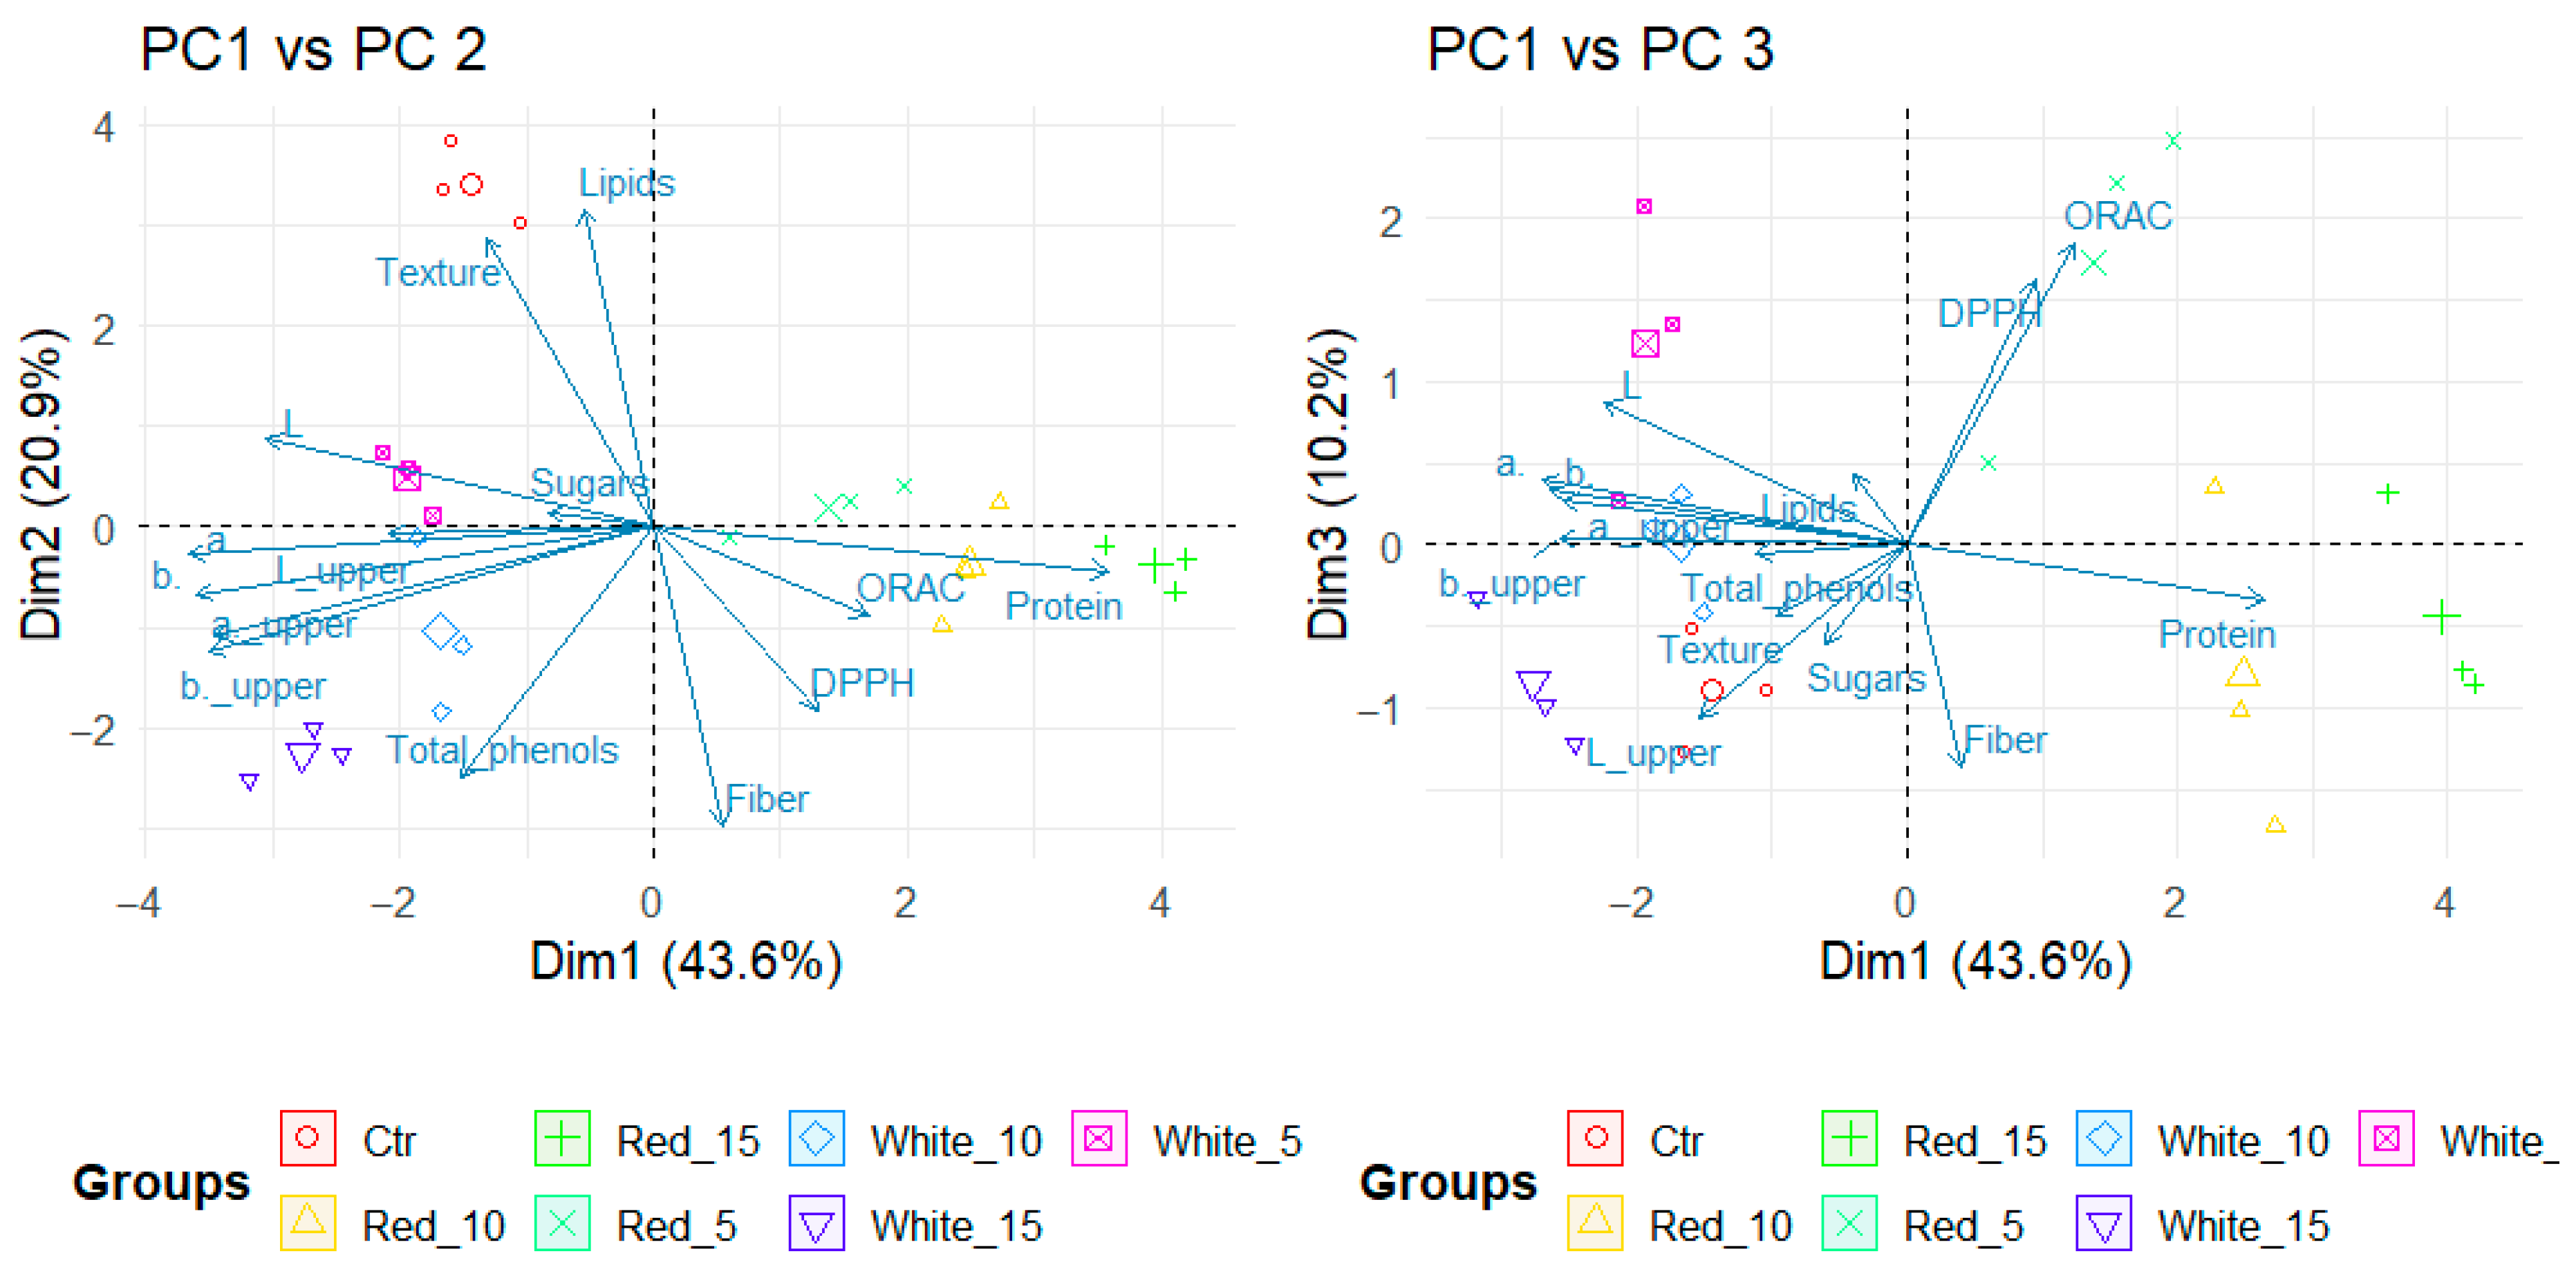
The principal component analysis (PCA) was performed (Figure 8) to evaluate the overall distribution of the samples based on the parameters analyzed. As such, Figure 8 shows two biplots: PC1 vs. PC2 and PC1 vs. PC3, with PC1 explaining 43.6% of the total variance, while PC2 and PC3 explain 20.9% and 10.2%, respectively. Indeed, the three principal components together account for 74.69% of the total variability in the dataset. Considering the “Ctr” (red circles), it clusters with higher lipid content and greater hardness while showing only weak associations with antioxidants and fiber. On the other hand, samples containing red grape pomace (5, 10, and 15%) are associated with protein and with DPPH and ORAC, and are comparatively less associated with lipids, separating them from the control. Regarding samples fortified with white grape pomace (5, 10, and 15%), load strongly on the colorimetric parameters, with “White_15” showing a pronounced association with fiber content. Notably, “Red_5” shows the strongest association to antioxidants (ORAC and DPPH), positioning it in the quadrant where both PC1 and PC3 are positive for these attributes. Also, “Red_10” appears to offer a balanced profile, being associated with protein, antioxidants, and color parameters.
Considering the PCA biplot (Figure 8) and the correlation between variables (Table 3), PC1 is associated with protein (0.951), ORAC (0.448), DPPH (0.346), and fiber (0.147), while PC2 is mainly associated with lipids (0.837) and texture (0.759). The PC3 appears to differentiate samples with high antioxidant content from those with higher fiber content and lower antioxidant activity.
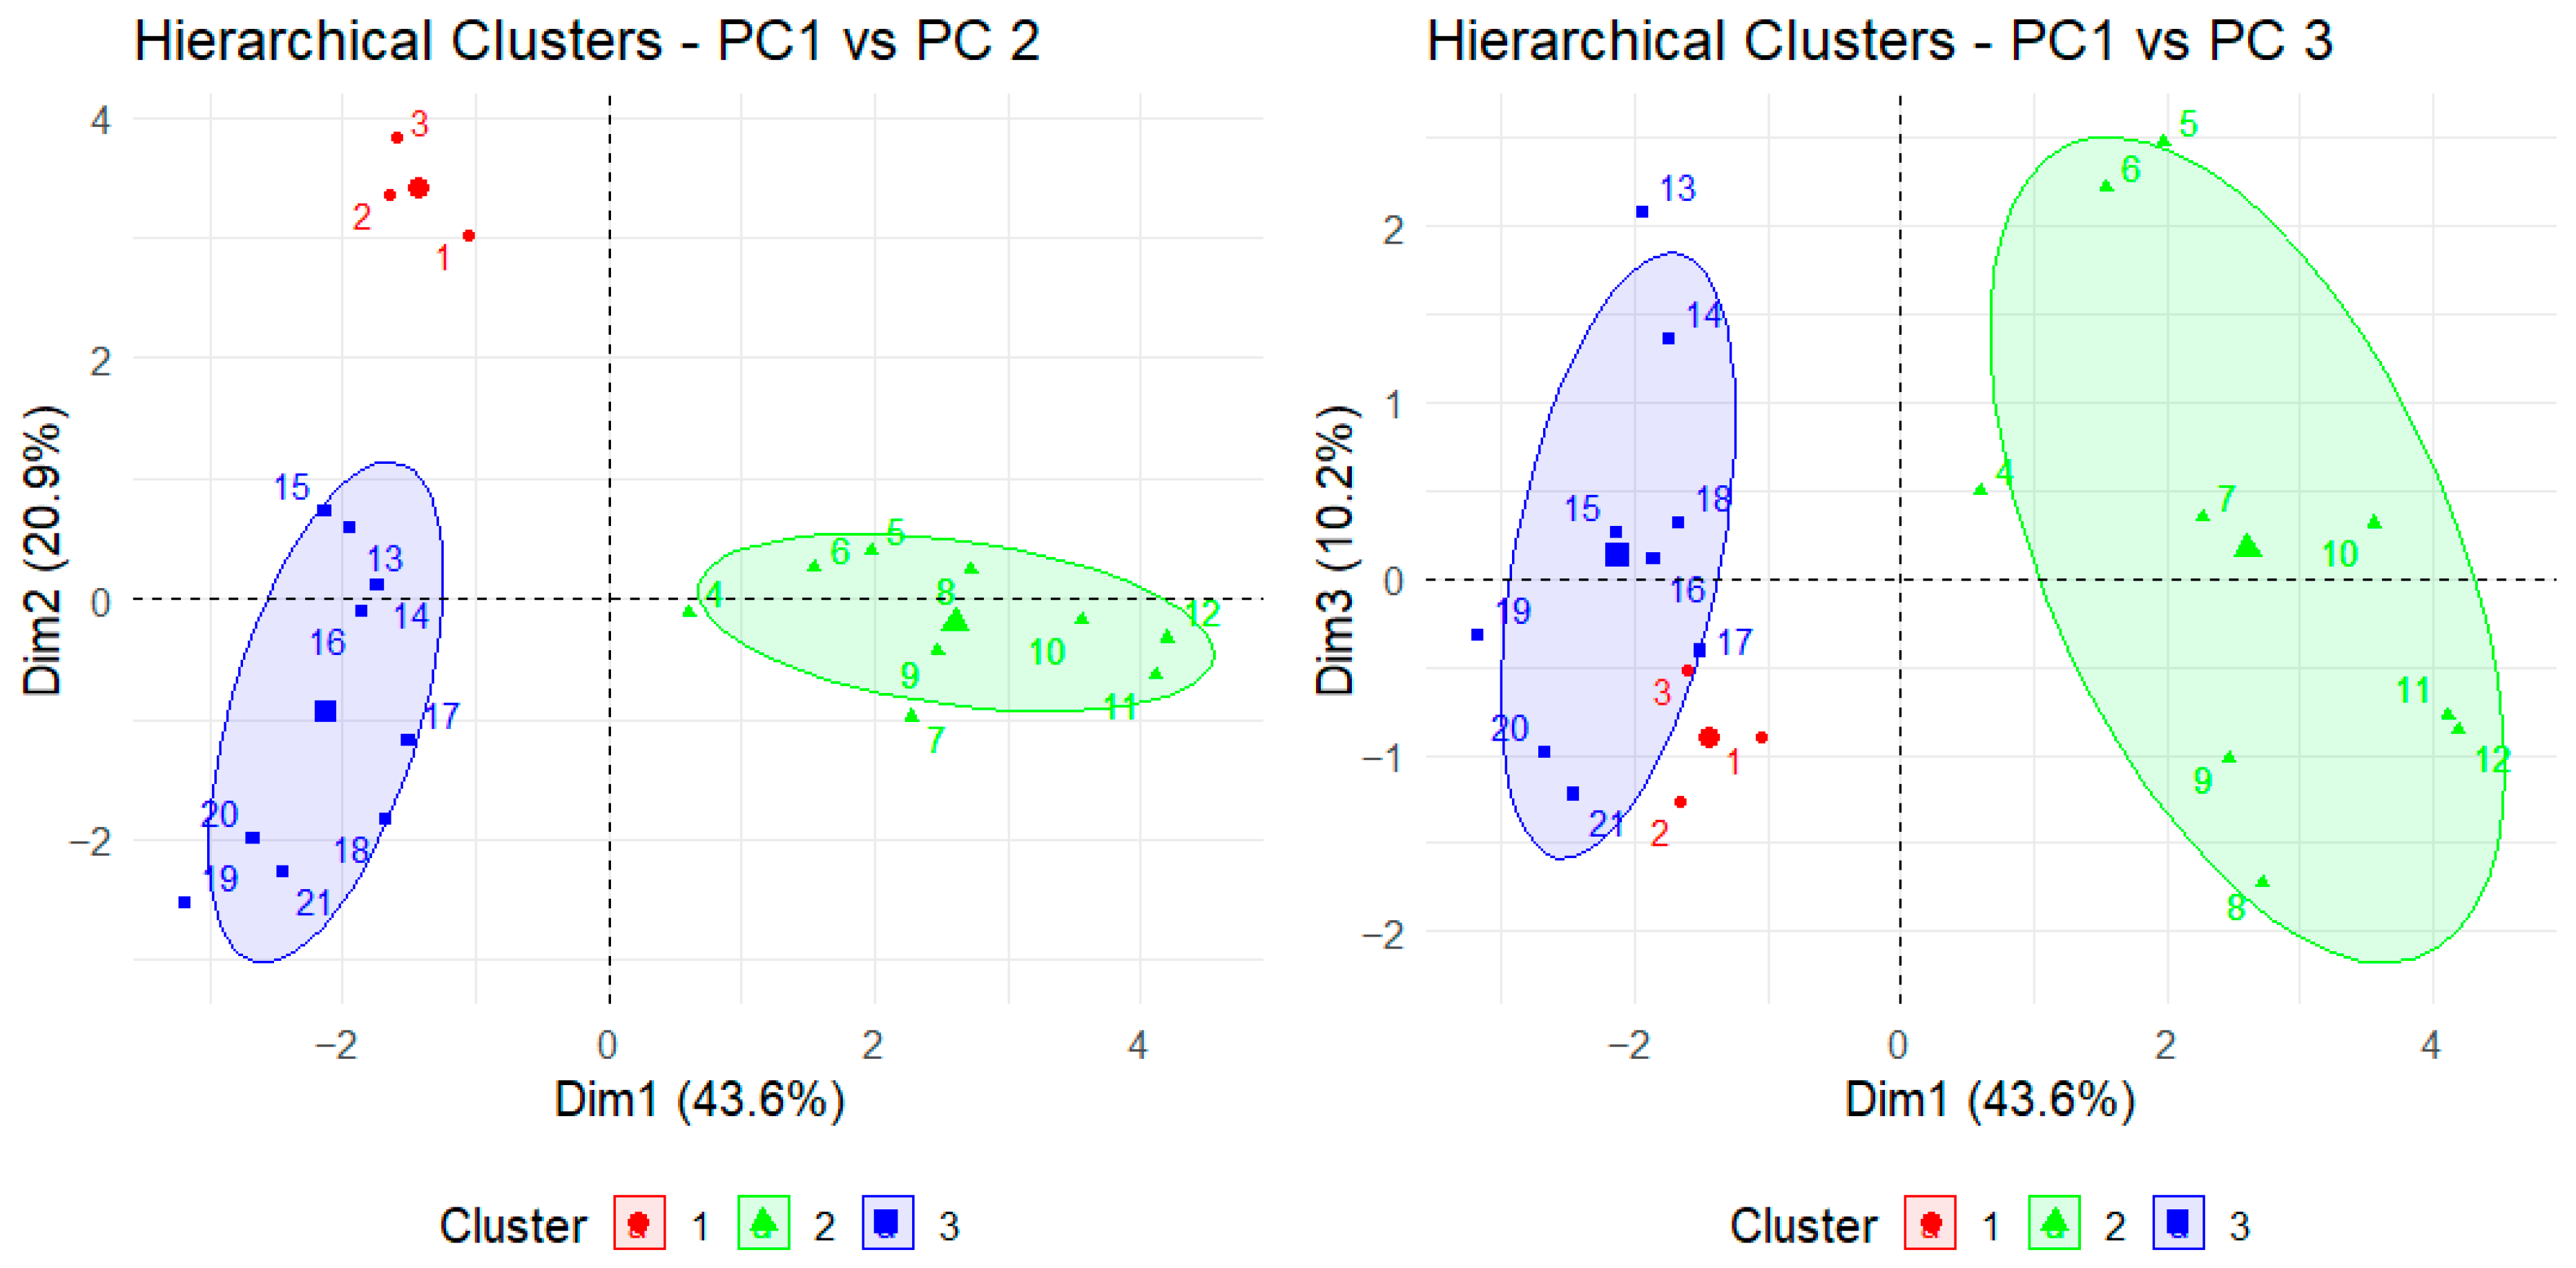
Considering Figure 9, it is possible to confirm three well-defined clusters in chocolates: the control, the different concentrations of red grape pomace, and the different concentrations of white grape pomace.
In Figure 10, the hierarchical clusters (PC1 vs. PC2 and PC1 vs. PC3) are represented, which can confirm the clusters observed in Figure 8. Additionally, Figure 10 can provide a clear validation of the hierarchical clusters in both PC1 vs. PC2 and PC1 vs. PC3, confirming that the compositional variables analyzed truly distinguish the sample groups (red = control; green = red grape pomace chocolates and blue = white grape pomace chocolates). Moreover, within the green and blue ellipses, the points spread gradually along PC2 and PC3, which illustrates how increasing pomace level shifts the formulations regarding fat and fiber (PC2) and affects antioxidants (PC3) (Figure 8 and Figure 10).
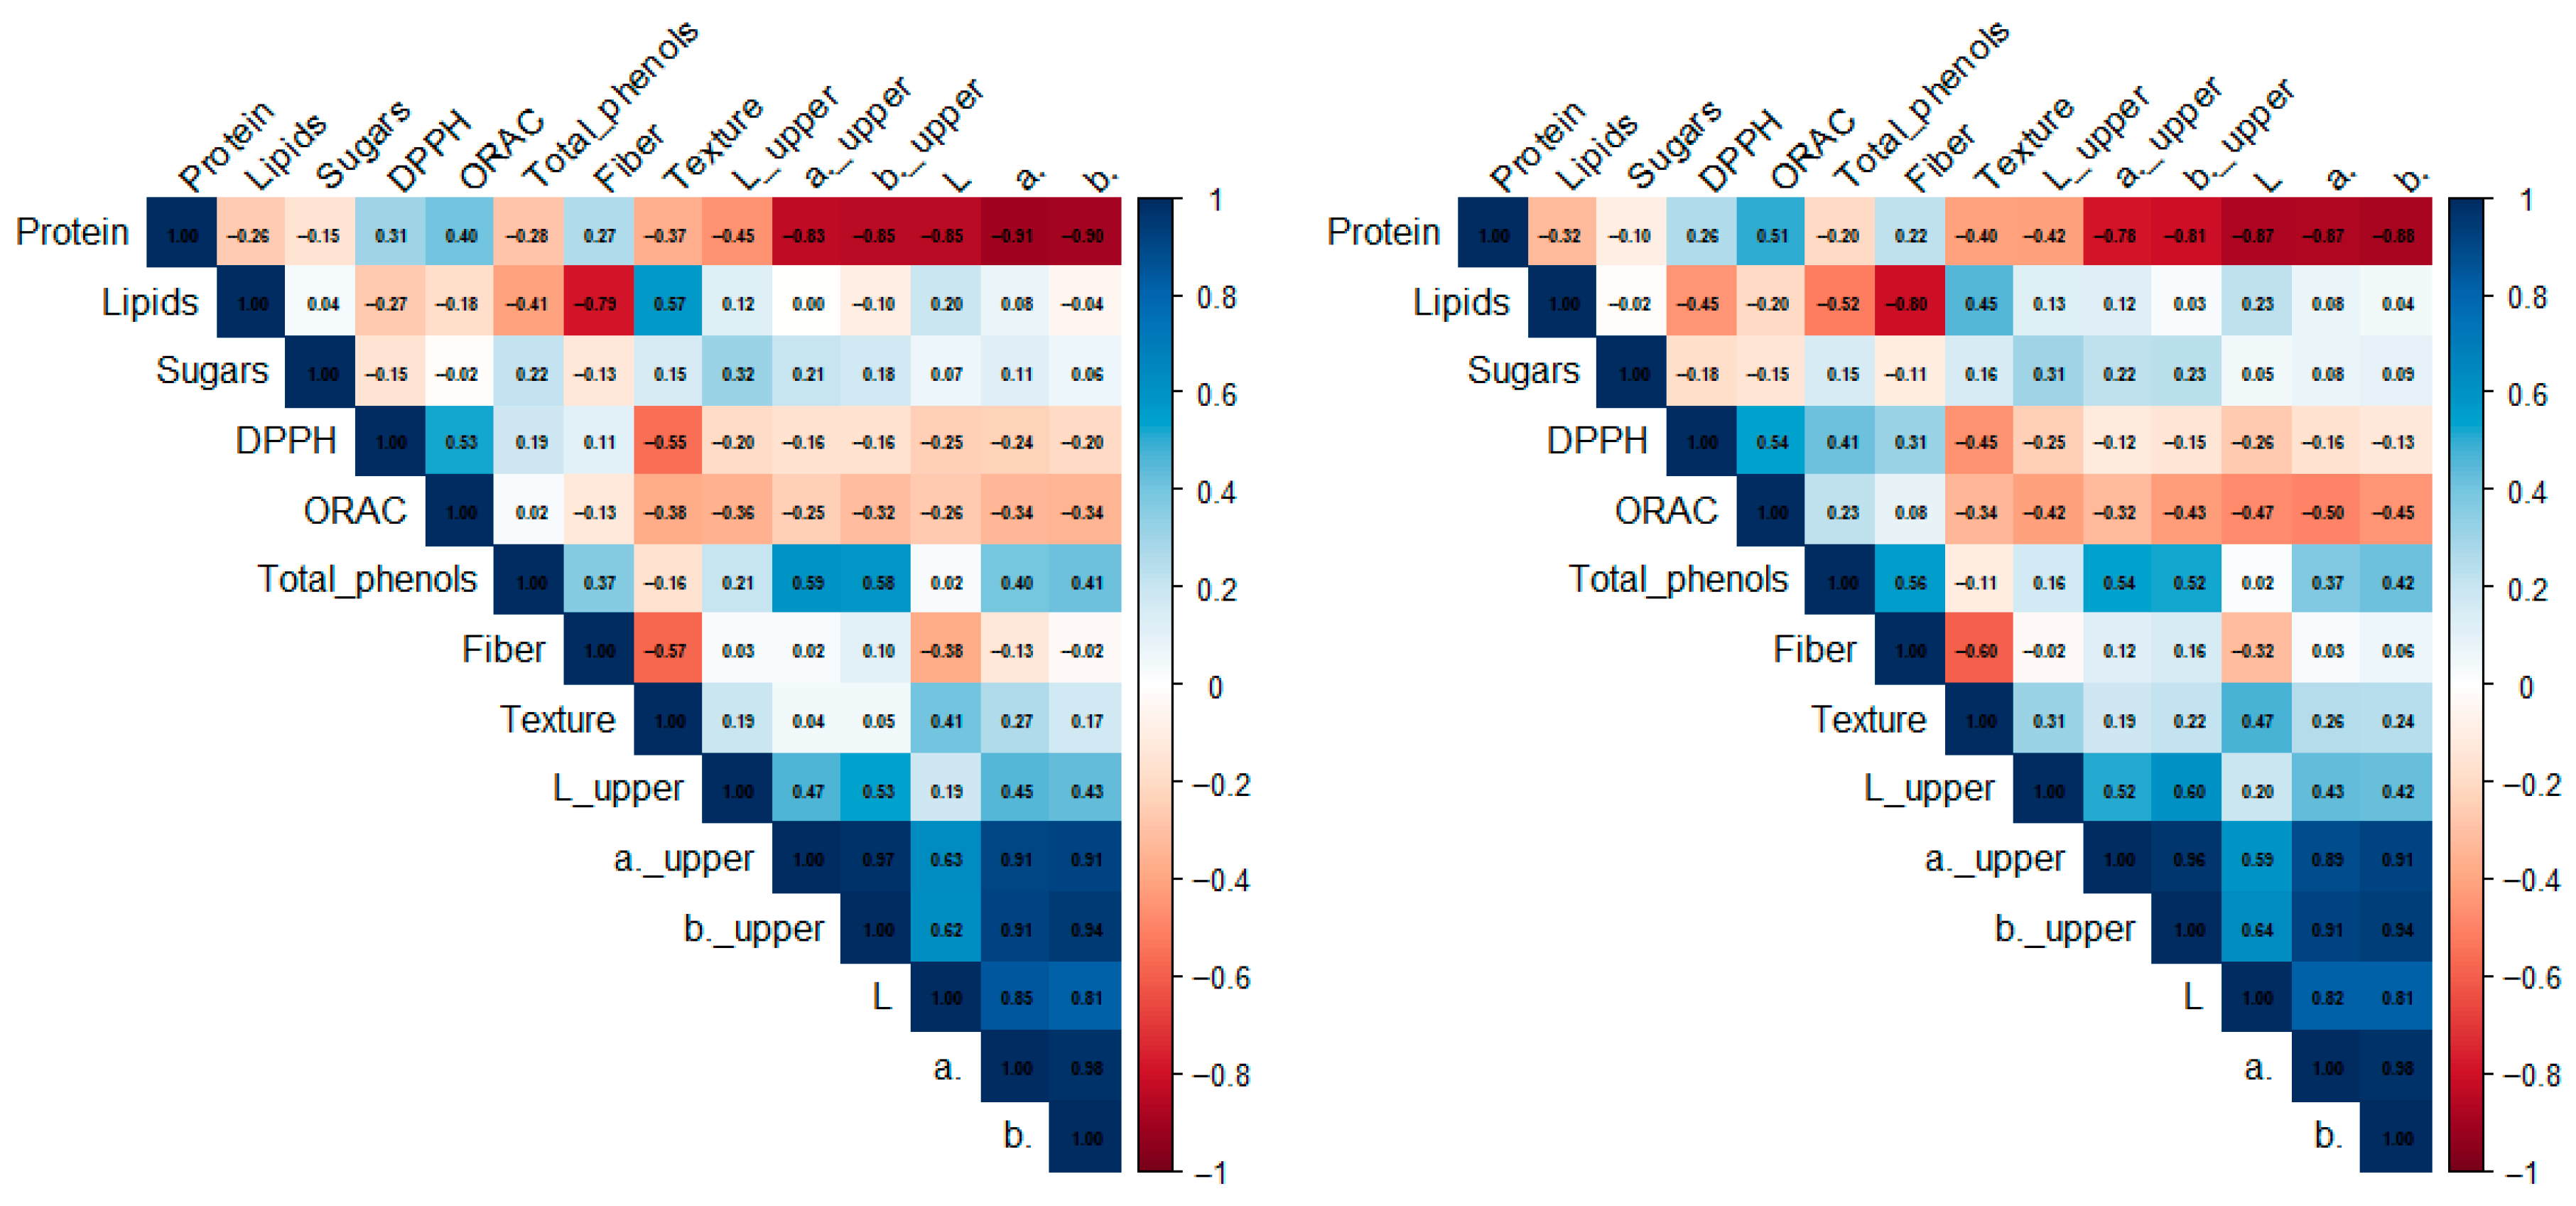
Figure 11 represents both Pearson’s and Spearman’s correlation coefficients, showing strong positive correlations between total phenolic content and DPPH and ORAC. The colorimetric parameters (L, a*, and b*) and their corresponding upper surface values were also highly intercorrelated, while texture showed only weak to moderate associations with the parameters analyzed. The similarities between the coefficients indicate that the observed relationships are robust and not strongly affected by deviations from normality or even potential outliers. Regarding DPPH and ORAC vs. fiber content, the correlation between them is weak, while fiber vs. phenolic content is even weaker. As such, fiber and total phenolics were not positively related, indicating that their functional roles in the formulations are distinct.

4. Discussion

Considering the chemical composition of the two organic grape pomace flours before the incorporation in chocolate (Table 1), the values were similar to the ones reported in the review of Lopes et al. [31], which indicates that protein content in Vitis vinifera grape pomace can varied between 5.38 and 12.34 g/100 g DW, lipids between 8.16 and 11.06 g/100 g DW, sugar content between 3.89 and 16.86 g/100 g DW and total dietary fiber between 46.7 and 65.56 g/100 g DW depending on different factors, namely the cultivar, viticulture practices, environmental, winemaking techniques, and methods [32,33].
The incorporation of grape pomace flour (red or white) into dark chocolate significantly affected the nutritional and functional profile of the new products. In fact, the winemaking (especially in maceration and yeast inoculation) influences the phenolic composition and antioxidant properties of grape pomace, with a shorter maceration or even absent for white cvs. and for several days in red cvs. [34]. The red grape pomace showed higher protein and sugar content, while white grape pomace can be used for maximizing dietary fiber (especially with 15%). Moreover, dietary fiber seems to have an increase in content with the increase in grape pomace incorporation regardless of the type (red or white), while in the remaining analysis (protein, total sugars, lipids, phenolic content, DPPH, and ORAC) that trend was not observed (i.e., higher incorporation leading to higher content). This can probably be due to some heterogeneity of grape pomace composition (skins, seeds, and residual pulp), which could have an impact on the results of especially phenolic content, DPPH, and ORAC (Figure 5), due to the different polyphenolic profiles in each component (skins, seeds, and residual pulp). In fact, according to Lopes et al. [31] the solid compositions of grape pomace is about 50% skin, 25% seeds, and 25% stalks, which can varied among the wine production, which each component (skin, seeds and stalks) have different content of fibers, sugars, lipids and protein (for instance, grape seeds have around 8.8% of protein according to Zanini et al. [32]). Moreover, according to Zivkovic et al. [35] study, yeast inoculation and maceration did not benefit the phenolic content relatively to the natural fermentation, being the opposite verified in our study when grape pomace was used for chocolate enrichment (Figure 5).
All chocolates enriched with grape pomace (red or white) showed higher values than the control for total phenolic content, DPPH, and ORAC (Figure 5), in accordance with the literature, which reported that grape pomace is high in antioxidant compounds and phenolic compounds [3]. Also, red grape pomace, in general presented higher content of phenolic compounds relative to white grape pomace, which can also be dependent on the cultivar [33], being verified in our data (Figure 5) only for DPPH and ORAC, specially for “Red_5”, while for total phenolic content a significant value were observed for white grape pomace (“White_10”).
The colorimetric parameters showed (Table 2) a slight decrease in lightness in “Red_10” and “Red_15” in the L parameter, indicating a darker appearance. This is probably due to the pigmentation of anthocyanins presented in red grape pomace, being the most abundant polyphenolic compounds in colored grapes, contributing to the red, purple, and blue pigmentation [14], but was not identified in “Red_5”, probably due to the low incorporation level into the chocolates. Regarding the a* parameter (Table 2), associated with redness, it showed an unexpected trend, with chocolates fortified with white grape pomace exhibiting significantly higher values of this parameter compared to red grape pomace. These results can probably be due to the fact that white grape pomace lacks anthocyanins; the heating of chocolate can lead to the formation of dark Maillard reaction products as a consequence of reducing sugars and amino acids [16]. Also, this could be due to the drying process of the white grape pomace, which could caramelize, which visually shifts the color towards the red axis of the CIELab color space. On the other hand, b* parameters (Table 2) showed consistent values with natural coloring tendencies of each type (red or white), with red grape pomace incorporation showing more bluish tones and with white grape pomace showing values closer to neutral.
The fortification of grape pomace flour to dark chocolate significantly influenced the texture of the final product in terms of hardness (Figure 6), with all the chocolate fortified showing a similar hardness and lower than the control, indicating that grape pomace flour, independently of the type (red or white), softens the product. This tendency can probably be attributed to the partial displacement of cocoa solids and fat, being a key contributor to the structural integrity and firmness of chocolate; as such, grape pomace flour (rich in dietary fiber and low in lipids) (Figure 4) can disrupt the crystalline network of cocoa, leading to the softer texture. Similar texture softening has been reported in studies where grape pomace (rich in fiber) affected firmness in chocolate spreads [25] and flow properties when grape pomace is used as a bulking agent in compound chocolate [26]. And also in the studies where the reduction in the percentage of cocoa [36] or the incorporation of fibers into the chocolate [37] caused a reduction in the hardness of the chocolate.
The sensory analysis revealed that the incorporation of grape pomace flour into dark chocolate up to 15% (w/w) was well tolerated by the panel that performed the hedonic evaluation, especially at lower inclusion levels (Figure 7). However, at higher inclusion levels of grape pomace (particularly at 15%), texture scores decreased, suggesting that the increased fiber may have contributed to a more granular mouthfeel. This effect of preference for low inclusion levels has also been verified in Nakov et al.’s (2020) study [16]. Additionally, the purchase intention results were high, with 87.5% of participants expressing a disposition to purchase red grape pomace chocolates and 96.9% for white grape pomace chocolates, indicating that consumers are open to functional products when sensory quality is preserved.
The results of the Principal Component Analysis (Figure 8 and Table 3) indicate a good representation of the dataset, the PC1 strongly associated with protein, ORAC, and DPPH, and PC2 associated with lipids and texture and clearly separating control samples. Moreover, associated also with the hierarchical clustering (Figure 9 and Figure 10), considering the “Ctr” (red circles), it appears to be associated with higher fat content (Figure 4) and hardness (Figure 6), while showing low association with antioxidants (Figure 5) and fiber (Figure 4).
Overall, it is possible to verify that PCA analysis can be confirmed by our data, with red grape pomace samples (5, 10, and 15%) being associated with protein (Figure 4), DPPH, and ORAC (Figure 5), and having a lower association with lipid content (Figure 4), thus differentiating from the control. The white grape pomace samples (5, 10, and 15%) have different associations, namely with the colorimetric parameters (Table 2), with “White_15” standing out due to its strong association with fiber content (Figure 4) and “Red_5” being the sample most strongly associated with antioxidants (ORAC and DPPH) (Figure 5) showing significantly higher values. On the other hand, “Red_10” appears to be associated with a balanced profile between protein (Figure 4), antioxidants (Figure 5), and color (Table 2). In this context, it is possible to verify consistent tendencies among the analyses carried out.

5. Conclusions

The fortification of dark chocolate with organic grape pomace flours from red (cv. Syrah) and white (cv. Arinto) significantly improved the nutritional profile of the final product. The inclusion of grape pomace flours increased dietary fiber, protein, DPPH, and ORAC, with “White_15” standing out for fiber content, “Red_15” for protein content, and “Red_5” for ORAC and DPPH values. Moreover, the fiber content was the only parameter showing a tendency of increasing consistently with the increase in the inclusion level, regardless of the grape pomace type. Texture softening was observed in all fortified chocolates independently of the incorporation level or type (red or white). Multivariate analysis (PCA and hierarchical clustering) confirmed that the inclusion of grape pomace differentiates the formulations from the control samples, supporting the impact of this fortification strategy on chocolate composition. The sensory evaluation revealed good acceptability across all samples, particularly at lower inclusion levels, and showed high purchase intention among panelists. These findings reinforce the potential of grape pomace as a valuable ingredient in functional chocolate production, aligning with circular economy principles by adding nutritional value to a food matrix while contributing to waste valorization in the winemaking sector.

Author Contributions

Conceptualization and methodology, D.F., A.R.F.C., J.D., O.A. M.S. and C.R.; formal analysis, D.F., A.R.F.C., M.F. and A.C.M.; writing—original draft preparation, D.F. and A.R.F.C.; writing—review and editing, D.F., A.R.F.C., J.D., O.A. and M.S. All authors have read and agreed to the published version of the manuscript.

Funding

The authors acknowledge the R&D Unit GEOBIOTEC-UID/04035: GeoBioCiências, GeoTecnologias e GeoEngenharias the R&D unit MED—Mediterranean Institute for Agriculture, Environment and Development (https://doi.org/10.54499/UIDB/05183/2020; https://doi.org/10.54499/UIDP/05183/2020), and the Associate Laboratory CHANGE—Global Change and Sustainability Institute (https://doi.org/10.54499/LA/P/0121/2020).

Institutional Review Board Statement

Not applicable.

Informed Consent Statement

Not applicable.

Data Availability Statement

The original contributions presented in this study are included in the article. Further inquiries can be directed to the corresponding author(s).

Acknowledgments

The authors would like to acknowledge the support of the company Herdade dos Lagos (Beja-Portugal) for the free provision of grape pomace and the company Sugar Bloom Lda. (Beja-Portugal) for the free provision of chocolate.

Conflicts of Interest

The authors declare no conflicts of interest.

References

  1. Bordiga, M.; Travaglia, F.; Locatelli, M. Valorisation of grape pomace: An approach that is increasingly reaching its maturity–a review. Int. J. Food Sci. Technol. 2019, 54, 933–942. [Google Scholar] [CrossRef]
  2. Gómez-Brandón, M.; Lores, M.; Insam, H.; Domínguez, J. Strategies for recycling and valorization of grape marc. Crit. Rev. Biotechnol. 2019, 39, 437–450. [Google Scholar] [CrossRef]
  3. Beres, C.; Costa, G.N.S.; Cabezudo, I.; da Silva-James, N.K.; Teles, A.S.C.; Cruz, A.P.G.; Mellinger-Silva, C.; Tonon, R.V.; Cabral, L.M.C.; Freitas, S.P. Towards integral utilization of grape pomace from winemaking process: A review. Waste Manag. 2017, 68, 581–594. [Google Scholar] [CrossRef] [PubMed]
  4. Brezoiu, A.; Matei, C.; Deaconu, M.; Stanciuc, A.-M.; Trifan, A.; Gaspar-Pintiliescu, A.; Berger, D. Polyphenols extract from grape pomace. Characterization and valorisation through encapsulation into mesoporous silica-type matrices. Food Chem. Toxicol. 2019, 133, 110787. [Google Scholar] [CrossRef] [PubMed]
  5. Zhang, H.; Wang, H.; Cao, X.; Wang, J. Preparation and modification of high dietary fiber flour: A review. Food Res. Int. 2018, 113, 24–35. [Google Scholar] [CrossRef]
  6. Llobera, A.; Cañellas, J. Dietary fibre content and antioxidant activity of Manto Negro red grape (Vitis vinifera): Pomace and stem. Food Chem. 2007, 101, 659–666. [Google Scholar] [CrossRef]
  7. Chiavaroli, A.; Balaha, M.; Acquaviva, A.; Ferrante, C.; Cataldi, A.; Menghini, L.; Rapino, M.; Orlando, G.; Brunetti, L.; Leone, S.; et al. Phenolic Characterization and Neuroprotective Properties of Grape Pomace Extracts. Molecules 2021, 26, 6216. [Google Scholar] [CrossRef] [PubMed]
  8. Almanza-Oliveros, A.; Bautista-Hernández, I.; Castro-Lopez, C.; Aguilar-Zárate, P.; Meza-Carranco, Z.; Rojas, R.; Michel, M.; Martínez-Ávila, G.C.G. Grape Pomace—Advances in Its Bioactivity, Health Benefits, and Food Applications. Foods 2024, 13, 580. [Google Scholar] [CrossRef]
  9. Tikhonova, A.; Ageeva, N.; Globa, E. Grape pomace as a promising source of biologically valuable components. BIO Web Conf. 2021, 34, 06002. [Google Scholar] [CrossRef]
  10. Mainente, F.; Menin, A.; Alberton, A.; Zoccatelli, G.; Rizzi, C. Evaluation of the sensory and physical properties of meat and fish derivatives containing grape pomace powders. Int. J. Food Sci. Technol. 2018, 54, 952–958. [Google Scholar] [CrossRef]
  11. Tseng, A.; Zhao, Y. Wine grape pomace as antioxidant dietary fibre for enhancing nutritional value and improving storability of yogurt and salad dressing. Food Chem. 2013, 138, 356–365. [Google Scholar] [CrossRef]
  12. Rainero, G.; Bianchi, F.; Rizzi, C.; Cervini, M.; Giuberti, G.; Simonato, B. Breadstick fortification with red grape pomace: Effect on nutritional, technological and sensory properties. J. Sci. Food Agric. 2022, 102, 2545–2552. [Google Scholar] [CrossRef]
  13. Hayta, M.; Özuğur, G.; Etgü, H.; Şeker, İ.T. Effect of Grape (Vitis vinifera L.) Pomace on the Quality, Total Phenolic Content and Anti-Radical Activity of Bread. J. Food Process. Preserv. 2014, 38, 980–986. [Google Scholar] [CrossRef]
  14. Šporin, M.; Avbelj, M.; Kovač, B.; Možina, S.S. Quality characteristics of wheat flour dough and bread containing grape pomace flour. Food Sci. Technol. Int. 2018, 3, 251–263. [Google Scholar] [CrossRef]
  15. Hoye, C.J.; Ross, C.F. Total phenolic content, consumer acceptance, and instrumental analysis of bread made with grape seed flour. J. Food Sci. 2011, 76, S428–S436. [Google Scholar] [CrossRef]
  16. Nakov, G.; Brandolini, A.; Hidalgo, A.; Ivanova, N.; Stamatovska, V.; Dimov, I. Effect of grape pomace powder addition on chemical, nutritional and technological properties of cakes. LWT Food Sci. Technol. 2020, 134, 109950. [Google Scholar] [CrossRef]
  17. Aivalioti, M.; Cossu, R.; Gidarakos, E. New opportunities in industrial waste management. Waste Manag. 2014, 34, 1737–1738. [Google Scholar] [CrossRef] [PubMed]
  18. Granato, D.; Branco, G.F.; Nazzaro, F.; Cruz, A.G.; Faria, J.A.F. Functional Foods and Nondairy Probiotic Food Development: Trends, Concepts, and Products. Compr. Rev. Food Sci. Food Saf. 2010, 9, 292–302. [Google Scholar] [CrossRef]
  19. Rimbach, G.; Melchin, M.; Moehring, J.; Wagner, A.E. Polyphenols from Cocoa and Vascular Health—A Critical Review. Int. J. Mol. Sci. 2009, 10, 4290–4309. [Google Scholar] [CrossRef] [PubMed]
  20. Ackar, D.; Lendi, K.; Valek, M.; Subari, D.; Borislav, M.; Babic, J.; Nedic, I. Review Article: Cocoa Polyphenols: Can We Consider Cocoa and Chocolate as Potential Functional Food? J. Chem. 2013, 2013, 289392. [Google Scholar] [CrossRef]
  21. Khan, N.; Khymenets, O.; Urpí-Sardà, M.; Tulipani, S.; Garcia-Aloy, M.; Monagas, M.; Mora-Cubillos, X.; Llorach, R.; Andres-Lacueva, C. Cocoa Polyphenols and Inflammatory Markers of Cardiovascular Disease. Nutrients 2014, 6, 844–880. [Google Scholar] [CrossRef]
  22. Efraim, P.; Alves, A.B.; Jardim, D. Review: Polyphenols in cocoa and derivatives: Factors of variation and health effects. Braz. J. Food Technol. 2011, 14, 181–201. [Google Scholar] [CrossRef]
  23. Vinson, J.A.; Proch, J.; Zubik, L. Phenol antioxidant quantity and quality in foods: Cocoa, dark chocolate, and milk chocolate. J. Agric. Food Chem. 1999, 47, 4821–4824. [Google Scholar] [CrossRef] [PubMed]
  24. Lee, K.W.; Kim, Y.J.; Lee, H.J.; Lee, C.Y. Cocoa has more phenolic phytochemicals and a higher antioxidant capacity than teas and red wine. J. Agric. Food Chem. 2003, 51, 7292–7295. [Google Scholar] [CrossRef] [PubMed]
  25. Acan, B.G.; Kılıclı, M.; Bursa, K.; Toker, O.S.; Palabiyik, I.; Gulcu, M.; Yaman, M.; Gunes, R.; Konar, N. Effect of grape pomace usage in chocolate spread formulation on textural, rheological and digestibility properties. LWT Food Sci. Technol. 2021, 138, 110451. [Google Scholar] [CrossRef]
  26. Bursa, K.; Kilicli, M.; Toker, O.S.; Palabiyik, I.; Gulcu, M.; Yaman, M.; Kian-Pour, N.; Konar, N. Formulating and studying compound chocolate with adding dried grape pomace as a bulking agent. J. Food Sci. Technol. 2022, 59, 1704–1714. [Google Scholar] [CrossRef]
  27. Helrich, K. Official Methods of Analysis of the Association of Official Analytical Chemists, 15th ed.; AOAC Inc.: Arlington, VA, USA, 1990; Volume I and II, ISBN 0-935584-42-0. [Google Scholar]
  28. Instituto Português da Qualidade. NP 1419:1987-Determinação dos Açúcares Totais; IPQ: Caparica, Portugal, 1987. [Google Scholar]
  29. Coelho, A.R.F.; Pessoa, C.C.; Marques, A.C.; Luís, I.C.; Daccak, D.; Silva, M.M.; Simões, M.; Reboredo, F.H.; Pessoa, M.F.; Legoinha, P.; et al. Natural Mineral Enrichment in Solanumtuberosum L. cv. Agria: Accumulation of Ca and Interaction with Other Nutrients by XRF Analysis. Biol. Life Sci. Forum 2021, 4, 77. [Google Scholar] [CrossRef]
  30. ISO 11136; Sensory Analysis—Methodology—General Guidance for Conducting Hedonic Tests with Consumers in a Controlled Area, 1st ed. International Organization of Standardization: Geneva, Switzerland, 2014.
  31. Lopes, J.d.C.; Madureira, J.; Margaça, F.M.A.; Cabo Verde, S. Grape Pomace: A Review of Its Bioactive Phenolic Compounds, Health Benefits, and Applications. Molecules 2025, 30, 362. [Google Scholar] [CrossRef]
  32. Zanini, M.; Silvestre, W.P.; Baldasso, C.; Tessaro, I.C. Valorization of Wastes Generated in Organic Grape Processing. Braz. Arch. Biol. Technol. 2024, 67, e24230183. [Google Scholar] [CrossRef]
  33. Jin, Q.; O’Hair, J.; Stewart, A.C.; O’Keefe, S.F.; Neilson, A.P.; Kim, Y.-T.; McGuire, M.; Lee, A.; Wilder, G.; Huang, H. Compositional Characterization of Different Industrial White and Red Grape Pomaces in Virginia and the Potential Valorization of the Major Components. Foods 2019, 8, 667. [Google Scholar] [CrossRef]
  34. Mosele, J.; Souza da Costa, B.; Bobadilla, S.; Motilva, M.J. Phenolic Composition of Red and White Wine Byproducts from Different Grapevine Cultivars from La Rioja (Spain) and How This Is Affected by the Winemaking Process. J. Agric. Food Chem. 2023, 71, 18746–18757. [Google Scholar] [CrossRef] [PubMed]
  35. Živković, N.; Čakar, U.; Petrović, A. Effects of spontaneous and inoculated fermentation on the total phenolic content and antioxidant activity of Cabernet Sauvignon wines and fermented pomace. Food Feed. Res. 2024, 51, 119–129. [Google Scholar] [CrossRef]
  36. Chire-Fajardo, G.; Arrunategui, R.; Orihuela-Rivera, C.; Ureña, M. Assessment of physical and physicochemical quality of main chocolates traded in Peru. Acta Agron. 2017, 66, 164–171. [Google Scholar] [CrossRef]
  37. Rezende, N.; Benassi, M.; Vissotto, F.; Augusto, P.; Grossmann, M. Effects of fat replacement and fibre addition on the texture, sensory acceptance and structure of sucrose-free chocolate. Int. J. Food Sci. Technol. 2015, 50, 1413–1420. [Google Scholar] [CrossRef]
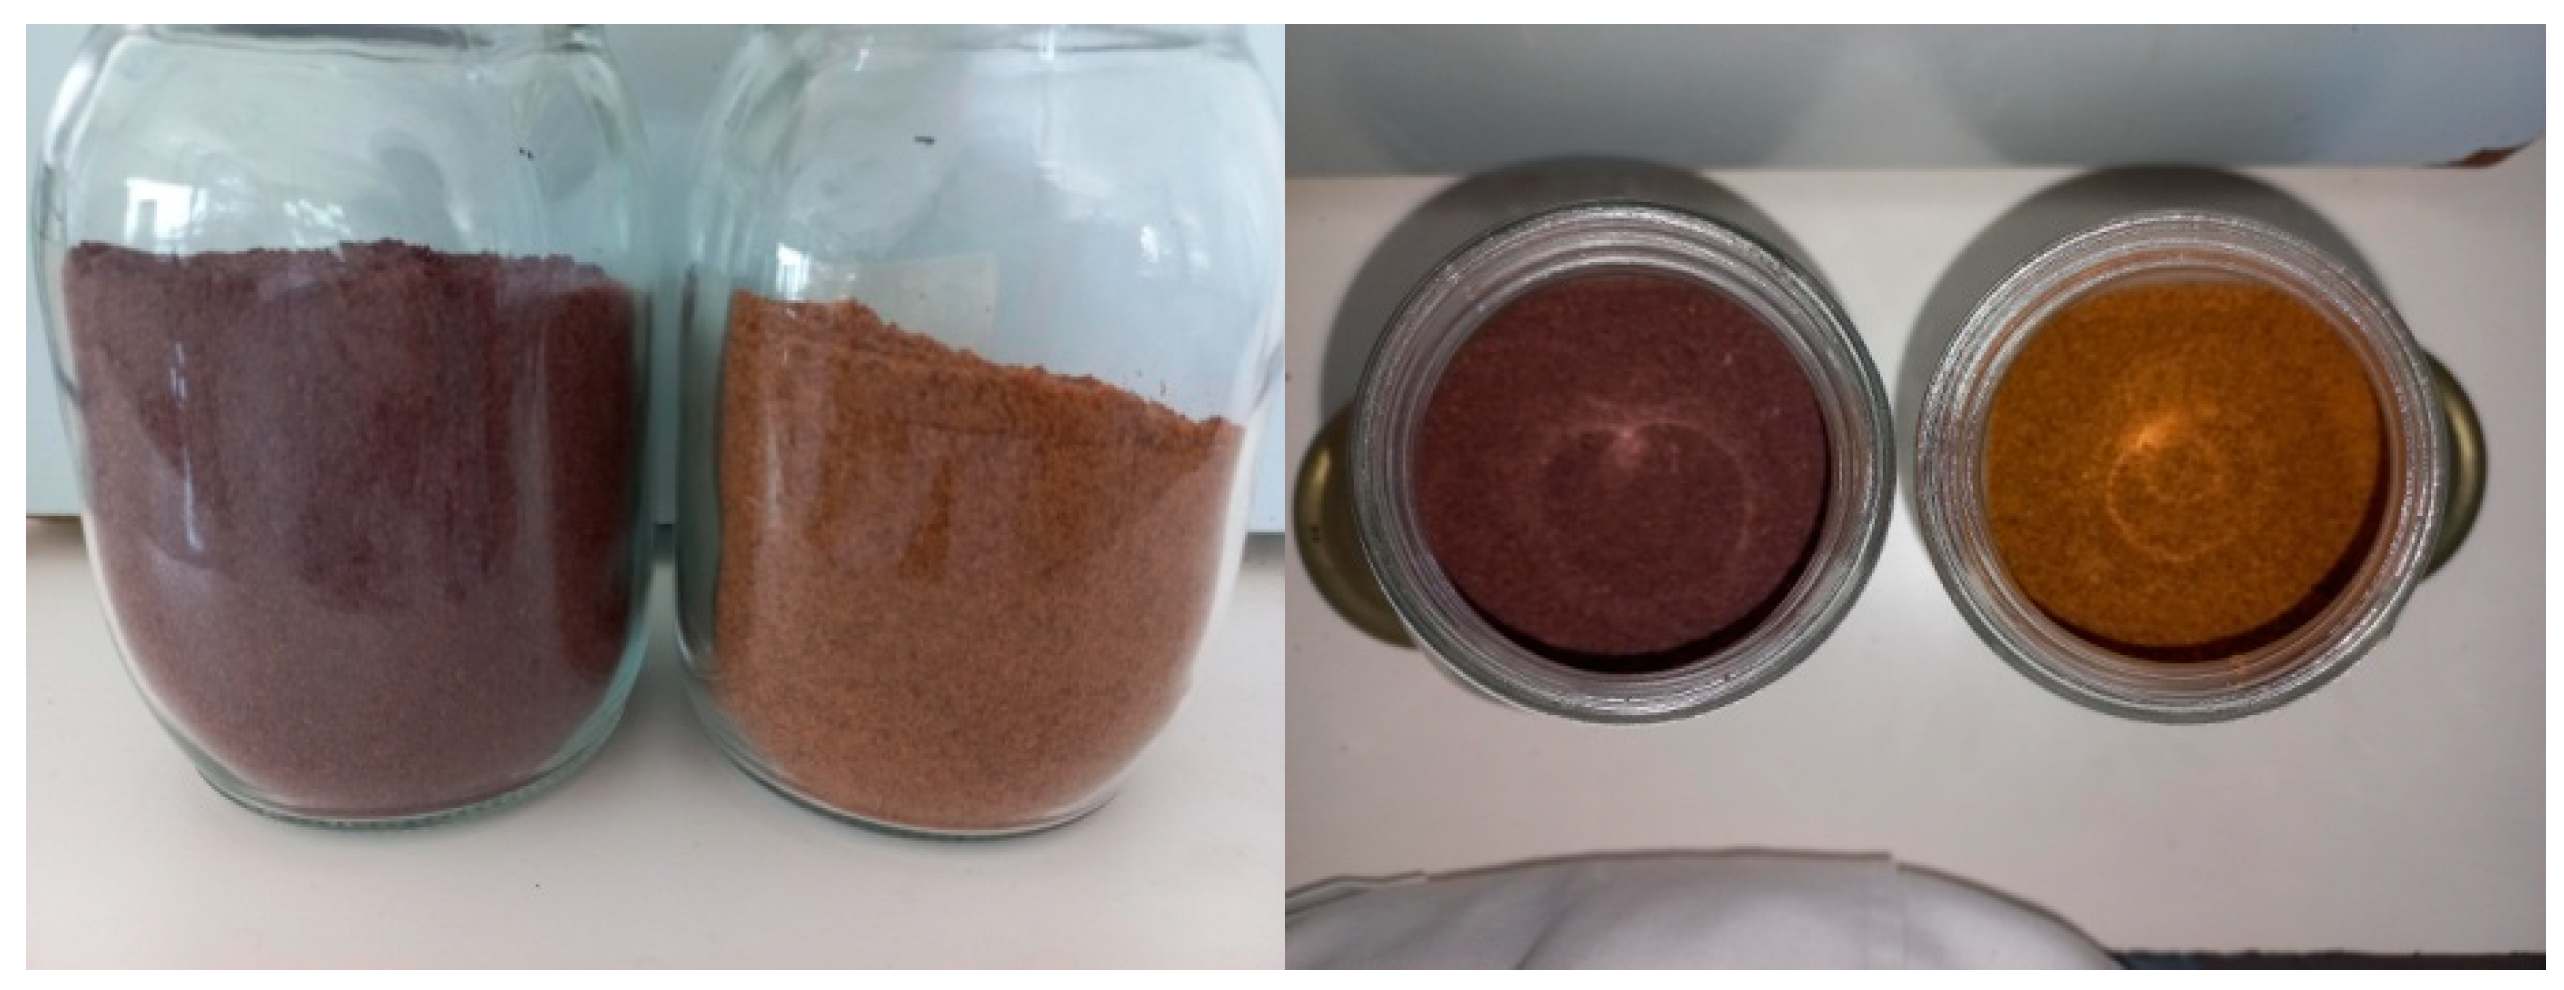
Figure 1. Visual aspect of the red and white grape pomace flour (red grape pomace from cv. Syrah and white grape pomace from cv. Arinto).
Sci 07 00125 g001
Figure 2. Chocolate being tempered (A), chocolate in the polycarbonate forms (B), and before being analyzed (C).
Sci 07 00125 g002
Figure 3. Control chocolate and chocolate with the incorporation of red and white grape pomace in different proportions: 5% (w/w), 10% (w/w), and 15% (w/w).
Sci 07 00125 g003
Figure 4. Protein (%), lipids (%), total sugars (%), and total dietary fiber (%) content of the control chocolate (“Ctr”) and the different samples of chocolate fortified with red and white grape pomace flour at 5, 10, and 15% (w/w). The bars represent mean ± SD (n = 3) and ANOVA analysis, p < 0.05 was performed for each parameter, with different letters expressing significant differences between each sample (a,b,c), with a for the highest values.
Sci 07 00125 g004
Figure 5. Antioxidant properties (total phenolic content (GAE/100 g), DPPH radical scavenging capacity (TE/100 g) and ORAC—oxygen radical absorbance capacity (TE/100 g)) of the control chocolate (“Ctr”) and the different samples of chocolate fortified with red and white grape pomace flour at 5, 10, and 15% (w/w). Results are expressed as µmol Trolox equivalents per 100 g (TE/100 g) for DPPH and ORAC and as mg gallic-acid equivalents per 100 g (GAE/100 g) for total phenolics. The bars represent mean ± SD (n = 3), and ANOVA analysis, p < 0.05, was performed for each parameter, with different letters expressing significant differences between each sample (a,b), with a for the highest values.
Sci 07 00125 g005
Figure 6. Maximum force (N) (hardness)of the control chocolate (“Ctr”) and the different samples of chocolate fortified with red and white grape pomace flour at 5, 10, and 15% (w/w). The bars represent mean ± SD (n = 3) and ANOVA analysis, p < 0.05 was performed for each parameter, with different letters expressing significant differences between each sample (a,b), with a for the highest values.
Sci 07 00125 g006
Figure 7. Average values of sensory analysis profile of dark chocolates fortified with grape pomace flour, considering the six formulations (Red 5%, Red 10%, Red 15%, White 5%, White 10%, and White 15%) and six attributes: Appearance, color, aroma, texture, flavor and overall acceptability, rated on a nine-point hedonic scale by untrained panelists (n = 32), which higher values indicating greater liking.
Sci 07 00125 g007
Figure 8. Principal component analysis (PCA) for PC1 vs. PC2 and PC1 vs. PC3 for each parameter studied (variance of 43.60% for PC1, 20.85% for PC2, and 10.23% for PC3) with eigenvalue of 6.104 for PC1, 2.919 for PC2, and 1.433 for PC3, with a total variance of PC1, PC2, and PC3 of 74.69%. The L, a*, and b* correspond to the color of the lower surface of chocolates.
Sci 07 00125 g008
Figure 9. Hierarchical clustering dendrogram (Ward’s minimum variance method, Euclidean distance) for the chocolate samples, corresponding 1–3 to control chocolates, 4–12 to red grape pomace chocolates with different incorporations (5, 10, and 15%), and 13–21 to white grape pomace chocolates with different incorporations (5, 10, and 15%). The red rectangles indicate the three main clusters identified at a cut-off distance of 8.
Sci 07 00125 g009
Figure 10. Projection of the three Ward clusters onto the PCA plots (PC1 vs. PC2 and PC1 vs. PC3) with red corresponding to control chocolates, green to red grape pomace chocolates with different incorporations (5, 10, and 15%), and blue to white grape pomace chocolates with different incorporations (5, 10, and 15%).
Sci 07 00125 g010
Figure 11. Pearson’s and Spearman’s correlation coefficients are considered the different parameters analyzed.
Sci 07 00125 g011
Table 1. Chemical composition of the two organic grape-pomace flours selected for chocolate (values expressed on a fresh weight basis); GAE—gallic-acid equivalents; TE—Trolox equivalents.
CompositionRed PomaceWhite Pomace
Protein (% w/w)11.1 ± 0.17.4 ± 0.2
Total sugars (% w/w)3.2 ± 0.231.7 ± 0.1
Fat (% w/w)7.5 ± 0.18.7 ± 0.1
Phenolics (mg GAE/100 g)8986 ± 108395 ± 7
ORAC (µmol TE/100 g)79,820 ± 41984,565 ± 383
DPPH (µmol TE/100 g)30,200 ± 46530,990 ± 522
Fiber (% w/w)58.6 ± 0.546.2 ± 0.3
Table 2. This CieLAB color coordinates (L, a* and b* parameters) for the upper (mold exposed) and lower (in contact with the mold) surfaces of the chocolates (control and fortified with red or white grape pomace flour at 5, 10, and 15% (w/w). Mean ± SD (n = 3) and ANOVA analysis, p < 0.05 was performed for each parameter, with different letters expressing significant differences between each sample (a to f), with a for the highest values.
SampleUpper Part of the ChocolateLower Part of the Chocolate
La*b*La*b*
Control26.3 ± 0.14 a4.88 ± 0.041 b−1.06 ± 0.017 c26.6 ± 0.049 a5.29 ± 0.073 bc−0.86 ± 0.082 cd
Red_526.1 ± 0.043 a4.80 ± 0.033 b−1.19 ± 0.034 d26.4 ± 0.038 ab5.02 ± 0.025 cd−1.06 ± 0.026 de
Red_1026.1 ± 0.084 a4.69 ± 0.027 b−1.27 ± 0.018 d26.0 ± 0.112 bc4.75 ± 0.094 de−1.24 ± 0.047 ef
Red_1525.9 ± 0.085 a4.43 ± 0.061 c−1.42 ± 0.014 e25.8 ± 0.124 c4.58 ± 0.087 e−1.33 ± 0.062 f
White_526.1 ± 0.10 a5.20 ± 0.058 a−0.808 ± 0.026 b26.7 ± 0.058 a5.49 ± 0.064 ab−0.546 ± 0.021 ab
White_1026.3 ± 0.038 a5.30 ± 0.031 a−0.698 ± 0.001 ab26.2 ± 0.139 abc5.38 ± 0.018 ab−0.698 ± 0.049 bc
White_1526.4 ± 0.20 a5.33 ± 0.050 a−0.606 ± 0.045 a26.6 ± 0.163 a5.62 ± 0.037 a−0.424 ± 0.024 a
Table 3. Correlation between variables with the principal components (PC1, PC2, PC3, and PC4). The L, a*, and b* in the plot correspond to the color of the lower surface of chocolates.
VariablesPC1PC2PC3PC4
Protein0.951−0.116−0.123−0.058
Lipids−0.1460.8370.158−0.139
Sugars−0.2210.040−0.218−0.836
DPPH0.346−0.4820.585−0.146
ORAC0.448−0.2340.667−0.313
Total_phenols−0.404−0.662−0.018−0.291
Fiber0.147−0.789−0.4940.241
Texture−0.3500.759−0.156−0.067
L_upper−0.552−0.020−0.381−0.360
a*_upper−0.915−0.2860.098−0.070
b*_upper−0.927−0.3280.014−0.017
L (lower)−0.8070.2320.3160.215
a* (lower)−0.970−0.0700.1420.090
b* (lower)−0.953−0.1770.1190.160
Disclaimer/Publisher’s Note: The statements, opinions and data contained in all publications are solely those of the individual author(s) and contributor(s) and not of MDPI and/or the editor(s). MDPI and/or the editor(s) disclaim responsibility for any injury to people or property resulting from any ideas, methods, instructions or products referred to in the content.