Article

Light-Driven Optimization of Exopolysaccharide and Indole-3-Acetic Acid Production in Thermotolerant Cyanobacteria

by
Antonio Zuorro
1,*,
Roberto Lavecchia
1,
Karen A. Moncada-Jacome
2,
Janet B. García-Martínez
3 and
Andrés F. Barajas-Solano
3
1
Department of Chemical Engineering, Materials, and Environment, Sapienza University, Via Eudossiana 18, 00184 Roma, Italy
2
Department of Health Sciences, Universidad Autónoma de Bucaramanga, Av. 42 #48-11, Bucaramanga 680002, Colombia
3
Department of Environmental Sciences, Universidad Francisco de Paula Santander, Av. Gran Colombia No. 12E-96, Cucuta 540003, Colombia
*
Author to whom correspondence should be addressed.
Sci 2025, 7(3), 108; https://doi.org/10.3390/sci7030108 (registering DOI)
Submission received: 15 April 2025 / Revised: 10 July 2025 / Accepted: 25 July 2025 / Published: 3 August 2025
(This article belongs to the Section Biology Research and Life Sciences)

Abstract

Cyanobacteria are a prolific source of bioactive metabolites with expanding applications in sustainable agriculture and biotechnology. This work explores, for the first time in thermotolerant Colombian isolates, the impact of light spectrum, photoperiod, and irradiance on the co-production of exopolysaccharides (EPS) and indole-3-acetic acid (IAA). Six strains from hot-spring environments were screened under varying blue:red (B:R) LED ratios and full-spectrum illumination. Hapalosiphon sp. UFPS_002 outperformed all others, reaching ~290 mg L−1 EPS and 28 µg mL−1 IAA in the initial screen. Response-surface methodology was then used to optimize light intensity and photoperiod. EPS peaked at 281.4 mg L−1 under a B:R ratio of 1:5 LED, 85 µmol m−2 s−1, and a 14.5 h light cycle, whereas IAA was maximized at 34.4 µg mL−1 under cool-white LEDs at a similar irradiance. The quadratic models exhibited excellent predictive power (R2 > 0.98) and a non-significant lack of fit, confirming the light regime as the dominant driver of metabolite yield. These results demonstrate that precise photonic tuning can selectively steer carbon flux toward either EPS or IAA, providing an energy-efficient strategy to upscale thermotolerant cyanobacteria for climate-resilient biofertilizers, bioplastics precursors, and other high-value bioproducts.

1. Introduction

Cyanobacteria are photosynthetic microorganisms capable of fixing atmospheric nitrogen, solubilizing phosphates, and generating plant growth regulators [1,2]. Some species, especially the genus Arthrospira, are used as human and animal dietary supplements due to their high protein content. They are also utilized in treating industrial and domestic wastewater, given their ability to remove or retain ammonia, phosphates, and other heavy metal ions [3,4]. Additionally, cyanobacteria have garnered notable attention for producing a variety of chemical substances exhibiting potent antimicrobial activities practical for therapeutic purposes [5,6]. Most genera of cyanobacteria are also capable of synthesizing phytohormones, amino acids, polysaccharides, vitamins, enzymes, and other biologically active metabolites, thereby playing a fundamental role in plant physiology and the proliferation of microbial communities in soil [7,8,9]. These characteristics make them an attractive platform for sourcing substances with significant biotechnological potential.
Another essential feature of these microorganisms is their ability to secrete complex exopolysaccharides (EPS) matrices. These macromolecules are a common property of microbial biofilms, where they perform protective and structural functions [10,11], playing a significant role in environmental adaptation and receiving substantial attention for their biotechnological potential [12]. Cyanobacterial EPS are unique heteropolysaccharides that are anionic and possess a heavy metal ion retention capacity [13]. They help maintain soil aggregate stability and enhance plant development in saline or contaminated soils [14]. Additionally, they have applications in biomedicine for protein or vitamin transport and delivery [15], as anti-adhesive coatings [16], and as cell carriers in tissue engineering [17,18]. Due to their rheological and antioxidant properties, they are used in the food and cosmetics industries as flocculants, thickeners, moisturizers, emulsifiers, or gelling agents [19]. Under this scenario, cyanobacterial exopolysaccharides (EPS) have been extensively studied for their diverse applications in agriculture. They, by virtue of their soil conditioning, moisture retention, and favorable microbial interactions, are potential biodegradable soil conditioners and biofertilizer carriers. For example, Cruz et al. showed that EPS-producing Synechocystis and Cyanobium sp. have relatively high polymer contents and are free from cyanotoxins, making them promising for secure agricultural applications [20]. Similarly, Van Camp et al. found that EPS isolated from Gloeothece verrucosa acted as an efficient biostimulant in the plant system, enhancing plant health as well as key defense-related enzymes, and were also a potent biostimulant option for the crop system [21]. Cumulatively, these results highlight the strategic importance of cyanobacterial EPS in designing sustainable and nature-based soil management strategies.
Cyanobacteria also play a crucial role in supplying phytohormones (auxins, gibberellins, cytokinins) [22], which are essential for plant growth and development. These substances function as signaling molecules in various plant functions. Among these phytohormones, indole-3-acetic acid (IAA), the most crucial auxin derivative, and other auxins induce cell elongation and division, enhancing plant development [23]. Cytokinins, for example, are involved in cell division, organogenesis, and delayed senescence, while salicylic acid is associated with activating plant defense responses [22]. Phytohormones also regulate various enzymatic activities and metabolic changes during plant growth [24]. In parallel, the phytohormone chemical compound indole-3-acetic acid (IAA) is naturally synthesized by certain cyanobacteria, which is crucial for inducing plant development and enhancing their resistance to abiotic stress. Recent studies have demonstrated that cyanobacteria, such as Nostoc and Calothrix sp., when utilized as biofertilizers, significantly improve the initial growth stages, nutrient utilization, and crop productivity [25].
Furthermore, Debnath et al. emphasize that the production of IAA and its subsequent secretion, along with EPS, would enhance rhizosphere colonization and the plant-microbe symbiosis, thereby increasing the efficacy of rhizobacteria in agroecosystems [26]. Complementing this, the extreme control of desert inhabitants over salinity has led to an induction in both EPS and IAA production from cyanobacteria, which demonstrates their beneficial role in supporting crops under stress-affected conditions [27]. These multifunctional roles designate the IAA-producing cyanobacteria as candidates for the protagonists in the execution of next-generation bioinoculant strategies.
According to Chamizo et al. [28], EPS synthesis by a defined cyanobacterial strain primarily depends on the species and cultivation conditions, such as nitrogen source, light, temperature, salinity, and phosphorus and potassium content [29]. It has been shown that EPS production increases with light intensity in cyanobacteria such as Nostoc sp. and Microcoleus vaginatus [30,31]. In N. flagelliforme, polysaccharide production was stimulated by red light [32,33]. Thus, controlled cultivation conditions, along with cyanobacterial plasticity and metabolism, offer numerous possibilities to improve the quality and content of these compounds [14]. Therefore, further research is essential to elucidate the effects of different factors and optimize their industrial potential.
Nevertheless, despite the biotechnological potential of extracellular polymeric substances (EPS), their industrial production remains constrained by three critical bottlenecks: variable and often low yields [34]; high dependence on the light regime, which can lead to photoinhibition or photooxidation under elevated irradiance levels [35]; and the limited availability of well-characterized native thermotolerant strains capable of operating efficiently in high-radiation environments without requiring costly supplements [26]. Addressing these challenges through integrated strategies that optimize light spectrum, intensity, and photoperiod represents a promising approach to maximizing the co-production of EPS and indole-3-acetic acid (IAA), while simultaneously reducing energy costs and enhancing metabolic efficiency [36].
This differential response to irradiance has also been observed under conditions that combine light variability with nutrient availability. For example, at intensities up to 450 μmol m−2 s−1, researchers have documented accelerated granule formation and faster depletion of EPS-bound Fe(II), pointing to a tight coupling between photoreduction and exopolysaccharide activity in phototrophic cultures [37]. Similarly, in fluidized systems with Scenedesmus quadricauda, higher light intensity not only increased biomass accumulation but also stimulated EPS secretion, presumably via structural rearrangement of EPS-related proteins [38]. In Scytonema hyalinum, experiments conducted at varying light levels revealed that although high irradiance promoted EPS excretion, it also reduced the growth rate, indicating a metabolic trade-off between structural defense and photosynthetic efficiency [39].
The biotechnological production of cyanobacteria for obtaining valuable metabolites depends on several factors, including the cultivation medium, light, pH, temperature, and agitation [40]. These environmental factors impact the photosynthetic process, cellular biomass productivity, and the dynamic patterns, routes, and activities of metabolism and cellular composition [41]. Nutrient availability and light are the primary variables influencing microalgal physiology. While nutrients are necessary for biomass synthesis, light intensity and quality determine the proportion of energy available for metabolic activities [29,42,43]. However, microalgal growth is affected by light intensity, light–dark cycles (photoperiods), and light coloration (wavelength). The influence of these factors on microalgal development and product production depends on the species and strain analyzed [41].
Various studies indicate that light intensity and wavelength play a crucial role in photosynthetic activity, as reflected in growth, since photosystems catalyze the energy transformation reaction captured by excited chlorophyll molecules into usable energy [39,44].
While excessive light can lead to photoinhibition, which reduces photosynthetic efficiency, insufficient light can limit the growth of microalgae [45]. When intense light harms the photosynthetic machinery, it causes photooxidative stress, which reduces photosynthesis—a phenomenon known as photoinhibition [46]. High light intensity during peak daylight hours makes outdoor microalgal cultures vulnerable to photoinhibition. Such stress can result in cellular damage or even cell death, significantly affecting the photosynthetic process and overall culture production [47]. Light intensity must be balanced to maximize microalgal development and productivity.
Beyond balancing intensity, current strategies increasingly focus on tailoring the spectral quality and dynamic control of artificial illumination to enhance metabolic output in phototrophic microorganisms. The regulation of light spectrum has emerged as a highly effective tool to modulate the biosynthesis of value-added compounds in cyanobacteria. For instance, multiband modeling has been applied in Synechocystis sp. PCC 6803, demonstrating that optimizing the 445/660 nm ratio can double electron transport rates and redirect approximately 22% of photosynthetically fixed carbon toward EPS production, while reducing energy input by 35% [44]. In parallel, programmable LED regimes—such as sub-Hz blue pulses or short green-light bursts—have been shown to enhance biomass accumulation and zeaxanthin synthesis by up to 60% without triggering photoinhibition [48]. Likewise, red-dominant stepped illumination schedules have increased the intracellular pools of indole-3-acetic acid precursors in Planktothricoides raciborskii cultures [32]. At the molecular level, ontogenetically regulated far-red promoters in Synechocystis enabled the rerouting of nearly 40% of stored glycogen toward EPS synthesis under high-light conditions [49], and the heterologous expression of β-carotene ketolase in Chlamydomonas reinhardtii under white LED exposure tripled the production of high-value ketocarotenoids [23].
The illumination duration is crucial for maximizing microalgal productivity and reducing cultivation energy costs. Studies on continuous light cultivation have demonstrated maximum growth rates. However, light–dark cycles are necessary because photosynthesis consists of two stages: a light-dependent photochemical stage and a dark biochemical stage. Compounds generated in the light-dependent stage are used in the dark stage to synthesize essential growth molecules [23,50,51].
Various studies aim to improve light efficiency and reduce the costs of artificial lighting systems. Laboratory cultures use fluorescent tubes, which consume more energy than light-emitting diodes (LEDs) [48]. Some cultures use solar energy exclusively as a primary source of light. However, outdoor systems perform less efficiently than indoor ones [52]. Consequently, light intensity in artificial light systems must be carefully controlled to avoid photooxidation or photoinhibition, which can damage the photosynthetic apparatus [53,54].
Starting from the premise that controlled variations in the light regime differentially modulate the carbon and tryptophan pathways responsible for the biosynthesis of extracellular polymeric substances (EPS) and indole-3-acetic acid (IAA), this study employs a response surface methodology to analyze the synergistic influence of LED spectrum, light intensity, and photoperiod on the production of both metabolites in Hapalosiphon sp. UFPS_002—a native thermotolerant strain isolated from Colombian thermal springs. The goal is to delineate the linear, quadratic, and interactive contributions of these factors, thereby defining transferable parameters for low-energy photobioreactors that aim to maximize the co-production of EPS and IAA, with potential applications in agro-industry.

2. Materials and Methods

2.1. Microorganisms

Eight thermotolerant cyanobacterial strains, Oscillatoria sp_UFPS001, Haplosiphon sp_UFPS002, Potamposiphon sp_UFPS003, Oscillatoria sp_UFPS004, Oscillatoria sp_UFPS005, Oscillatoria sp_UFPS007, Potamposiphon sp_UFPS008, and Chroococcus sp_UFPS011, were previously isolated from hot springs located in the municipality of Bochalema, which is part of Norte de Santander region (Colombia) and maintained at the INValgae collection at Universidad Francisco de Paula Santander (Cúcuta, Colombia). The strains were maintained in solid BG11 medium at 100 μmol m−2 s−1, with a 12 h light/12 h dark photoperiod, and at 27 °C. For their conservation, the strains were reinoculated every 25 days in 10 mL tubes with 4 mL of fresh solid BG11 medium.

2.2. Biomass Production

Each strain was grown in 500 mL clear borosilicate flasks with a working volume of 300 mL on BG11 medium [55]. The medium was agitated by air injection at a flow rate of approximately 180 mL/min, using a mixture of 1% (v/v) filtered CO2, an irradiance of 100 μmol m−2 s−1, and a 12 h light/12 h dark photoperiod for 20 days (Figure 1). At the end of the culture time, the flasks were disconnected from the airflow and allowed to decant for 1 h. The medium was centrifuged at 2054× g for 20 min (20 °C). The cell-free medium was used to determine EPS and Indole-3-Acetic Acid (IAA).

2.3. EPS and IAAs Quantification

EPS was quantified using the phenol-sulfuric acid method modified by Moheimani et al. [56]. Approximately 1 mL of cell-free medium was combined with 5 mL of 1 M H2SO4 in capped glass tubes. This was performed at 100 °C for 1 h. At termination, 2 mL of sample was added to 1 mL of 5% (w/v) phenol solution and 5 mL of concentrated H2SO4 in glass tubes with caps. Samples were vortexed (2000 rpm, 30 s) and left at room temperature for 30 min. The EPS concentration was finally determined using a spectrophotometer at 485 nm, and the EPS concentration was estimated from a previously constructed curve (0–10 mg/L, R2 = 0.995).
To quantify Indole-Acetic Acid, 1 mL of medium was mixed with 4 mL of Salkowski’s reagent (60% methanol, 25% CHCl3, 10% HCOOH, and 5% H2O) [57]. The mixture was allowed to stand at room temperature for 30 min. Finally, the concentration of Indole-3-Acetic Acid (IAA) was determined using a previously constructed curve (0–30 µg/mL, R2 = 0.994) by reading it in a spectrophotometer at 540 nm.
The data obtained were analyzed using one-way ANOVA followed by Dunnett’s multiple comparisons test, which was performed using GraphPad Prism version 10.4.1 (GraphPad Software, San Diego, CA, USA) to identify significant differences in EPS and IAA production among the strains.
The composition of the exopolysaccharide matrix was further analyzed only in the strain with the highest production. Approximately 5 L of cell-free media from the highest EPS producer were mixed with pure, chilled ethanol (3:1 ethanol to cell-free media). The sample was chilled overnight (4 °C, 8 h) to promote EPS precipitation and centrifuged (3396× g 20 min). The resulting pellet was collected and subjected to dialysis using a 12–14 kDa molecular weight cut-off (MWCO) membrane against distilled water for 48 h at 4 °C, with the water being replaced every 12 h to remove low-molecular-weight impurities and salts. After dialysis, the purified EPS was freeze-dried and stored at −20 °C until further analysis. The lyophilized EPS was then used to determine (by triplicate) the content of total carbohydrates [56], total proteins [58], and total lipids [59].
Lyophilized EPS (5–10 mg) underwent hydrolysis with 2 M trifluoroacetic acid (TFA) at 121 °C for 2 h. Following nitrogen drying and reconstitution in ultrapure water, materials were filtered (0.22 µm) and analyzed using HPLC employing a CarboPac PA10 column with pulsed amperometric detection (PAD). Monosaccharides were isocratically separated using 18 mM NaOH at a flow rate of 1.0 mL/min and identified by comparing their retention times with those of standards. Quantification was conducted utilizing external calibration curves and articulated as mg/g EPS.

2.4. Selection of the Strain with the Highest Capacity for Exopolysaccharide (EPS) and Indole-Acetic Acid (IAA) Production Under Different LED Spectra

All strains were inoculated in 250 mL of culture medium BG11 in a 500 mL GL45 flask. Each flask was aerated with filtered air (150 mLair/min) to allow for homogeneous mixing of the medium and adequate oxygenation. The strains were also tested under five different light sources: cool white LEDs (Control) (60 LEDs/m, 400–700 nm, 12 V, 8 W/m) (Sinowell, Shanghai, China), Blue:Red LEDs (1:3, 1:4, and 1:5 B:R ratio), (60 LEDs/m, Blue: 660 nm, Red 450 nm, 12 V, 8 W/m) (Sinowell, Shanghai, China), and full spectrum LEDs (60 LEDs/m, 380–780 nm, peak emissions at 450 nm and 660 nm, 12 V, 8 W/m) (Sinowell, Shanghai, China) [54]. All light sources were set at a light intensity of 100 μmol m−2 s−1 with a 12 h light/12 h dark photoperiod for 20 days. At the end of the incubation period, samples of the culture medium were obtained for quantification of exopolysaccharides (EPS) and indole-3-acetic acid (IAA) to assess the production of these metabolites. Data were analyzed using a one-way ANOVA followed by Dunnett’s multiple comparison test in GraphPad Prism version 10.4.1 (GraphPad Software, San Diego, CA, USA).

2.5. Determination of the Effect of Photoperiod and Intensity on EPS and IAA Production

The strain with the highest EPS and Indole-Acetic Acid production and the best light source was evaluated to identify the effect of photoperiod and light intensity on EPS and IAA synthesis using a 2-factor CCD design (Table 1) using the Design Expert 13 software. This type of design of experiments allows for identifying the most important variables with the fewest number of experiments compared with full factorial designs. The precise parameters for light intensity and photoperiod were determined based on initial growth tests and established literature values that facilitate cyanobacterial metabolism and metabolite synthesis.
According to these conditions, each experiment was grown in 500 mL tran in Nostoc sp. arent borosilicate flasks with a working volume of 250 mL on BG11 medium. The medium was agitated by injecting air at an approximately 150 mLair/min flow rate. The intensity of each experiment was adjusted using an Apogee MQ-510 Photosynthetically Active Radiation sensor (Apogee Instruments Inc, Logan, UT, USA). At the end of the culture time, it was allowed to decant for 1 h and centrifuged at 2054× g for 20 min (20 °C). The cell-free medium was used to determine EPS and IAA using the above methodology.

3. Results

3.1. Strain and LED Spectra Selection

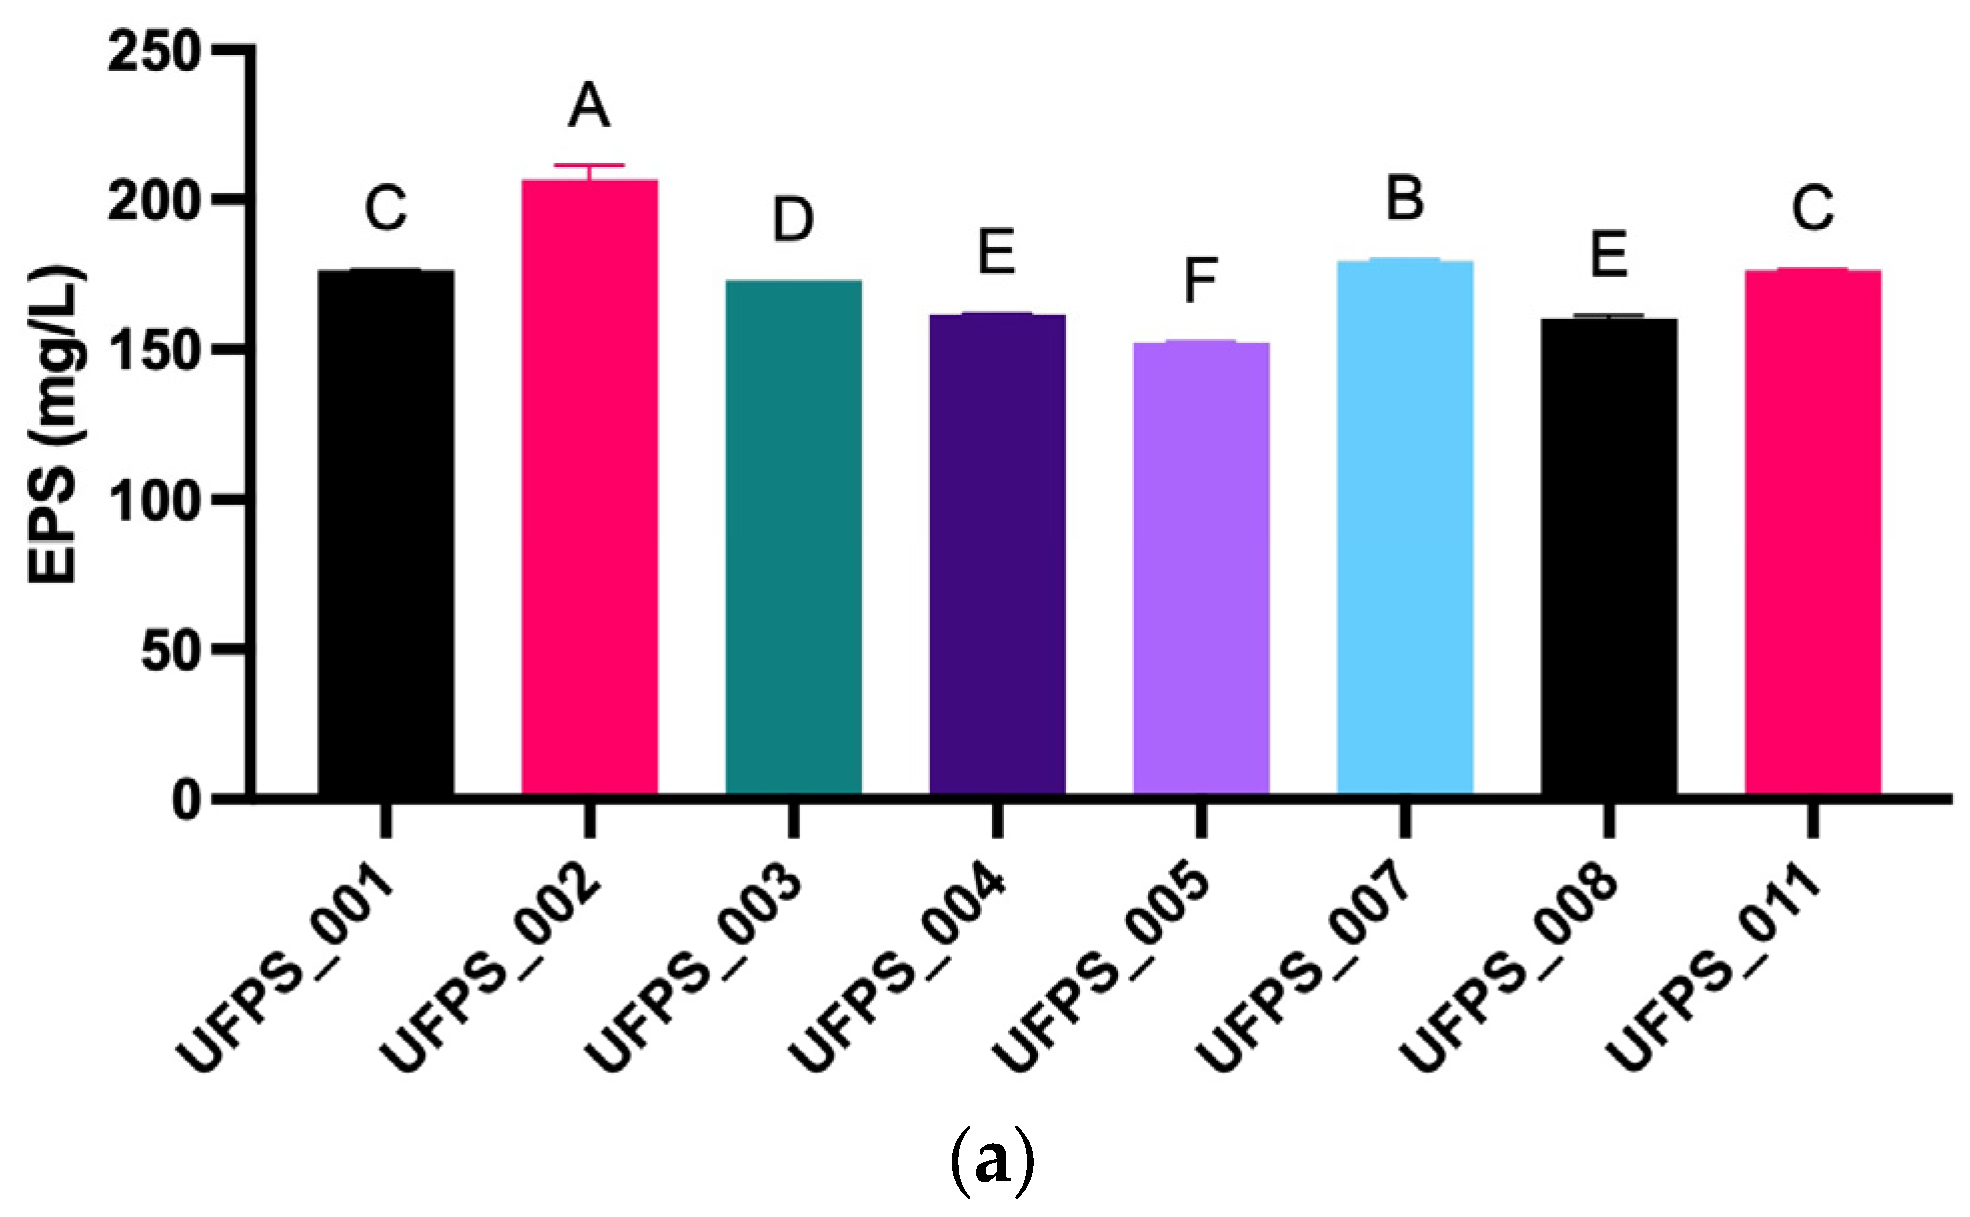
Figure 2 presents the results related to the exopolysaccharide (EPS) and indole-3-acetic acid (IAA) content released by each of the cyanobacterial strains evaluated. In Figure 3a, EPS production in mg/mL is shown for the eight thermotolerant strains analyzed. The results reveal that EPS concentration varied significantly among strains (p < 0.05), with UFPS_002 exhibiting the highest production at approximately 290 mg/L, followed by UFPS_007 (205 mg/L). UFPS_002 belongs to the Hapalosiphon sp. genus. In contrast, the lowest EPS levels were observed in UFPS_005 (180 mg/L), with intermediate values recorded for other strains. One-way ANOVA followed by Dunnett’s multiple comparisons test revealed seven distinct clusters (A–G), highlighting substantial variability in polysaccharide excretion.
IAA also varied greatly in final concentration across strains (p < 0.05), with final concentrations ranging from 6 to 28 μg/mL. Nonetheless, UFPS_002 was again found to have the highest IAA output (28 μg/mL), which was statistically superior to that of all other strains. UFPS_001 came next at 24 μg/mL, and all other isolates produced less, with UFPS_005, UFPS_007, UFPS_008, and UFPS_011 clustering with the least production; 6–8 μg/mL (Figure 3b). Since it produced more EPS and IAA than all other isolates, UFPS_002 was considered more relevant to the application of biotechnology in processes involving crop biofertilization and stress mitigation. The difference in metabolite production suggests that genetic and physiological differences likely modulate strain-specific regulatory mechanisms.
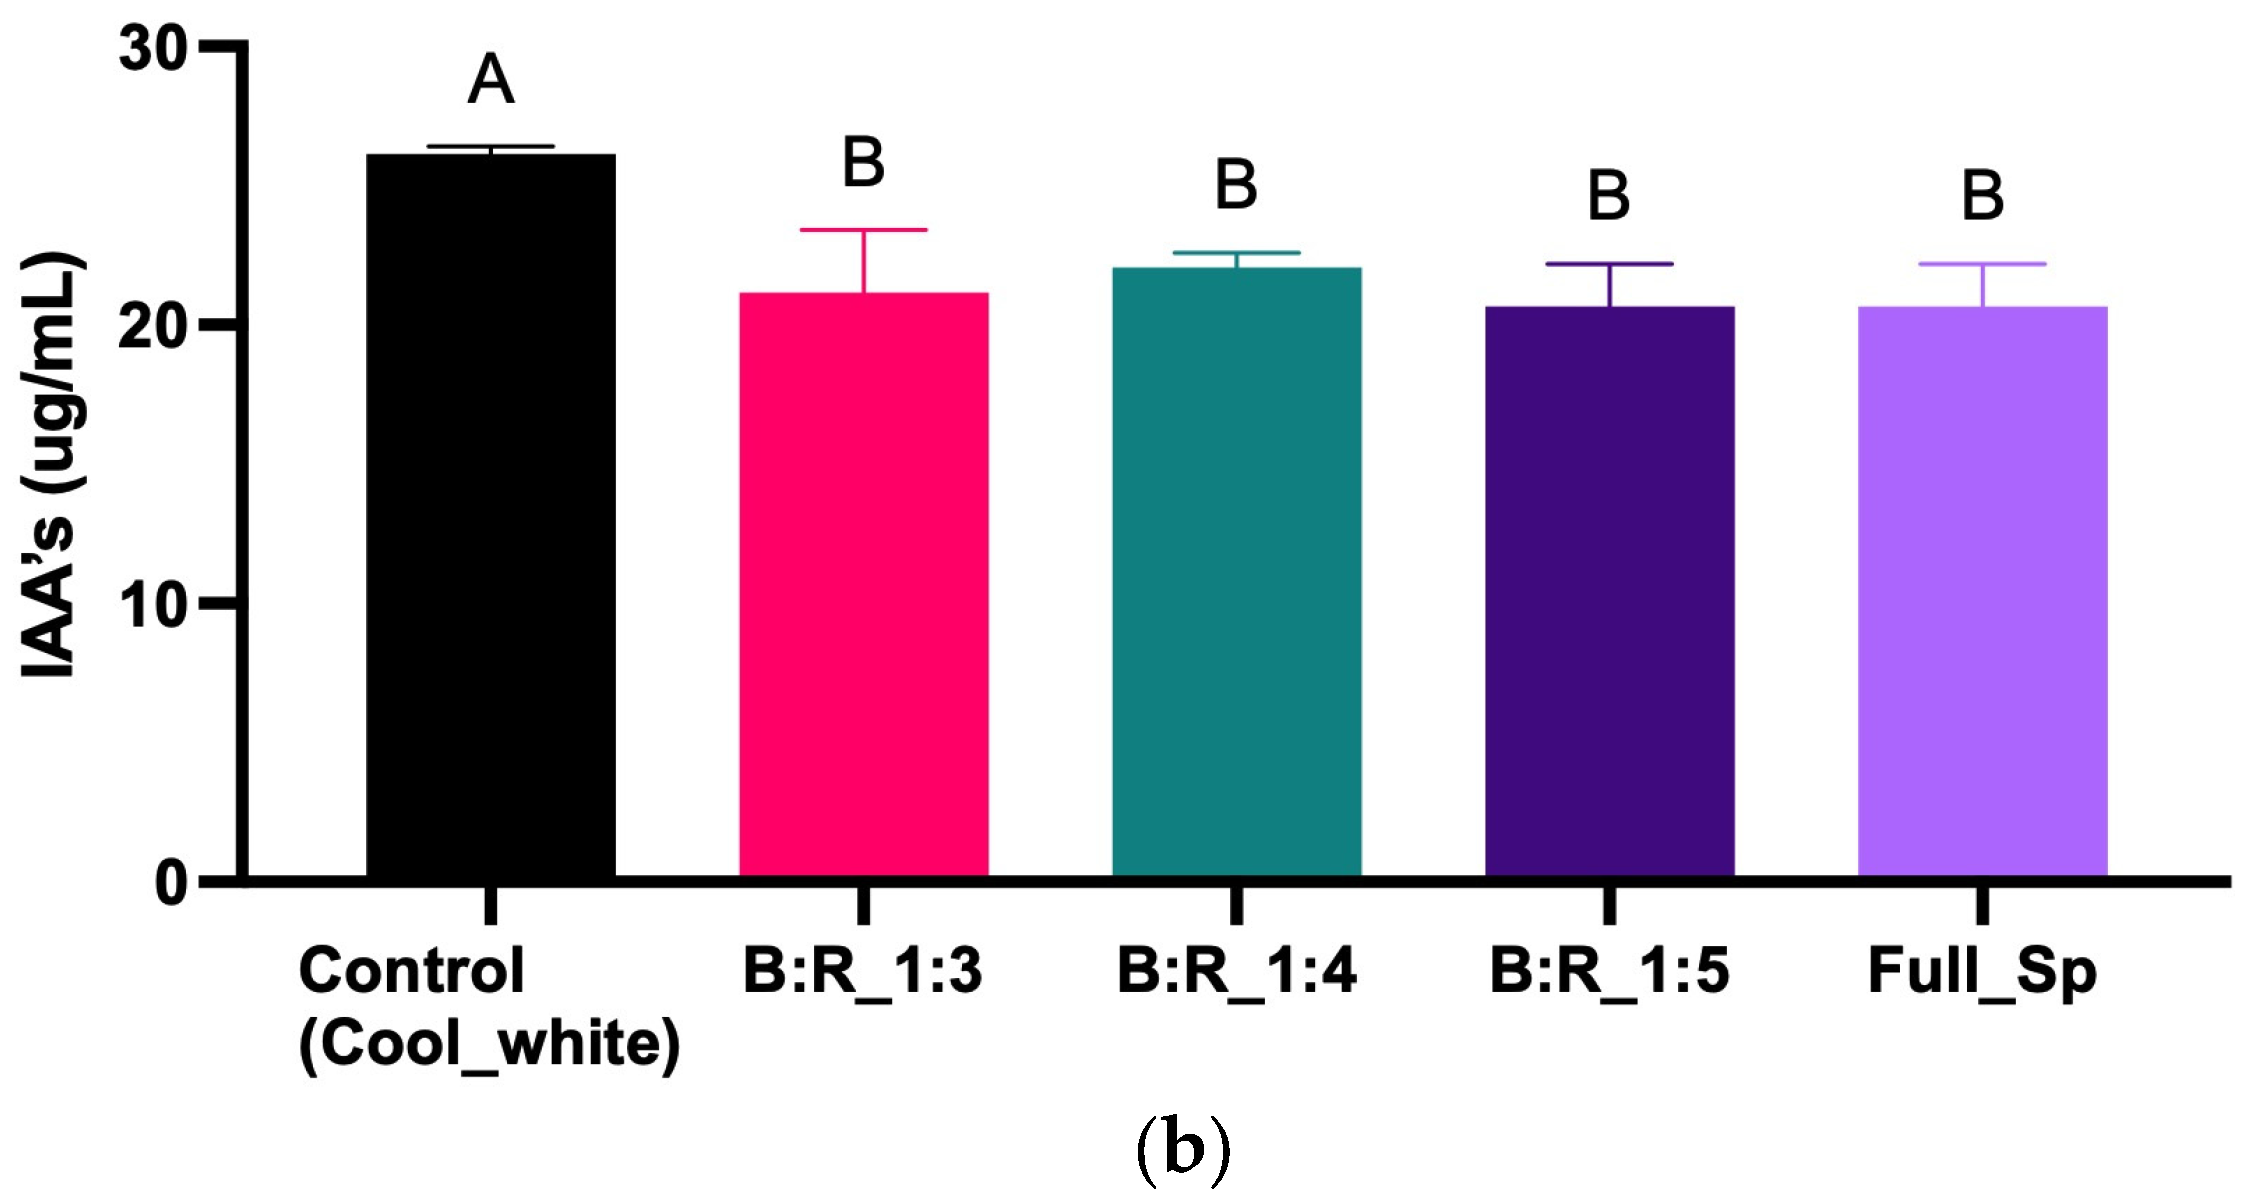
The effect of LED light spectrum on extracellular polymeric substances (EPS) and indole-3-acetic acid (IAA) formation was examined by comparing cool white (CWL) with different blue:red (B:R) light treatments and full-spectrum treatment (Full_Sp). Light quality significantly affected EPS production (Figure 3a; p < 0.05). The highest EPS concentration was observed at a B:R ratio of 1:5 (230 mg/mL), which was significantly higher than that of the control and other treatments. Intermediate EPS levels were recorded under B:R 1:3, B:R 1:4, and the control, while the Full_Sp treatment resulted in the lowest EPS yield, statistically grouping with the control.
In contrast, IAA production was maximized under the control treatment (cool white), reaching a concentration of up to 28 μg/mL (Figure 3b). All treatments using modified light spectra (B:R ratios and Full Sp) showed significantly lower IAA levels, with no statistical difference. This suggests that while blue:red spectral manipulation enhanced EPS secretion, it concurrently suppressed IAA biosynthesis relative to the broad-spectrum white light control. These results highlight the distinct regulatory roles of light spectral quality on secondary metabolite production, indicating that specific LED compositions may selectively favor polysaccharide production while negatively impacting auxin synthesis in cyanobacteria.

3.2. Effect of Photoperiod and Intensity on EPS and IAAs Production

A response surface methodology (RSM) was employed to evaluate the effects of light spectrum, photoperiod, and intensity on EPS and IAA production by thermotolerant cyanobacteria. The models developed for both metabolites were statistically significant and demonstrated excellent predictive performance (Table 2).
Regarding EPS concentration, the model yielded a highly significant F-value of 136.79 (p < 0.0001), indicating a probability of less than 0.01% that this result could be due to random noise. Significant model terms included the linear effects of photoperiod (A) and light intensity (B), their interaction (AB), and their quadratic components (A2 and B2), all with p-values < 0.05. In the coded design matrix, ¨A¨ represents the photoperiod (h light day−1) and ¨B¨ the light intensity (µmol m−2 s−1). The significance of the linear terms (A and B) confirms that each factor independently influences EPS and IAA variation. The interaction term (AB) is also significant, indicating that the response changes when both factors are modified simultaneously. Finally, the quadratic terms (A2, B2) reveal non-linear behaviour, suggesting the presence of local maxima or minima within the experimental range. The non-significant lack of fit (F = 1.23, p = 0.4080) confirmed that the model adequately represents the data. The model demonstrated excellent statistical robustness, with an R2 of 0.9899, an Adjusted R2 of 0.9826, and a Predicted R2 of 0.9382. The Adequate Precision ratio of 25.41, well above the desired threshold of 4, indicates a strong signal-to-noise ratio.
Similarly, for IAA concentration, the model was highly significant (F = 381.56, p < 0.0001). Light intensity (B), the AB interaction, and the quadratic terms (A2, B2) were identified as significant contributors (p < 0.05). The lack of fit was not significant (F = 1.72, p = 0.3004), further validating model adequacy. The model displayed an R2 of 0.9963, Adjusted R2 of 0.9937, and Predicted R2 of 0.9838, with an Adequate Precision of 38.89, confirming excellent predictive capability.
The models demonstrate a reliable fit to the experimental data and are suitable for exploring and optimizing the production of EPS and IAA in cyanobacteria under different light regimes.
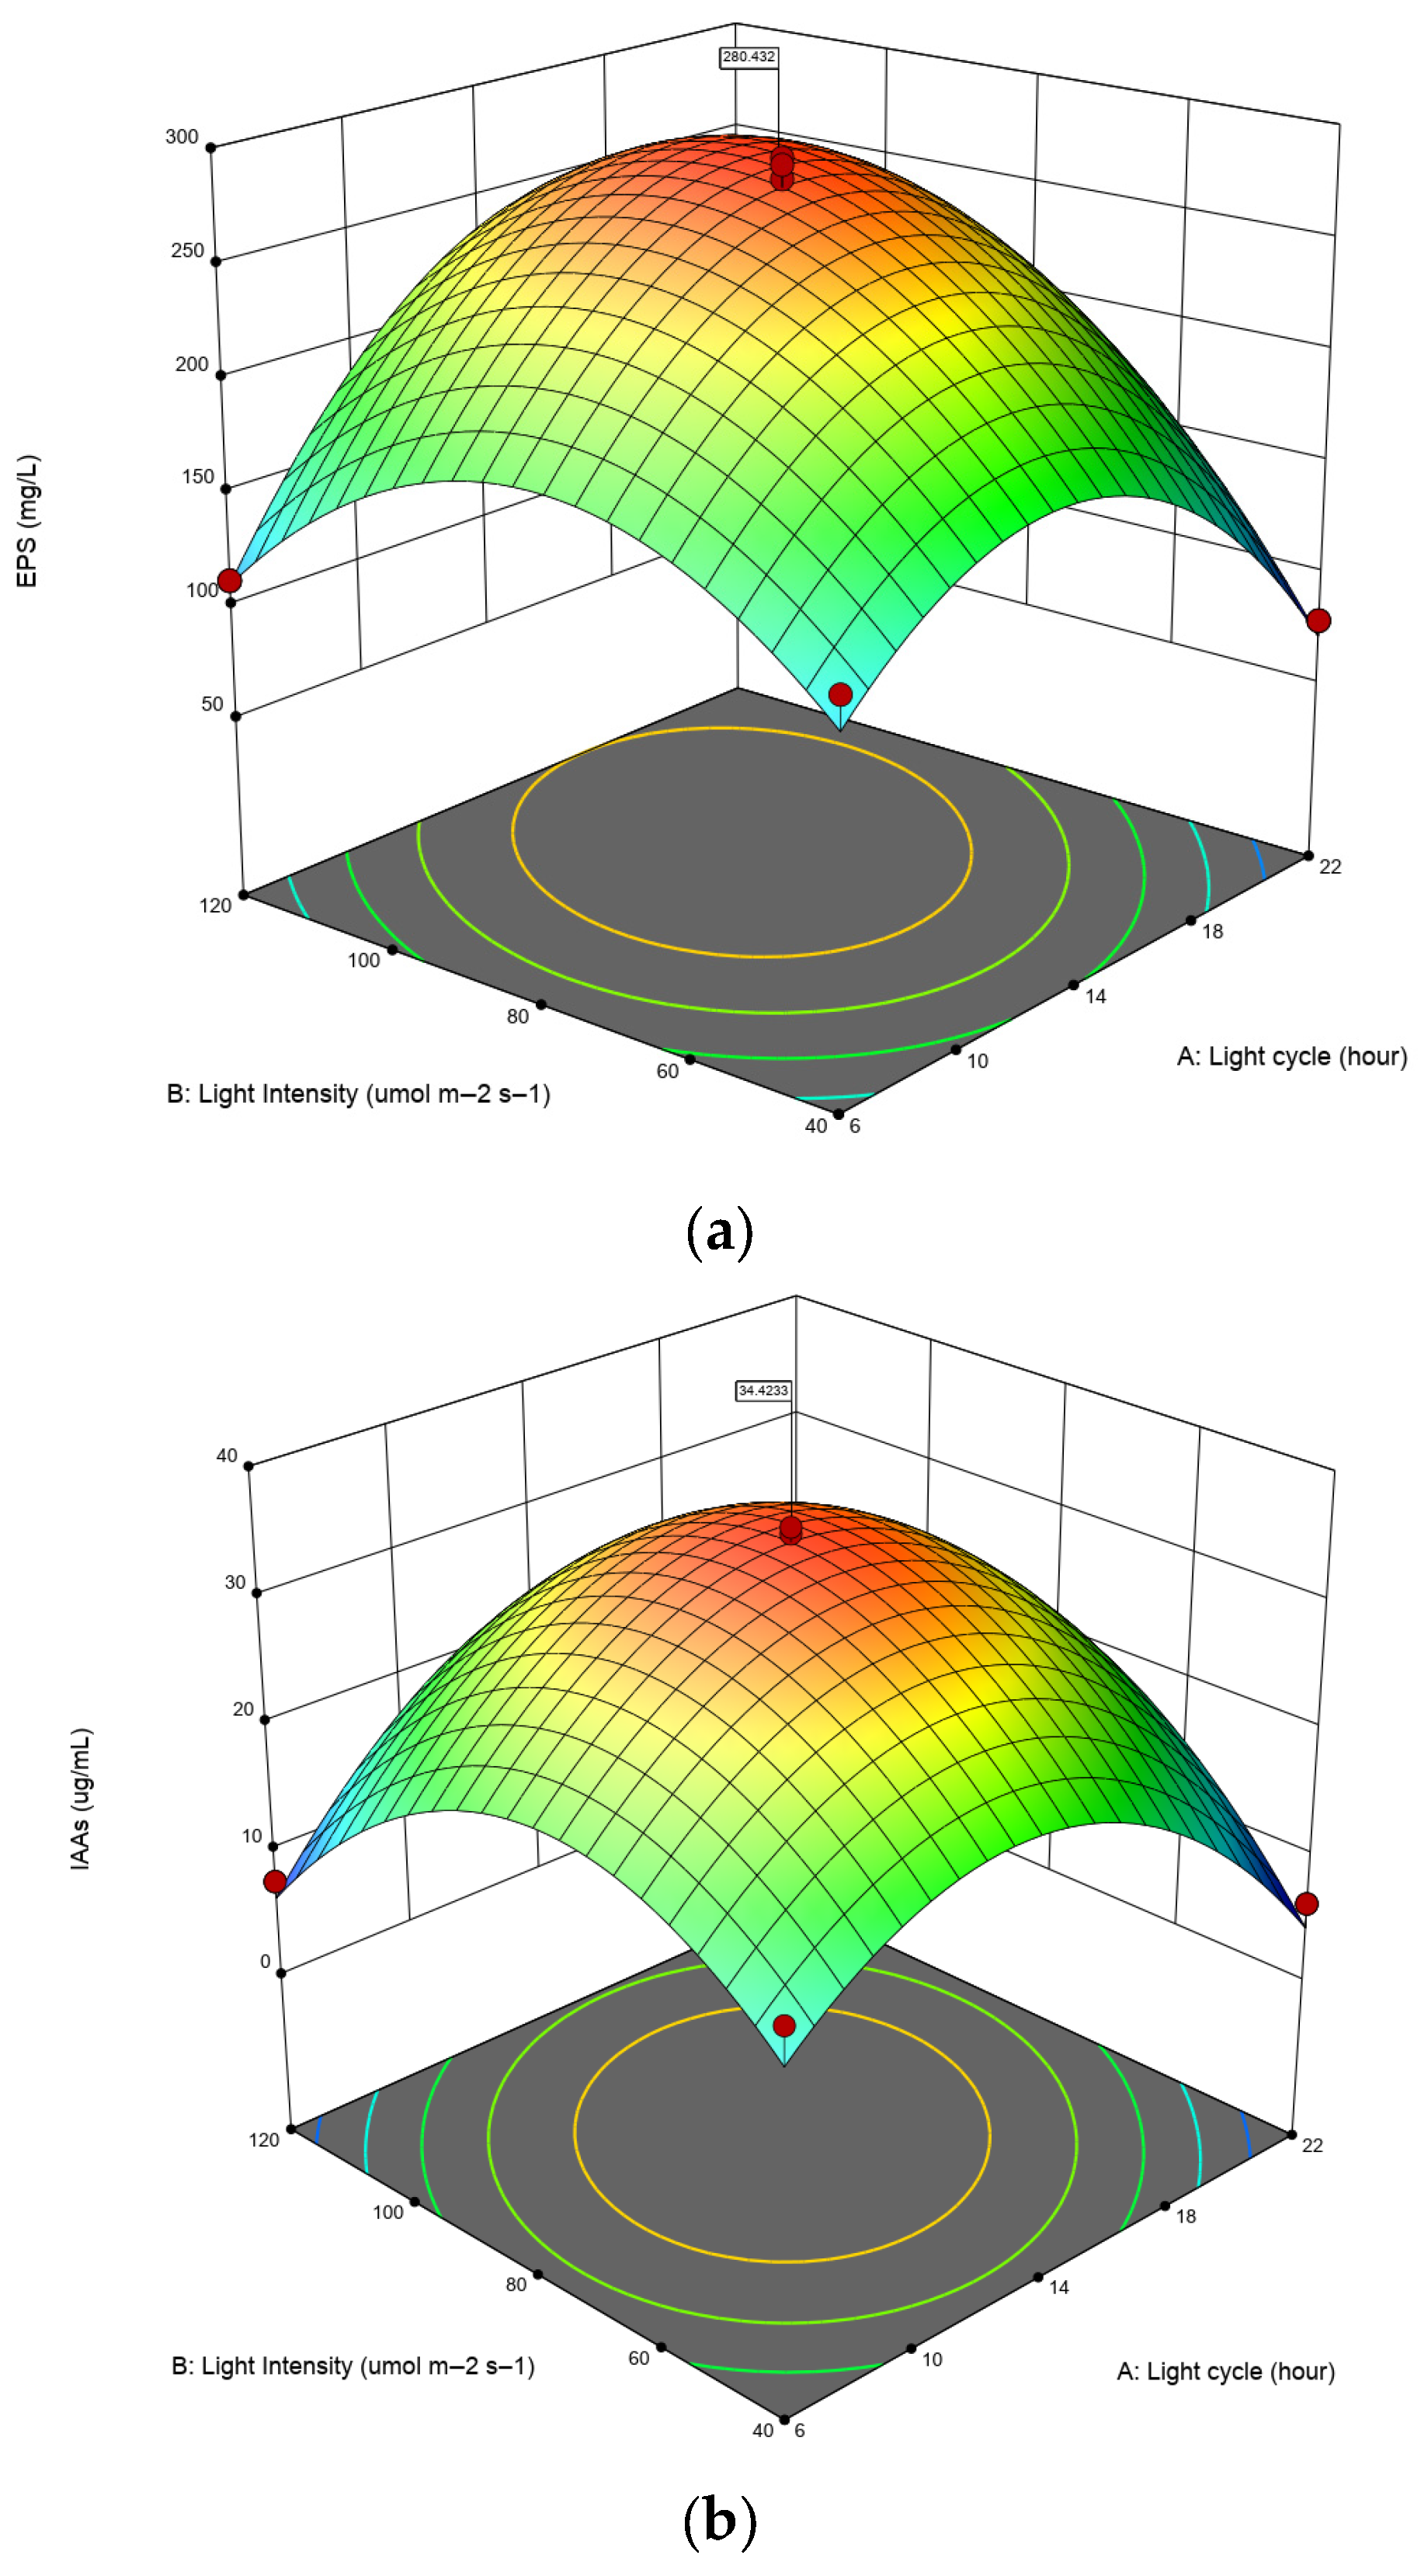
The 3D response surface plots illustrate the interactive effects of photoperiod (A: Light cycle, hours) and light intensity (B: μmol m−2 s−1) on the production of EPS and IAA by a thermotolerant strain of Hapalosiphon sp. In Figure 4a, EPS production exhibited a clear parabolic response to both variables, with a distinct maximum observed at intermediate levels of photoperiod and light intensity. This indicates a synergistic interaction between light duration and intensity, where excessive or insufficient values of either factor led to decreased EPS yields. The response surface confirmed the statistical significance of both main effects and their quadratic terms, as previously indicated by ANOVA.
Similarly, Figure 4b shows a comparable trend for IAA production, with peak concentrations occurring under moderate light conditions. IAA synthesis was highest when light cycle and intensity were balanced around central experimental values, again highlighting a nonlinear relationship. The surface curvature suggests that suboptimal conditions—either too short/long photoperiods or too low/high light intensities—negatively impact auxin biosynthesis. Together, these plots support the robustness of the model and underscore the importance of optimizing both light spectrum and exposure parameters to enhance metabolite production in cyanobacterial cultivation systems.

3.3. Optimization of EPS and IAA Production

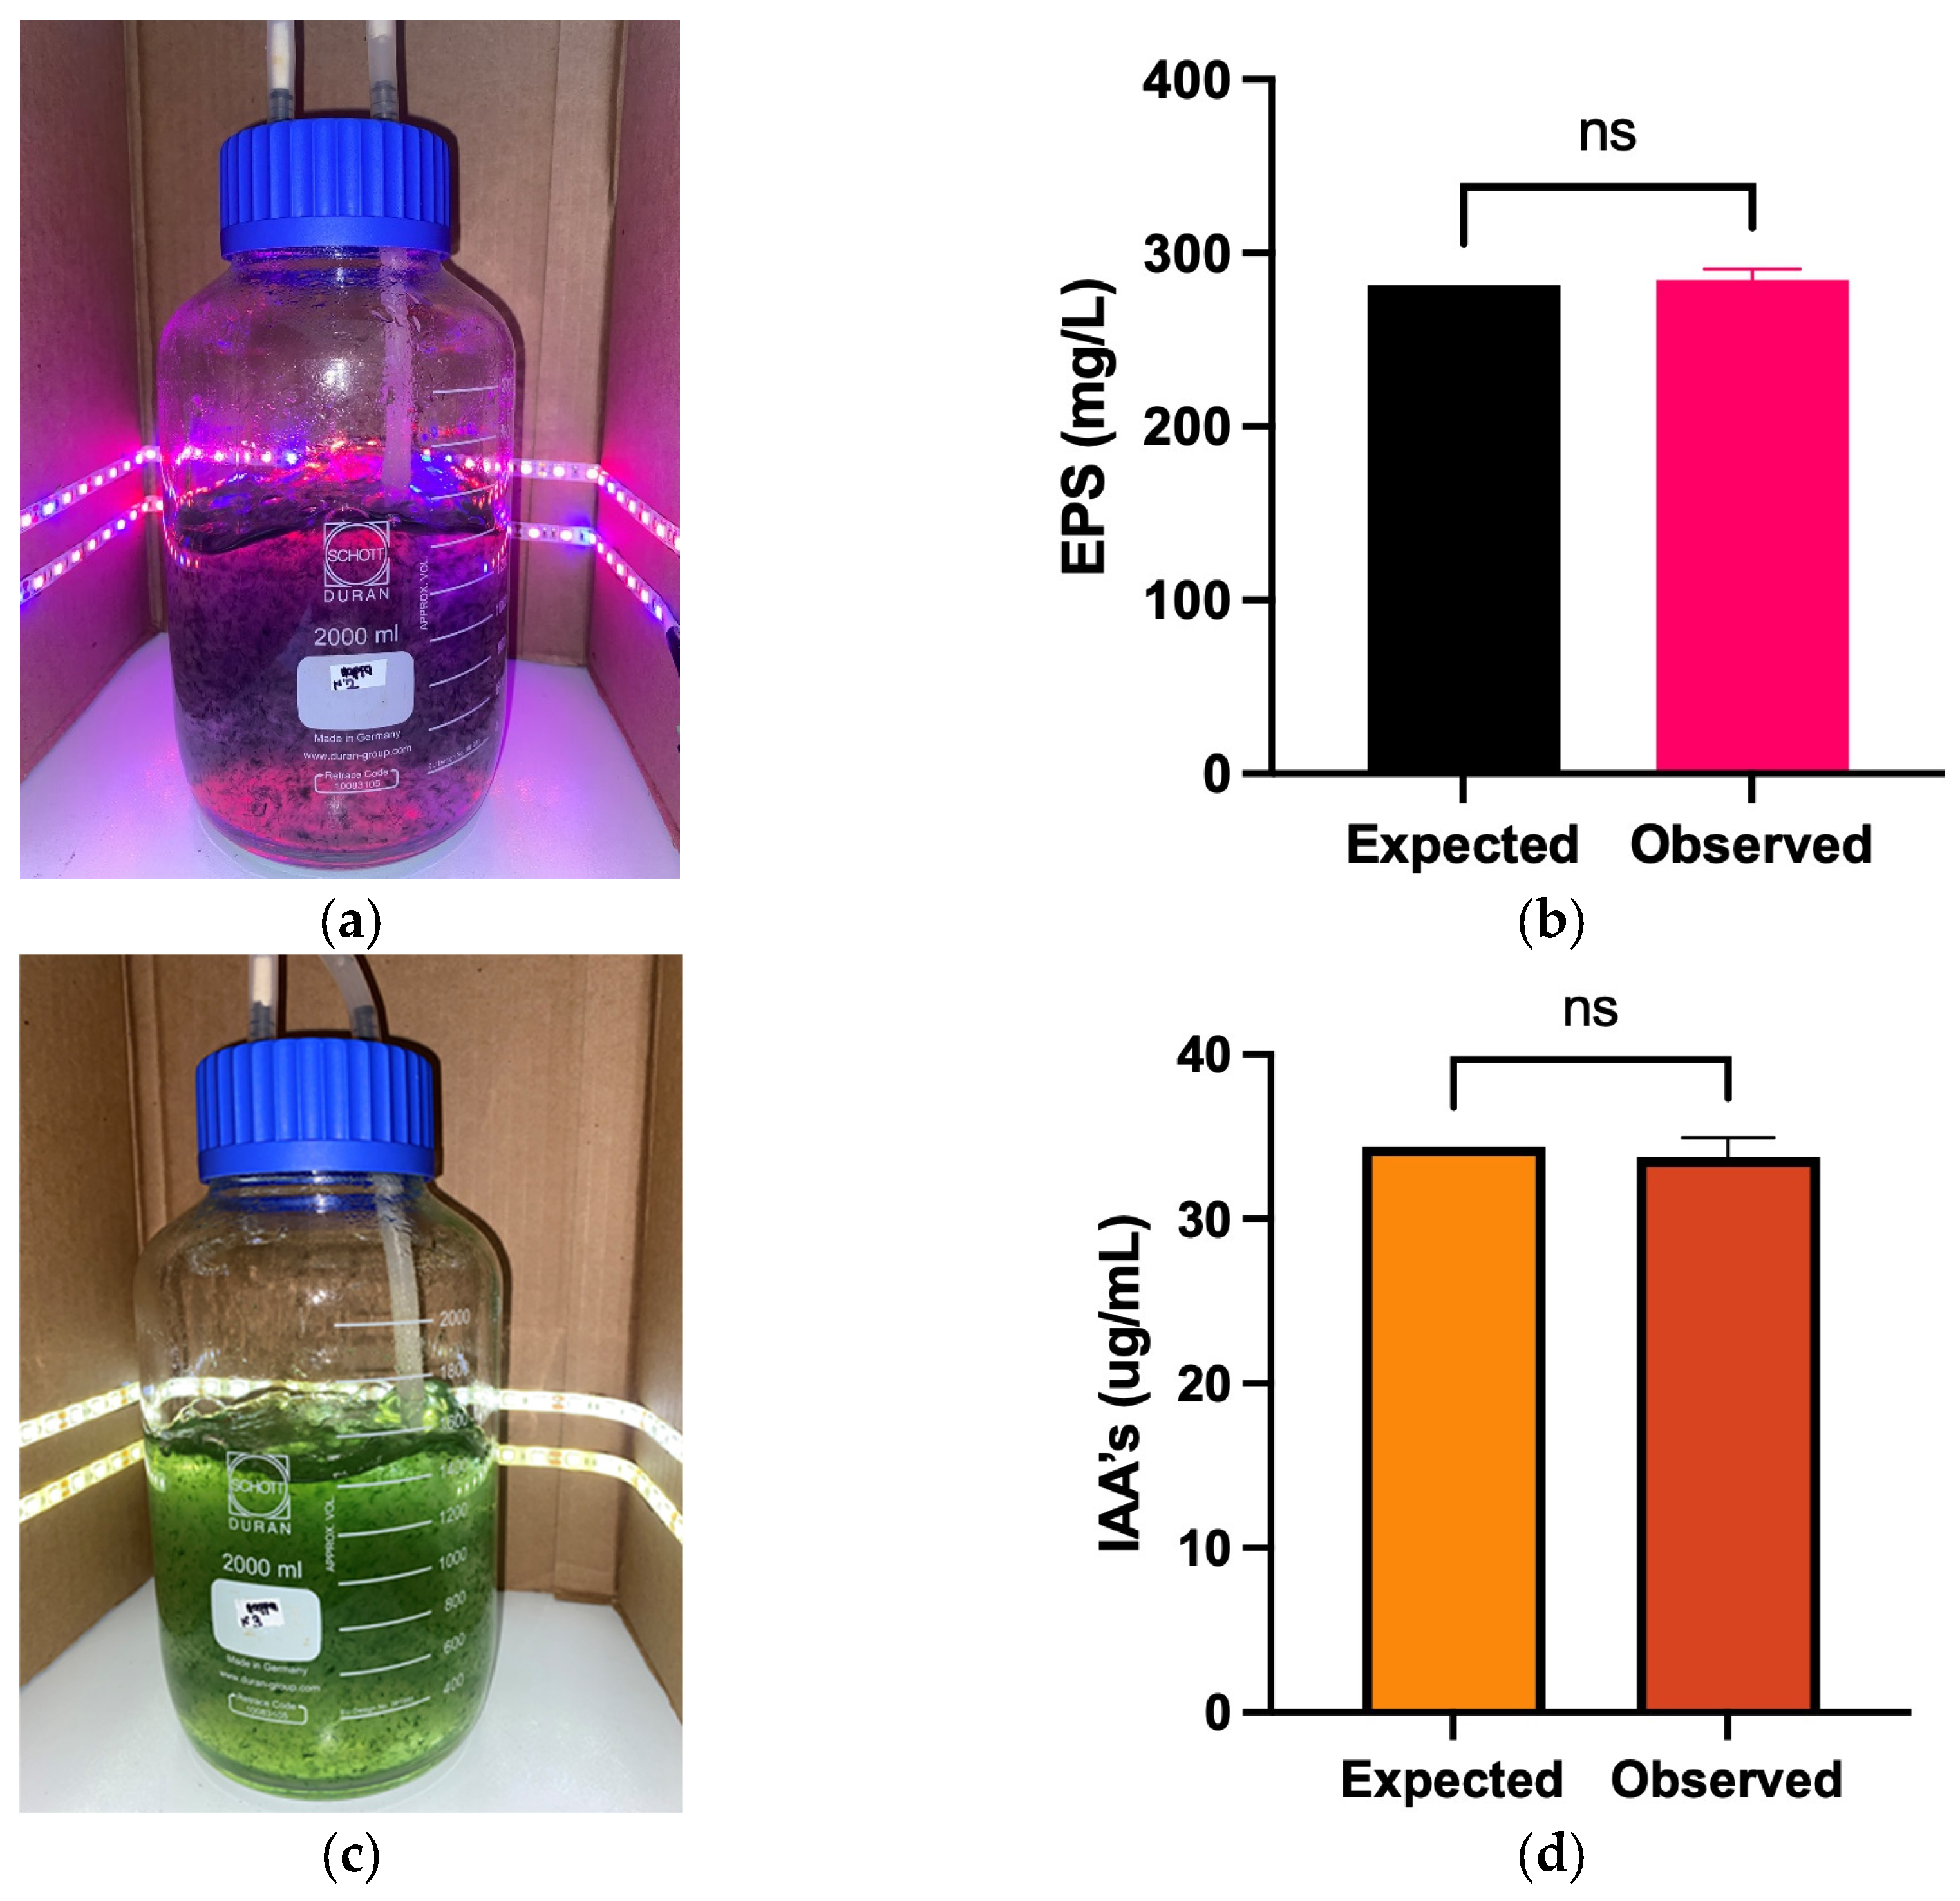
By applying desirability criteria in Design-Expert software, the optimal experimental conditions for maximizing the production of exopolysaccharides (EPS) and indole-3-acetic acid (IAA) were established (Table 3). These conditions were tested using a 2 L GL80 flask with a working volume of 1200 mL. The medium was agitated by air injection at an approximately 180 mLair/min flow rate. The strain was cultured under Blue:Red and had the light intensity irradiance of 100 μmol m−2 s−1 and a 12:12 h light–dark cycle for 20 days (Figure 5). At the end of the culture time, the flasks were disconnected from the airflow and allowed to decant for 1 h. The medium was centrifuged at 2054× g for 20 min (20 °C). The cell-free medium was used to determine EPS and IAA. It is worth noting that the desirability functions were defined separately for each metabolite. Both EPS (Z1) and IAA (Z2) were assigned a “maximize” goal, with the lowest experimental value as the lower bound and the highest predicted value as the target. Because preliminary trials revealed a metabolic trade-off between the two pathways, no composite desirability was constructed; instead, two independent optimizations were performed. Table 3 presents the optimal light regime obtained for each metabolite individually.
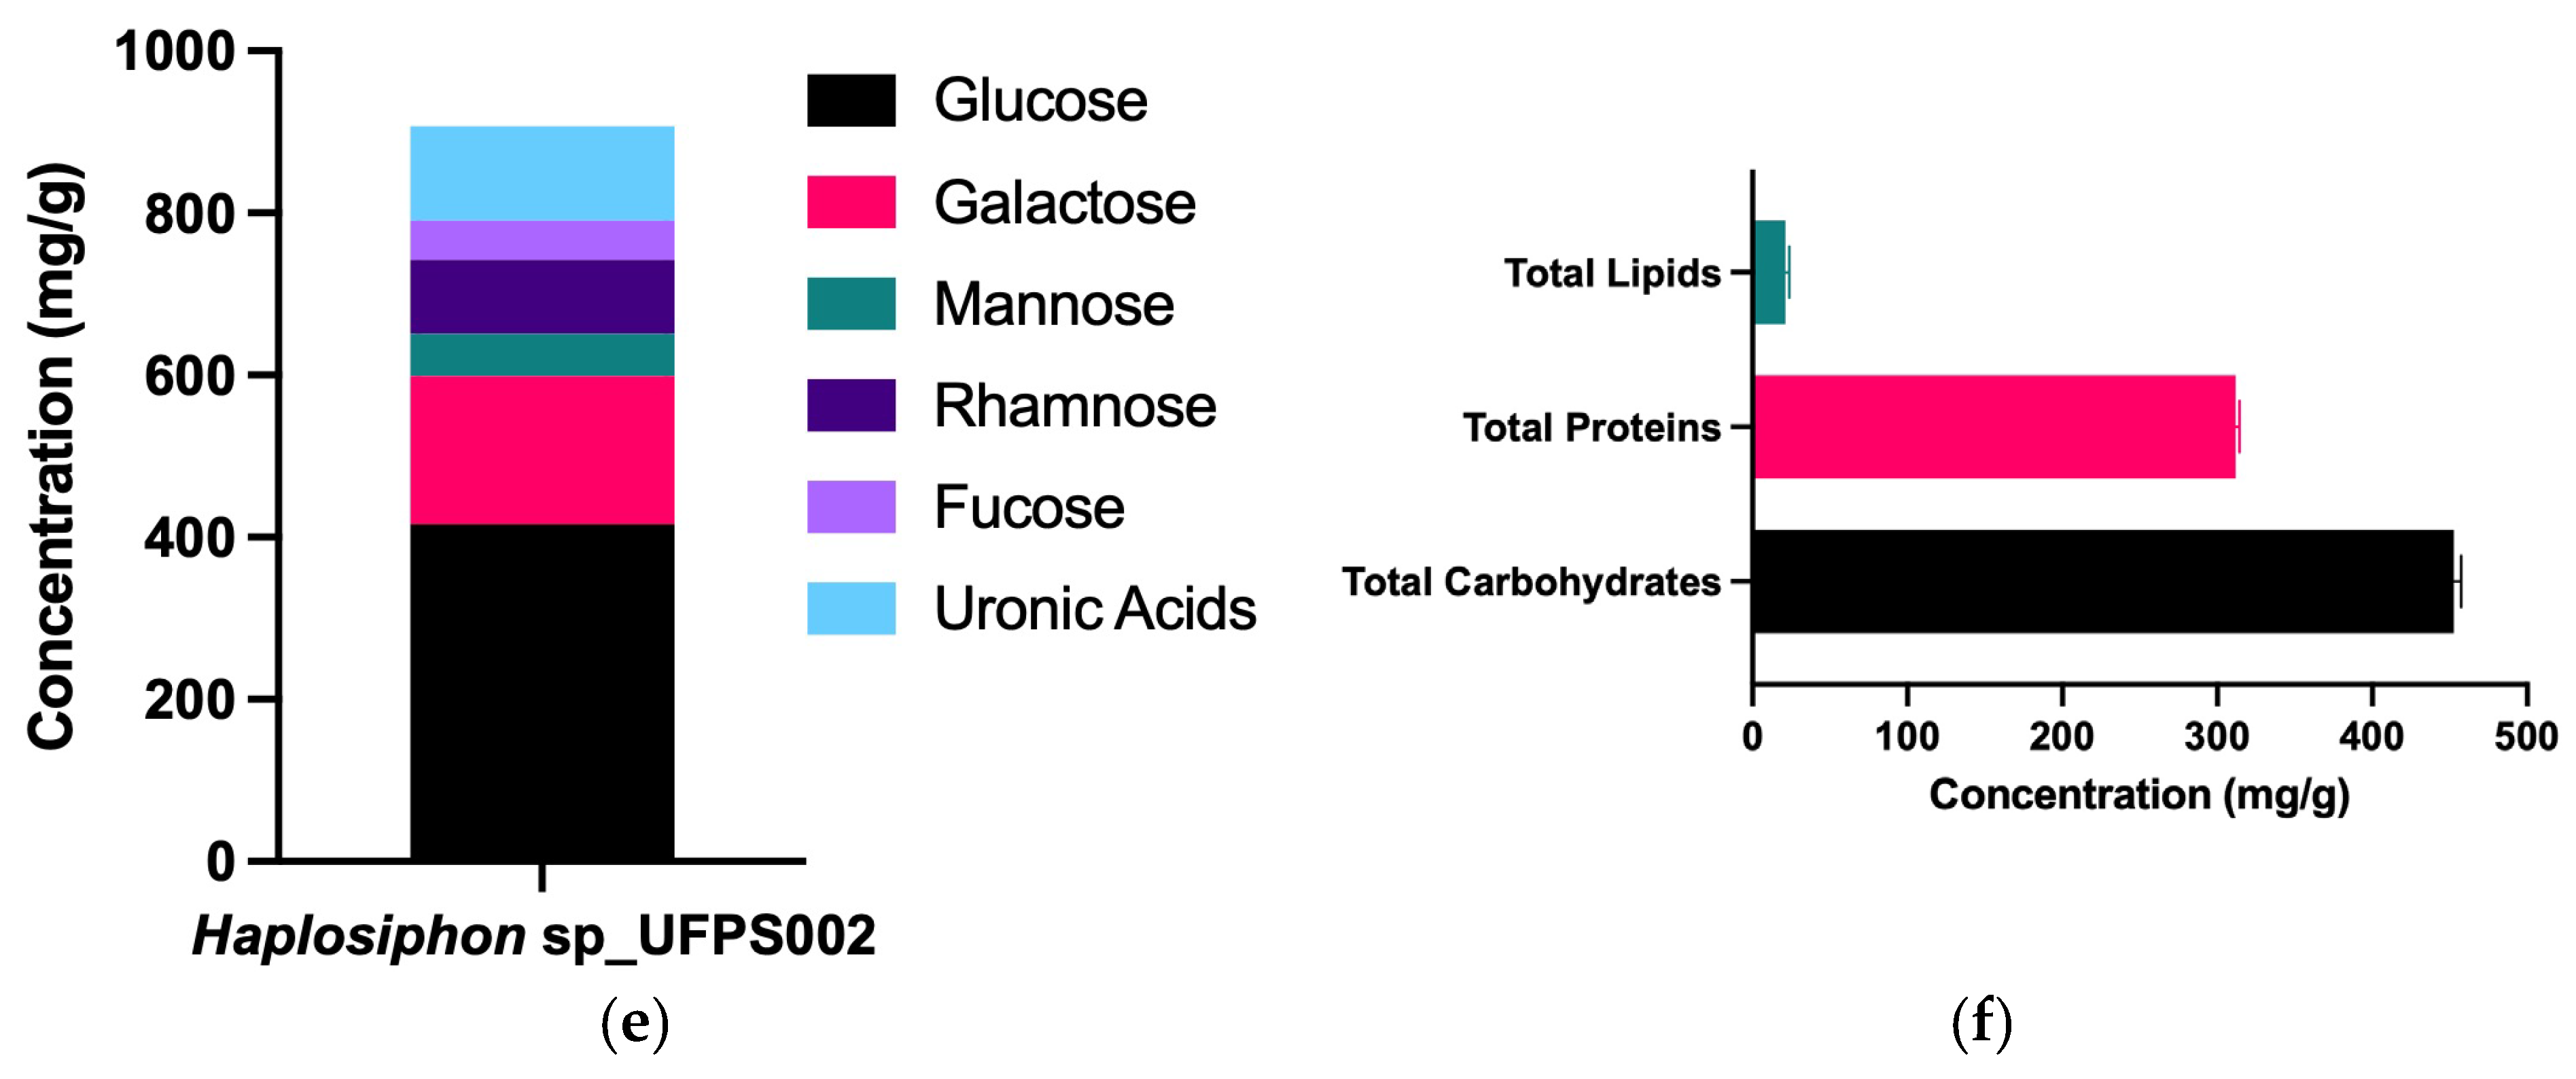
Figure 5 presents the experimental validation of exopolysaccharide (EPS), indole-3-acetic acid (IAA), and the concentrations of carbohydrates, proteins, and lipids during EPS production under optimized conditions. According to the t-test, no significant differences were observed between the measured concentrations and the expected values, indicating that the proposed conditions effectively optimize EPS and IAA’s production.
Figure 5e,f illustrate the biochemical makeup of the EPS generated by Hapalosiphon sp. UFPS002. Figure 5e illustrates that glucose (416 mg/g) and galactose (183 mg/g) were the predominant monosaccharides, accompanied by modest concentrations of rhamnose (91 mg/g), uronic acids (116 mg/g), mannose (52 mg/g), and fucose (49 mg/g), signifying a structurally varied EPS. Figure 5f delineates total biochemical fractions, highlighting carbs as the predominant component (average: 453 mg/g), followed by proteins (312 mg/g) and a negligible fat content (21 mg/g). The elevated levels of carbohydrates and uronic acids indicate promise for bioadhesive or metal-chelating uses.

4. Discussion

The genus Hapalosiphon is a good EPS producer, and its productivity is relatively lower than that of other genera, such as Oscillatoria sp. This can be attributed to the structural and physiological differences between the two genera. Despite their presence, Hapalosiphon sp. generates exopolysaccharides and bioactive compounds under stress conditions, according to Urbina-Suarez et al. [60]. However, the exopolysaccharide content is low compared with that of Oscillatoria sp., indicating that the tested conditions favor the latter genus. Additionally, Tiwari et al. [61] report that some Oscillatoria sp. strains can produce higher three-dimensional levels of more complex exopolysaccharides, which might also explain the enhanced performance observed in this study.
Additionally, the isolate Hapalosiphon sp. UFPS_002 originates from a Colombian geothermal spring (72 °C) and maintains active growth within a temperature range of 25 to 55 °C. This thermotolerance, combined with its native origin, enables the operation of photobioreactors in warm climates without the need for additional cooling, thereby reducing energy consumption and the risk of contamination by mesophilic organisms. The use of a native strain also facilitates regulatory approval, enhancing both the sustainability and regional relevance of the proposed platform.
Studies with non-thermotolerant strains serve to put the performance of the strains under consideration in perspective. For Microcystis aeruginosa, with organic matter used as an accelerating agent, the production of extracellular polymeric substance (EPS) also decreases significantly in similar conditions of light and nutrient variation, which is best under dynamic conditions [29]. In addition, UFPS_002 has a relatively constant EPS yield in high light and extended light periods, implying a higher ability to adapt to stress. A similar scenario is also observed in Gloeocapsa gelatinosa; its EPS can be utilized in high salinity and a wide range of temperatures [62]. Similarly, thermotolerant Pseudomonas alcaligenes producing exopolysaccharides have been studied when isolated from hot water springs [63], which not only hold commercial significance for use as a thickener but also reveal that the thermotolerant strains could be efficiently applied in bioprocessing industries dealing with harsh climatic environments.
Regarding IAA production, the differences between the genera were not as pronounced, indicating that the biosynthetic pathways for Indole-Acetic Acid may be more conserved across both genera. This finding is consistent with previous studies suggesting that IAA production in cyanobacteria tends to be less variable between genera compared with other metabolites, such as EPS. Batucan et al. [64] reported that both Hapalosiphon sp. and Oscillatoria sp. have similar capacities for producing bioactive compounds, such as IAA, which may explain the lack of significant variation observed in this study. Therefore, while both genera exhibit comparable abilities for IAA synthesis, the differences are more pronounced in EPS production, reflecting each genus’s metabolic and environmental adaptations.
The results from the analysis of exopolysaccharide (EPS) and indole-3-acetic acid (IAA) production under controlled conditions of light cycle, light intensity, and LED light source type reveal distinct response patterns that facilitate a deeper understanding of optimizing production and metabolic regulation. Light intensity and the type of light source significantly influenced EPS synthesis, suggesting that regulating these parameters is crucial for maximizing production efficiency in microalgal and cyanobacterial systems. This observation is consistent with recent studies documenting the dependence of EPS production on light intensity in phototrophic organisms, such as A. platensis and Chlamydomonas asymmetrica, where a tenfold increase in EPS concentration was observed under optimal light intensities [65]. Madsen et al. [36] showed that extracellular polymeric substance (EPS) production in Synechocystis sp. PCC 6803 is strongly influenced by the culture medium composition: magnesium and sulfur concentrations alter both the quantity and the polysaccharide profile, while simultaneously triggering a Wzy-dependent biosynthetic pathway associated with the protective functions of the EPS. Even so, this strain displayed reduced productivity under prolonged photoperiods, a response likely linked to its sensitivity to light stress.
In contrast, the thermotolerant strains developed in the present work presented constant EPS production without genetic modification. There are reports that G. gelatinosa can maintain efficiency under continuous light conditions [63], while Microcystis aeruginosa exhibits a significant decrease in efficiency under high-irradiance conditions [29]. These observations reinforce the benefits of using robust strains, like those examined in this study, in agricultural settings exposed to intense solar radiation.
The monosaccharide content of the EPS matrix generated by Hapalosiphon sp. UFPS002 exhibited a unique profile in contrast to previously documented cyanobacterial strains. Glucose was the predominant sugar at 416 mg/g, surpassing the levels found in Nostoc flagelliforme (412 mg/g) [66] and Synechocystis sp. PCC 6803 (376 mg/g) [49], and was approximately threefold greater than that in Chroococcus sp. FPU101 (95 mg/g) [67]. Galactose was significantly elevated at 183 mg/g, surpassed only by Nostoc at 211 mg/g, indicating a structurally intricate heteropolysaccharide. The mannose content in Hapalosiphon (52 mg/g) was inferior to that in Nostoc (210 mg/g) and Synechocystis sp. PCC 6803 (124 mg/g) [49], although it surpassed the levels seen in Cyanothece sp. [68] and Arthrospira platensis [69]. Rhamnose (91 mg/g) and fucose (49 mg/g) concentrations in Hapalosiphon were moderate, indicating possible roles in EPS stability and metal binding, similar to the values observed in Synechocystis sp. PCC 6803 and Chroococcus sp. FPU101. Uronic acids were significantly prevalent at 116 mg/g, surpassing the concentrations found in N. flagelliforme and A. platensis, although remaining somewhat lower than those in Cyanothece sp and Chroococcus sp FPU101, which both topped 220 mg/g. The EPS composition of Hapalosiphon sp. UFPS002 exhibited elevated glucose and galactose levels, accompanied by moderate acidic sugar concentrations, indicating a potential for robust bioadhesive and emulsifying applications. These findings position Hapalosiphon among the more prolific cyanobacteria in terms of carbohydrate-rich EPS production.
The interaction between the light cycle and light intensity affected EPS production. Continuous illumination can initiate photoinhibition, while even short dark periods can help restore photosystem damage [43,70]. The photoperiod impacts microalgal life cycles and metabolic activities [71]. According to Vásquez-Villalobos [71], Spirulina (Arthospira) sp. cannot tolerate prolonged light exposure, as it may undergo photolysis, necessitating controlled illumination in regulated 12/12 h (day/night) photoperiods. In the case of N. calcicola, a light intensity of 21 μmol m−2 s−1 and an 8:16 light photoperiod promote the accumulation of protein and phycobiliproteins. A light intensity of 63 μmol m−2 s−1 and a more extended illumination period (16:8 light) result in carbohydrate and carotenoid accumulation [23,69].
The synergistic interaction between these factors may be related to the temporal modulation of photosynthetic processes and the metabolic adaptability of organisms to periodic variations in irradiance. This phenomenon has been reported in previous studies, where the combination of light and dark cycles affects growth rates and the synthesis of exopolymeric metabolites. For example, in Scenedesmus abundans, a constant photoperiod favored EPS production under high light intensities [72]. Similarly, experiments with Porphyridium sordidum and P. purpureum showed that light manipulation at different wavelengths also affected optimizing EPS production, demonstrating that precise regulation of light parameters can significantly enhance exopolymetric yields [73]. Another critical aspect is the structural composition of the extracellular polymeric substances (EPS). In strains isolated from extreme environments—such as G. gelatinosa—a high proportion of functional moieties, including uronic and sulfated acids, has been identified, imparting enhanced antioxidant capacity and metal-binding affinity [62]. Sarkar et al. observed similar properties in geothermal Pseudomonas alcaligenes, emphasizing viscoelastic characteristics that support the formation of stable, resilient biofilms [63]. By contrast, recent studies show that Synechocystis sp. produces EPS with a lower diversity of monomers under fluctuating conditions, which may limit its industrial applicability in uncontrolled settings [20].
On the other hand, regarding IAA production, the type of light source proved to be a determining factor, aligning with previous research indicating that light quality directly influences the expression of genes associated with carbohydrate metabolism and secondary compounds in cyanobacteria. A study conducted with Rhodopseudomonas palustris found that combinations of light intensities and different light cycles affected not only the production of photosynthetic pigments but also the synthesis of bioactive compounds such as IAA, highlighting the role of light in regulating key metabolic pathways [74]. Furthermore, the results of this study, where the interaction between light cycle and light source showed a significant effect, might be related to the differential activation of metabolic pathways during light and dark periods, favoring phytohormone biosynthesis under specific light conditions, as observed in Nostoc sp. and N. flagelliforme, where light quality and regulation of light-induced oxidative stress play a key role in the accumulation of EPS and other bioactive metabolites [75,76]. Finally, these findings validate the importance of light quality and cycle as critical factors in regulating secondary metabolite production in phototrophic microorganisms. Identifying these interactions between light and light cycles reinforces the potential of photomanipulation as a viable strategy for optimizing large-scale biotechnological processes without the need for complex genetic interventions. Moreover, regulating these environmental variables could enable greater specificity in activating metabolic pathways, favoring the selective synthesis of EPS and IAA, as observed in other photoautotrophic systems [75].
The optimization of exopolysaccharide (EPS) and indole-3-acetic acid (IAA) production in cyanobacteria and microalgae is strongly influenced by light conditions and nutrient supplementation, as confirmed by several recent studies. Moderate light intensities have been shown to enhance EPS production significantly. A study conducted by Al-Katib et al. on Gloeocapsa sp. demonstrated that tryptophan supplementation, combined with controlled lighting conditions, resulted in a substantial increase in the synthesis of both EPS and IAA [77]. This suggests that moderate light conditions and the presence of nutrients are crucial factors in enhancing the biosynthesis of these compounds.
Additionally, studies on Rhodobacter sp. by Govarthanan et al. revealed that blue light, in combination with moderate light intensities, also boosts EPS production [78]. This work highlighted that specific light configurations are critical for maximizing exopolysaccharide production in photosynthetic bacteria. Mahesh et al. corroborated this trend in photobioreactors, emphasizing that appropriate light conditions are essential for synthesizing high-value biochemical products, such as EPS, in industrial contexts. Blue light has been identified as a key factor in improving EPS production [72].
IAA, the most vital phytohormone responsible for plant growth and development [79,80], is also highly influenced by light conditions and tryptophan supplementation in the cyanobacteria Gloeocapsa sp. Tryptophan supplementation in continuous lighting culture conditions resulted in significantly high IAA yields, reaching as high as 118 µg/mL [78]. An analogous response is observed in Planktothricoides raciborskii, with high IAA levels reported in light- and tryptophan-controlled assays, confirming that these variables are key players in driving auxin biosynthesis in photosynthetic organisms [81].
Similarly, the microalga Chlorella vulgaris exhibited comparable behavior in terms of IAA production. Under heterotrophic conditions, the addition of tryptophan resulted in IAA levels of up to 265 µg/mL, suggesting that the combination of light and specific nutrients, such as tryptophan, is an effective strategy for enhancing the synthesis of this phytohormone in microalgal systems [82]. Furthermore, the study by Lin et al. on the interaction between microalgae and bacteria in culture systems highlights that IAA production can be optimized through manipulation of light conditions and symbiotic interactions with auxin-producing bacteria [83]. This opens new perspectives for applied algal biotechnology.
The newly introduced findings from this study further reinforce the significance of manipulating the light regime. Response surface methodology (RSM) provided statistically robust models with high predictive accuracy for EPS and IAA production. The adjusted R2 and predicted R2 values were closely aligned (EPS: 0.9826 vs. 0.9382; IAA: 0.9937 vs. 0.9838), indicating a reliable fit to the observed data. Moreover, the models’ lack of fit was non-significant for both metabolites, confirming the adequacy of the selected light variables in shaping metabolite synthesis.
The 3D surface plots illustrate nonlinear responses of EPS and IAA to photoperiod and light intensity, suggesting optimal zones rather than linear dependencies. These parabolic trends emphasize the importance of identifying mid-range, balanced conditions for optimal biosynthetic activity. Light intensity and duration do not act independently, but rather synergistically, in this context. Furthermore, the experimental validation phase confirmed the practical relevance of the models, with no significant differences between predicted and observed values. This underscores the feasibility of applying these conditions in scaled cultivation systems.
A particularly intriguing finding is the divergence in optimal conditions for EPS and IAA production: red/blue light (B:R 1:5) favored EPS accumulation, whereas white light yielded higher IAA levels. This supports the hypothesis that specific light qualities activate different regulatory pathways; EPS synthesis likely benefits from the stimulation of photosynthesis and carbon flow by red light. In contrast, due to its broader spectrum, white light may more effectively trigger auxin biosynthesis via photoreceptors sensitive to blue and UV components.
The detected differences between EPS and IAA production are assumed to be induced by the specific activation of the photoreceptors and the related metabolic pathways. Under red-enriched light (blue:red ratio of 1:5), the phytochrome-activated pathway predominates, with a higher PSI/PSII ratio and cyclic electron flow. This maximizes the cellular energy balance and channels reducing equivalents to the biosynthesis of extracellular polymeric substances (EPS) [84,85]. At the same time, the decrease in blue light within this waveband inhibits signal transduction through cryptochromes and PixJ proteins, which in turn downregulate the key enzyme involved in the auxin synthetic pathway, including tryptamine aminotransferase (TAM) and indole-3-pyruvate monooxygenase [86,87]. As a consequence, the spectral modulation affects not only photosynthesis but also hormonal and metabolic pathways related to EPS and IAA synthesis. At the transcriptional level, exposure to red-light pulses activates the PhyA/PhyB–PIF signalling axis, thereby enhancing expression of the wzy-epsB operon—responsible for exopolysaccharide polymerisation and export—through modulation of redox regulators such as RppA [88]. By contrast, attenuation of the blue component weakens signalling via the cyanobacteriochromes PixJ and CcaS, which suppresses transcription of key genes in the indole-3-pyruvate pathway—iaaM, iaaH, and ipdC—which are essential for indole-3-acetic acid (IAA) biosynthesis [89].
At present, no specific transcriptomic profiles for Hapalosiphon spp. have been reported. However, the RNA-seq studies of Synechocystis sp. 6803 demonstrate that the PHYB–PIF unit controls expression of genes related to exopolysaccharide biosynthesis -including the wzy-epsB operon-, especially in response to light stress [36]. CcaS and cryptochromes activation was associated with the induction of iaaM, iaaH, and ipdC, the genes involved in the indole-3-pyruvate pathway to produce IAA, in Synechococcus elongatus UTEX 2973 [90]. Recent research has also found that the activity of these photoregulators is highly light-spectrally specific, resulting in high specificity in the regulation of secondary metabolic pathway expression levels [91]. These results, taken together, further support the photoregulatory hypothesis and underscore the need to characterize the transcriptome-wide gene expression response of UFPS_002 to various light conditions.
Table 4 compares EPS and IAA production across a diverse range of cyanobacteria and microalgae subjected to varying light spectra, intensities, and photoperiods. The results indicate that of the strains evaluated in this study, Hapalosiphon sp. UFPS_002 exhibits competitive EPS yields relative to model organisms such as P. curentum and Nostoc minutum, which are well-documented for their high exopolysaccharide productivity. For instance, N. minutum produced up to 2485 mg/L of EPS under white light with intensities ranging from 67 to 147 μmol m−2 s−1, which exceeds the values obtained in this study but was achieved under more intense and possibly energy-intensive lighting conditions [27]. Similarly, P. curentum and Synechocystis sp. have demonstrated enhanced EPS production under monochromatic blue and red light, while showing reduced efficiency under white light [36,92], underscoring the role of spectral quality in optimizing metabolite synthesis.
The EPS production recorded for Hapalosiphon sp. UFPS_002 in this study (281.4 mg/L) under a blue:red (1:5) LED at 85 μmol m−2 s−1 and a 14.5 h photoperiod, although lower than the highest-yielding strains, is still noteworthy. It highlights the efficacy of balanced, energy-efficient light spectra in promoting metabolite accumulation under moderate conditions. These findings support the notion that optimizing light quality and duration can substantially enhance EPS production without extreme environmental inputs. Likewise, the patterns of IAA biosynthesis observed align well with previously published reports. For example, Planktothricoides raciborskii produced 3.04 μg/mL of IAA under a 12:12 h light/dark cycle with fluorescent lighting [81], which is lower than the 34.4 μg/mL reported for Hapalosiphon sp. UFPS_002 in this study under a cool white LED system with a slightly extended photoperiod. This significant increase may be attributed to the spectrum and continuity of the applied lighting, further suggesting that light intensity, wavelength composition, and duration are critical factors in regulating auxin biosynthesis. This reinforces the utility of controlled LED environments for stimulating phytohormone output in phototrophic microorganisms. Altogether, the comparisons underscore the metabolic plasticity of cyanobacteria and highlight how deliberate manipulation of light parameters—spectrum, intensity, and cycle—can be strategically used to optimize the biosynthesis of value-added compounds such as EPS and IAA. This study’s moderate yet robust yields illustrate that strains like Hapalosiphon sp. can perform comparably to benchmark species when cultured under refined, resource-efficient photic conditions.
When production is normalized to the applied irradiance of 85 µmol m−2 s−1 and to the absence of enriched CO2 or costly supplements, the 281 mg L−1 of EPS corresponds to an energy-specific productivity comparable to that of strains achieving higher titres but only under substantially greater irradiance or resource inputs. The thermotolerance of UFPS_002 allows operation without cooling systems, thereby simplifying photobioreactor design and reducing power consumption. This operational efficiency gives the reported yield clear industrial relevance.
The response surface validation revealed that an irradiance of 85 µmol m−2 s−1 with a 14.5 h photoperiod yields 281 mg L−1 of extracellular polymeric substances (EPS) under blue:red (B:R) LED lighting at a 1:5 ratio. At the same time, the same intensity with cool white LEDs increases indole-3-acetic acid (IAA) production to 34 µg mL−1. These yields, achieved using a native thermotolerant strain without genetic engineering or costly supplements, demonstrate that spectral manipulation differentially directs carbon flux toward either polysaccharide or auxin biosynthesis. This finding enables the development of low-energy photonic platforms for agricultural bioproducts. It raises new questions regarding the metabolic trade-offs between EPS and IAA pathways in light-limited industrial settings.

5. Conclusions

The results indicate that exopolysaccharide (EPS) synthesis was maximized under a blue:red LED ratio of 1:5, whereas indole-3-acetic acid (IAA) production peaked under cool-white light at the same irradiance and photoperiod. Statistical analysis confirmed that spectrum, intensity, and photoperiod exert significant effects, underscoring the need for precise control of these parameters to optimize each metabolite individually in controlled cultures.
These findings support the implementation of phase-shift or dual-illumination strategies—for example, an initial stage under B:R 1:5 to accumulate EPS, followed by a switch to cool-white light to enhance IAA—as a practical route to balance dual production. Overall, the data position the thermotolerant native strain Hapalosiphon sp. UFPS_002 as a promising low-energy platform for agricultural biopolymer and biofertilizer applications.

Author Contributions

Conceptualization, A.F.B.-S., J.B.G.-M. and A.Z.; methodology, R-L. and J.B.G.-M.; software, A.F.B.-S. and A.Z.; validation, K.A.M.-J., R.L. and J.B.G.-M.; formal analysis, K.A.M.-J. and A.F.B.-S.; investigation, K.A.M.-J. and J.B.G.-M.; resources, A.Z., A.F.B.-S. and J.B.G.-M.; data curation, A.Z., A.F.B.-S. and J.B.G.-M.; writing—original draft preparation, K.A.M.-J.; writing—review and editing, A.F.B.-S. and J.B.G.-M.; visualization, A.F.B.-S.; supervision, A.Z.; project administration, A.F.B.-S.; funding acquisition, A.Z. and A.F.B.-S. All authors have read and agreed to the published version of the manuscript.

Funding

This research was funded by Universidad Francisco de Paula Santander (Colombia) (FINU 011-2023), the Ministry of Science and Technology of Colombia, and the Colombian Institute of Educational Credit and Technical Studies Abroad (MINCIENCIAS-ICETEX) under the project titled “FOTOLIX” with ID 2023-0686. Sapienza University of Rome also funded it for the Academic Mid Projects 2021. RM12117A8B58023A.

Institutional Review Board Statement

Not applicable.

Informed Consent Statement

Not applicable.

Data Availability Statement

Data are contained within the article.

Acknowledgments

We would like to express our sincere gratitude to Sapienza University of Rome (Italy) and Universidad Francisco de Paula Santander (Colombia) for providing the equipment for this research. We also thank the Colombian Ministry of Science, Technology, and Innovation MINCIENCIAS for supporting national Ph.D. Doctorates through the Francisco José de Caldas scholarship program.

Conflicts of Interest

The authors declare no conflicts of interest.

References

  1. Barajas-Solano, A.F. Optimization of Phycobiliprotein Solubilization from a Thermotolerant Oscillatoria sp. Processes 2022, 10, 836. [Google Scholar] [CrossRef]
  2. Zuorro, A.; Leal-Jerez, A.G.; Morales-Rivas, L.K.; Mogollón-Londoño, S.O.; Sanchez-Galvis, E.M.; García-Martínez, J.B.; Barajas-Solano, A.F. Enhancement of Phycobiliprotein Accumulation in Thermotolerant Oscillatoria sp. through Media Optimization. ACS Omega 2021, 6, 10527–10536. [Google Scholar] [CrossRef] [PubMed]
  3. Castellanos-Estupiñan, M.; Carrillo-Botello, A.; Rozo-Granados, L.; Becerra-Moreno, D.; García-Martínez, J.; Urbina-Suarez, N.; López-Barrera, G.; Barajas-Solano, A.; Bryan, S.; Zuorro, A. Removal of Nutrients and Pesticides from Agricultural Runoff Using Microalgae and Cyanobacteria. Water 2022, 14, 558. [Google Scholar] [CrossRef]
  4. Mehariya, S.; Goswami, R.K.; Verma, P.; Lavecchia, R.; Zuorro, A. Integrated Approach for Wastewater Treatment and Biofuel Production in Microalgae Biorefineries. Energies 2021, 14, 2282. [Google Scholar] [CrossRef]
  5. Vergel-Suarez, A.H.; García-Martínez, J.B.; López-Barrera, G.L.; Barajas-Solano, A.F.; Zuorro, A. Impact of Biomass Drying Process on the Extraction Efficiency of C-Phycoerythrin. BioTech 2023, 12, 30. [Google Scholar] [CrossRef]
  6. Vergel-Suarez, A.H.; García-Martínez, J.B.; López-Barrera, G.L.; Urbina-Suarez, N.A.; Barajas-Solano, A.F. Influence of Critical Parameters on the Extraction of Concentrated C-PE from Thermotolerant Cyanobacteria. BioTech 2024, 13, 21. [Google Scholar] [CrossRef]
  7. Pandey, S.N.; Verma, I.; Kumar, M. Cyanobacteria: Potential Source of Biofertilizer and Synthesizer of Metallic Nanoparticles; INC: Tokyo, Japan, 2020; ISBN 9780128193112. [Google Scholar]
  8. Roque, J.; Brito, Â.; Rocha, M.; Pissarra, J.; Nunes, T.; Bessa, M.; Vieira, J.; Vieira, C.P.; Melo, P.; Tamagnini, P. Isolation and Characterization of Soil Cyanobacteria and Microalgae and Evaluation of Their Potential as Plant Biostimulants. Plant Soil 2023, 493, 115–136. [Google Scholar] [CrossRef]
  9. Álvarez, C.; Jiménez-Ríos, L.; Iniesta-Pallarés, M.; Jurado-Flores, A.; Molina-Heredia, F.P.; Ng, C.K.Y.; Mariscal, V. Symbiosis between Cyanobacteria and Plants: From Molecular Studies to Agronomic Applications. J. Exp. Bot. 2023, 74, 6145–6157. [Google Scholar] [CrossRef]
  10. Wang, J.; Qin, S.; Lin, J.; Wang, Q.; Li, W.; Gao, Y. Phycobiliproteins from Microalgae: Research Progress in Sustainable Production and Extraction Processes. Biotechnol. Biofuels Bioprod. 2023, 16, 170. [Google Scholar] [CrossRef]
  11. Zhang, K.; Li, Y.; Wang, K.; Liu, D.; Dou, S.; Chen, Y.; He, M.; Ma, C. Response of Soil Enzymes to Soil Properties and Seasonal Characteristics of Cyanobacteria-Dominated Crusts in a Dryland Ecosystem. J. Soils Sediments 2023, 23, 2756–2765. [Google Scholar] [CrossRef]
  12. Reyes-Galvis, M.L.; López-Barrera, G.L.; Urbina-Suarez, N.A.; García-Martínez, J.B.; Barajas-Solano, A.F. Optimizing Cyanobacterial Strain Selection for Antimicrobial Nanoparticle Synthesis: A Comprehensive Analysis. Sci 2024, 6, 83. [Google Scholar] [CrossRef]
  13. Potnis, A.A.; Raghavan, P.S.; Rajaram, H. Overview on Cyanobacterial Exopolysaccharides and Biofilms: Role in Bioremediation. Rev. Environ. Sci. Biotechnol. 2021, 20, 781–794. [Google Scholar] [CrossRef]
  14. Santini, G.; Biondi, N.; Rodolfi, L.; Tredici, M.R. Plant Biostimulants from Cyanobacteria: An Emerging Strategy to Improve Yields and Sustainability in Agriculture. Plants 2021, 10, 643. [Google Scholar] [CrossRef] [PubMed]
  15. Vinoth, M.; Sivasankari, S.; Ahamed, A.K.K.; Alsamhary, K.I.; Al-enazi, N.M.; Abdel-Raouf, N.; Alharbi, R.M.; Govindarajan, R.K.; Ravi, G.; Alarjani, K.M.; et al. Bio-Characterization and Liquid Chromatography–Mass Spectrometry Analysis of Exopolysaccharides in Biofilm-Producing Cyanobacteria Isolated from Soil Crust: Exploring the Potential of Microalgal Biomolecules. Biology 2023, 12, 1065. [Google Scholar] [CrossRef] [PubMed]
  16. Cao, T.N.-D.; Mukhtar, H.; Le, L.-T.; Tran, D.P.-H.; Ngo, M.T.T.; Pham, M.-D.-T.; Nguyen, T.-B.; Vo, T.-K.-Q.; Bui, X.-T. Roles of Microalgae-Based Biofertilizer in Sustainability of Green Agriculture and Food-Water-Energy Security Nexus. Sci. Total Environ. 2023, 870, 161927. [Google Scholar] [CrossRef]
  17. Sukhikh, S.; Popov, V.; Kashinskikh, E.; Budenkova, E.; Ivanova, S.; Babich, O. Immunomodulatory Properties of Polysaccharide Extract Samples from Cyanobacterium Sp. Rippka B-1200. Sci. Rep. 2024, 14, 30365. [Google Scholar] [CrossRef]
  18. Zedler, J.A.Z.; Michel, M.; Pohnert, G.; Russo, D.A. Cell Surface Composition, Released Polysaccharides, and Ionic Strength Mediate Fast Sedimentation in the Cyanobacterium Synechococcus Elongatus PCC 7942. Environ. Microbiol. 2023, 25, 1955–1966. [Google Scholar] [CrossRef]
  19. Tiwari, O.N.; Mondal, A.; Bhunia, B.; Bandyopadhyay, T.K.; Jaladi, P.; Oinam, G.; Indrama, T. Purification, Characterization and Biotechnological Potential of New Exopolysaccharide Polymers Produced by Cyanobacterium Anabaena Sp. CCC 745. Polymer 2019, 178, 121695. [Google Scholar] [CrossRef]
  20. Cruz, J.D.; Delattre, C.; Felpeto, A.B.; Pereira, H.; Pierre, G.; Morais, J.; Petit, E.; Silva, J.; Azevedo, J.; Elboutachfaiti, R.; et al. Bioprospecting for Industrially Relevant Exopolysaccharide-Producing Cyanobacteria under Portuguese Simulated Climate. Sci. Rep. 2023, 13, 13561. [Google Scholar] [CrossRef]
  21. Van Camp, C.; Fraikin, C.; Claverie, E.; Onderwater, R.; Wattiez, R. Capsular Polysaccharides and Exopolysaccharides from Gloeothece Verrucosa under Various Nitrogen Regimes and Their Potential Plant Defence Stimulation Activity. Algal Res. 2022, 64, 102680. [Google Scholar] [CrossRef]
  22. Toribio, A.J.; Suárez-Estrella, F.; Jurado, M.M.; López, M.J.; López-González, J.A.; Moreno, J. Prospection of Cyanobacteria Producing Bioactive Substances and Their Application as Potential Phytostimulating Agents. Biotechnol. Rep. 2020, 26, e00449. [Google Scholar] [CrossRef] [PubMed]
  23. Mei, R.; Yang, H.; Guo, C.; Hong, Z.; Hu, Z.; Wu, Y.; Huang, D.; Wang, C. Effects of High Light Exposure and Heterologous Expression of β-Carotene Ketolase on the Metabolism of Carotenoids in Chlamydomonas Reinhardtii. Front. Bioeng. Biotechnol. 2025, 13, 1533661. [Google Scholar] [CrossRef] [PubMed]
  24. Etesami, H.; Glick, B.R. Bacterial Indole-3-Acetic Acid: A Key Regulator for Plant Growth, Plant-Microbe Interactions, and Agricultural Adaptive Resilience. Microbiol. Res. 2024, 281, 127602. [Google Scholar] [CrossRef] [PubMed]
  25. Jose, S.; Renuka, N.; Ratha, S.K.; Kumari, S.; Bux, F. Bioprospecting of Microalgae from Agricultural Fields and Developing Consortia for Sustainable Agriculture. Algal Res. 2024, 78, 103428. [Google Scholar] [CrossRef]
  26. Debnath, S.; Muthuraj, M.; Bandyopadhyay, T.K.; Bobby, M.N.; Vanitha, K.; Tiwari, O.N.; Bhunia, B. Engineering Strategies and Applications of Cyanobacterial Exopolysaccharides: A Review on Past Achievements and Recent Perspectives. Carbohydr. Polym. 2024, 328, 121686. [Google Scholar] [CrossRef]
  27. Casero, M.C.; Velázquez, D.; Pereira, A.; Tejedor, M.d.M.; García, L.; Quesada, A.; Cirés, S. Hidden inside Desert Rocks: Salinity Triggers an Increase in Exopolysaccharides from Endolithic Cyanobacteria with Anti-Inflammatory Potential. Algal Res. 2024, 84, 103817. [Google Scholar] [CrossRef]
  28. Chamizo, S.; Adessi, A.; Torzillo, G.; De Philippis, R. Exopolysaccharide Features Influence Growth Success in Biocrust-Forming Cyanobacteria, Moving from Liquid Culture to Sand Microcosms. Front. Microbiol. 2020, 11, 568224. [Google Scholar] [CrossRef]
  29. Duan, Z.; Tan, X.; Shi, L.; Zeng, Q.; Ali, I.; Zhu, R.; Chen, H.; Parajuli, K. Phosphorus Accumulation in Extracellular Polymeric Substances (EPS) of Colony-Forming Cyanobacteria Challenges Imbalanced Nutrient Reduction Strategies in Eutrophic Lakes. Environ. Sci. Technol. 2023, 57, 1600–1612. [Google Scholar] [CrossRef]
  30. Fang, Y.; Lin, G.; Liu, Y.; Zhang, J. Contaminant Removal Performance and Lipid Productivity of a Cyanobacteria-Bacteria Consortium Containing Exogenous Phytohormones during the Treatment of Antibiotic-Polluted Wastewater. Chemosphere 2024, 361, 142473. [Google Scholar] [CrossRef]
  31. Singh, S.; Kant, C.; Yadav, R.K.; Reddy, Y.P.; Abraham, G. Cyanobacterial Exopolysaccharides: Composition, Biosynthesis, and Biotechnological Applications. In Cyanobacteria; Elsevier: Amsterdam, The Netherlands, 2019; pp. 347–358. [Google Scholar]
  32. Touceda, I.S.; Demay, J.; Duval, C.; Yéprémian, C.; Reinhardt, A.; Marie, B. Light and Temperature Culture Conditions Impact the Metabolome of the Cyanobacterium of Therapeutic Interest Planktothricoides Raciborskii PMC 877.14. Algal Res. 2024, 84, 103738. [Google Scholar] [CrossRef]
  33. Sarsekeyeva, F.K.; Sadvakasova, A.K.; Sandybayeva, S.K.; Kossalbayev, B.D.; Huang, Z.; Zayadan, B.K.; Akmukhanova, N.R.; Leong, Y.K.; Chang, J.-S.; Allakhverdiev, S.I. Microalgae- and Cyanobacteria-Derived Phytostimulants for Mitigation of Salt Stress and Improved Agriculture. Algal Res. 2024, 82, 103686. [Google Scholar] [CrossRef]
  34. Gan, L.; Huang, X.; He, Z.; He, T. Exopolysaccharide Production by Salt-Tolerant Bacteria: Recent Advances, Current Challenges, and Future Prospects. Int. J. Biol. Macromol. 2024, 264, 130731. [Google Scholar] [CrossRef] [PubMed]
  35. Zhou, R.; Zuo, W.; Xie, Y.; Wang, Y.; Li, C.; Tang, Y.; Wang, Z.; Li, Y. Sodium Bisulfite Boosted Exopolysaccharide Production by Auxenochlorella Protothecoides: Potential Mechanisms Harnessing H2O2 Signaling and Carbon Reallocation. Bioresour. Technol. 2025, 420, 132121. [Google Scholar] [CrossRef] [PubMed]
  36. Madsen, M.A.; Semerdzhiev, S.; Twigg, J.D.; Moss, C.; Bavington, C.D.; Amtmann, A. Environmental Modulation of Exopolysaccharide Production in the Cyanobacterium Synechocystis 6803. Appl. Microbiol. Biotechnol. 2023, 107, 6121–6134. [Google Scholar] [CrossRef] [PubMed]
  37. Ansari, A.A.; Ansari, A.A.; Gikonyo, J.G.; Abouhend, A.S.; Park, C. The Coupled Effect of Light and Iron on the Photogranulation Phenomenon. Environ. Sci. Technol. 2023, 57, 9086–9095. [Google Scholar] [CrossRef]
  38. Xu, H.; Wang, H.; Wang, X.; Tang, Z.; Chen, X.; Chen, Y.; Dai, X.; Chen, H.; Wang, H. Fluidized Bed Photobioreactor Based on Diatomite Powder and High Light Intensity Improved Microalgae Harvesting, Nutrient Removal and Lipid Accumulation: Performance and Microscopic Mechanism. Water Res. 2024, 264, 122172. [Google Scholar] [CrossRef]
  39. Wu, L.; Quan, L.; Deng, Z.; Vadiveloo, A.; Cheng, Y.; Yang, L.; Zhang, Z.; Saber, A.A.; Lan, S. Performance of a Biocrust Cyanobacteria-Indigenous Bacteria (BCIB) Co-Culture System for Nutrient Capture and Transfer in Municipal Wastewater. Sci. Total Environ. 2023, 888, 164236. [Google Scholar] [CrossRef]
  40. Contreras-Ropero, J.E.; Barajas-Solano, A.F.; García-Martínez, J.B.; Barajas-Ferrerira, C.; Machuca-Martínez, F. Production of Industrial-Interest Colorants in Microalgae and Cyanobacteria: Leveraging Nutrient Dynamics and Photoperiod Optimization. Ing. Compet. 2024, 26, 1–16. [Google Scholar] [CrossRef]
  41. de Alvarenga, L.V.; Almeida, A.V.M.; de Castro, N.V.; Oder, J.C.; Esteves-Ferreira, A.; Nunes-Nesi, A.; Araújo, W.L.; Vaz, M.G.M.V. Physiological Responses to Light Intensity and Photoperiod of the Halotolerant Cyanobacterium Desmonostoc Salinum CCM-UFV059. Bioresour. Technol. Rep. 2020, 11, 100443. [Google Scholar] [CrossRef]
  42. Santos, M.; Pereira, S.B.; Flores, C.; Príncipe, C.; Couto, N.; Karunakaran, E.; Cravo, S.M.; Oliveira, P.; Tamagnini, P. Absence of KpsM (Slr0977) Impairs the Secretion of Extracellular Polymeric Substances (EPS) and Impacts Carbon Fluxes in Synechocystis sp. PCC 6803. mSphere 2021, 6, 10–1128. [Google Scholar] [CrossRef]
  43. Maltsev, Y.; Maltseva, K.; Kulikovskiy, M.; Maltseva, S. Influence of Light Conditions on Microalgae Growth and Content of Lipids, Carotenoids, and Fatty Acid Composition. Biology 2021, 10, 1060. [Google Scholar] [CrossRef] [PubMed]
  44. Pfennig, T.; Kullmann, E.; Zavřel, T.; Nakielski, A.; Ebenhöh, O.; Červený, J.; Bernát, G.; Matuszyńska, A.B. Shedding Light on Blue-Green Photosynthesis: A Wavelength-Dependent Mathematical Model of Photosynthesis in Synechocystis sp. PCC 6803. PLoS Comput. Biol. 2024, 20, e1012445. [Google Scholar] [CrossRef] [PubMed]
  45. Esteves, A.F.; Salgado, E.M.; Vilar, V.J.P.; Gonçalves, A.L.; Pires, J.C.M. A Growth Phase Analysis on the Influence of Light Intensity on Microalgal Stress and Potential Biofuel Production. Energy Convers. Manag. 2024, 311, 118511. [Google Scholar] [CrossRef]
  46. Xu, K.; Zhao, L.; Juneau, P.; Chen, Z.; Zheng, X.; Lian, Y.; Li, W.; Huang, P.; Yan, Q.; Chen, X.; et al. The Photosynthetic Toxicity of Nano-Polystyrene to Microcystis Aeruginosa Is Influenced by Surface Modification and Light Intensity. Environ. Pollut. 2024, 356, 124206. [Google Scholar] [CrossRef]
  47. Moore, V.; Vermaas, W. Functional Consequences of Modification of the Photosystem I/Photosystem II Ratio in the Cyanobacterium Synechocystis sp. PCC 6803. J. Bacteriol. 2024, 206, e00454-23. [Google Scholar] [CrossRef]
  48. Bellver, M.; Altamira-Algarra, B.; García, J.; Ferrer, I.; Gonzalez-Flo, E. Enhancing Pigment Production with Cyanobacteria-Rich Microbiomes: Effect of Light Quality and Exposure Time. Algal Res. 2024, 83, 103726. [Google Scholar] [CrossRef]
  49. Velmurugan, R.; Incharoensakdi, A. Overexpression of Glucose-6-Phosphate Isomerase in Synechocystis sp. PCC 6803 with Disrupted Glycogen Synthesis Pathway Improves Exopolysaccharides Synthesis. Algal Res. 2021, 57, 102357. [Google Scholar] [CrossRef]
  50. Werner, A.; Broeckling, C.D.; Prasad, A.; Peebles, C.A.M. A Comprehensive Time-course Metabolite Profiling of the Model Cyanobacterium Synechocystis sp. PCC 6803 under Diurnal Light: Dark Cycles. Plant J. 2019, 99, 379–388. [Google Scholar] [CrossRef]
  51. Sicora, C.I.; Chiș, I.; Chiș, C.; Sicora, O. Regulation of PSII Function in Cyanothece sp. ATCC 51142 during a Light–Dark Cycle. Photosynth. Res. 2019, 139, 461–473. [Google Scholar] [CrossRef]
  52. Maity, S.; Tiwari, R.; Mallick, N. Application of Empirical Modelling to Predict the Growth of a Marine Cyanobacterium Leptolyngbya Valderiana BDU 41001 for Production of Bioethanol and C-Phycocyanin under Semi-Outdoor Cultivation. J. Clean. Prod. 2024, 473, 143507. [Google Scholar] [CrossRef]
  53. Contreras-Ropero, J.E.; Lidueñez-Ballesteros, V.S.; Rodríguez-Bohórquez, A.D.; García-Martínez, J.B.; Urbina-Suarez, N.A.; López-Barrera, G.L.; Barajas-Solano, A.F.; Bryan, S.J.; Zuorro, A. The Effect of LEDs on Biomass and Phycobiliproteins Production in Thermotolerant Oscillatoria sp. Appl. Sci. 2022, 12, 11664. [Google Scholar] [CrossRef]
  54. Prasetija, N.; Schneider, S.; Xie, T.; Cao, J. Droplet-Based Microfluidic Photobioreactor as a Growth Optimization Tool for Cyanobacteria and Microalgae. Environments 2024, 11, 255. [Google Scholar] [CrossRef]
  55. Andersen, R.; Berges, J.; Harrison, P.; Watanabe, M. Recipes for Freshwater and Seawater Media. In Algal Culture Techniques; Academic Press: London, UK, 2005. [Google Scholar]
  56. Moheimani, N.R.; Borowitzka, M.A.; Isdepsky, A.; Sing, S.F. Standard Methods for Measuring Growth of Algae and Their Composition BT—Algae for Biofuels and Energy; Borowitzka, M.A., Moheimani, N.R., Eds.; Springer: Dordrecht, The Netherlands, 2013; pp. 265–284. ISBN 978-94-007-5479-9. [Google Scholar]
  57. Gang, S.; Sharma, S.; Saraf, M.; Buck, M.; Schumacher, J. Analysis of Indole-3-Acetic Acid (IAA) Production in Klebsiella by LC-MS/MS and the Salkowski Method. Bio Protoc. 2019, 9, e3230. [Google Scholar] [CrossRef]
  58. Slocombe, S.P.; Ross, M.; Thomas, N.; McNeill, S.; Stanley, M.S. A Rapid and General Method for Measurement of Protein in Micro-Algal Biomass. Bioresour. Technol. 2013, 129, 51–57. [Google Scholar] [CrossRef] [PubMed]
  59. Mishra, S.K.; Suh, W.I.; Farooq, W.; Moon, M.; Shrivastav, A.; Park, M.S.; Yang, J.W. Rapid Quantification of Microalgal Lipids in Aqueous Medium by a Simple Colorimetric Method. Bioresour. Technol. 2014, 155, 330–333. [Google Scholar] [CrossRef] [PubMed]
  60. Urbina-Suarez, N.A.; Salcedo-Pabón, C.J.; Contreras-Ropero, J.E.; López-Barrera, G.L.; García-Martínez, J.B.; Barajas-Solano, A.F.; Machuca-Martínez, F. A Phytochemical Approach to the Removal of Contaminants from Industrial Dyeing Wastewater. ChemEngineering 2023, 7, 90. [Google Scholar] [CrossRef]
  61. Tiwari, O.N.; Bhunia, B.; Mondal, A.; Gopikrishna, K.; Indrama, T. System Metabolic Engineering of Exopolysaccharide-Producing Cyanobacteria in Soil Rehabilitation by Inducing the Formation of Biological Soil Crusts: A Review. J. Clean. Prod. 2019, 211, 70–82. [Google Scholar] [CrossRef]
  62. Gongi, W.; Gomez Pinchetti, J.L.; Cordeiro, N.; Ouada, H. Ben Extracellular Polymeric Substances Produced by the Thermophilic Cyanobacterium Gloeocapsa Gelatinosa: Characterization and Assessment of Their Antioxidant and Metal-Chelating Activities. Mar. Drugs 2022, 20, 227. [Google Scholar] [CrossRef]
  63. Sarkar, S.; Cabrera-Barjas, G.; Singh, R.N.; Fabi, J.P.; Breig, S.J.M.; Tapia, J.; Sani, R.K.; Banerjee, A. Unveiling a Novel Exopolysaccharide Produced by Pseudomonas Alcaligenes Med1 Isolated from a Chilean Hot Spring as Biotechnological Additive. Sci. Rep. 2024, 14, 25058. [Google Scholar] [CrossRef]
  64. Batucan, J.; Susana, S.; Ochoa, M.M.; Salvador-Reyes, L. Biological Activity and Chemical Profiling of Terrestrial and Freshwater Cyanobacteria from the Philippines. Philipp. J. Sci. 2021, 150, 1245–1254. [Google Scholar] [CrossRef]
  65. Jung, F.; Braune, S.; Jung, C.H.G.; Krüger-Genge, A.; Waldeck, P.; Petrick, I.; Küpper, J.-H. Lipophilic and Hydrophilic Compounds from Arthrospira platensis and Its Effects on Tissue and Blood Cells—An Overview. Life 2022, 12, 1497. [Google Scholar] [CrossRef]
  66. Han, P.; Sun, Y.; Wu, X.; Yuan, Y.; Dai, Y.; Jia, S. Emulsifying, Flocculating, and Physicochemical Properties of Exopolysaccharide Produced by Cyanobacterium Nostoc Flagelliforme. Appl. Biochem. Biotechnol. 2014, 172, 36–49. [Google Scholar] [CrossRef]
  67. Yoshikawa, S.; Kanesaki, Y.; Uemura, A.; Yamada, K.; Okajima, M.; Kaneko, T.; Ohki, K. Physiological and Genomic Analysis of Newly-Isolated Polysaccharide Synthesizing Cyanobacterium Chroococcus Sp. FPU101 and Chemical Analysis of the Exopolysaccharide. J. Gen. Appl. Microbiol. 2021, 67, 2021.02.002. [Google Scholar] [CrossRef]
  68. Ohki, K.; Le, N.Q.T.; Yoshikawa, S.; Kanesaki, Y.; Okajima, M.; Kaneko, T.; Thi, T.H. Exopolysaccharide Production by a Unicellular Freshwater Cyanobacterium Cyanothece sp. Isolated from a Rice Field in Vietnam. J. Appl. Phycol. 2014, 26, 265–272. [Google Scholar] [CrossRef]
  69. Trabelsi, L.; M’sakni, N.H.; Ben Ouada, H.; Bacha, H.; Roudesli, S. Partial Characterization of Extracellular Polysaccharides Produced by Cyanobacterium Arthrospira platensis. Biotechnol. Bioprocess Eng. 2009, 14, 27–31. [Google Scholar] [CrossRef]
  70. Yustinadiar, N.; Manurung, R.; Suantika, G. Enhanced Biomass Productivity of Microalgae Nannochloropsis Sp. in an Airlift Photobioreactor Using Low-Frequency Flashing Light with Blue LED. Bioresour. Bioprocess. 2020, 7, 43. [Google Scholar] [CrossRef]
  71. Vásquez-Villalobos, V.; Vergaray, D.; Méndez, J.; Barrios, I.; Baquedano, R.; Caldas, C.; Cruz, J.; Gamboa, J.; Rivera, I. Effect of the Light Emitting Diodes Intensity and Photoperiod in the Optimization of the Spirulina (Arthrospira) Biomass Production. Sci. Agropecu. 2017, 8, 43–55. [Google Scholar] [CrossRef]
  72. Mahesh, R.; Naira, V.R.; Maiti, S.K. Concomitant Production of Fatty Acid Methyl Ester (Biodiesel) and Exopolysaccharides Using Efficient Harvesting Technology in Flat Panel Photobioreactor with Special Sparging System via Scenedesmus Abundans. Bioresour. Technol. 2019, 278, 231–241. [Google Scholar] [CrossRef]
  73. Medina-Cabrera, E.V.; Rühmann, B.; Schmid, J.; Sieber, V. Characterization and Comparison of Porphyridium sordidum and Porphyridium Purpureum Concerning Growth Characteristics and Polysaccharide Production. Algal Res. 2020, 49, 101931. [Google Scholar] [CrossRef]
  74. Liu, S.; Daigger, G.T.; Kang, J.; Zhang, G. Effects of Light Intensity and Photoperiod on Pigments Production and Corresponding Key Gene Expression of Rhodopseudomonas palustris in a Photobioreactor System. Bioresour. Technol. 2019, 294, 122172. [Google Scholar] [CrossRef]
  75. Han, P.; Shen, S.; Guo, R.; Zhao, D.; Lin, Y.-H.; Jia, S.; Yan, R.; Wu, Y. ROS Is a Factor Regulating the Increased Polysaccharide Production by Light Quality in the Edible Cyanobacterium Nostoc flagelliforme. J. Agric. Food Chem. 2019, 67, 2235–2244. [Google Scholar] [CrossRef] [PubMed]
  76. Ashok, A.K.; Ravi, V.; Saravanan, R. Influence of Cyanobacterial Auxin on Sprouting of Taro (Colocasia Esculenta Var. Antiquorum) and Corm Yield. Indian. J. Agric. Sci. 2017, 87, 1437–1444. [Google Scholar] [CrossRef]
  77. Al-Katib, M.A.; Al-Shaheree, Y.J.; Al-Niemi, A.N. Estimation of Indole Acetic Acid in Some Local Algae and Study the Optimal Conditions for Its Production of Cyanobacteria Gloeocapsa Sp. PCC7428. Tikrit J. Pure Sci. 2023, 22, 63–77. [Google Scholar] [CrossRef]
  78. Govarthanan, M.; Kamala-Kannan, S.; Selvankumar, T.; Mythili, R.; Srinivasan, P.; Kim, H. Effect of Blue Light on Growth and Exopolysaccharides Production in Phototrophic Rhodobacter sp. BT18 Isolated from Brackish Water. Int. J. Biol. Macromol. 2019, 131, 74–80. [Google Scholar] [CrossRef] [PubMed]
  79. Baylous, H.R.; Gladfelter, M.F.; Gardner, M.I.; Foley, M.; Wilson, A.E.; Steffen, M.M. Indole-3-Acetic Acid Promotes Growth in Bloom-Forming Microcystis via an Antioxidant Response. Harmful Algae 2024, 133, 102575. [Google Scholar] [CrossRef]
  80. Duong, T.T.; Nguyen, T.T.L.; Van Dinh, T.H.; Hoang, T.Q.; Vu, T.N.; Doan, T.O.; Dang, T.M.A.; Le, T.P.Q.; Tran, D.T.; Le, V.N.; et al. Auxin Production of the Filamentous Cyanobacterial Planktothricoides Strain Isolated from a Polluted River in Vietnam. Chemosphere 2021, 284, 131242. [Google Scholar] [CrossRef]
  81. Bispo, R.L.B.; Ceccato-Antonini, S.R.; Takita, M.A.; Rosa-Magri, M.M. Exogenous Indole-3-Acetic Acid Production and Phosphate Solubilization by Chlorella Vulgaris Beijerinck in Heterotrophic Conditions. Fermentation 2023, 9, 116. [Google Scholar] [CrossRef]
  82. Lin, H.; Li, Y.; Hill, R.T. Microalgal and Bacterial Auxin Biosynthesis: Implications for Algal Biotechnology. Curr. Opin. Biotechnol. 2022, 73, 300–307. [Google Scholar] [CrossRef]
  83. Zhang, K.; Wen, Y.; Tang, J.; Zhang, Y.; Peng, X.; Ji, Y.; Sun, J.; Liu, X. The Regulation of Photosynthesis and Growth of Rapeseed Seedling by the Interaction of Red and Yellow Lights with Blue Light. Environ. Exp. Bot. 2024, 225, 105869. [Google Scholar] [CrossRef]
  84. Zournas, A.; Mani, K.; Dismukes, G.C. Cyclic Electron Flow around Photosystem II in Silico: How It Works and Functions in Vivo. Photosynth. Res. 2023, 156, 129–145. [Google Scholar] [CrossRef]
  85. Chen, S.; Dalla Villa, V.; Kohlen, W.; Kusuma, P.; Offringa, R.; Marcelis, L.F.M.; Heuvelink, E. High Ratio of Blue:Red Light Reduces Fruit Set in Sweet Pepper, Which Is Associated with Low Starch Content and Hormonal Changes. Environ. Exp. Bot. 2024, 225, 105850. [Google Scholar] [CrossRef]
  86. Pech, R.; Volná, A.; Špunda, V.; Nezval, J. Blue Light as an Important Factor Increasing Plant Tolerance to Acute Photooxidative Stress. Environ. Exp. Bot. 2024, 226, 105923. [Google Scholar] [CrossRef]
  87. Zhao, J.; Yang, G.; Jiang, L.; Zhang, S.; Miao, L.; Xu, P.; Chen, H.; Chen, L.; Mao, Z.; Guo, T.; et al. Phytochromes A and B Mediate Light Stabilization of BIN2 to Regulate Brassinosteroid Signaling and Photomorphogenesis in Arabidopsis. Front. Plant Sci. 2022, 13, 865019. [Google Scholar] [CrossRef]
  88. Fukazawa, M.; Miyake, K.; Hoshino, H.; Fushimi, K.; Narikawa, R. Phycocyanobilin Binding and Specific Amino Acid Residues Near the Chromophore Contribute to Orange Light Perception by the Dualchrome Phytochrome Region. Plant Cell Physiol. 2025, 66, 193–203. [Google Scholar] [CrossRef]
  89. Velmurugan, R.; Kanwal, S.; Incharoensakdi, A. Non-Ionic Surfactant Integrated Extraction of Exopolysaccharides from Engineered Synechocystis sp. PCC 6803 under Fed-Batch Mode Facilitates the Sugar-Rich Syrup Production for Ethanol Fermentation. Algal Res. 2022, 66, 102772. [Google Scholar] [CrossRef]
  90. Zhang, Y.; Hu, X.; Wu, S.; Zhang, T.; Yang, G.; Li, Z.; Wang, L.; Chen, W. Function Analysis of RNase III in Response to Oxidative Stress in Synechocystis sp. PCC 6803. Microbiol. Res. 2025, 292, 128045. [Google Scholar] [CrossRef]
  91. Gao, X.; Zheng, T.; Yuan, X.; Dong, Y.; Liu, C. Biocidal H2O2 Treatment Emphasizes the Crucial Role of Cyanobacterial Extracellular Polysaccharides against External Strong Oxidative Stress. Environ. Sci. Pollut. Res. 2023, 30, 60654–60662. [Google Scholar] [CrossRef] [PubMed]
  92. Chandra, N.; Mallick, N. Co-production of Bioethanol and Commercially Important Exopolysaccharides from the Marine Cyanobacterium Synechococcus elongatus BDU 10144 in a Novel Low-cost Seawater-fertilizer-based Medium. Int. J. Energy Res. 2022, 46, 13487–13510. [Google Scholar] [CrossRef]
  93. Uhliariková, I.; Matulová, M.; Košťálová, Z.; Lukavský, J.; Capek, P. Lactylated Acidic Exopolysaccharide Produced by the Cyanobacterium Nostoc Cf. Linckia. Carbohydr. Polym. 2022, 276, 118801. [Google Scholar] [CrossRef] [PubMed]
  94. Wenz, J.; Davis, J.G.; Storteboom, H. Influence of Light on Endogenous Phytohormone Concentrations of a Nitrogen-Fixing Anabaena sp. Cyanobacterium Culture in Open Raceways for Use as Fertilizer for Horticultural Crops. J. Appl. Phycol. 2019, 31, 3371–3384. [Google Scholar] [CrossRef]
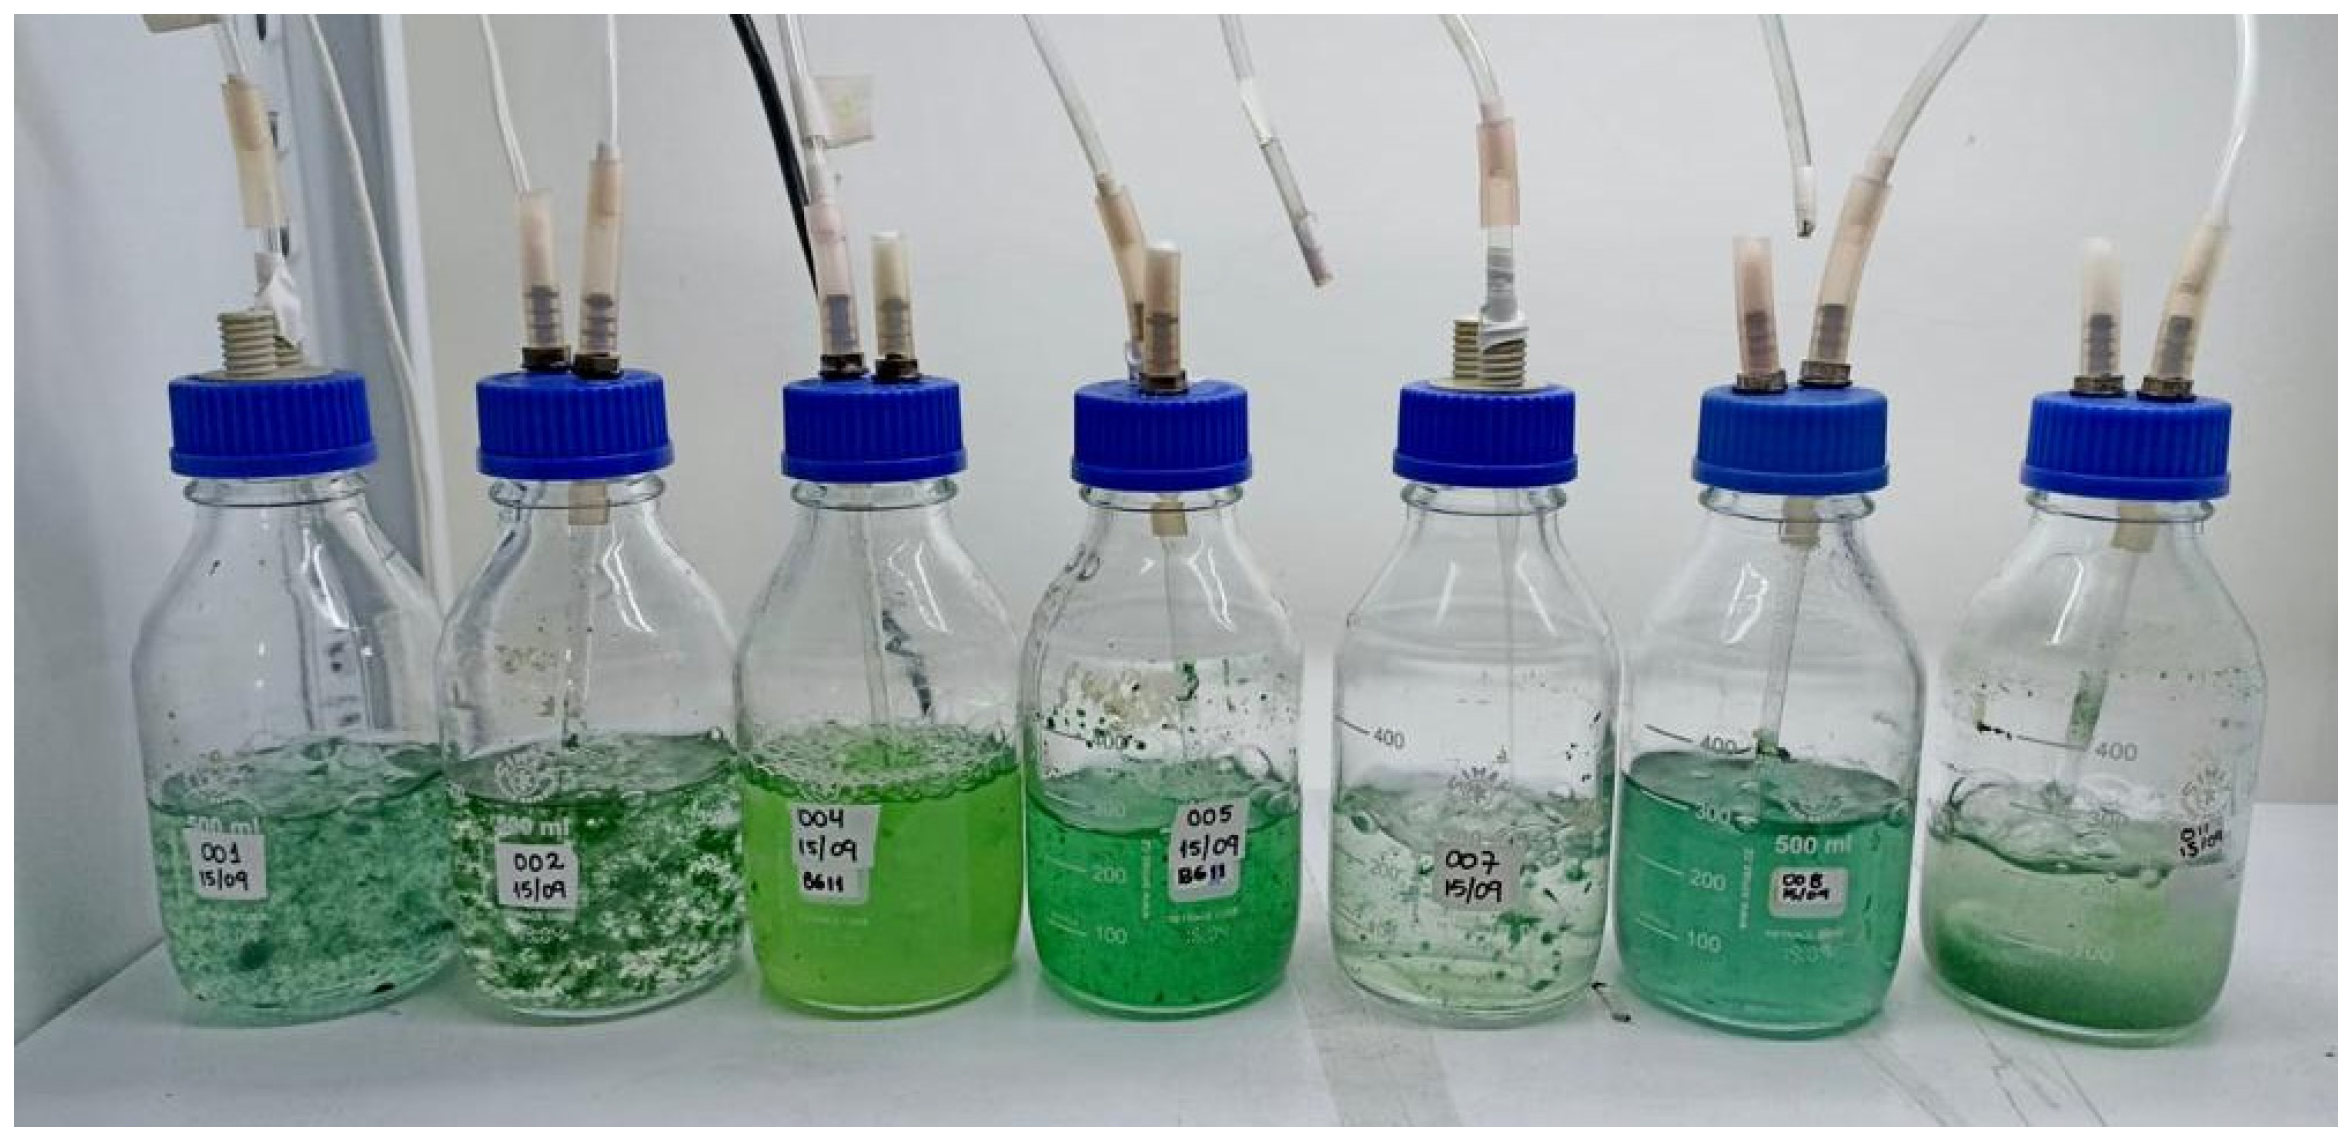
Figure 1. Production of thermotolerant strains under laboratory conditions.
Sci 07 00108 g001
Figure 2. Exopolysaccharide concentration (a) and Indole-Acetic Acid concentration (b) for all thermotolerant strains. Barras = media ± SD; different letters = significant difference (one-way ANOVA + Dunnett, p < 0.05).
Sci 07 00108 g002aSci 07 00108 g002b
Figure 3. Effect of LED spectrum on Exopolysaccharide production (a) and Indole-Acetic Acid production (b) by Hapalosiphon sp. UFPS_002. Barras = media ± SD; equal letters = no significant difference (ANOVA + Dunnett, p < 0.05).
Sci 07 00108 g003aSci 07 00108 g003b
Figure 4. Quadratic CCD response surfaces for Exopolysaccharide (EPS) (a) and Indole-3-acetic acid (IAA) (b) as a function of photoperiod (A) and light intensity (B). R2 > 0.98. Red dots represent experiments.
Sci 07 00108 g004
Figure 5. Optimized cultivation of Hapalosiphon sp. UFPS_002. (a,c) Cultures under B:R 1:5 and cool-white LEDs. (b,d) Expected vs. observed Exopolysaccharide (EPS) and Indole-3-acetic acid (IAA) titres (unpaired t-test; ns = not significant). (e) EPS monosaccharide profile. (f) EPS macromolecular composition.
Sci 07 00108 g005aSci 07 00108 g005b
Table 1. Central composite design examining the effect of photoperiod and irradiance on EPS and IAA synthesis.
Factor 1Factor 2
StdBlockRunA: Light CycleB: Light Intensity
hourµmol m−2 s−1
3Block 116120
521480
4322120
242240
751480
661480
17640
11Block 2814136.57
1391480
14101480
10111423.43
91225.3180
12131480
8142.6980
Table 2. ANOVA summary for the response-surface model of EPS and IAA synthesis under varying photoperiods and irradiances.
MetaboliteSourceSum of SquaresDfMean SquareF-Valuep-Value
EPS (mg/mL)Block263.531263.53
Model90,909.97518,181.99136.79<0.0001 *
A-Light cycle1136.1611136.168.550.0222 *
B-Light Intensity7898.4417898.4459.420.0001 *
AB6172.5416172.5446.440.0002 *
A245,142.74145,142.74339.64<0.0001 *
B236,343.68136,343.68273.44<0.0001 *
Residual930.417132.92
Lack of Fit446.623148.871.230.4080 **
Pure Error483.794120.95
Cor Total92,103.9113
R20.9899 Std. Dev.11.53
Adjusted R20.9826 Mean193.18
Predicted R20.9382 C.V.%5.97
Adeq Precision25.4076
IAA (µg/mL)Block6.9016.90
Model2229.755445.95381.56<0.0001 *
A-Light cycle1.1711.170.99860.3509 **
B-Light Intensity15.49115.4913.250.0083 *
AB52.56152.5644.970.0003 *
A21215.8511215.851040.29<0.0001 *
B21110.6811110.68950.31<0.0001 *
Residual8.1871.17
Lack of Fit4.6131.541.720.3004 **
Pure Error3.5740.8933
Cor Total2244.8313
R20.9963 Std. Dev.1.08
Adjusted R20.9937 Mean20.13
Predicted R20.9838 C.V.%5.37
Adeq Precision38.8906
* significant, ** not significant.
Table 3. Conditions for maximizing EPS and IAA’s production.
Coded NameResponseLight Cycle
(h)
Light Intensity
(μmol m−2 s−1)
Light TypeValue
Z1EPS (mg/mL)14.585Blue/Red 1_5281.4 mg/L
Z2IAA (µg/mL)Cool white34.4 µg/mL
Table 4. A comparison of EPS and IAA production across different light Intensities and strains.
ObjectiveStrainLED SpectrumIntensityPhotoperiodMetaboliteReference
μmol m−2 s−1h
EPS (mg/mL)Synechococcus elongatus BDU 10144White light5012280[92]
Synechocystis sp. LEGE 07367Natural Light70300
Nostoc cf. linckiaWhite light60145400[93]
Synechocystis sp. PCC 6803White Light7524251[49]
P. purpureumBlue Lightn/a1230[43]
Orange: Red Light90
White Light140
P. sordidumBlue Light10
Orange: Red Light120
White Light100
Hapalosiphon sp. UFPS_002Blue/Red 1_5 LED8514.5281.4This work
IAA (µg/mL)Anabaena sp.Natural Lightn/a12:120.189[94]
Synechococcus elongatus UTEX2973Blue LED1202445[54]
Nostoc sp.White light50–100 12:128.66[76]
Planktothricoides raciborskiiFluorescent Lightn/a12:123,04[78]
Planktothricoides raciborskiiNatural Light 24120
Hapalosiphon sp. UFPS_002Cool white LED8514.534.4This work
Disclaimer/Publisher’s Note: The statements, opinions and data contained in all publications are solely those of the individual author(s) and contributor(s) and not of MDPI and/or the editor(s). MDPI and/or the editor(s) disclaim responsibility for any injury to people or property resulting from any ideas, methods, instructions or products referred to in the content.