Abstract
Cell culture models are of central importance for the investigation of cellular metabolism, proliferation and stress responses. In this study, the effects of different concentrations of glucose (1 g/L vs. 4.5 g/L) and fetal bovine serum (FBS; 5%, 10%, 15%) on viability, mitochondrial function and autophagy are investigated in four human cell lines: MRC-5, HeLa, Caco-2 and SW-620. Cells were cultured in defined media for 72 h, and viability was assessed by LDH release, mitochondrial membrane potential using Rhodamine 123, ATP content by luminescence and autophagy activity by dual fluorescence staining. The results showed that HeLa and SW-620 cancer cells exhibited increased proliferation and mitochondrial activity under high glucose conditions, while low glucose media resulted in decreased ATP content and increased membrane permeability in HeLa cells. MRC-5 fibroblasts and Caco-2 cells showed greater resilience to nutrient stress, with minimal changes in LDH release and consistent proliferation. Autophagy was activated under all conditions, with a significant increase only in selected cell-medium combinations. These results highlight the importance of medium composition in influencing cellular bioenergetics and stress responses, which has implications for cancer research, metabolic disease modelling and the development of serum-free culture systems for regenerative medicine.
1. Introduction
Cell culture is one of the fundamental methods in modern biomedical and pharmaceutical research. It is defined as the process of growing and maintaining living cells outside the body under strictly controlled laboratory conditions. This technique enables the study of cell functions, drug reactions, molecular disease mechanisms and numerous biological processes without having to work directly on living organisms [1]. A key role in any cell culture system is played by the cell culture medium, the composition of which must provide all the necessary nutrients, growth factors and optimal physico-chemical conditions for maintaining cellular homeostasis. The medium usually contains essential salts, amino acids, vitamins, glucose as the primary energy source, a buffer to stabilize the pH value and osmotically active components that regulate the osmotic pressure [2,3].
Among the most important media supplements, fetal bovine serum (FBS) stands out, which is rich in hormones, proteins, enzymes and growth factors that promote cell proliferation, differentiation and survival [4,5,6]. However, the concentrations of FBS and glucose in the medium have a strong influence on the physiological state of cells and the activation of various cellular processes, including autophagy, apoptosis and metabolic reactions. Glucose plays a key role in metabolism, with a concentration of 1 g/L (≈5.5 mM) being considered physiological (normoglycemia), while 4.5 g/L (≈25 mM) is used to simulate hyperglycemic conditions, e.g., in in vitro diabetes modelling [7]. High glucose concentrations are associated with increased production of reactive oxygen species (ROS), mitochondrial fragmentation through DRP1-dependent activation, a decrease in mitochondrial membrane potential and the activation of apoptotic signaling pathways [8,9]. The inhibition of PINK1/Parkin-mediated mitophagy and disruption of the NAD+/SIRT1 axis have also been described, for example, in mesenchymal stromal cells, providing further evidence of the deleterious effects of metabolic excess [10,11].
AMPK and mTORC1 signaling pathways are the main regulators of the cells’ energy status [12]. Under conditions of energy stress, AMPK becomes active and phosphorylates ULK1 at Ser555 (Ser556 in humans), a modification that suppresses autophagy flux and promotes cell survival by conserving ATP [12,13,14]. Conversely, at high glucose and FBS concentrations, mTORC1 is activated, which inhibits autophagy by phosphorylating ULK1 at Ser757, promotes cell growth and proliferation, but can lead to an accumulation of damaged organelles and metabolic disorders [15,16,17]. These changes are particularly important in oncology, as tumor cells often use glycolysis as their primary energy metabolism pathway (Warburg effect) and hyperglycemia can mask the true cytotoxicity of drugs targeting mitochondrial function [18]. In the field of metabolic disease research, models using pancreatic β-cells or retinal cells under hyperglycemic conditions provide information on the mechanisms of the development of diabetic retinopathy and neuropathy [19,20,21,22]. In regenerative medicine, well-defined, serum-free protocols are increasingly being used to reduce biological variability and the risk of pathogen transmission, particularly in cell-based therapies and the production of cultured meat [23].
In addition to the already mentioned metabolic and signaling changes, nutritional stress can also lead to a loss of cell membrane integrity, resulting in the release of lactate dehydrogenase (LDH), an intracellular enzyme that is used in cell cultures as a quantitative marker of cell damage or cell death [24,25,26]. Its presence in the medium reflects a disruption of cellular stability and is often used to assess the toxicity of substances, the efficacy of therapeutics and the general state of the cell population [24,25,26]. On the other hand, an increased FBS content generally promotes proliferation and increases cell survival, which in turn shows how important it is to adjust the composition of the medium to the specific research objectives [27,28,29].
The aim of this study is to investigate the effects of different concentrations of glucose (1 g/L and 4.5 g/L) and fetal bovine serum (5%, 10% and 15%) in cell culture medium on viability and mitochondrial membrane potential, focusing on changes in autophagic response and cell proliferation. The results obtained will contribute to a better understanding of the effects of nutritional conditions on cell physiology and signaling pathways in vitro and will allow a more accurate interpretation of the experimental results in the context of biomedical, pharmacological and translational research.
2. Materials and Methods
2.1. Cell Growth
The cell lines MRC-5 (CCL-171, human fetal lung fibroblasts), HeLa (CCL-2, human cervical cancer cells), Caco-2 (HTB. 37, human colon adenocarcinoma epithelial cells) and SW-620 (CCL-227, human metastatic colon adenocarcinoma cells) were cultured in Dulbecco’s Modified Eagle Medium (DMEM, Lonza, Basel, Switzerland) supplemented with 10% heat-inactivated fetal bovine serum (FBS, GIBCO Invitrogen, Paisley, UK), 2 mM glutamine, 100 U/mL penicillin and 100 µg/mL streptomycin (GIBCO Invitrogen, Paisley, UK). After reaching confluence, the cells were trypsinized with a 0.25% trypsin-EDTA solution (GIBCO Invitrogen, Paisley, UK). Cell incubation was performed in a CO2 incubator (IGO 150 CELLlife™, JOUAN, Thermo Fisher Scientific, Waltham, MA, USA) at 37 °C, 5% CO2 and high humidity.
2.2. Composition of the Growth Media
All metabolic tests were performed using a range of media with different glucose and serum contents. Dulbecco’s Modified Eagle’s Medium (DMEM) with high or low glucose concentration, supplemented with different amounts of FBS, served as the basic medium. The composition of the media used is shown in Table 1. The medium recommended by ATCC was used as a control (MC) for each cell line.

Table 1.
Composition of the growth media used.
2.3. Test of Cell Permeability
Cell permeability was determined by measuring the amount of lactate dehydrogenase (LDH) released in the cell suspension after cells MRC-5, HeLa, Caco-2 and SW-620 had been cultured for 72 h in the presence of a selected medium. The cells were plated at a concentration of 2 × 10⁴ cells/mL in 96-well microtitre plates. The LDH content in the cell supernatant was analysed using the Cytotoxicity Detection Kit (LDH), version 10 (Roche, Basel, Switzerland), according to the manufacturer’s instructions. Absorbance was measured at 490 nm using a Tecan Spark multimode plate reader (Tecan, Männedorf, Switzerland).
2.4. ATP Determination
To determine the cellular ATP content, the cells were plated on a white flat plate with a transparent bottom (Greiner, Kremsmünster, Austria) at a concentration of 2 × 10⁴ cells/mL. The cells were plated in control medium (MC) and test medium (M2) and were cultured for 72 h. The ATPlite 1 step kit (Revity, Waltham, MA, USA) was used to estimate cellular ATP. The measurement was performed according to the manufacturer’s instructions Tecan Spark multimode plate reader (Tecan, Männedorf, Switzerland).
2.5. Measurement of the Mitochondrial Membrane Potential
Rhodamine 123 dye was used to determine changes in mitochondrial membrane potential. MRC-5, HeLa, Caco-2 and SW-620 cells were plated at a concentration of 2 × 10⁴ cells/mL in white 96-well plates with a clear bottom. After 72 h in selected media, the Rhodamine 123 dye was added to the cells (dye concentration used was 5 µM), after which they were stained in a CO2 incubator for 30 min. After the incubation, the dye was removed and the cells were resuspended in PBS. Fluorescence was measured at an excitation wavelength of 485 nm and an emission wavelength of 535 nm using a Tecan Spark multimode plate reader (Tecan, Männedorf, Switzerland).
2.6. Autophagy Assay
Autophagy was analysed using the Abcam autophagy assay kit according to the manufacturer’s guidelines. In brief, cells were plated at a concentration of 2 × 10⁴ cells/mL in clear-bottom 96-well plates and cultured in selected media for 72 h. Cells were then carefully washed with 1× Assay Buffer and stained with 100 μL/well of Dual stain solution. The samples were incubated at 37 °C for 30 min. Before analysis, the samples were washed twice with the assay buffer. Fluorescence was measured at 480 nm/535 nm (Ex/Em) for the green detection reagent and at 340 nm/480 nm for the nuclear staining using a Tecan Spark multimode plate reader (Tecan, Männedorf, Switzerland). The changes in autophagic vacuole content were calculated as a fold increase between dyes.
2.7. Statistical Analysis
The normality of the distribution of continuous variables was tested using the Shapiro–Wilk test, with all analysed variables showing a normal distribution (p > 0.05). Student’s t-test for independent samples was used for the comparison of two groups, while one-way analysis of variance (ANOVA) was used for the comparison of more than two groups. ANOVA results showed statistically significant differences between groups (p < 0.05), and an additional post-hoc analysis (Bonferroni test) identified pairs of groups with significant differences. All data are presented as means with standard deviations and the corresponding 95% confidence intervals. All p-values were two-sided, and statistical significance was determined at the α = 0.05 level. Data analyses were performed using the XLSTAT software package (version 2025.1.0, Addinsoft, Paris, France).
3. Results
3.1. Cell Growth
HeLa cells exhibited robust proliferation at a high glucose concentration (4.5 g/L), with growth further enhanced by increasing concentrations of fetal bovine serum (FBS). In contrast, at a low glucose concentration (1 g/L), there was a marked reduction in proliferation observed after 96 h. SW-620 cells also showed enhanced growth at higher glucose levels, with proliferation steadily increasing over time. At lower glucose concentrations, growth was sustained but at a slower rate. Notably, FBS concentration had no significant impact on SW-620 cell proliferation. MRC-5 cell growth appeared relatively unaffected by glucose concentration, although a slight inhibition was observed at elevated serum levels. In CaCo-2 cells, neither glucose concentration nor FBS presence significantly influenced proliferation. Based on these findings, a 72-h incubation period was identified as optimal for subsequent experiments (Figure 1).
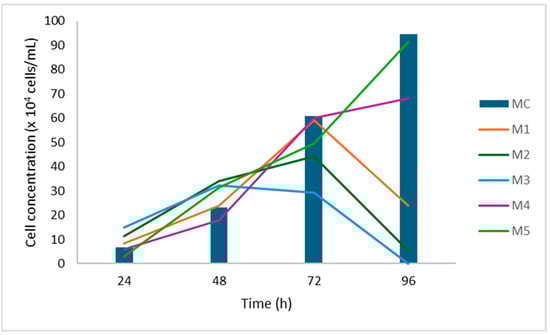
Figure 1.
Cell growth curve for HeLa cells. Cells were grown in different media and counted at equal time intervals.
3.2. LDH
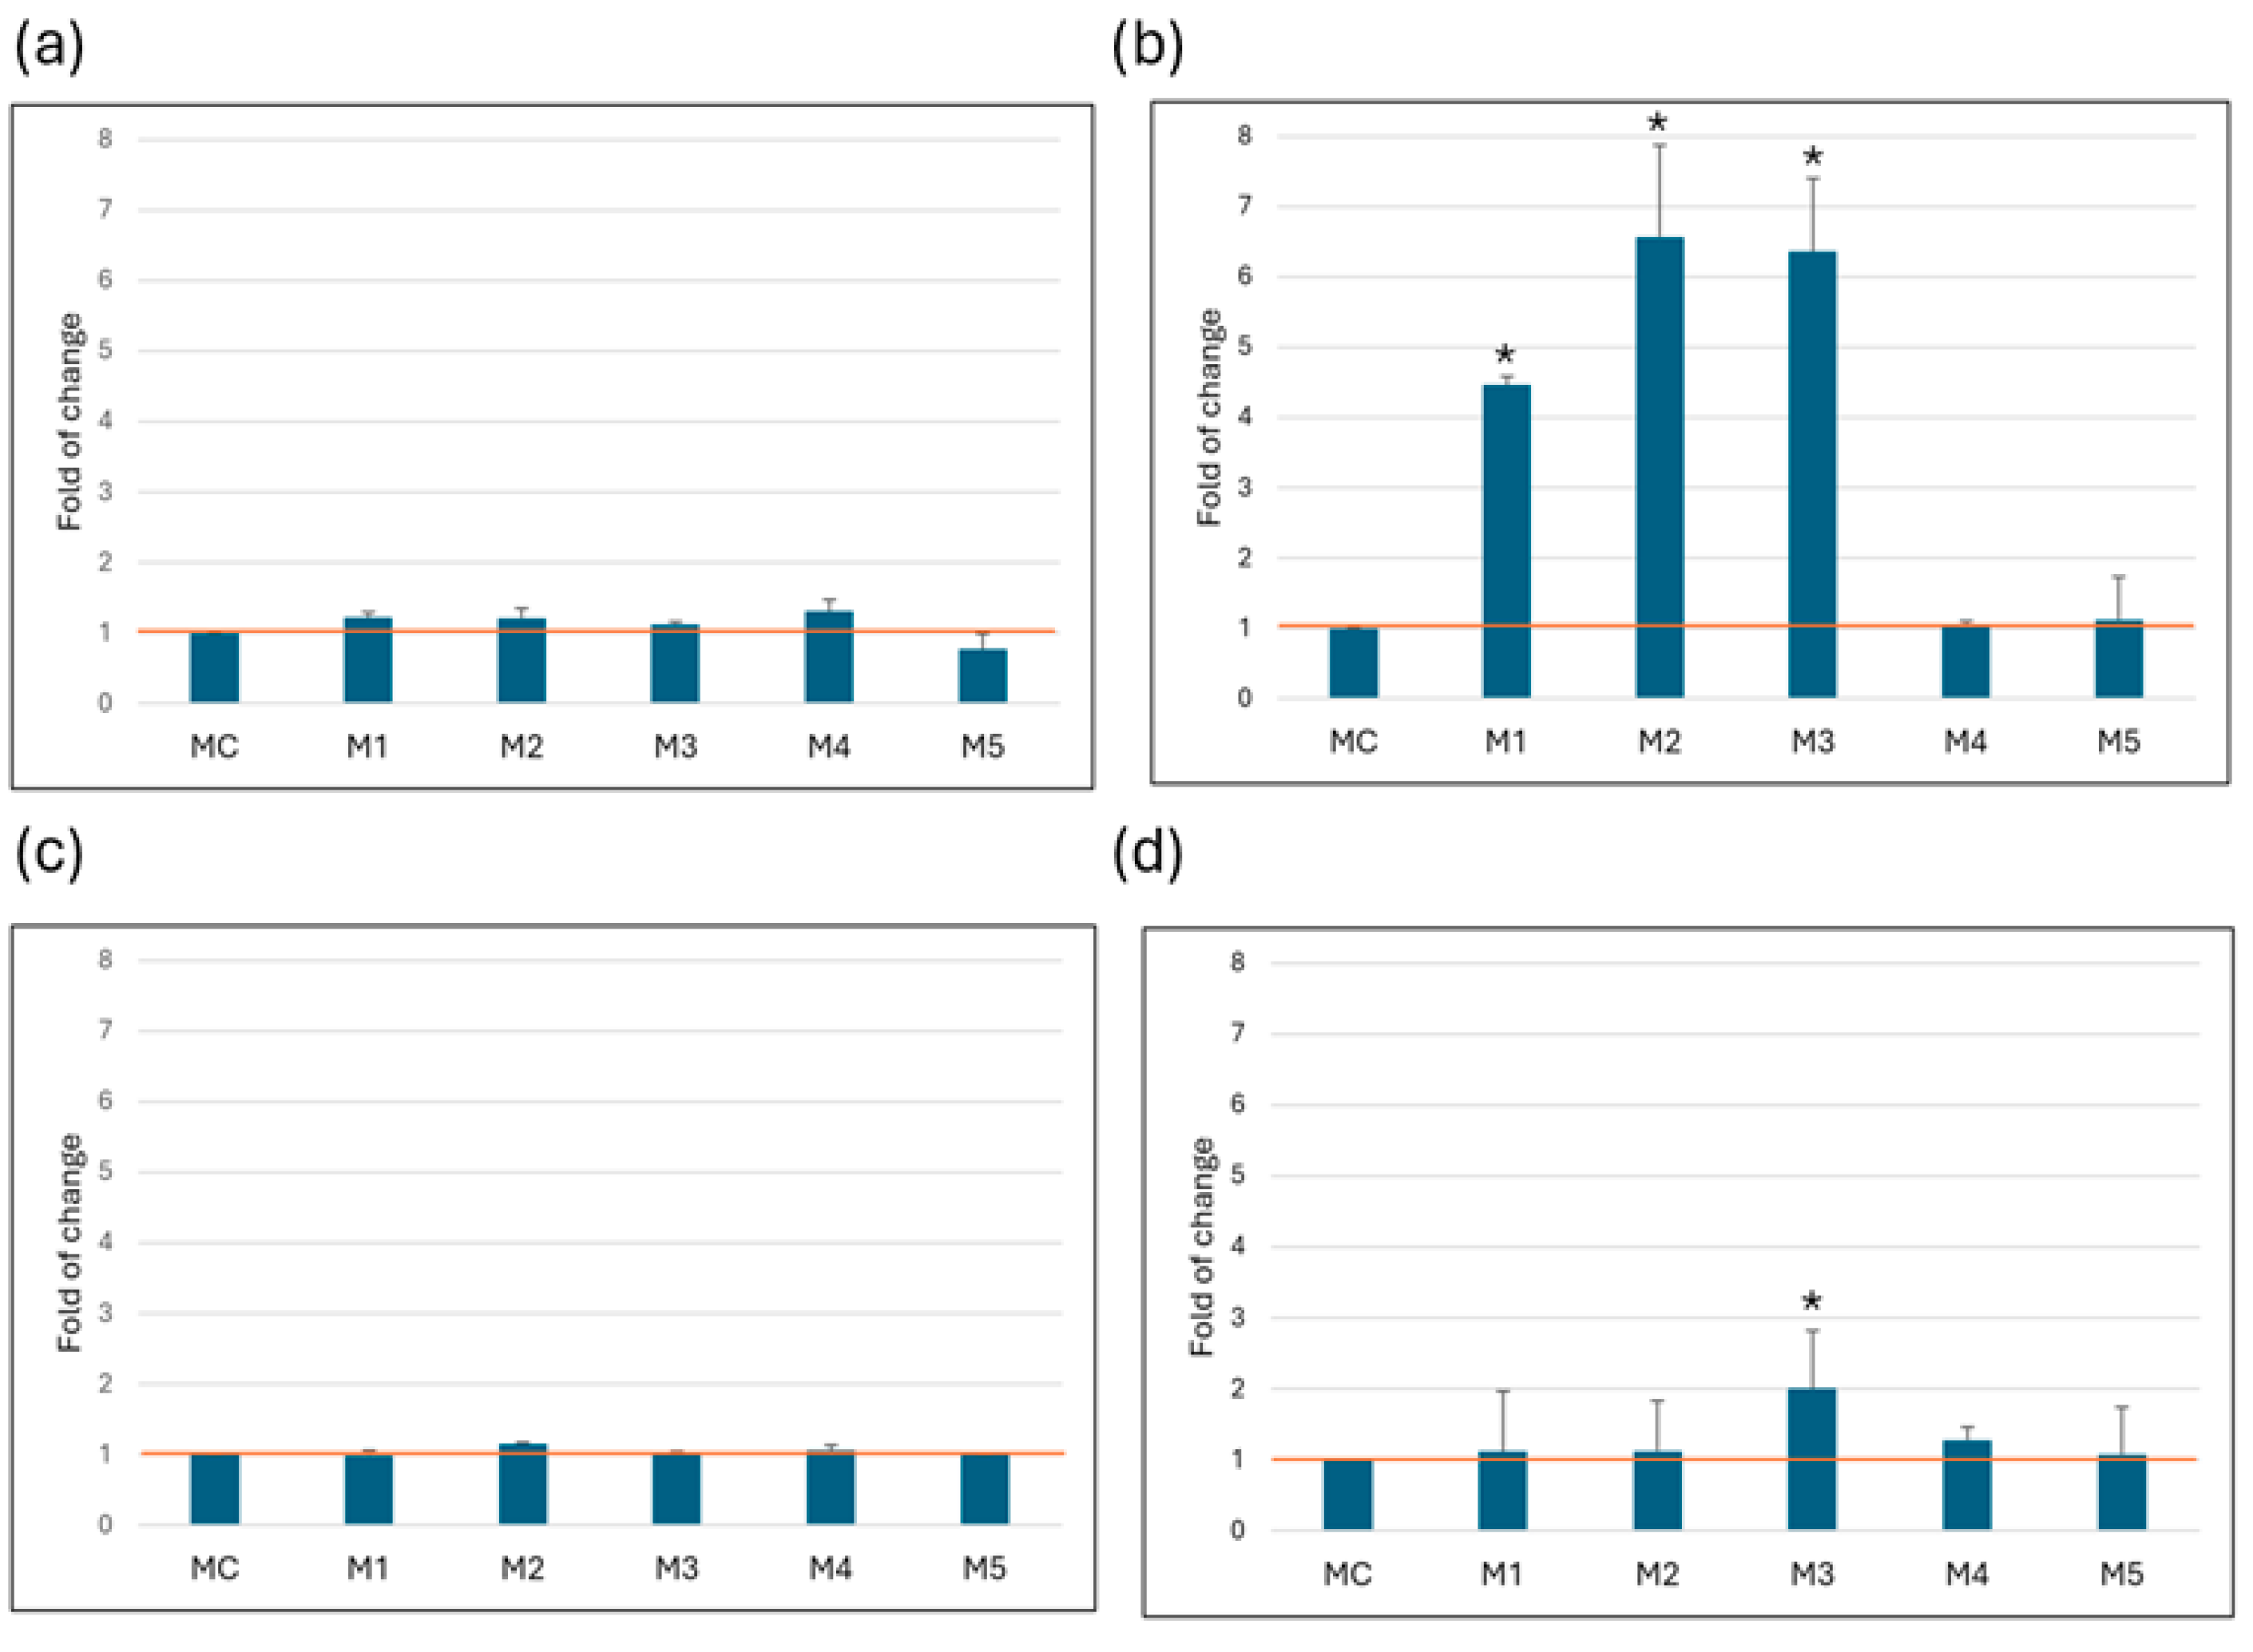
There was a statistically significant increase in LDH concentration in HeLa cells cultured in media containing 1 g/L glucose, with fold changes relative to control medium (MC) of 4.5 ± 0.1 for M1, 6.6 ± 1.3 for M2 and 6.4 ± 1.0 for M3. In the MRC-5 and Caco-2 cell lines, no statistically significant disruption of membrane integrity was observed, as evidenced by the lack of appreciable LDH release into the medium. In the SW6-20 cells, the M3 medium was identified as critical, as it showed a statistically significant increase in LDH release (2.3 ± 0.2) compared to the MC (Figure 2).

Figure 2.
LDH release. Amount of LDH released after 72 h of growth in media. All values (N = 15) are presented as average ( ± SD) and are normalized to the recommended medium (MC). (a) MRC-5, (b) HeLa, (c) Caco-2, (d) SW-620. Statistical analysis was performed using Student’s t-test; (*) indicates a statistically significant difference compared with control (p < 0.05).
3.3. Autophagy
Autophagy is present in all samples after 72 h. There is no significant difference between the media for MRC-5 and HeLa cells. For the Caco-2 and SW6-20 samples, the only medium that differs significantly is the M1 medium, which shows increased autophagy compared to all other media combinations (Table 2).
Table 2.
Changes in autophagic vacuole content (fold increase, all values (N = 27) represent average (±SD)). Bolded values represent a significant difference with recommended medium after statistical analysis using one-way ANOVA with Bonferroni correction (p < 0.05).
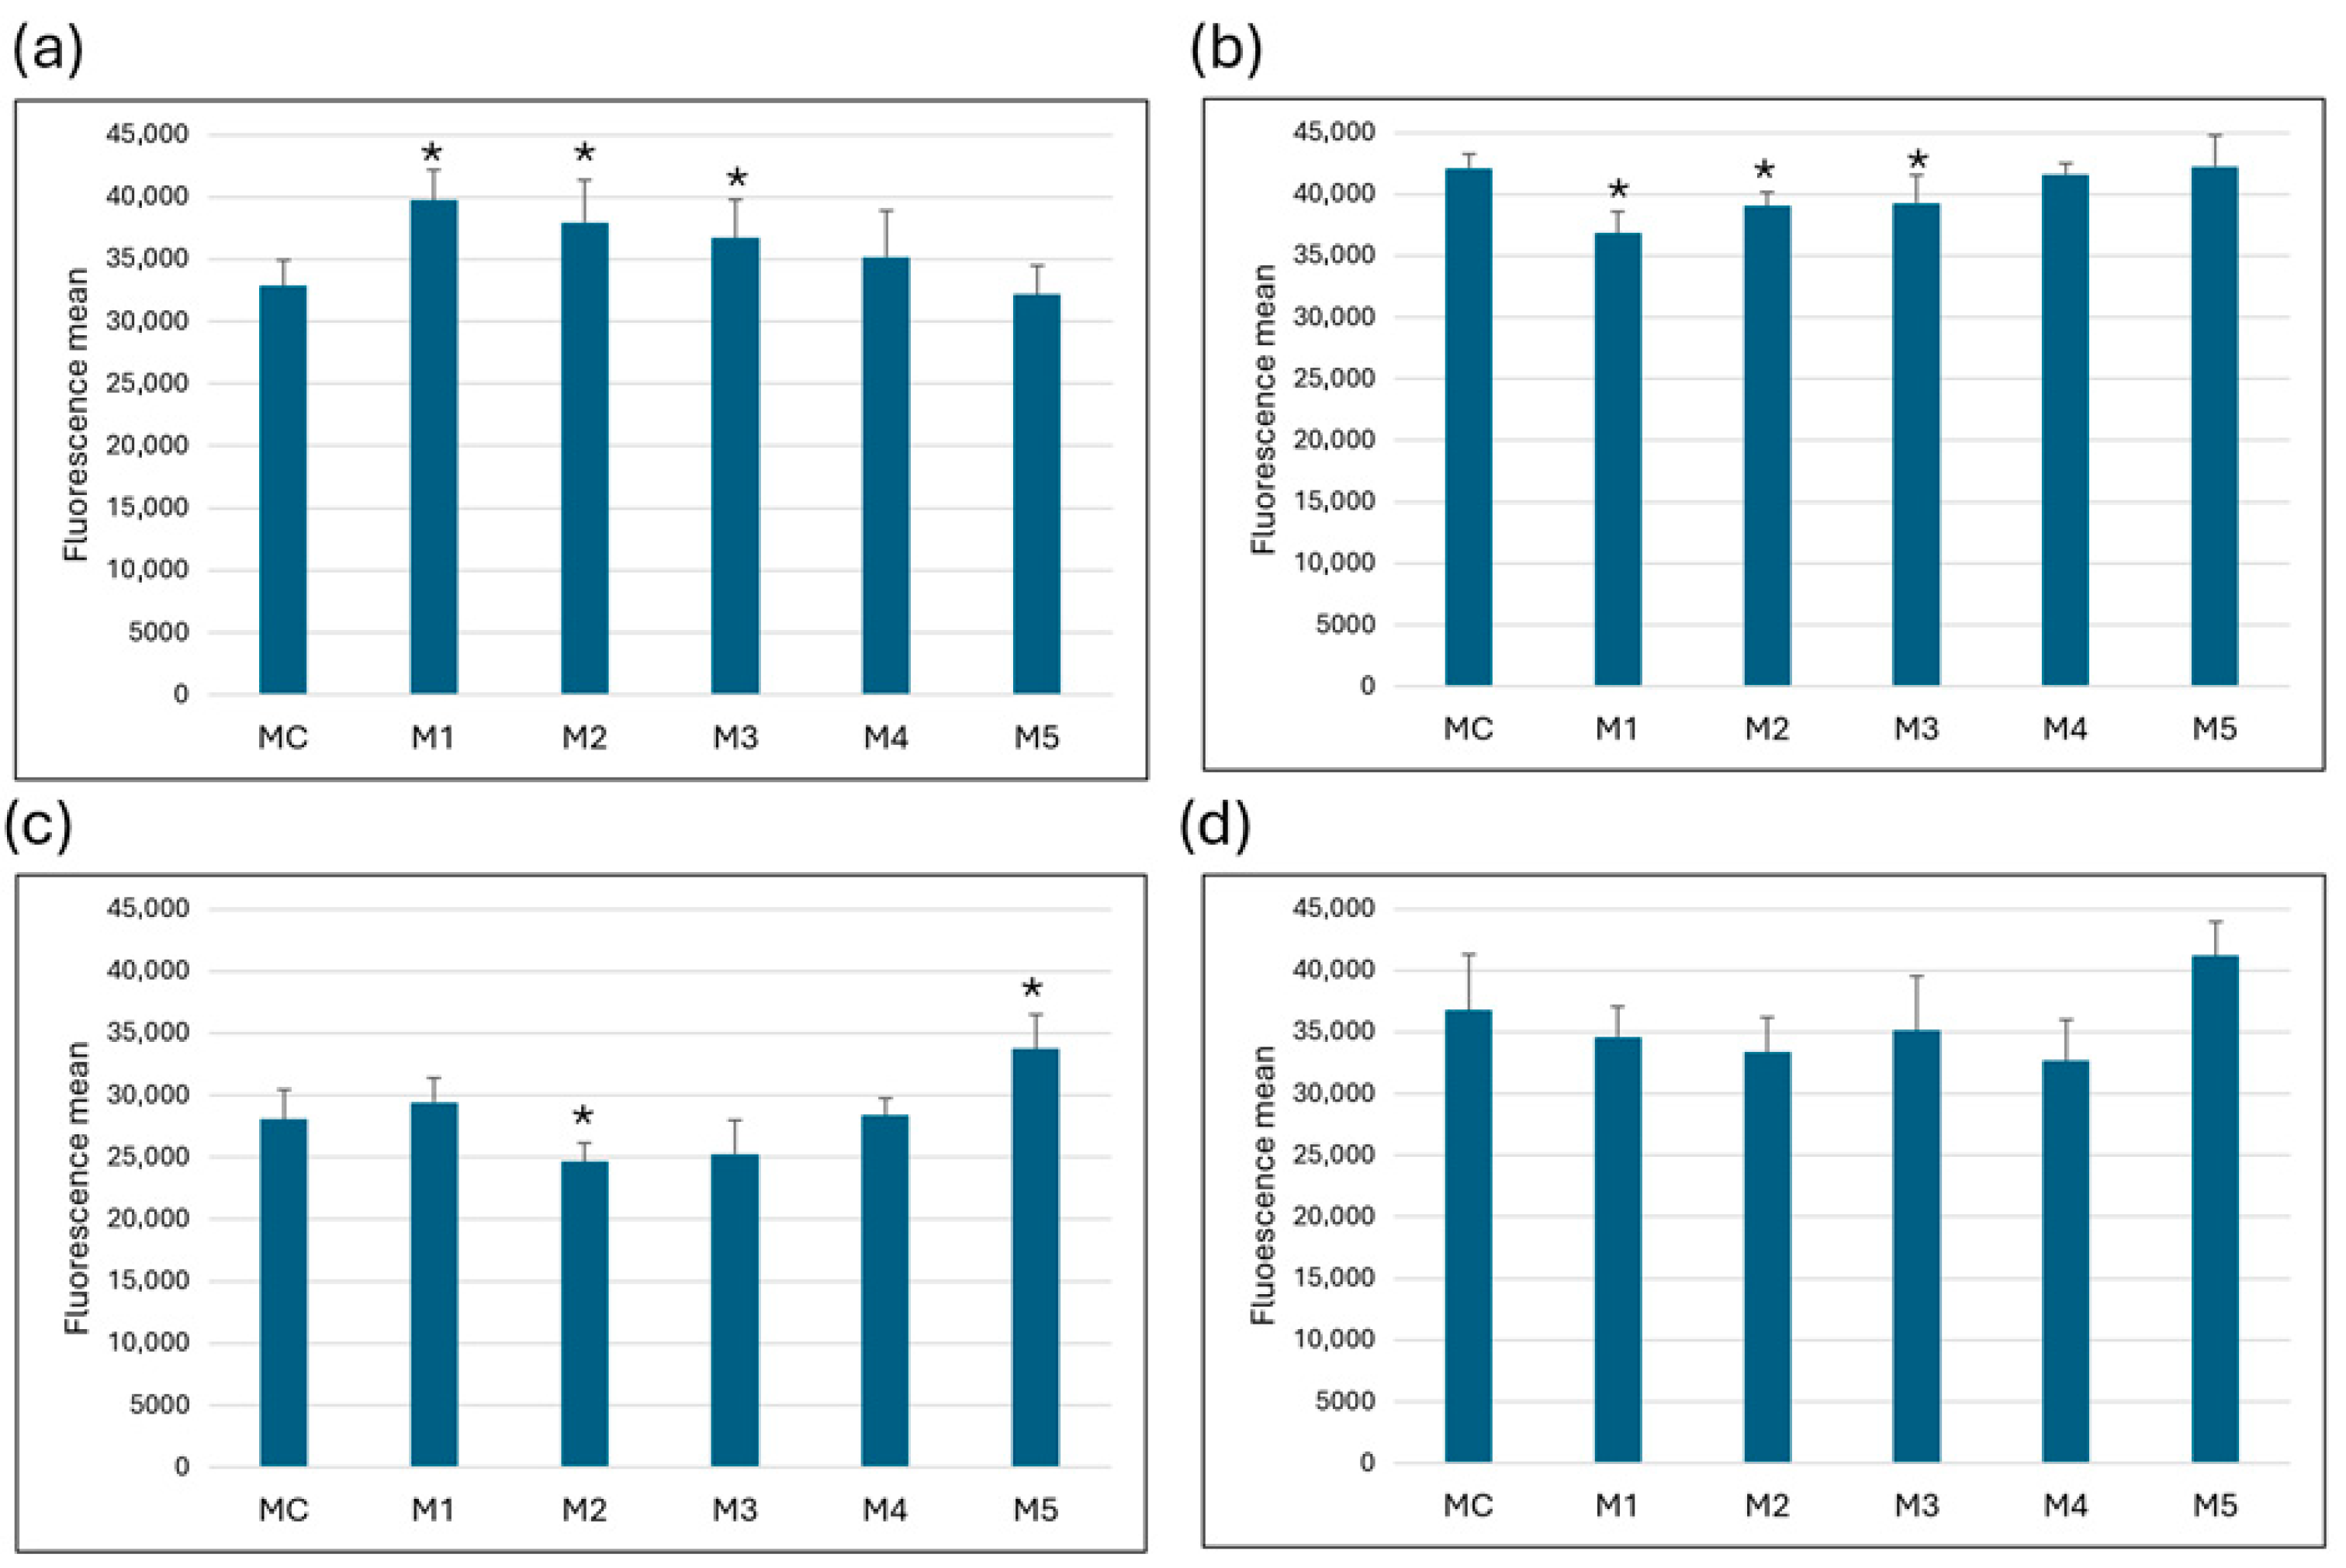
3.4. Mitochondrial Membrane Potential
In MRC-5 cells, a statistically significant increase in fluorescence was measured in cells cultured in media M1, M2 and M3 compared to the control medium (MC), indicating an increase in mitochondrial membrane potential. No significant changes were observed in media M4 and M5. The opposite effect was observed in HeLa cells—media M1, M2 and M3 showed a statistically significant decrease in fluorescence compared to the control, indicating a decrease in mitochondrial membrane potential. Mitochondrial membrane integrity in Caco-2 cells was significantly impaired in medium M2, while medium M5 showed a statistically significant increase in mitochondrial functionality compared to control. In SW6-20 cells, the changes in mitochondrial membrane potential were not statistically significant (Figure 3).
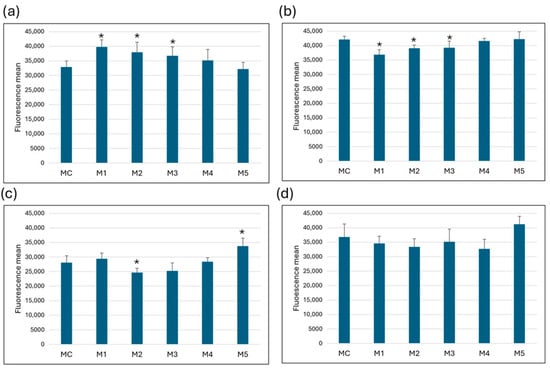
Figure 3.
ΔΨm changes. Change in mitochondrial membrane potential after 72 h of growth per media in (a) MRC-5, (b) HeLa, (c) Caco-2, (d) SW6-20 cells. All values (N = 27) are presented as average (±SD). Statistical analysis was performed using Student’s t-test; (*) indicates a statistically significant difference compared with control (p < 0.05).
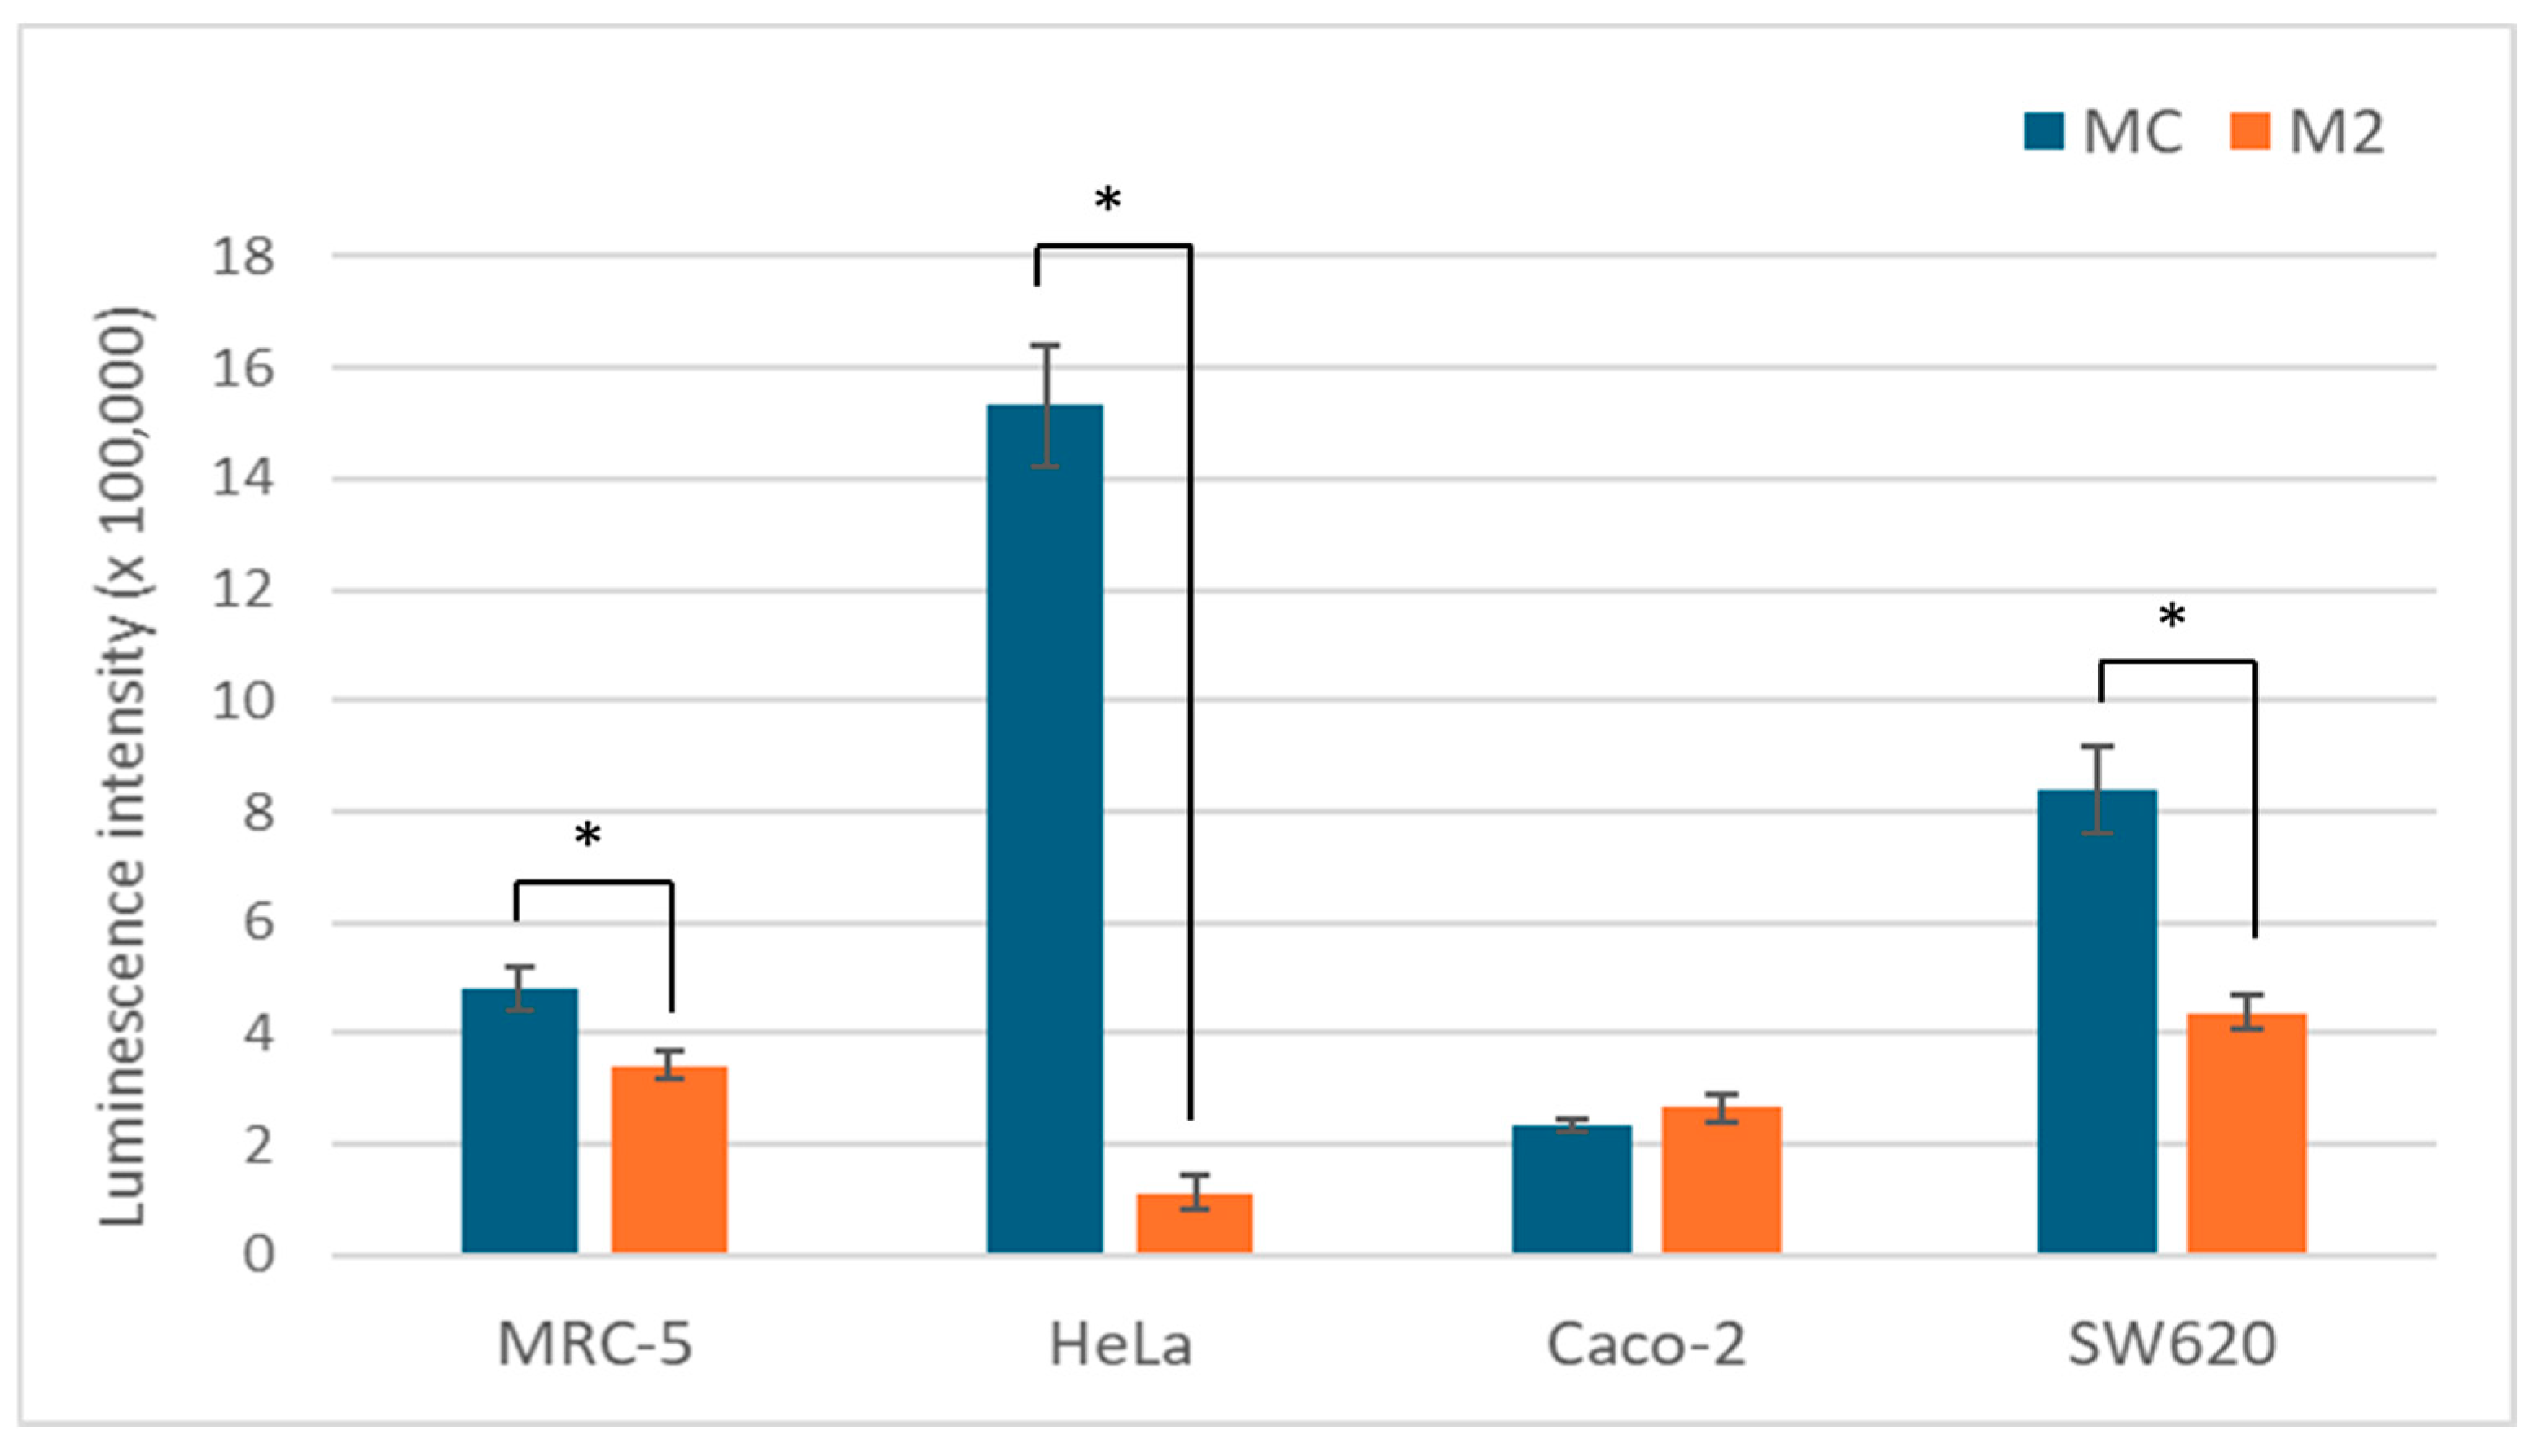
3.5. ATP
ATP is a good measure of the overall metabolic state of the cell and its energy status. Since glucose is the main energy source, we analyzed 2 media with different glucose content. As expected, a low glucose content leads to a significantly lower ATP concentration in the cells of all tested cell lines, with the exception of Caco-2. The change was most pronounced in the HeLa cells with a more than 10-fold reduction (Figure 4).
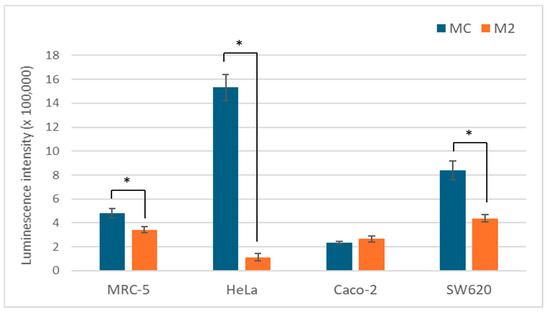
Figure 4.
ATP levels in MCF-5, HeLa, Caco-2, and SW-620 cells cultured in MC or M2 medium after 72 h. All values (N = 12) are presented as average (±SD). Statistical analysis was performed using one-way ANOVA with Bonferroni correction; (*) indicates a statistically significant difference compared with control (p < 0.05).
4. Discussion
The results of the study indicate different responses of the cell lines to changes in glucose concentration and the proportion of fetal bovine serum (FBS) in the medium, which is important for understanding their metabolic and proliferative properties. The analysis of cell proliferation showed that the HeLa cells are extremely sensitive to the glucose concentration in the medium. At a high glucose concentration (4.5 g/L), their proliferation was strong and was additionally stimulated by a higher amount of FBS. In contrast, at a low glucose concentration (1 g/L), a significant decrease in proliferation was observed after 96 h, indicating the metabolic dependence of these cells on a high glucose supply, which is characteristic of many tumor cells that often show the so-called Warburg effect, i.e., a preferential use of glycolysis even in the presence of oxygen [30]. SW-620 cells also showed enhanced growth at high glucose concentrations, while growth was slowed at lower concentrations, indicating their adaptation but also their dependence on glucose for optimal proliferation [31,32]. However, FBS had no significant effect on the proliferation of these cells, which could indicate that these cells have intrinsic growth regulatory mechanisms that are less sensitive to exogenous growth factors contained in the serum [33,34]. In contrast to the tumor lines, the normal fibroblast line MRC-5 showed a significantly lower sensitivity to glucose concentration, which is consistent with its lower metabolic requirements [35,36]. Caco-2 cells showed no significant changes in proliferation with either glucose or FBS concentrations, indicating stable growth and metabolic flexibility of these cells. This makes them a suitable model for the study of barrier functions and absorption, whereby the stability of cell growth is an advantage [37]. Based on the growth kinetics and the clarity of the differences in the responses, a period of 72 h was determined to be optimal for further experiments, as the differences in proliferation between the various conditions and cell lines were clearly recognizable at this time.
Measurement of cell permeabilization via LDH release confirmed the sensitivity of HeLa cells to stress conditions—a significant increase in LDH levels was observed at low glucose and elevated FBS, indicating a disruption of membrane integrity [24,38]. In contrast, no changes occurred with high glucose, which again confirms that energy deficits are the main cause of cell damage. In MRC-5 and Caco-2 cells, LDH levels did not fluctuate significantly, confirming the preservation of the cell membrane and the resilience of these cells to changes in nutritional conditions. This is particularly important for MRC-5 cells, which show a more stable response than normal cells, while the Caco-2 line maintains its integrity despite changes, confirming it as a robust model.
Measurement of mitochondrial membrane potential (ΔΨm) in MRC-5 cells showed increased fluorescence at low glucose concentrations, indicating mitochondrial hyperpolarization due to increased electron transport chain (ETC) activity [39]. In HeLa cells, mitochondrial activity decreased significantly at low glucose levels, indicating energy stress and a decrease in oxidative phosphorylation [40]. Caco-2 cells showed a similar decrease in activity at 1 g/L glucose and 10% FBS, whereas they showed the highest mitochondrial activity at higher glucose and 15% FBS, indicating a good adaptation to the energy richness of the environment. No statistically significant change was observed in SW-620 cells, indicating a constant mitochondrial function independent of the fluctuations in the medium.
When measuring ATP levels, the medium with 1 g/L glucose and 10% FBS showed a significant decrease in ATP levels in MRC-5, HeLa and SW-620 cells compared to the control medium, confirming the importance of glucose as the main energy source and indicating a limitation of ATP production during energy deprivation. This fact also explains the observed changes in proliferation, membrane integrity and mitochondrial activity—all of which are related to energy availability to the cell [41].
It is obvious that the energy metabolism of cells grown in culture is influenced by the culture conditions. However, the remaining challenge is to optimize the media for each specific human cell type, such as stem and immune cells, co-cultures for the development of 3D or organoids, to ensure their metabolic needs and function. Metabolic differences between the cells studied indicate the need for more precise media formulation adapted to each cell line, especially in the context of personalized therapy, cell biology and biotechnology [42]. In a recent study, Eberhard et al. pointed out the importance of serum-free media that can improve the functionality and growth of CAR-T cells to achieve better therapeutic efficacy [43]. This is particularly relevant if we can reduce the use of FBS in media, which varies from batch to batch and requires many biological assays to validate their biosafety and potential viral threat. The use of serum in media is also an ethical issue that adds to the need for alternative sources of growth factors, such as bioactive peptides and trace elements [42]. Serum-free media are consistent and provide researchers with competent and reproducible results without interference between serum components and drugs under study. The results obtained with the cell model grown in serum-free media are more comparable between different research groups.
Ultimately, the results clearly show that different cell lines react differently to nutritional changes in the environment, depending on their type and functional properties. Tumor cells, especially HeLa and SW-620, show a pronounced glucose dependence and greater sensitivity to stress conditions, whereas normal cells (MRC-5) and enterocyte-like Caco-2 cells are more resistant and flexible to changing conditions. These findings provide a valuable basis for further targeting cellular mechanisms towards therapeutic and experimental approaches.
Author Contributions
M.L., K.M.Š. and T.O.-B.: conceptualization, investigation, writing—original draft preparation, review and editing, supervision, funding acquisition. K.V., N.K. and M.O.: investigation, experimental work. All authors have read and agreed to the published version of the manuscript.
Funding
The research was partially funded by the project (Interreg VI-A) IPA CBC Croatia Serbia HR-RS00148-ABIDERS, within which the multimodal Tecan Spark reader was purchased and used in all analyses.
Informed Consent Statement
Not applicable.
Data Availability Statement
The raw data supporting the conclusions of this article will be made available by the authors on request.
Conflicts of Interest
The authors declare no conflicts of interest.
Abbreviations
The following abbreviations are used in this manuscript:
| AMPK | AMP-Activated Protein Kinase |
| ATP | Adenosine Triphosphate |
| ATPlite | ATP Luminescence Assay Kit |
| DMEM | Dulbecco’s Modified Eagle Medium |
| DRP1 | Dynamin-Related Protein 1 |
| ETC | Electron Transport Chain |
| FBS | Foetal Bovine Serum |
| LDH | Lactate Dehydrogenase |
| mTORC1 | Mechanistic Target of Rapamycin Complex 1 |
| NAD+ | Nicotinamide Adenine Dinucleotide (oxidized form) |
| PBS | Phosphate Buffered Saline |
| PINK1 | PTEN-Induced Kinase 1 |
| ROS | Reactive Oxygen Species |
| ULK1 | Unc-51-Like Kinase 1 |
References
- Segeritz, C.-P.; Vallier, L. Cell Culture. In Basic Science Methods for Clinical Researchers; Elsevier: Amsterdam, The Netherlands, 2017; pp. 151–172. ISBN 978-0-12-803077-6. [Google Scholar]
- Yao, T.; Asayama, Y. Animal-cell Culture Media: History, Characteristics, and Current Issues. Reprod. Med. Biol. 2017, 16, 99–117. [Google Scholar] [CrossRef]
- Schnellbaecher, A.; Binder, D.; Bellmaine, S.; Zimmer, A. Vitamins in Cell Culture Media: Stability and Stabilization Strategies. Biotech. Bioeng. 2019, 116, 1537–1555. [Google Scholar] [CrossRef] [PubMed]
- Subbiahanadar Chelladurai, K.; Selvan Christyraj, J.D.; Rajagopalan, K.; Yesudhason, B.V.; Venkatachalam, S.; Mohan, M.; Chellathurai Vasantha, N.; Selvan Christyraj, J.R.S. Alternative to FBS in Animal Cell Culture-An Overview and Future Perspective. Heliyon 2021, 7, e07686. [Google Scholar] [CrossRef] [PubMed]
- Lee, D.Y.; Lee, S.Y.; Yun, S.H.; Jeong, J.W.; Kim, J.H.; Kim, H.W.; Choi, J.S.; Kim, G.-D.; Joo, S.T.; Choi, I.; et al. Review of the Current Research on Fetal Bovine Serum and the Development of Cultured Meat. Food Sci. Anim. Resour. 2022, 42, 775–799. [Google Scholar] [CrossRef] [PubMed]
- Pilgrim, C.R.; McCahill, K.A.; Rops, J.G.; Dufour, J.M.; Russell, K.A.; Koch, T.G. A Review of Fetal Bovine Serum in the Culture of Mesenchymal Stromal Cells and Potential Alternatives for Veterinary Medicine. Front. Vet. Sci. 2022, 9, 859025. [Google Scholar] [CrossRef]
- Koobotse, M.O.; Schmidt, D.; Holly, J.M.P.; Perks, C.M. Glucose Concentration in Cell Culture Medium Influences the BRCA1-Mediated Regulation of the Lipogenic Action of IGF-I in Breast Cancer Cells. Int. J. Mol. Sci. 2020, 21, 8674. [Google Scholar] [CrossRef]
- Men, X.; Wang, H.; Li, M.; Cai, H.; Xu, S.; Zhang, W.; Xu, Y.; Ye, L.; Yang, W.; Wollheim, C.B.; et al. Dynamin-Related Protein 1 Mediates High Glucose Induced Pancreatic Beta Cell Apoptosis. Int. J. Biochem. Cell Biol. 2009, 41, 879–890. [Google Scholar] [CrossRef]
- Cao, M.; Jiang, J.; Du, Y.; Yan, P. Mitochondria-Targeted Antioxidant Attenuates High Glucose-Induced P38 MAPK Pathway Activation in Human Neuroblastoma Cells. Mol. Med. Rep. 2012, 5, 929–934. [Google Scholar] [CrossRef]
- Chen, X.; Yang, Y.; Pan, Z.; Xu, J.; Jiang, T.; Zhang, L.; Zhu, K.; Zhang, D.; Song, J.; Sheng, C.; et al. The Inhibition of PINK1/Drp1-Mediated Mitophagy by Hyperglycemia Leads to Impaired Osteoblastogenesis in Diabetes. iScience 2025, 28, 111519. [Google Scholar] [CrossRef]
- Yen, B.L.; Wang, L.-T.; Wang, H.-H.; Hung, C.-P.; Hsu, P.-J.; Chang, C.-C.; Liao, C.-Y.; Sytwu, H.-K.; Yen, M.-L. Excess Glucose Alone Depress Young Mesenchymal Stromal/Stem Cell Osteogenesis and Mitochondria Activity within Hours/Days via NAD+/SIRT1 Axis. J. Biomed. Sci. 2024, 31, 49. [Google Scholar] [CrossRef]
- Kim, D.-H. Contrasting Views on the Role of AMPK in Autophagy. BioEssays 2024, 46, 2300211. [Google Scholar] [CrossRef]
- Park, J.-M.; Lee, D.-H.; Kim, D.-H. Redefining the Role of AMPK in Autophagy and the Energy Stress Response. Nat. Commun. 2023, 14, 2994. [Google Scholar] [CrossRef]
- Park, J.-M.; Kim, D.-H. A Paradigm Shift: AMPK Negatively Regulates ULK1 Activity. Autophagy 2024, 20, 960–962. [Google Scholar] [CrossRef] [PubMed]
- Kim, J.; Kundu, M.; Viollet, B.; Guan, K.-L. AMPK and mTOR Regulate Autophagy through Direct Phosphorylation of Ulk1. Nat. Cell Biol. 2011, 13, 132–141. [Google Scholar] [CrossRef]
- Li, F.; Wan, X.; Li, Z.; Zhou, L. High Glucose Inhibits Autophagy and Promotes the Proliferation and Metastasis of Colorectal Cancer through the PI3K/AKT/mTOR Pathway. Cancer Med. 2024, 13, e7382. [Google Scholar] [CrossRef]
- Laplante, M.; Sabatini, D.M. mTOR Signaling in Growth Control and Disease. Cell 2012, 149, 274–293. [Google Scholar] [CrossRef]
- Qiu, J.; Zheng, Q.; Meng, X. Hyperglycemia and Chemoresistance in Breast Cancer: From Cellular Mechanisms to Treatment Response. Front. Oncol. 2021, 11, 628359. [Google Scholar] [CrossRef]
- Gerber, P.A.; Rutter, G.A. The Role of Oxidative Stress and Hypoxia in Pancreatic Beta-Cell Dysfunction in Diabetes Mellitus. Antioxid. Redox Signal. 2017, 26, 501–518. [Google Scholar] [CrossRef] [PubMed]
- Abdalla, M.M.I. Advancing Diabetes Management: Exploring Pancreatic Beta-Cell Restoration’s Potential and Challenges. World J. Gastroenterol. 2024, 30, 4339–4353. [Google Scholar] [CrossRef] [PubMed]
- Matteucci, A.; Varano, M.; Mallozzi, C.; Gaddini, L.; Villa, M.; Gabrielli, S.; Formisano, G.; Pricci, F.; Malchiodi-Albedi, F. Primary Retinal Cultures as a Tool for Modeling Diabetic Retinopathy: An Overview. BioMed Res. Int. 2015, 2015, 364924. [Google Scholar] [CrossRef]
- Hattangady, N.; Rajadhyaksha, M. A Brief Review of in Vitro Models of Diabetic Neuropathy. Int. J. Diab Dev. Ctries. 2009, 29, 143. [Google Scholar] [CrossRef]
- Hoang, V.T.; Trinh, Q.-M.; Phuong, D.T.M.; Bui, H.T.H.; Hang, L.M.; Ngan, N.T.H.; Anh, N.T.T.; Nhi, P.Y.; Nhung, T.T.H.; Lien, H.T.; et al. Standardized Xeno- and Serum-Free Culture Platform Enables Large-Scale Expansion of High-Quality Mesenchymal Stem/Stromal Cells from Perinatal and Adult Tissue Sources. Cytotherapy 2021, 23, 88–99. [Google Scholar] [CrossRef]
- Feng, T.; Xu, X.; Wang, X.; Tang, W.; Lu, Y. PGRN Protects against Serum Deprivation-Induced Cell Death by Promoting the ROS Scavenger System in Cervical Cancer. Cell Death Dis. 2024, 15, 889. [Google Scholar] [CrossRef]
- Kumar, P.; Nagarajan, A.; Uchil, P.D. Analysis of Cell Viability by the Lactate Dehydrogenase Assay. Cold Spring Harb. Protoc. 2018, 6, pdb-prot095497. [Google Scholar] [CrossRef]
- Forkasiewicz, A.; Dorociak, M.; Stach, K.; Szelachowski, P.; Tabola, R.; Augoff, K. The Usefulness of Lactate Dehydrogenase Measurements in Current Oncological Practice. Cell. Mol. Biol. Lett. 2020, 25, 35. [Google Scholar] [CrossRef]
- Rashid, M.; Coombs, K.M. Serum-reduced Media Impacts on Cell Viability and Protein Expression in Human Lung Epithelial Cells. J. Cell. Physiol. 2019, 234, 7718–7724. [Google Scholar] [CrossRef] [PubMed]
- Petrović, D.J.; Jagečić, D.; Krasić, J.; Sinčić, N.; Mitrečić, D. Effect of Fetal Bovine Serum or Basic Fibroblast Growth Factor on Cell Survival and the Proliferation of Neural Stem Cells: The Influence of Homocysteine Treatment. Int. J. Mol. Sci. 2023, 24, 14161. [Google Scholar] [CrossRef] [PubMed]
- Santos, L.M.; Cardoso, P.E.S.; Diniz, E.A.; Rahhal, J.G.; Sipert, C.R. Different Concentrations of Fetal Bovine Serum Affect Cytokine Modulation in Lipopolysaccharide-Activated Apical Papilla Cells in Vitro. J. Appl. Oral. Sci. 2023, 31, e20230020. [Google Scholar] [CrossRef] [PubMed]
- Vander Heiden, M.G.; Cantley, L.C.; Thompson, C.B. Understanding the Warburg Effect: The Metabolic Requirements of Cell Proliferation. Science 2009, 324, 1029–1033. [Google Scholar] [CrossRef]
- Yang, I.-P.; Tsai, H.-L.; Huang, C.-W.; Lu, C.-Y.; Miao, Z.-F.; Chang, S.-F.; Juo, S.-H.H.; Wang, J.-Y. High Blood Sugar Levels Significantly Impact the Prognosis of Colorectal Cancer Patients through Down-Regulation of microRNA-16 by Targeting Myb and VEGFR2. Oncotarget 2016, 7, 18837–18850. [Google Scholar] [CrossRef]
- Mosaad, H.; Shalaby, S.M.; Mahmoud, N.M.; Ahmed, M.M.; Fayed, A.; Ashour, H.R.; Sarhan, W. LncRNA ANRIL Promotes Glucose Metabolism and Proliferation of Colon Cancer in a High-Glucose Environment and Is Associated with Worse Outcome in Diabetic Colon Cancer Patients. Asian Pac. J. Cancer Prev. 2024, 25, 1371–1381. [Google Scholar] [CrossRef]
- Huschtscha, L.; Rozengurt, E.; Bodmer, W.F. Growth Factor Requirements of Human Colorectal Tumour Cells: Relations to Cellular Differentiation. Eur. J. Cancer Clin. Oncol. 1991, 27, 1680–1684. [Google Scholar] [CrossRef]
- Cheng, Y.; Lu, Y.; Zhang, D.; Lian, S.; Liang, H.; Ye, Y.; Xie, R.; Li, S.; Chen, J.; Xue, X.; et al. Metastatic Cancer Cells Compensate for Low Energy Supplies in Hostile Microenvironments with Bioenergetic Adaptation and Metabolic Reprogramming. Int. J. Oncol. 2018, 53, 2590–2604. [Google Scholar] [CrossRef] [PubMed]
- Li, Y.; Tollefsbol, T.O. p16INK4a Suppression by Glucose Restriction Contributes to Human Cellular Lifespan Extension through SIRT1-Mediated Epigenetic and Genetic Mechanisms. PLoS ONE 2011, 6, e17421. [Google Scholar] [CrossRef] [PubMed]
- Carlos-Reyes, A.; Romero-Garcia, S.; Prado-Garcia, H. Metabolic Responses of Lung Adenocarcinoma Cells to Survive under Stressful Conditions Associated with Tumor Microenvironment. Metabolites 2024, 14, 103. [Google Scholar] [CrossRef]
- Steenson, S.; Shojaee-Moradie, F.; Lovegrove, J.A.; Umpleby, A.M.; Jackson, K.G.; Fielding, B.A. Dose Dependent Effects of Fructose and Glucose on de Novo Palmitate and Glycerol Synthesis in an Enterocyte Cell Model. Mol. Nutr. Food Res. 2022, 66, 2100456. [Google Scholar] [CrossRef]
- Iurlaro, R.; Püschel, F.; León-Annicchiarico, C.L.; O’Connor, H.; Martin, S.J.; Palou-Gramón, D.; Lucendo, E.; Muñoz-Pinedo, C. Glucose Deprivation Induces ATF4-Mediated Apoptosis through TRAIL Death Receptors. Mol. Cell. Biol. 2017, 37, e00479-16. [Google Scholar] [CrossRef]
- Costa, C.F.; Pinho, S.A.; Pinho, S.L.C.; Miranda-Santos, I.; Bagshaw, O.; Stuart, J.; Oliveira, P.J.; Cunha-Oliveira, T. Mitochondrial and Metabolic Remodeling in Human Skin Fibroblasts in Response to Glucose Availability. bioRxiv 2021. bioRxiv:2021.02.24.432508. [Google Scholar] [CrossRef]
- Visagie, M.H.; Mqoco, T.V.; Liebenberg, L.; Mathews, E.H.; Mathews, G.E.; Joubert, A.M. Influence of Partial and Complete Glutamine-and Glucose Deprivation of Breast-and Cervical Tumorigenic Cell Lines. Cell Biosci. 2015, 5, 37. [Google Scholar] [CrossRef]
- Circu, M.L.; Maloney, R.E.; Aw, T.Y. Low Glucose Stress Decreases Cellular NADH and Mitochondrial ATP in Colonic Epithelial Cancer Cells: Influence of Mitochondrial Substrates. Chem.-Biol. Interact. 2017, 264, 16–24. [Google Scholar] [CrossRef]
- Wijerathna-Yapa, A.; Isaac, K.S.; Combe, M.; Hume, S.; Sokolenko, S. Re-Imagining Human Cell Culture Media: Challenges, Innovations, and Future Directions. Biotechnol. Adv. 2025, 81, 108564. [Google Scholar] [CrossRef] [PubMed]
- Eberhardt, F.; Hückelhoven-Krauss, A.; Kunz, A.; Jiang, G.; Sauer, T.; Reichman, A.; Neuber, B.; Böpple, K.; Schmitt, A.; Müller-Tidow, C.; et al. Impact of Serum-free Media on the Expansion and Functionality of CD19.CAR T-cells. Int. J. Mol. Med. 2023, 52, 58. [Google Scholar] [CrossRef] [PubMed]

Disclaimer/Publisher’s Note: The statements, opinions and data contained in all publications are solely those of the individual author(s) and contributor(s) and not of MDPI and/or the editor(s). MDPI and/or the editor(s) disclaim responsibility for any injury to people or property resulting from any ideas, methods, instructions or products referred to in the content. |
© 2025 by the authors. Licensee MDPI, Basel, Switzerland. This article is an open access article distributed under the terms and conditions of the Creative Commons Attribution (CC BY) license (https://creativecommons.org/licenses/by/4.0/).