Article

Hydrogen Sulfide Has a Minor Impact on Human Gut Microbiota Across Age Groups

by
Linshu Liu
1,*,
Johanna M. S. Lemons
1,
Jenni Firrman
1,
Karley K. Mahalak
1,
Venkateswari J. Chetty
1,†,
Adrienne B. Narrowe
1,
Stephanie Higgins
2,
Ahmed M. Moustafa
2,3,4,
Aurélien Baudot
5,
Stef Deyaert
5 and
Pieter Van den Abbeele
5
1
Dairy and Functional Foods Research Unit, Eastern Regional Research Center, Agricultural Research Service, United States Department of Agriculture, Wyndmoor, PA 19038, USA
2
Division of Gastroenterology, Hepatology, and Nutrition, The Children’s Hospital of Philadelphia, Philadelphia, PA 19104, USA
3
Department of Pediatrics, Perelman School of Medicine, University of Pennsylvania, Philadelphia, PA 19104, USA
4
Center for Microbial Medicine, Children’s Hospital of Philadelphia, Philadelphia, PA 19104, USA
5
Cryptobiotix, Technologiepark-Zwijnaarde 82, 9052 Ghent, Belgium
*
Author to whom correspondence should be addressed.
Current address: Foreign Animal Disease Research Unit, National Bio and Agro-Defense Facility, Agricultural Research Service, United States Department of Agriculture, P.O. Box 1807, Manhattan, KS 66505, USA.
Sci 2025, 7(3), 102; https://doi.org/10.3390/sci7030102 (registering DOI)
Submission received: 16 May 2025 / Revised: 1 July 2025 / Accepted: 28 July 2025 / Published: 1 August 2025
(This article belongs to the Section Biology Research and Life Sciences)

Abstract

Hydrogen sulfide (H2S) can be produced from the metabolism of foods containing sulfur in the gastrointestinal tract (GIT). At low doses, H2S regulates the gut microbial community and supports GIT health, but depending on dose, age, and individual health conditions, it may also contribute to inflammatory responses and gut barrier dysfunction. Controlling H2S production in the GIT is important for maintaining a healthy gut microbiome. However, research on this subject is limited due to the gaseous nature of the chemical and the difficulty of accessing the GIT in situ. In the present ex vivo experiment, we used a single-dose sodium sulfide preparation (SSP) as a H2S precursor to test the effect of H2S on the human gut microbiome across different age groups, including breastfed infants, toddlers, adults, and older adults. Metagenomic sequencing and metabolite measurements revealed that the development of the gut microbial community and the production of short-chain fatty-acids (SCFAs) were age-dependent; that the infant and the older adult groups were more sensitive to SSP exposure; that exogeneous SSP suppressed SCFA production across all age groups, except for butyrate in the older adult group, suggesting that H2S selectively favors specific gut microbial processes.

1. Introduction

Humans obtain sulfur from their diet. Everyday dietary components such as nuts, eggs, dairy compounds, and meats contain cysteine and taurine, which are metabolized by the bacteria in the gastrointestinal tract (GIT), producing H2S as a byproduct that can be detrimental at high levels [1,2,3,4]. Besides diet, the host’s health conditions and the general digestive and circulatory systems also affect the level of H2S [5,6]. Once produced, H2S interacts with both bacterial cells and host cells in the GIT, with/within remote organs, and can impact their functionalities [7,8]. Some research has reported that H2S protects bacteria from oxidative stress and reduces systemic inflammation; that it might protect against heart disease by relaxing blood vessels; and that it could play a role in protecting brain cells, aiding in conditions such as Alzheimer’s and Parkinson’s disease [9,10,11]. However, some results were negative: high dose or long-time exposure to H2S could cause neurological and respiratory problems [12]. Reports describing the effects of H2S are sometimes contradictory and many are still under scrutiny [13,14].
The complexity of the gut microbial structure, the inaccessibility of the GIT, and scientists’ lack of control over H2S production in the GIT often hinders further research on this complicated signaling process. To circumvent these complications, researchers have started to use sodium sulfide (Na2S) [15] in artificial gut simulators to explore the intricate relationship between H2S and the gut microbiota, as well as its impact on GIT health [14,16,17]. Using Na2S over gaseous H2S for in vitro gut microbiome studies offers several advantages. It can be added in a precise amount to the medium, and it is more stable and easier to handle than gaseous H2S, which allows better control over the concentration of sulfide ions available to the gut microbiota. While it still requires careful handling, it is less toxic and poses less risk to the researchers [13,18].
In the present study, we investigate the bacterial response to H2S, using sodium sulfide preparation (SSP) as a H2S precursor, in terms of short chain fatty acid (SCFA) production, the age-dependency effect on gut microbial community, and the subsequent impact on colonic barrier function, using a well-documented ex vivo device, SIFR technology. To the best of our knowledge, we are the first to use a single dose of sodium sulfide preparation (SSP) to test age groups spanning from infancy to older adulthood.

2. Materials and Methods

2.1. Materials

Sodium sulfide, Na2S, was purchased from Merck Life Science BV (Hoeilaart, Belgium). Fecal samples were obtained from four age groups, including breastfed infants, toddlers, adults (25–40), and older adults (60+). The collection was implemented according to the IRB protocol, approved by the Ethics Committee of the University Hospital Ghent, Belgium (BC-09977). Donors (six for each age group) were non-smokers, drank less than three servings of alcohol/day, had no gastrointestinal disorders or cancer, were not on any medications to treat psychological disorders or allergies, and had not taken any anti-/pre-/probiotics for at least three months before their donations.

2.2. Ex Vivo Testing Setup

The experiments were carried out using ex vivo SIFR® technology, as described previously [19]. Briefly, bioreactors containing anaerobic nutritional media were inoculated with fecal slurry. For each donor, one bioreactor was used as control (no-substrate control, NSC), and another was supplemented with SSP at the concentration of 5 mM (0.39 g/L), which is higher than the normal in vivo level of 1–2.4 mM [20], to assess potential effects. Samples were collected at the beginning (time 0) and at the end (24 h) of the experiment for cell count by flow cytometry, SCFA measurement, and DNA sequencing. At the same time points, the gas in headspace was sampled for total gas production.

2.3. Bacterial Cell Counts

Bacterial samples were suspended in anaerobic phosphate-buffered saline, stained with 1 μM SYTO 16, and counted for bacterial cell numbers [21] using a BD FACS Verse flow cytometer (BD, Erembodegem, Belgium). Data were analyzed using FlowJo, version 10.8.1.

2.4. SCFA, Lactate, and Gas Measurement

Gas production was measured as the increase of pressure in the headspace of each vessel between the beginning and end of the experiment. Individual SCFAs, namely acetate, propionate, butyrate, valerate, and branched-chain fatty acids (BCFAs), as well as lactate, were determined as described previously [21]. Briefly, 0.5 mL samples were mixed with 1.5 mL distilled water, acidified with 0.5 mL of 48% sulfuric acid. An excess of sodium chloride was added, along with 0.2 mL of 2-methylhexanoic acid (internal standard) and 2.0 mL of diethyl ether (extraction solvent). After vortexing for homogenization and allowing the mixture to stand for phase separation, the diethyl ether extracts were collected and analyzed using a Trace 1300 chromatograph (Thermo Fisher Scientific, Merelbeke, Belgium) equipped with a Stabilwax-DA capillary GC column, a flame ionization detector, and a split injector using nitrogen gas as both the carrier and makeup gas. The analysis was carried out at the following settings: injection volume, 1.0 µL; temperature profile, from 110 to 240 °C; and injector and detector temperatures, 240 and 250 °C, respectively. Total SCFA and BCFA amounts were calculated by summing the respective fatty acids. Lactate was measured using an enzymatic method according to the manufacturer’s instructions (EnzytecTM, R-Biopharm, Darmstadt, Germany). All measurements were performed in triplicate.

2.5. Transepithelial Electrical Resistance (TEER) Measurement

Human colonoids (n = 147) from distal convoluted tubule tissue were plated in 24-well hanging inserts (cellQART (SABEU, Northeim, Germany), 0.4 μm pore, polyethylene terephthalate membrane) at a density of 100 organoids/well and allowed to differentiate for 15 days. During this time, cells were maintained in an incubator at 37 °C with 5% CO2 in 100 μL growth media (cell culture conditioned medium and differentiation medium) in the apical chamber and 600 μL in the basolateral chamber. The medium was changed every 2–3 days. Bacteria-free supernatants from the no-substrate control (NSC) and the hydrogen sulfide (H2S)-treated gut microbiota of six test subjects, each from the toddler and healthy adult (60+ years) groups, were thawed on ice, diluted 1:1 in growth media, filter-sterilized through a 0.2 μm filter (24 different supernatants total), and used to treat the cells. One well of cells was treated per treatment. Before treatment, the plates of cells were removed from the incubator and allowed to equilibrate to room temperature, and then transepithelial electrical resistance (TEER) was measured using the EVOM2 epithelial voltohmmeter and an STX2 electrode (World Precision Instruments, Sarasota, FL, USA). The medium was aspirated, and the cells were rinsed once with PBS before 100 μL of the diluted cell free supernatant was added to the apical chamber and 600 μL of fresh growth medium was added to the basolateral chamber. TEER was measured at 2 h, 24 h, 48 h, and 72 h. The TEER readings for each treatment condition and at each timepoint were averaged across donors. Multiple comparisons following a 2-way ANOVA were performed in GraphPad Prism (v.10.0.2) (GraphPad Software, San Diego, CA, USA) to determine significance.

2.6. DNA Extraction and Sequencing

DNA extraction, quantitation, and sequencing were performed according to the procedure described previously [19]. Briefly, a Quant-iT PicoGreen dsDNA assay kit (Thermo Fisher Scientific) was used for DNA quantity and library building; sequencing was carried out on an Illumina Novaseq 6000 v1.5 flow cell (Illumina, San Diego, CA, USA), producing 2 × 150 bp paired-end reads. Extraction blanks and nucleic acid-free water were used as a negative control; a laboratory-generated mock community consisting of DNA from Vibrio campbellii and Lambda phage were included as a positive sequencing control.

2.7. Bioinformatics Analysis

Bioinformatics analysis was performed as described in our previous publication [19]. Briefly, raw shotgun metagenomic sequencing data was preprocessed using BBDuk v. 39.01 (sourceforge.net/projects/bbmap/, accessed on 27 July 2025). After removing the artifacts and trimming, the filtered reads were used to estimate microbial community composition and abundances using MetaPhlAn v 4.0.6 with the CHOCOPhlAnSGB_202212 reference database [22]. Community relative abundances were converted to absolute abundances using flow cytometry data for downstream analysis. Using HUMAnN v 3.8 [23], read-based functional profiles were generated, converted to KEGG orthologs, and subsequently normalized to relative abundance. Alpha diversity was calculated as taxonomic richness and the Shannon diversity index, using the MetaPhlAn utility script calculate_diversity. R., and significant differences among treatments and age groups were tested using the paired Wilcoxon signed-rank test. Beta diversity was calculated using weighted UniFrac metrics and plotted using principal coordinate analysis (PCoA). PERMANOVA (pairwise adonis2 package) was used for testing significant clustering by either treatment or age [24].

2.8. Statistical Analyses

Taxon and pathway association was investigated using MaAsLin2 [25]. Multiple testing correction was performed using the Benjamini–Hochberg method with the method’s default FDR threshold of 0.25. Other statistical analyses and visualizations were conducted using R/RStudio (v.4.1.3) and the following packages: tidyverse (v.1.3.1) [26], vegan (v.2.6-2) [27], and ape (v.5.6-2) [28]. TEER plots were also created using GraphPad Prism 10 (GraphPad Software, San Diego, CA, USA).

2.9. Data Availability

Metagenomic sequencing data are available in the NCBI Sequence Read Archive associated with BioProject PRJNA1160256.

3. Results

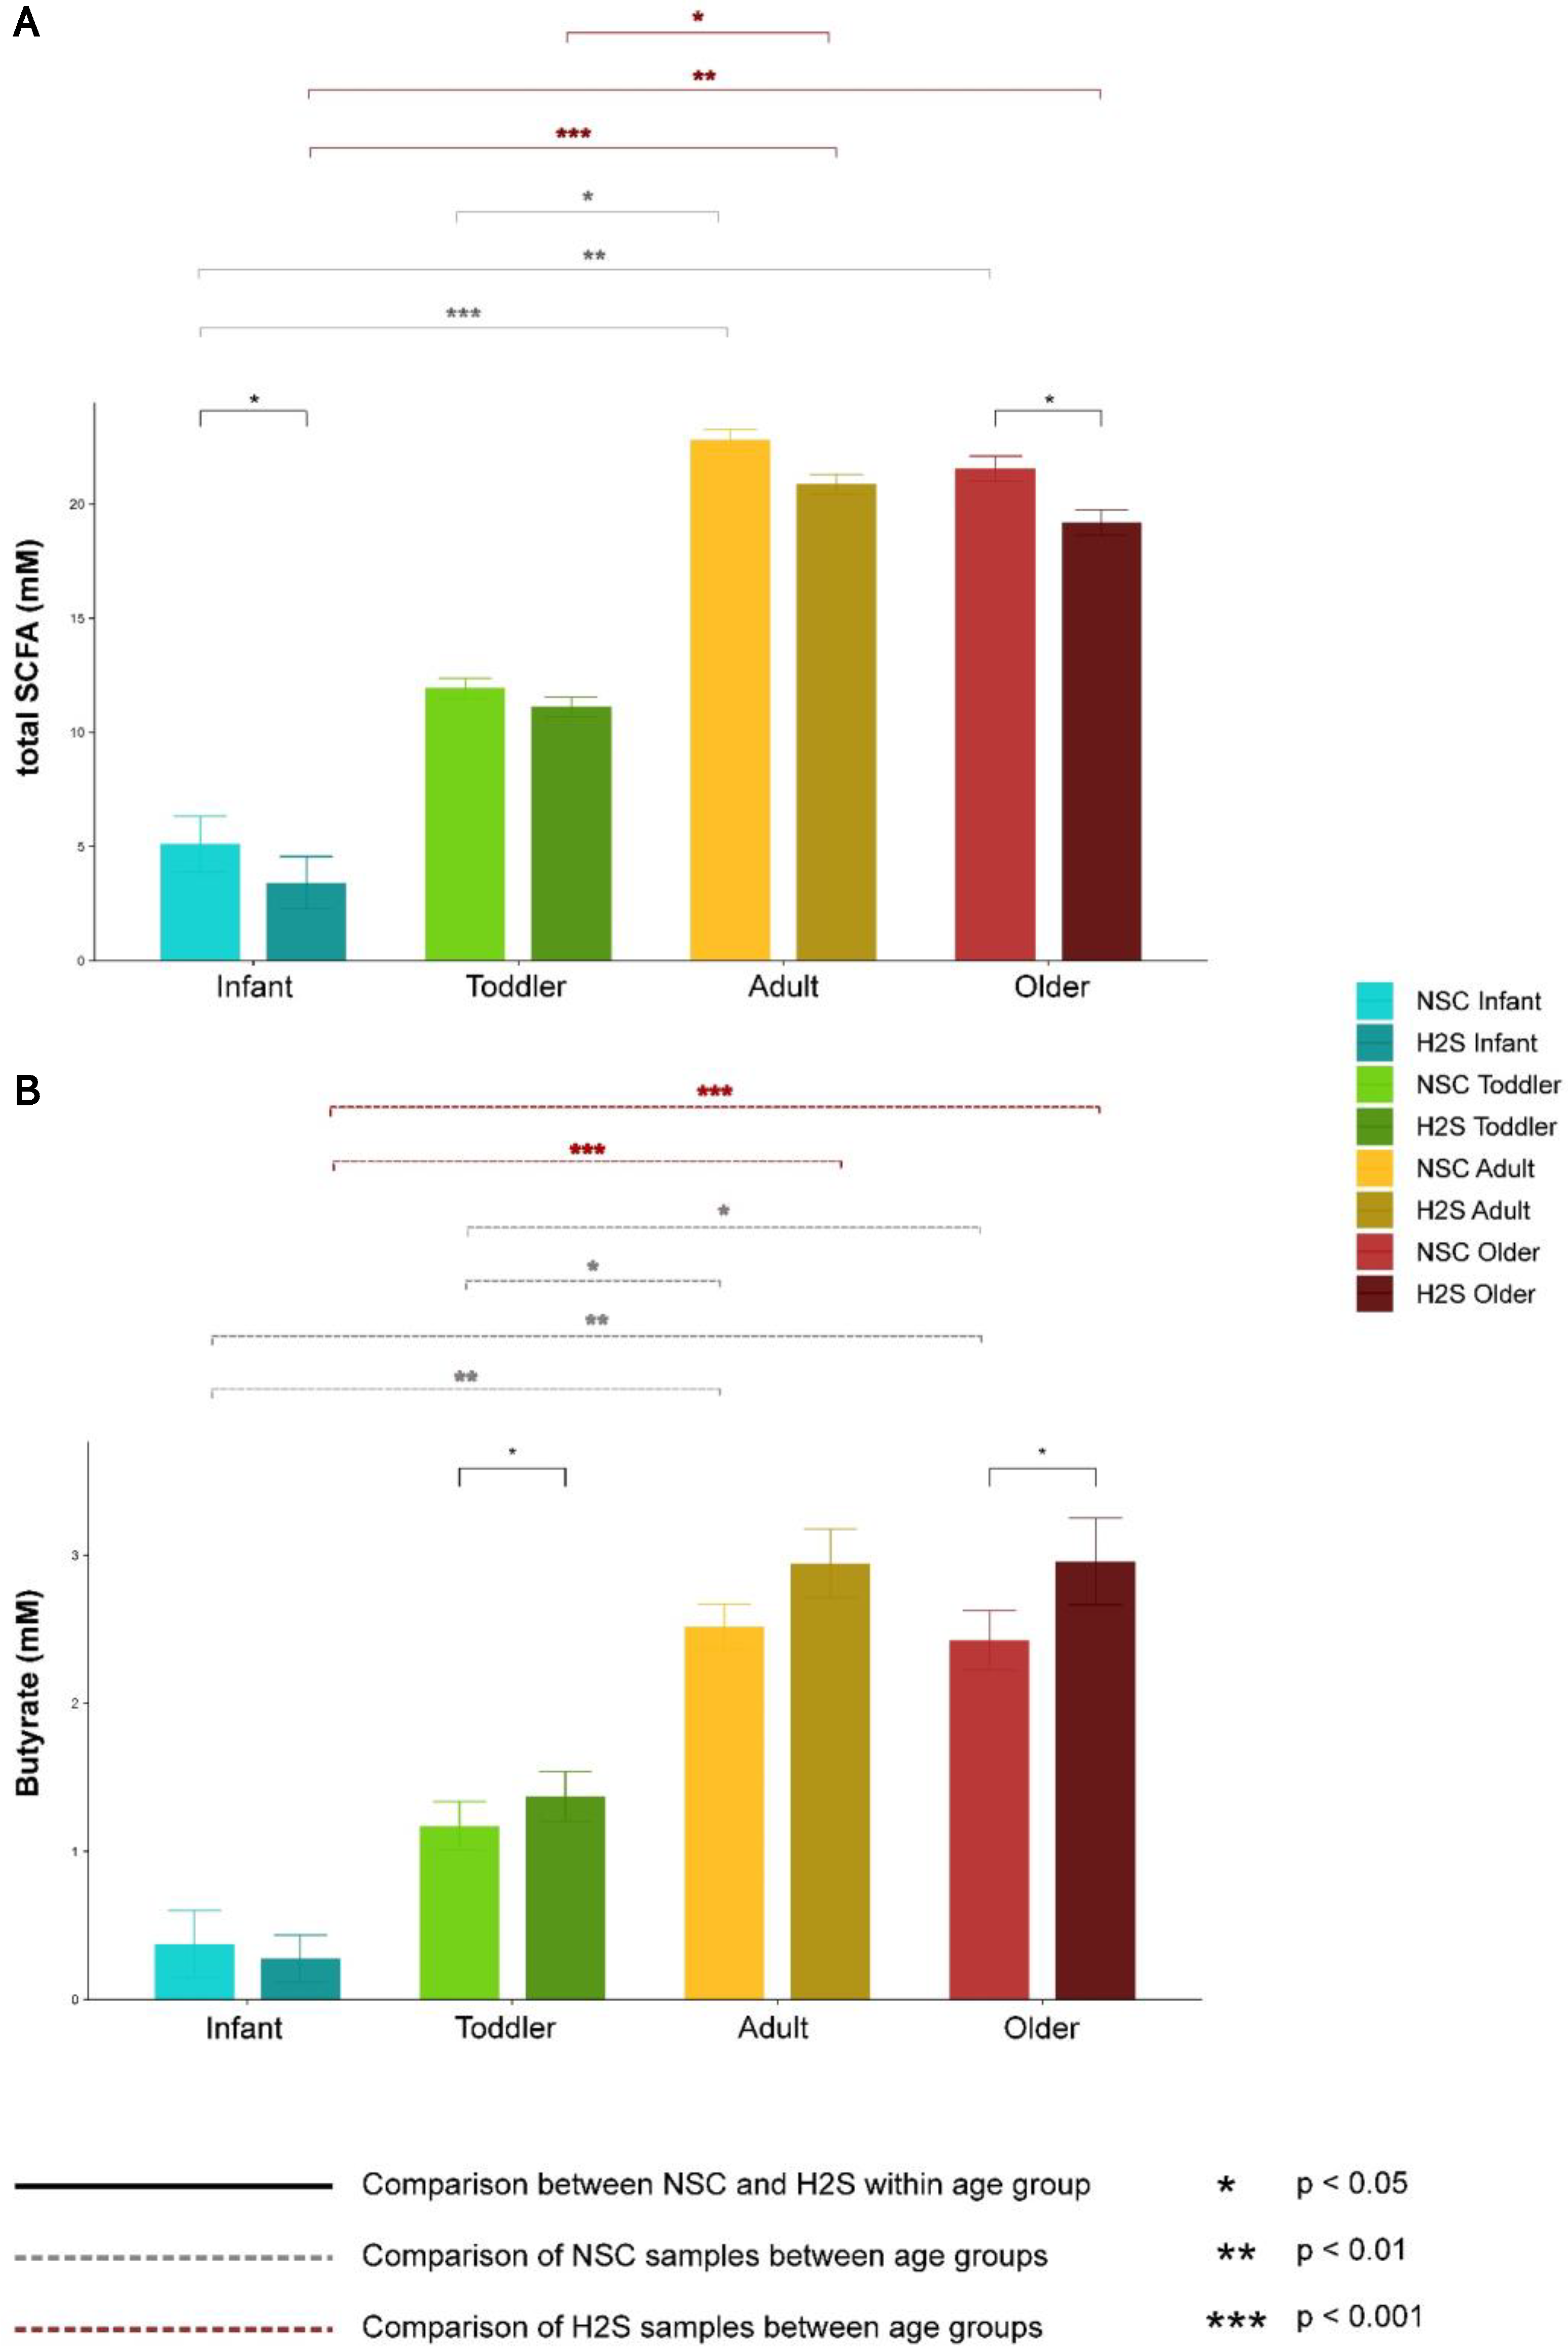
3.1. Effect of SSP on the Metabolism of the Gut Microbial Communities

In this experiment, we examined the impact of SSP on gut microbial communities across four age groups, ranging from infants to older adults (60+ years). The measured fermentation parameters included total and individual SCFAs (acetate, propionate, butyrate, and valerate), branched SCFAs (bSCFAs), gas production, and lactate. For total SCFA production (Figure 1A), the amounts measured in the older adult group were similar to those in the adult group, and both were significantly higher than in the infant and toddler groups for both the NSC- and SSP-treated communities. Comparing the NSC with the treated communities within age groups revealed that treatment suppressed SCFA production across all age groups, but this only achieved significance in the infant and older adult age groups (Figure 1A). Individual amounts of the SCFAs (acetate, propionate, and valerate), as well as the amount of bSCFAs, displayed the same patterns among the age groups regardless of treatment, and between NSC- and SSP-treated communities within an individual age-group (Supplementary Figure S1A–D). Interestingly, despite the overall decrease in total SCFA production due to the SSP treatment, a significant increase in butyrate was detected in both the older adult and toddler groups after the SSP treatment (Figure 1B).
As both gas and SCFAs are the byproducts of microbial fermentation of the same substrates available in the GIT, there was general agreement between the two measurements. Similar to total SCFA production, gas production also displayed an age-dependent profile (Supplementary Figure S1E). However, while the SSP treatment reduced the amount of total SCFAs produced for the adult and older adult groups, gas production was actually higher in these communities (Figure 1A, Supplementary Figure S1E). The same SSP treatment, however, reduced both the SCFA and gas production in the infant and toddler groups. Overall, the investigated fermentation parameters varied primarily by age group, with secondary impacts attributable to the SSP treatment.

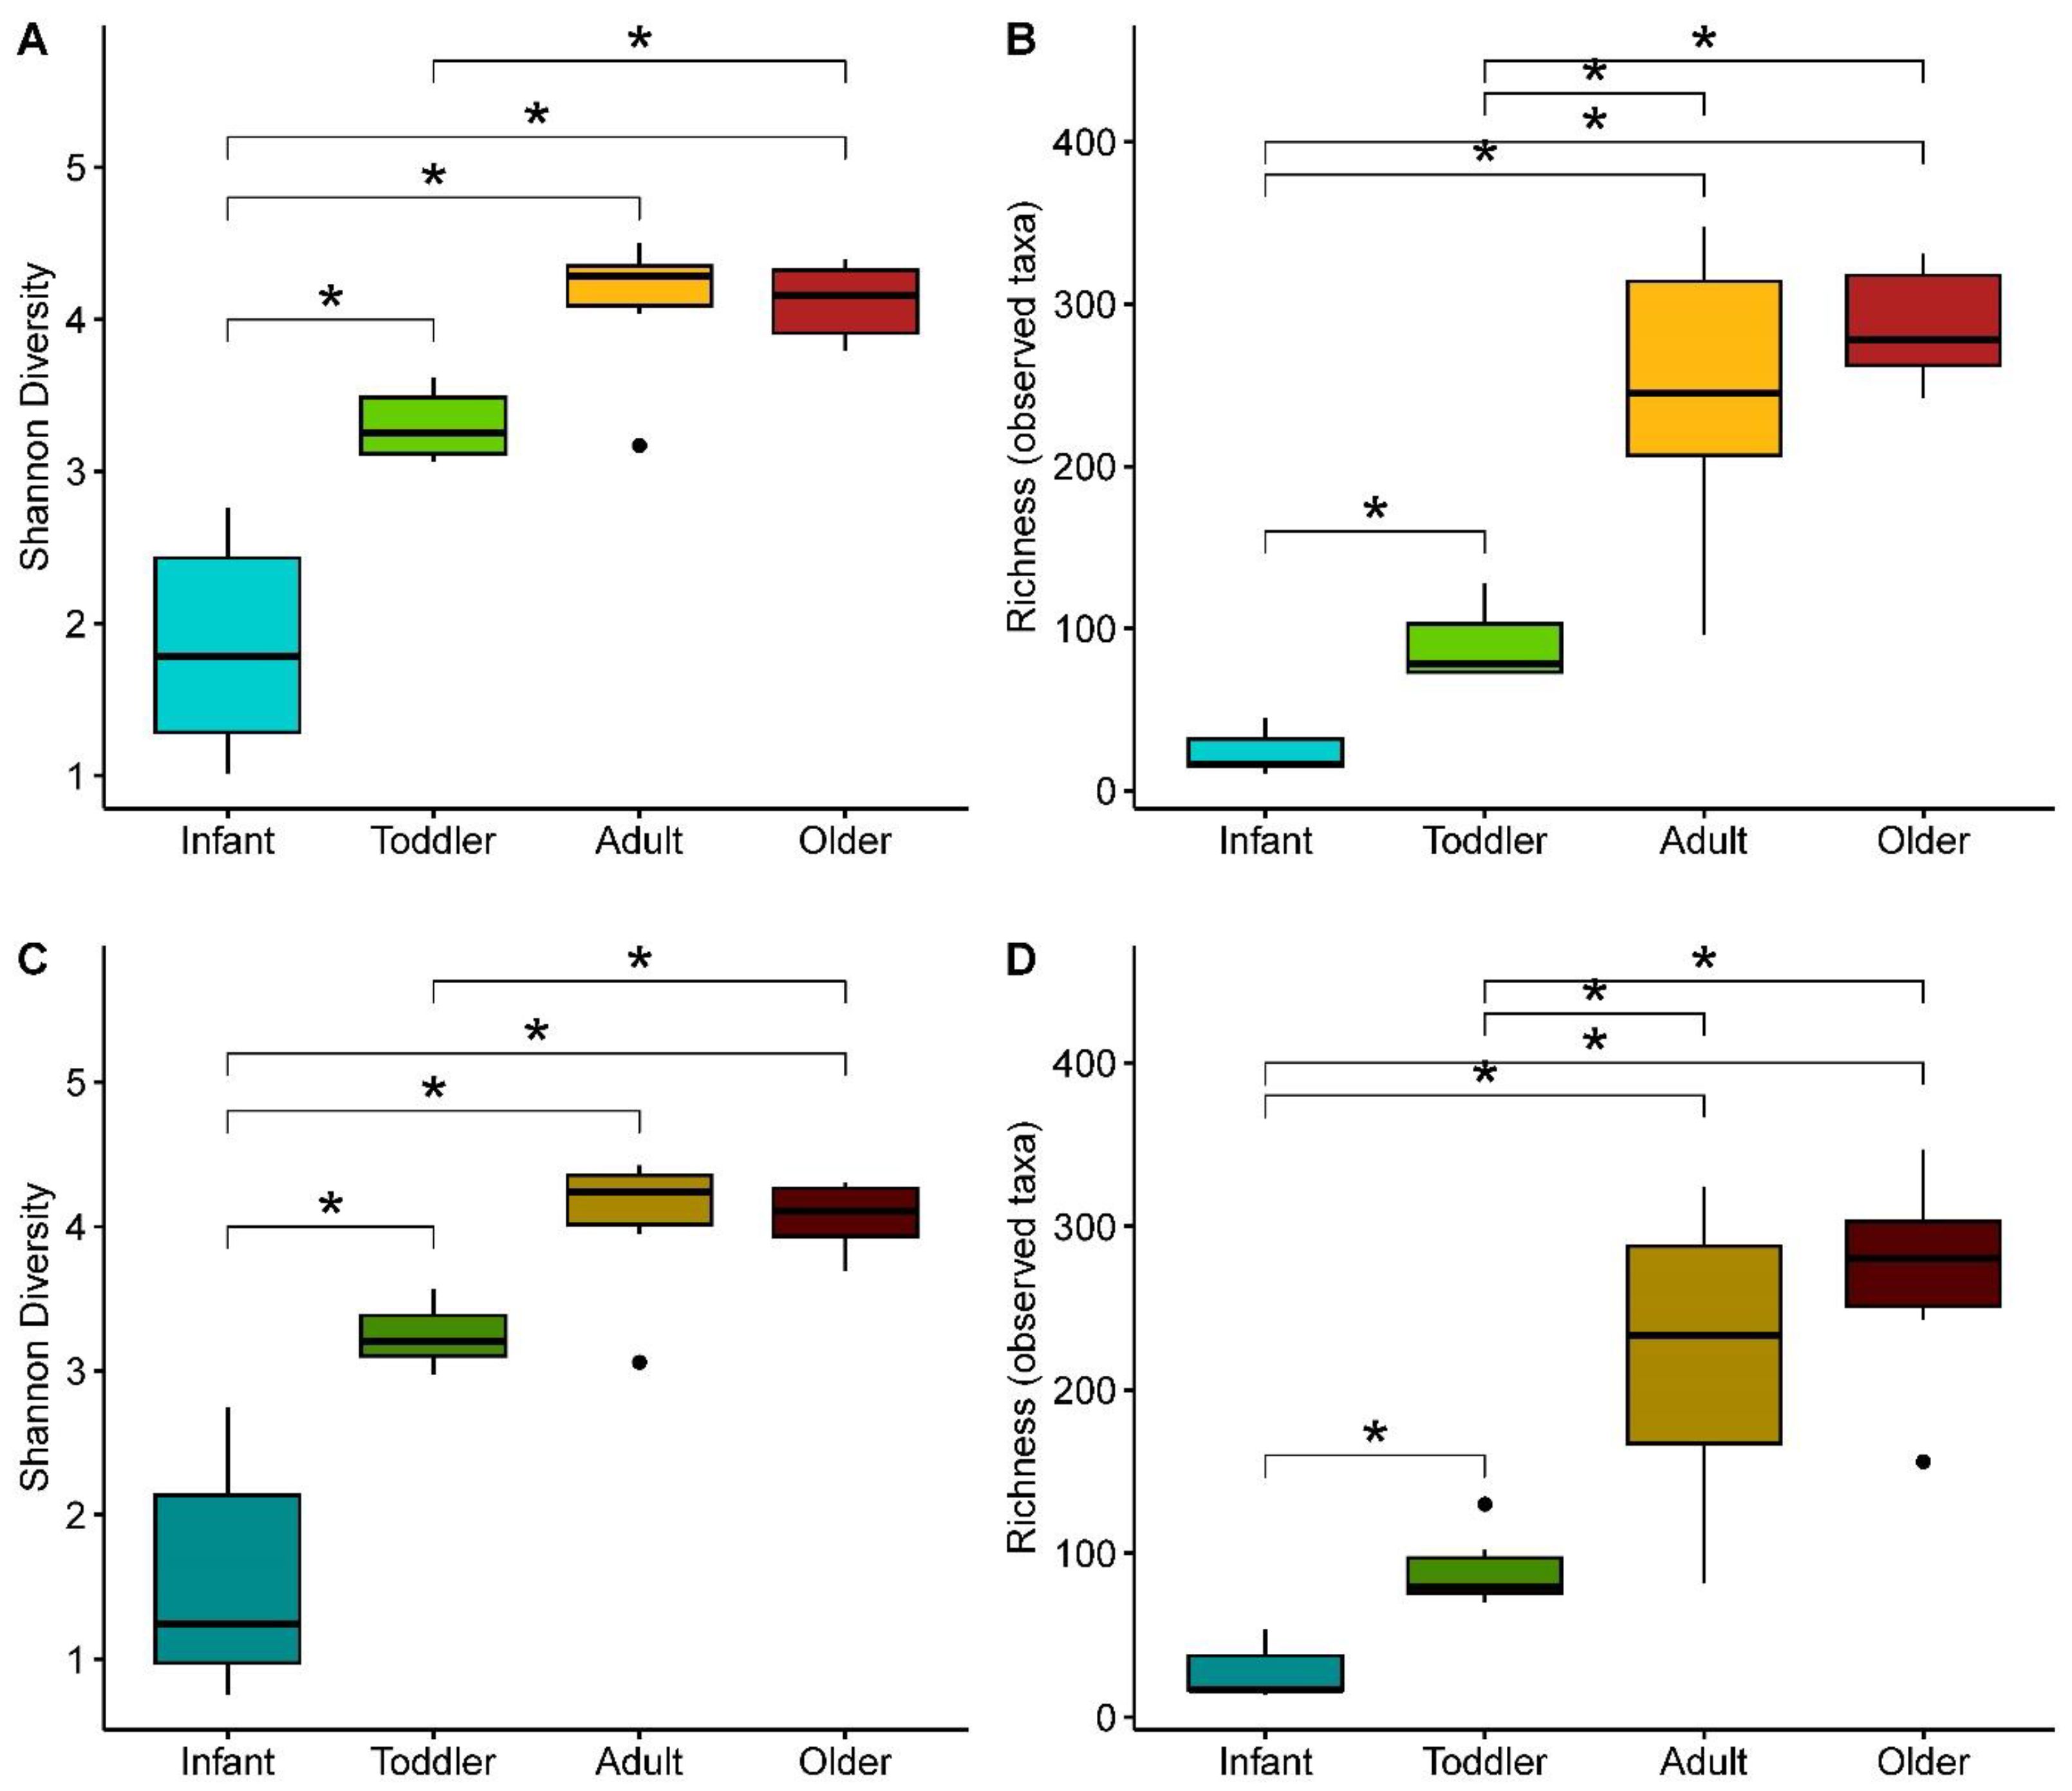
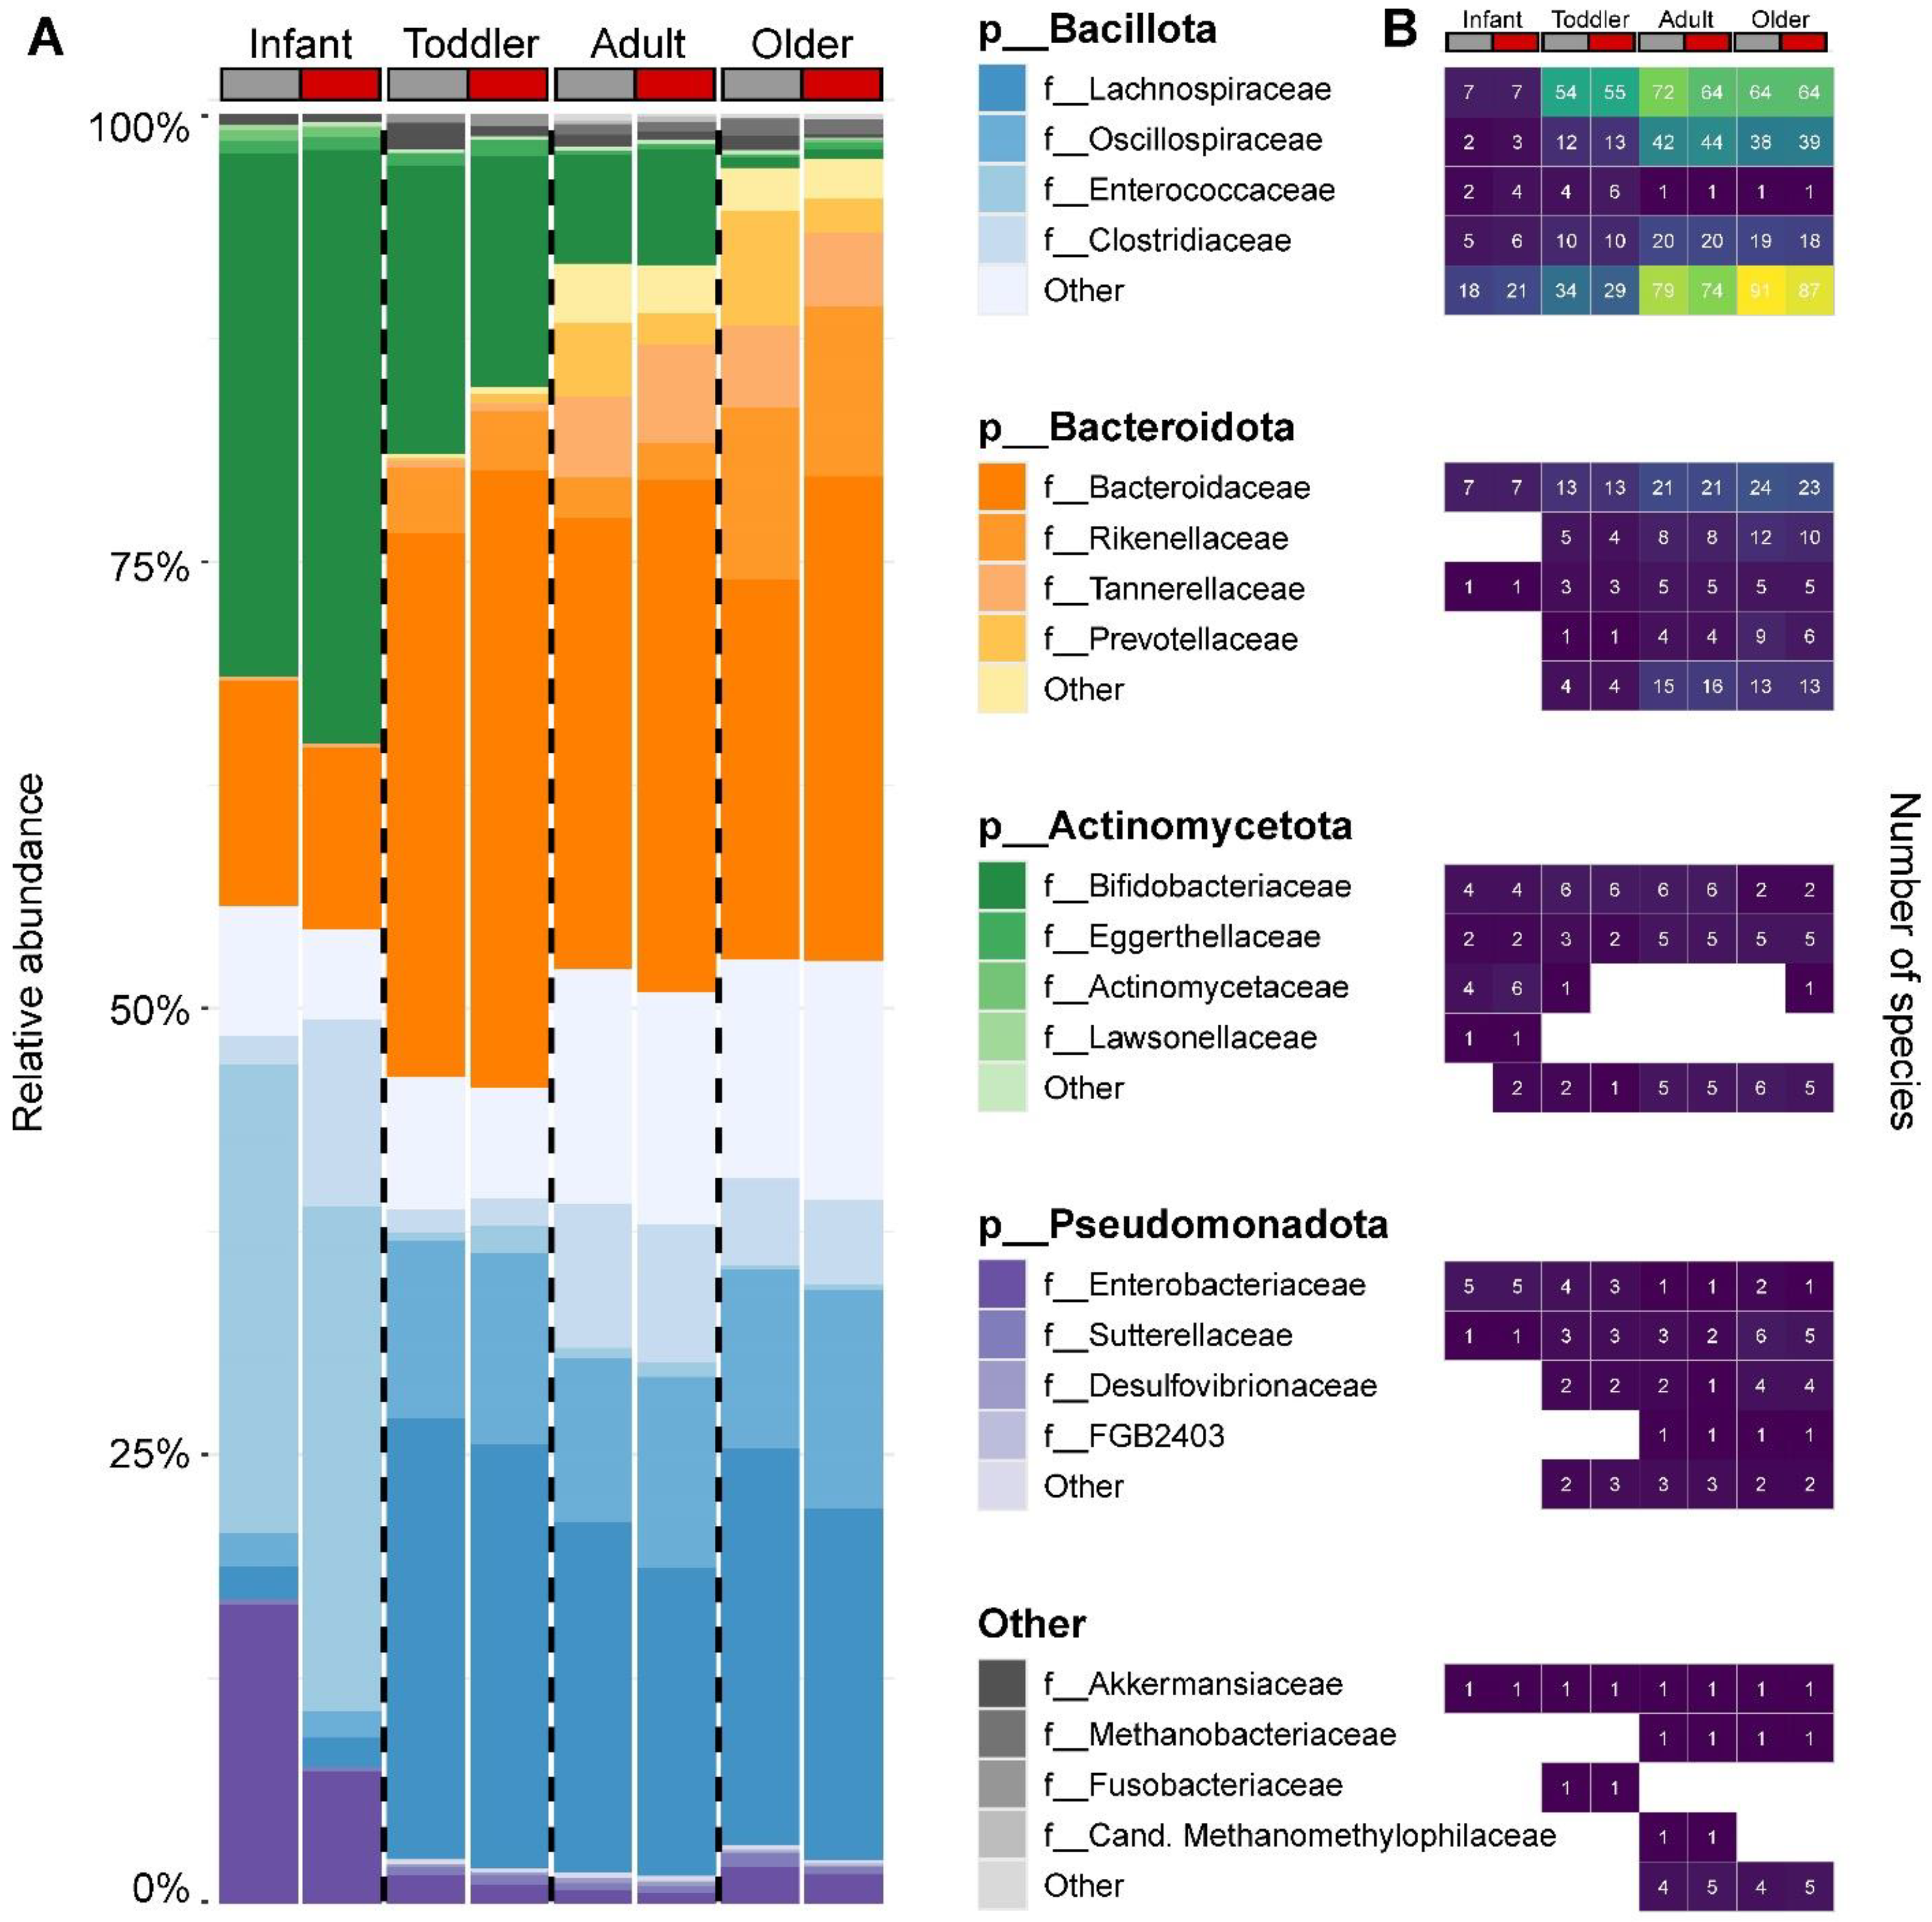
3.2. Effect of SSP Treatment on the Composition and Structure of Gut Microbial Communities

The bacterial communities treated with SSP had a significant decrease in cell number across all age groups, as measured by flow cytometry. As shown in Figure 2, the bacterial survival rate varied by age group, with the infant group being the most severely impacted. The treated samples had 32% fewer cells than the untreated controls in the infant group, whereas the adult group, the next group with the largest loss, only experienced a 14% drop in cell number. This result indicates that the infants’ gut microbial communities are indeed more susceptible to disruptions from SSP exposure, which may detrimentally impact the development of this delicate ecosystem [29,30,31].
Shotgun metagenomic sequencing combined with the flow cytometry data was used to examine the structure and composition of the microbial communities, considering the effects of treatment and age. Within-sample (alpha) diversity was evaluated using both the Shannon diversity index and taxon richness. For NSC communities, significant differences in the Shannon index and species richness were detected between the infant group and the other three age groups, as well as between the toddler and older adult groups (Figure 3A,B). The addition of the SSP did not alter this profile (Figure 3C,D, Supplemental Figure S2). These results show that the variation in alpha-diversity stems from age-related divergences in the structures and compositions of the microbial communities. Among-sample (beta) diversity was calculated using weighted UniFrac distances and displayed as a principal coordinate analysis (PCoA) in Figure 4. The infant group communities cluster separately from those within the other age groups as part of an overall age-defined progression, with the older adult group communities being the most distant from the infants. Significant differences by age group were tested using PERMANOVA, with all groups clustering significantly by age, with the exception of the two adult groups. No significant clustering was observed due to the SSP treatment for any of the age groups, agreeing with the alpha-diversity results, which indicated minimal effects of the SSP treatment at the community level.
The taxonomic distributions and abundance of the microbial communities of the four age groups were investigated. At the phylum level, Bacillota, Bacteroidota, Actinomycetota, and Pseudomonadota made up more than 98% of all sequences obtained from the four tested age groups (Figure 5A, Supplementary Figure S3). For the toddler, adult, and older adult age groups, Bacillota and Bacteroidota are the predominant phyla; their relative abundances were 44–50% and 34–45%, respectively. Treatment with SSP caused small, non-significant changes in the relative abundance of the four major phyla across those three age groups. For the infant communities, Bacillota (39%) and Actinomycetota (40%) were the major taxa, and their relative abundance values increased with the SSP treatment. The relative abundance values of Pseudomonadota and Bacteroidota only reached 17% and 13%, respectively, and the treatment caused a visible decrease in these values to 7.5% and 10%, respectively.
Figure 5B shows the top four families that comprise each phylum and the number of species identified in each of the groups. The treatment with SSP did not have a significant effect on the richness of the species in those families. Of these, some may play a role in SCFA production. Using read-based annotation of metagenomic sequencing reads, we identified taxa associated with SCFA-producing fermentation pathways. These included members of the Lachnospiraceae, Clostridiaceae, and Oscillospiraceae of phylum Bacillota, as well as Bacteroidaceae of phylum Bacteroidota, which were the most abundant in the adult and older adult groups, as compared to the two younger groups. Species of Bifidobacteriaceae and Enterobacteriaceae are more highly represented in the toddler and infant groups. The numbers of species related to the production of acetate, butyrate, and propionate were determined by the presence of MetaCyc pathways, as shown in Supplementary Figure S2A–C, which indicates that more of the species potentially involved in these functions are present in the adult and older adult groups than the toddler and infant groups. Among these, species of Lachnospiraceae, Clostridiaceae, and Oscillospiraceae were identified to contain acetate-related pathways; species of Oscillospiraceae and Eubacteriaceae contained butyrate metabolic pathways; and Bacteroidaceae, Lachnospiraceae, Enterobacteriaceae, and Tannerellaceae had more species potentially associated with propionate production than other families.
Three taxa as potential butyrate producers, Dorea formicigenerans, Faecalibacterium prausnitzii and Mediterraneibacter butyricigenes, were identified across this system (Figure 6). The most highly correlated with butyrate was Dorea formicigenerans (Spearman r = 0.9, q = 3.55 × 10⁻¹⁴), which was significantly increased in the older group after the SSP treatment. Another butyrate producer, Faecalibacterium prausnitzii, also significantly increased in abundance following the SSP treatment in the older adult and adult groups. Mediterraneibacter butyricigenes was lower in abundance following the SSP treatment but did correlate with butyrate production in the older group, though its abundance was variable across individual samples. While all three of these species are known butyrate producers, the exact contributions of these likely producers, as well as consumers, are not readily determined. These data, once again, show an age-dependent difference in the gut microbial community structure and its function.

3.3. Lactate Production and Conservation

Gut microbial metabolism produces lactate as an energy source and also converts lactate to SCFAs. Figure 7A shows the measured lactate amount, which is indicative of the sum of lactate production and consumption. For the NSC communities, the lactate amount in infants was higher than in the other age groups; for the communities treated with SSP, only the older adult group displays a statistically significant decrease in lactate measurement, even though the infants had higher levels of lactate-producing bacteria.
Taxa containing pathways associated with lactate production are shown in Figure 7B, where the major species come from Lachnospiraceae, Clostridiaceae, Bacteroidaceae, and Bifidobacterium. Treatment with SSP showed little or no effect on the richness of species from these genera. Some members of those families are lactate consumers that convert lactate to SCFA. As shown in Figure 7C, Clostridium butyricum, a lactate consumer and butyrate producer, was present only in the infant communities. Lactiplantibacillus plantarum is a lactate producer identified only in adult communities. Another lactate producer/consumer, Lacrimispora, was somewhat more abundant in the adult and older adult groups. Figure 8 shows another set of taxa associated with pathways of lactate conversion, as described previously [32]. The propanediol pathway leads to the conversion of lactate to acetate and 1,2-propanediol [33], the acrylate pathway produces propionate from lactate [34], and butyryl-CoA is the intermediate of butyrate from lactate conversion [35]. All those taxa are more concentrated in the adult and older adult groups; the next abundant group is the toddler group, regardless of SSP treatment.

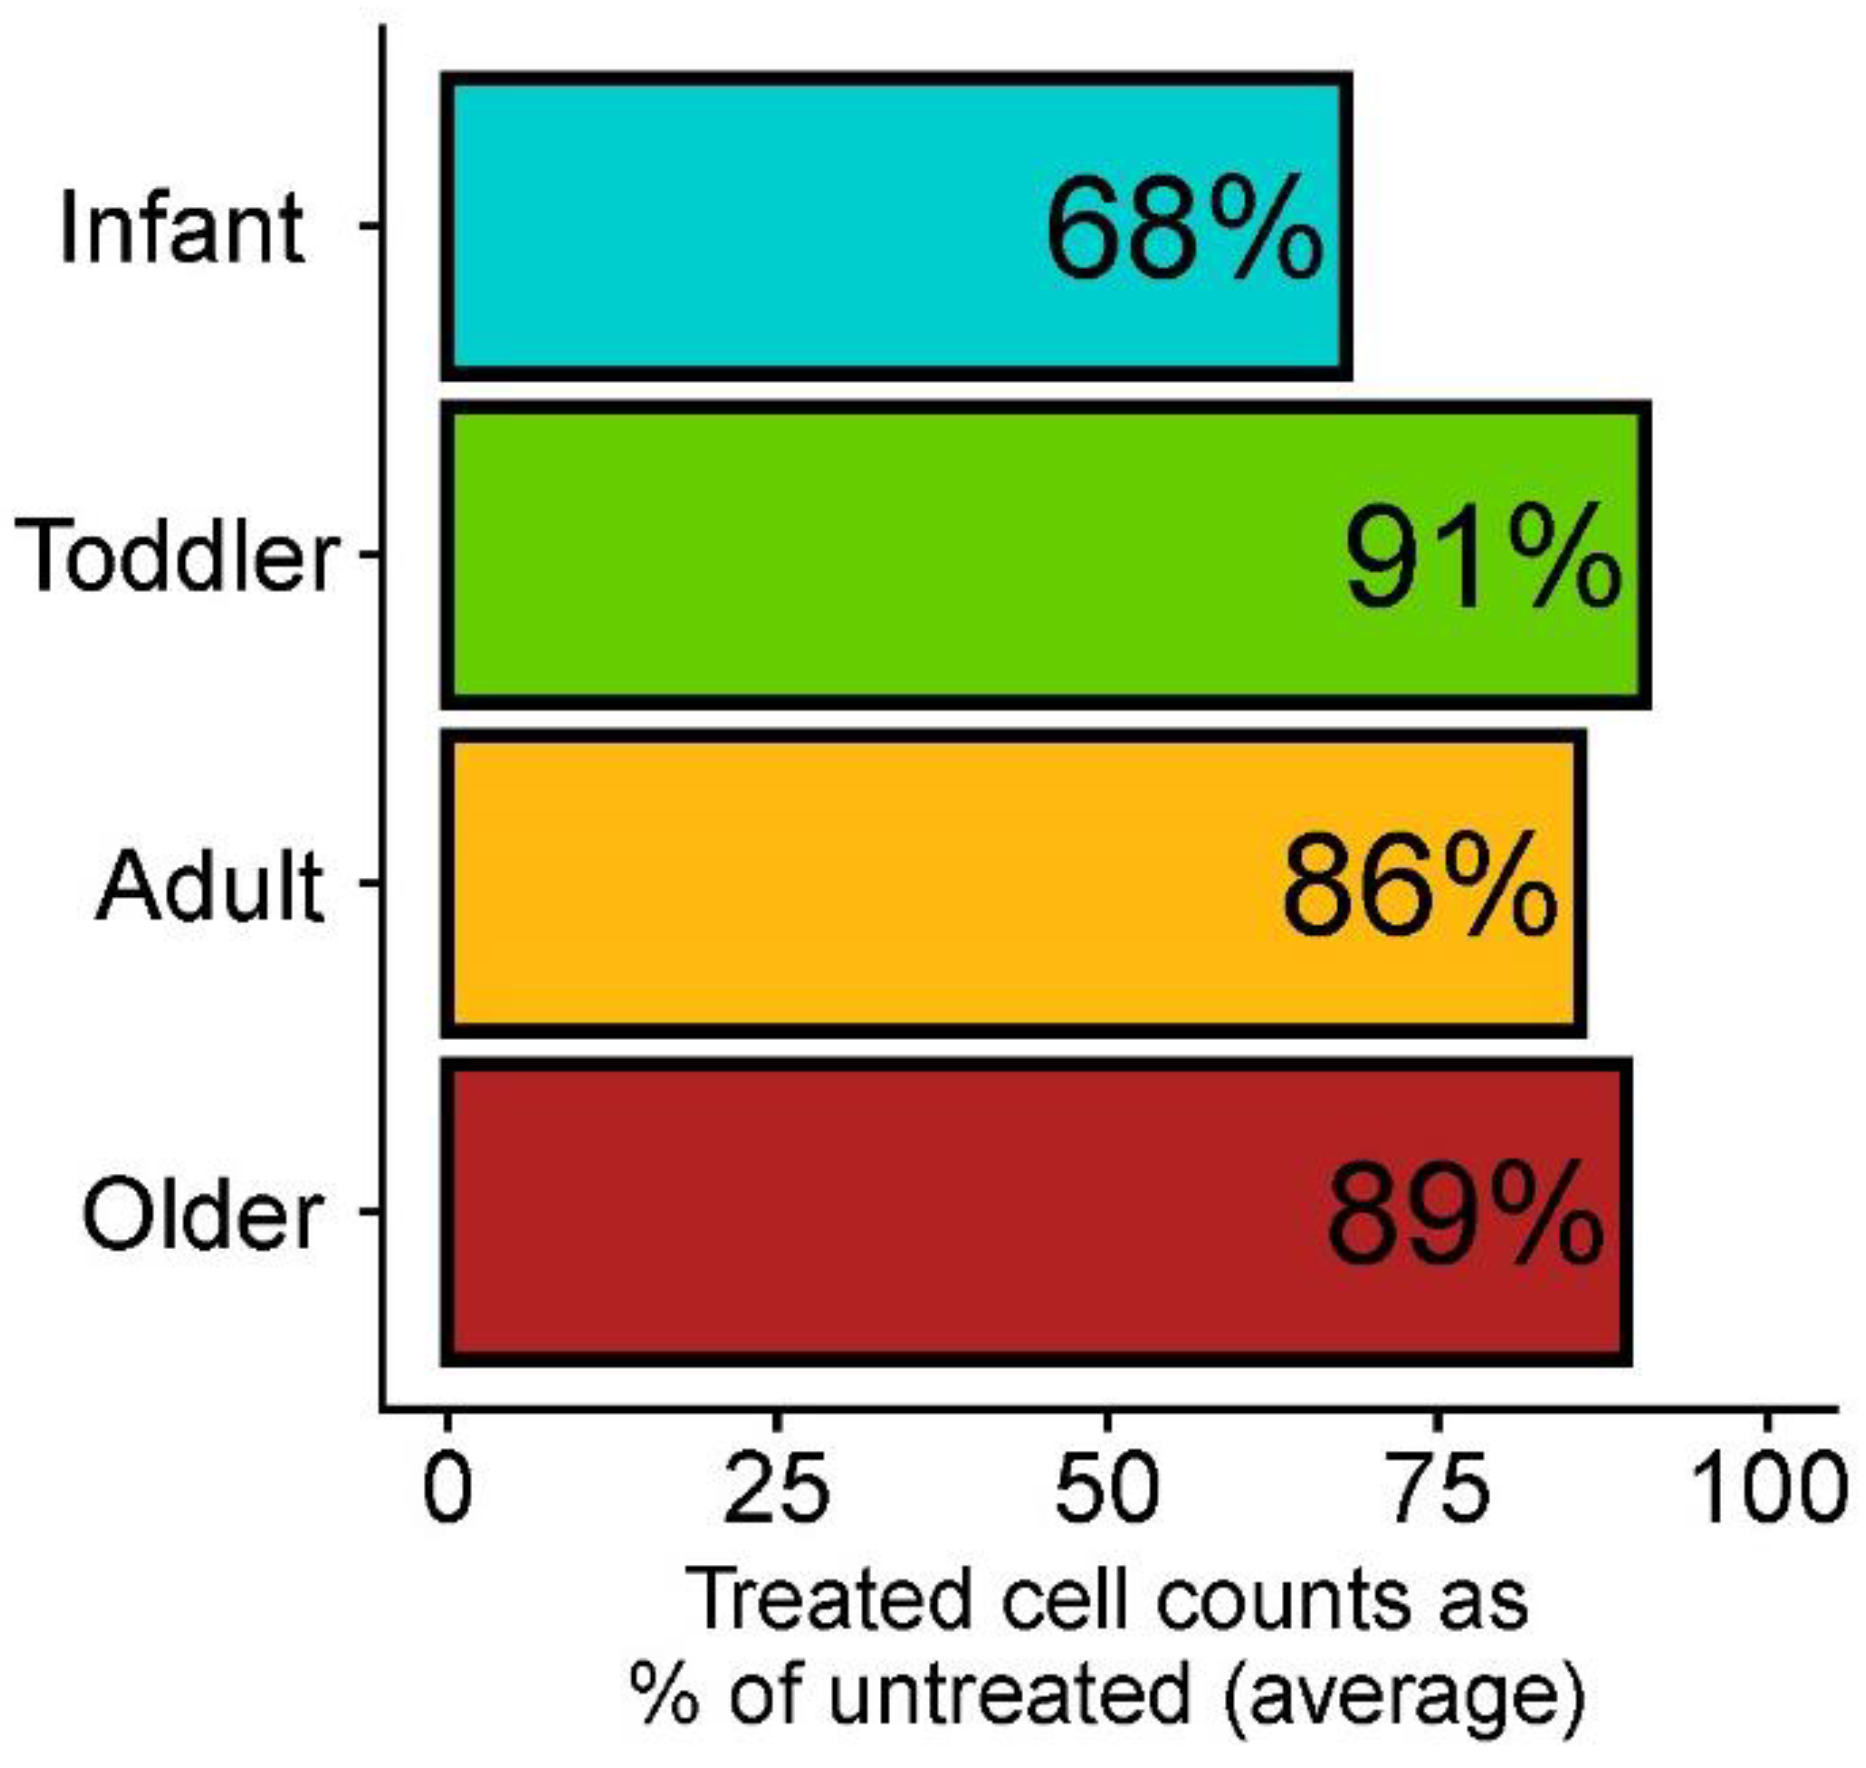
3.4. TEER Measurement

Colonoids from healthy human donors grown in monolayers were incubated with supernatants from NSC- or SSP-treated bacterial communities of toddlers and older adults. These were selected as the age groups with the highest lactate or butyrate changes, and thus were potentially the most impacted by SSP treatment. There was no difference in the TEER values between the two treatments, indicating that the SSP treatment did not impact the barrier function of the monolayer compared to the control (Figure 9).

4. Discussion

The gut microbial community undergoes substantial age-dependent changes throughout the lifespan in composition, diversity, and functionality, which impact its response to external stimuli, such as diet and chemicals [36,37,38]. The consumption of sulfur-containing diets and inorganic sulfur compounds, such as some antibiotics or food conservatives, impact GIT microbial metabolism [39,40,41,42]. As shown in the Section 3, the SSP treatment resulted in 32% fewer bacterial cells in the treated vs. the control samples in the infant group (Figure 2), and significant decrease in total SCFA production in the infant and older adult groups (Figure 1A). In contrast, the SSP treatment on total SCFA production in other age groups was negligible (Figure 1A). Considering the alpha- and beta-diversity analyses (Figure 3A–D, Figure 4, and as others have reported [36,43], the infant group was relatively simple in richness and potentially more susceptible to H2S (Figure 2). As age progresses, the gut bacterial community becomes richer in diversity, which may increase its resistance to environmental stimuli. The trend becomes reversed when people reach a certain age threshold, when they may also start to have a more fragile gut ecosystem [44,45], which subsequently impacts the response to food perturbation and digestion/fermentation activities, including SCFA production [46,47]. These results underscore the determining effect of age-driven differences in the composition and structure of the gut microbial community [40,48,49] and highlight how chemical or dietary perturbations and additives can differentially affect younger and older individuals via their microbiomes.
Given the importance of butyrate as an energy resource in the GIT and human health [50], we looked for taxa which correlated with butyrate measurements to potentially explain the increased amounts of butyrate measured in the older adult samples associated with the SSP treatment. As previously reported [51,52,53], D. formicigenerans not only produced butyrate, but also played a role in modulating the gut microbiota. F. prausnitzii was a prominent butyrate-producing bacterium in the human gut, playing a crucial role in maintaining gut health and having anti-inflammatory properties, as gut inflammation is a symptom often associated with older adults [54,55], once again demonstrating the age-dependent characteristics. Both taxa were highly represented in the older adult group (Figure 6A,B), where they increased in abundance in the SSP-treated samples relative to the untreated ones; however, this treatment effect varied both by age and species.
In addition to the direct production of butyrate as a fermentation end-product, butyrate can be produced via interconversion reactions from other SCFAs and lactate. Lactate molecules can serve as both energy and carbon sources in the gut microbial ecosystem [32,56]. Lactate can also act as a multifunctional signaling molecule and is involved in many SCFA production pathways [57,58,59], which include redox processes that rely on the transfer of electrons between molecules [60]. This multistep process is carried out under anaerobic conditions such as in the GIT, either in the cytoplasm or cytoplasm-associated membranes of bacterial cells. Lactate is first oxidized to pyruvate, then to acetyl-CoA, and then to acetate; alternatively, two acetyl-CoA can form an acetoacetyl-CoA molecule, with both key intermediates of a lactate conversion pathway leading to butyrate production [61]. From an electro-chemical perspective, acetate possesses a more powerful electron withdrawing group than butyrate, therefore it is possible that acetate would be more capable of balancing electron transfer in a reduction environment. In the dynamic gut microbial ecosystem, lactate conversion is not an isolated process; it occurs simultaneously with many others, such as assimilation of dietary sulfur or the reduction of sulfur-containing compounds. The electron transfer during these redox processes could also influence lactate conversion. If the electron sink created, for example, by a sulfate-reduction process is effective enough, it will pull the electrons to efficiently lower the electron potential; as such, it will inhibit butyrate production by directing electron transport to another direction, while more efficiently supporting energy production and respiration. These processes are usually carried out by different bacteria [35,62,63], and require electron transfer across the bacterial membrane [64,65]. Alternatively, the coupling of two redox processes could be implemented by different enzymes within a single bacterial vehicle such as certain sulfate-reduction bacteria, including Desulfomicrobium and Desulfovibrio species [66,67,68]. In this case, the oxidation of lactate and the reduction of sulfate are coupled and occur concurrently in the bacterial cytoplasm. It is worthwhile pointing out that sulfate-reducing bacteria use sulfate as a terminal electron acceptor in their metabolic pathway, which results in H2S as a byproduct. The resultant H2S does not directly play a role in electron transfer in anaerobic respiration. However, it may impact lactate production and consumption by inhibiting lactic acid-producing bacteria or competing with the lactate-utilizing and sulfate-reducing bacteria [20,69].
Similarly, in the present experiment, H2S generated by SSP’s dissolution does not participate in a redox reaction process. Here, the presence of excess H2S may alter the redox environment of the gut lumen, with potential impacts on processes such as butyrate or lactate production within the varied taxa in the gut microbiome. As described above, all taxa containing various pathways varied, with age-dependent response to the SSP treatment (Figure 8). Taxa associated with certain lactate conversion pathways were present in most samples but were notably absent from the infant samples, a lack that may contribute to the higher lactate amount measured in the infant group compared to the other groups (Figure 7A). SSP appears to affect lactate producers/consumers across all age groups. As for butyrate production, this suggests that the effects of SSP treatment may have increased the growth or activity of butyrate-producing taxa at the expense of taxa producing other SCFAs, or it may have shifted the metabolic activity within taxa capable of producing multiple SCFAs.
Finally, we investigated the effects of bacteria-free supernatants from the fecal incubations on colonoid cells in vitro. The question here was if alterations to microbial metabolism as a result of SSP addition could generate metabolites that may impact the intestinal epithelium. The intestinal epithelium interacts with the gut microbiota and serves as a barrier, preventing harmful substances from entering the body, while also regulating nutrient absorption [70,71]. H2S has been demonstrated to have a protective effect on intestinal epithelial barrier function in both in vivo and in vitro studies [14,72]. Given this, we wanted to know whether the addition of SSP in our experiment would also have an effect on the barrier function of colon cells grown in vitro. As shown in Figure 9, there was no difference in the TEER values between the two treatments, indicating that the SSP treatment at the present dose did not impact the barrier function of the monolayer compared to the control. From this data, we can conclude that the dose of SSP used in this study did not alter the microbial community of the toddler or older adult groups in a way that positively or negatively impacted barrier function.

5. Conclusions

This experiment showed that hydrogen sulfide influences gut microbial community in an age-dependent manner. The infant group and the older adult group were more sensitive to the SSP treatment. The older adult group exhibited higher butyrate production in response to SSP, perhaps due to the specific microbial structure of the fecal samples used in this research. Considering that an elevated butyrate level helps improve memory and cognitive functions and prevents Alzheimer’s diseases, the link between SSP, butyrate, older adults is of interest and worth further research in expanded size and design [73,74,75].

Supplementary Materials

The following supporting information can be downloaded at https://www.mdpi.com/article/10.3390/sci7030102/s1. Figure S1: Levels of SCFAs and gas production. Figure S2: Shannon diversity and richness by treatment. Figure S3: Per-sample relative abundances with the 4 most abundant families in each phylum colored separately. The left panel shows all NSC samples, while the right panel shows all SSP samples. Figure S4: Counts of species inferred to contain MetaCyc pathways associated with acetate, butyrate, and propanoate metabolism, as inferred by HUMAnN.

Author Contributions

L.L. initiated the experiment; L.L. and P.V.d.A. conceptualized and designed the experiment; J.M.S.L., J.F., L.L., and A.M.M. developed the methodologies; A.B., S.D., V.J.C., J.M.S.L., and S.H. performed the lab analyses. A.B.N. performed the bioinformatics analysis; L.L., A.B.N., J.M.S.L., J.F., and K.K.M. analyzed and/or interpreted the data. A.B.N. visualized the data; L.L. and J.M.S.L. prepared the original draft; L.L., J.M.S.L., A.B.N., J.F., K.K.M., and A.M.M. revised the manuscript. All authors have read and agreed to the published version of the manuscript.

Funding

This work was supported by the USDA In-House Project 8072-41000-108-00-D, “In Vitro Human Intestinal Microbial Ecosystems: Effect of Diet”. This research used resources provided by the SCINet project and/or the AI Center of Excellence of the USDA Agricultural Research Service, ARS project numbers 0201-88888-003-000D and 0201-88888-002-000D.

Institutional Review Board Statement

Fecal sample collection was implemented according to the IRB protocol approved by the Ethics Committee of the University Hospital Ghent, Belgium (BC-09977).

Informed Consent Statement

Not applicable.

Data Availability Statement

Metagenomic sequencing data are available in the NCBI Sequence Read Archive associated with BioProject PRJNA1160256.

Acknowledgments

The authors thank Tasnuva Shahrin for assistance with formatting the manuscript.

Conflicts of Interest

Authors S.D., A.B., and P.V.d.A. are employees of Cryptobiotix SA. The remaining authors declare that the research was conducted in the absence of any influence from the company that may or may not be construed as a potential conflict of interest. Mention of trade names or commercial products in this publication is solely for the purpose of providing specific information and does not imply recommendation or endorsement by the U.S. Department of Agriculture. USDA is an equal opportunity provider and employer.

Abbreviations

The following abbreviations are used in this manuscript:
SSPSodium sulfide preparation
GITGastrointestinal tract
SCFAShort-chain fatty acid
NSCNo-substrate control

References

  1. Fakhraee, M.; Crockford, P.W.; Bauer, K.W.; Pasquier, V.; Sugiyama, I.; Katsev, S.; Raven, M.R.; Gomes, M.; Philippot, P.; Crowe, S.A.; et al. The history of Earth’s sulfur cycle. Nat. Rev. Earth Environ. 2025, 6, 106–125. [Google Scholar] [CrossRef]
  2. Gupta, S.; Plugge, C.M.; Muyzer, G.; Sánchez-Andrea, I. Harnessing the potential of the microbial sulfur cycle for environmental biotechnology. Curr. Opin. Biotechnol. 2024, 88, 103164. [Google Scholar] [CrossRef]
  3. Buret, A.G.; Allain, T.; Motta, J.-P.; Wallace, J.L. Effects of Hydrogen Sulfide on the Microbiome: From Toxicity to Therapy. Antioxid Redox Signal 2022, 36, 211–219. [Google Scholar] [CrossRef]
  4. Moon, J.-Y.; Kye, B.-H.; Ko, S.-H.; Yoo, R.N. Sulfur Metabolism of the Gut Microbiome and Colorectal Cancer: The Threat to the Younger Generation. Nutrients 2023, 15, 1966. [Google Scholar] [CrossRef] [PubMed]
  5. Singh, S.B.; Lin, H.C. Hydrogen Sulfide in Physiology and Diseases of the Digestive Tract. Microorganisms 2015, 3, 866–889. [Google Scholar] [CrossRef]
  6. Piragine, E.; Malanima, M.A.; Lucenteforte, E.; Martelli, A.; Calderone, V. Circulating Levels of Hydrogen Sulfide (H2S) in Patients with Age-Related Diseases: A Systematic Review and Meta-Analysis. Biomolecules 2023, 13, 1023. [Google Scholar] [CrossRef] [PubMed]
  7. Public Health Statement: Toxicological Profile for Hydrogen Sulfide. Agency for Toxic Substances and Disease Registry. December 2016. Available online: https://www.atsdr.cdc.gov/ToxProfiles/tp114-c1-b.pdf (accessed on 15 April 2025).
  8. Chou, C.-H.S.J. Hydrogen Sulfide: Human Health Aspects; Agency for Toxic Substances and Disease Registry; World Health Organization & International Programme on Chemical Safety; World Health Organization: Geneva, Switzerland, 2003. Available online: https://digitallibrary.un.org/record/505398?v=pdf (accessed on 15 April 2025).
  9. Tomasova, L.; Konopelski, P.; Ufnal, M. Gut Bacteria and Hydrogen Sulfide: The New Old Players in Circulatory System Homeostasis. Molecules 2016, 21, 1558. [Google Scholar] [CrossRef]
  10. Tomasova, L.; Grman, M.; Ondrias, K.; Ufnal, M. The impact of gut microbiota metabolites on cellular bioenergetics and cardiometabolic health. Nutr. Metab. 2021, 18, 72. [Google Scholar] [CrossRef] [PubMed]
  11. Pokorná, L.; Bartacek, J.; Díaz, I.; Jeison, D.; Volcke, E.I.P.; Jenicek, P. Microaeration for hydrogen sulfide removal during anaerobic treatment: A review. Rev. Environ. Sci. Biotech. 2015, 14, 703–725. [Google Scholar] [CrossRef]
  12. Quist, A.J.L.; Johnston, J.E. Malodors as environmental injustice: Health symptoms in the aftermath of a hydrogen sulfide emergency in Carson, California, USA. J. Expo. Sci. Environ. Epidemiol. 2024, 34, 935–940. [Google Scholar] [CrossRef]
  13. Munteanu, C.; Onose, G.; Poștaru, M.; Turnea, M.; Rotariu, M.; Galaction, A.I. Hydrogen Sulfide and Gut Microbiota: Their Synergistic Role in Modulating Sirtuin Activity and Potential Therapeutic Implications for Neurodegenerative Diseases. Pharmaceuticals 2024, 17, 1480. [Google Scholar] [CrossRef]
  14. Munteanu, C.; Onose, G.; Rotariu, M.; Poștaru, M.; Turnea, M.; Galaction, A.I. Role of Microbiota-Derived Hydrogen Sulfide (H2S) in Modulating the Gut–Brain Axis: Implications for Alzheimer’s and Parkinson’s Disease Pathogenesis. Biomedicines 2024, 12, 2670. [Google Scholar] [CrossRef]
  15. Powell, C.R.; Dillon, K.M.; Matson, J.B. A review of hydrogen sulfide (H2S) donors: Chemistry and potential therapeutic applications. Biochem. Pharmacol. 2018, 149, 110–123. [Google Scholar] [CrossRef]
  16. Teigen, L.M.; Kaiser-Powers, T.; Matson, M.; Elkin, B.; Kabage, A.J.; Hamilton, M.; Vaughn, B.P.; Sadowsky, M.J.; Staley, C.; Khoruts, A. Contribution of Common Sulfur-Containing Substrates to Hydrogen Sulfide Production by Human Gut Microbiota Using an In Vitro Model Standardized for Bacterial Counts. Gut Microbes Rep. 2024, 1, 2361246. [Google Scholar] [CrossRef]
  17. Hayes, J.A.; Lunger, A.W.; Sharma, A.S.; Fernez, M.T.; Carrier, R.L.; Koppes, A.N.; Koppes, R.; Woolston, B.M. Engineered bacteria titrate hydrogen sulfide and induce concentration-dependent effects on the host in a gut microphysiological system. Cell Rep. 2023, 42, 113481. [Google Scholar] [CrossRef]
  18. Liu, J.; Zhao, W.; Gao, Z.W.; Liu, N.; Zhang, W.H.; Ling, H. Effects of Exogenous Hydrogen Sulfide on Diabetic Metabolic Disorders in db/db Mice are Associated with Gut Bacterial and Fungal Microbiota. Front. Cell. Infect. Microbiol. 2022, 12, 801331. [Google Scholar] [CrossRef]
  19. Lemons, J.M.S.; Narrowe, A.B.; Firrman, J.; Mahalak, K.K.; Liu, L.S.; Higgins, S.; Moustafa, A.M.; Baudot, A.; Deyaert, S.; Van den Abbeele, P. The food additive butylated hydroxyanisole minimally affects the human gut microbiome ex vivo. Food Chem. 2025, 473, 143037. [Google Scholar] [CrossRef]
  20. Dordević, D.; Jančíková, S.; Vítežová, M.; Kushkevych, I. Hydrogen sulfide toxicity in the gut environment: Meta-analysis of sulfate-reducing and lactic acid bacteria in inflammatory processes. J. Adv. Res. 2021, 27, 55–69. [Google Scholar] [CrossRef]
  21. Van den Abbeele, P.; Deyaert, S.; Thabuis, C.; Perreau, C.; Bajic, D.; Wintergerst, E.; Joossens, M.; Firrman, J.; Walsh, D.; Baudot, A. Bridging preclinical and clinical gut microbiota research using the ex vivo SIFR((R)) technology. Front. Microbiol. 2023, 14, 1131662. [Google Scholar] [CrossRef]
  22. Blanco-Míguez, A.; Beghini, F.; Cumbo, F.; McIver, L.J.; Thompson, K.N.; Zolfo, M.; Manghi, P.; Dubois, L.; Huang, K.D.; Thomas, A.M.; et al. Extending and improving metagenomic taxonomic profiling with uncharacterized species using MetaPhlAn 4. Nat. Biotechnol. 2023, 41, 1633–1644. [Google Scholar] [CrossRef]
  23. Beghini, F.; McIver, L.J.; Blanco-Míguez, A.; Dubois, L.; Asnicar, F.; Maharjan, S.; Mailyan, A.; Manghi, P.; Scholz, M.; Thomas, A.M.; et al. Integrating taxonomic, functional, and strain-level profiling of diverse microbial communities with bioBakery 3. eLife 2021, 10, e65088. [Google Scholar] [CrossRef] [PubMed]
  24. Martinez Arbizu, P. pairwiseAdonis: Pairwise Multilevel Comparison Using Adonis, R package version 0.4. 2020.
  25. Mallick, H.; Rahnavard, A.; McIver, L.J.; Ma, S.; Zhang, Y.; Nguyen, L.H.; Tickle, T.L.; Weingart, G.; Ren, B.; Schwager, E.H.; et al. Multivariable association discovery in population-scale meta-omics studies. PLoS Comput. Biol. 2021, 17, e1009442. [Google Scholar] [CrossRef]
  26. Wickham, H.; Averick, M.; Bryan, J.; Chang, W.; McGowan, L.; François, R.; Grolemund, G.; Hayes, A.; Henry, L.; Hester, J.; et al. Welcome to the Tidyverse. J. Open Source Softw. 2019, 4, 1686. [Google Scholar] [CrossRef]
  27. Oksanen, J.; Simpson, G.; Blanchet, F.; Kindt, R.; Legendre, P.; Minchin, P.; O’Hara, R.; Solymos, P.; Stevens, M.; Szoecs, E.; et al. vegan: Community Ecology Package, R package version 2.8-0. 2025.
  28. Paradis, E.; Schliep, K. ape 5.0: An environment for modern phylogenetics and evolutionary analyses in R. Bioinformatics 2019, 35, 526–528. [Google Scholar] [CrossRef]
  29. Barker-Tejeda, T.C.; Zubeldia-Varela, E.; Macías-Camero, A.; Alonso, L.; Martín-Antoniano, I.A.; Rey-Stolle, M.F.; Mera-Berriatua, L.; Bazire, R.; Cabrera-Freitag, P.; Shanmuganathan, M.; et al. Comparative characterization of the infant gut microbiome and their maternal lineage by a multi-omics approach. Nat. Commun. 2024, 15, 3004. [Google Scholar] [CrossRef] [PubMed]
  30. Yang, I.; Corwin, E.J.; Brennan, P.A.; Jordan, S.; Murphy, J.R.; Dunlop, A. The Infant Microbiome: Implications for Infant Health and Neurocognitive Development. Nurs. Res. 2016, 65, 76–88. [Google Scholar] [CrossRef] [PubMed]
  31. Yao, Y.; Cai, X.; Ye, Y.; Wang, F.; Chen, F.; Zheng, C. The Role of Microbiota in Infant Health: From Early Life to Adulthood. Front. Immunol. 2021, 12, 708472. [Google Scholar] [CrossRef]
  32. Louis, P.; Duncan, S.H.; Sheridan, P.O.; Walker, A.W.; Flint, H.J. Microbial lactate utilisation and the stability of the gut microbiome. Gut Microbiome 2022, 3, e3. [Google Scholar] [CrossRef]
  33. Elferink, S.; Krooneman, J.; Gottschal, J.C.; Spoestra, S.F.; Faber, F.; Driehuis, F. Anaerobic Conversion of Lactic Acid to Acetic Acid and 1,2-Propanediol by Lactobacillus buchneri. Appl. Environ. Microbiol. 2001, 67, 125–132. [Google Scholar] [CrossRef]
  34. Prabhu, R.; Altman, E.; Eiteman, M.A. Lactate and Acrylate Metabolism by Megasphaera elsdenii under Batch and Steady-State Conditions. Appl. Environ. Microbiol. 2012, 78, 8564–8570. [Google Scholar] [CrossRef]
  35. Detman, A.; Mielecki, D.; Chojnacka, A.; Salamon, A.; Blaszczyk, M.K.; Sikora, A. Cell factories converting lactate and acetate to butyrate: Clostridium butyricum and microbial communities from dark fermentation bioreactors. Microb. Cell Fact. 2019, 18, 36. [Google Scholar] [CrossRef] [PubMed]
  36. Odamaki, T.; Kato, K.; Sugahara, H.; Hashikura, N.; Takahashi, S.; Xiao, J.-Z.; Abe, F.; Osawa, R. Age-related changes in gut microbiota composition from newborn to centenarian: A cross-sectional study. BMC Microbiol. 2016, 16, 90. [Google Scholar] [CrossRef]
  37. Sjögren, Y.M.; Tomicic, S.; Lundberg, A.; Fagerås-Böttcher, M.; Björkstén, B.; Sverremark-Ekström, E.; Jenmalm, M. Influence of early gut microbiota on the maturation of childhood mucosal and systemic immune responses. Clin. Exp. Allergy 2009, 39, 1842–1851. [Google Scholar] [CrossRef] [PubMed]
  38. Bosco, N.; Noti, M. The aging gut microbiome and its impact on host immunity. Genes Immun. 2021, 22, 289–303. [Google Scholar] [CrossRef]
  39. Teigen, L.M.; Geng, Z.; Sadowsky, M.J.; Vaughn, B.P.; Hamilton, M.J.; Khoruts, A. Dietary Factors in Sulfur Metabolism and Pathogenesis of Ulcerative Colitis. Nutrients 2019, 11, 931. [Google Scholar] [CrossRef]
  40. Macfarlane, S.; Macfarlane, G.T. Regulation of short-chain fatty acid production. Proc. Nutr. Soc. 2003, 62, 67–72. [Google Scholar] [CrossRef]
  41. Tannock, G.W.; Liu, Y. Guided dietary fibre intake as a means of directing short-chain fatty acid production by the gut microbiota. J. R. Soc. N. Z. 2020, 50, 434–455. [Google Scholar] [CrossRef]
  42. Carbonero, F.; Benefiel, A.C.; Alizadeh-Ghamsari, A.H.; Gaskins, H.R. Microbial pathways in colonic sulfur metabolism and links with health and disease. Front. Physiol. 2012, 3, 448. [Google Scholar] [CrossRef]
  43. Zhanbo, Q.; Jing, Z.; Shugao, H.; Yinhang, W.; Jian, C.; Xiang, Y.; Feimin, Z.; Jian, L.; Xinyue, W.; Wei, W.; et al. Age and aging process alter the gut microbes. Aging 2024, 16, 8. [Google Scholar] [CrossRef]
  44. Clemente, J.C.; Ursell, L.K.; Parfrey, L.W.; Knight, R. The impact of the gut microbiota on human health: An integrative view. Cell 2012, 148, 1258–1270. [Google Scholar] [CrossRef]
  45. Claesson, M.J.; Jeffery, I.B.; Conde, S.; Power, S.E.; O’Connor, E.M.; Cusack, S.; Harris, H.M.B.; Coakley, M.; Lakshminarayanan, B.; O’Sullivan, O.; et al. Gut microbiota composition correlates with diet and health in the elderly. Nature 2012, 488, 178–184. [Google Scholar] [CrossRef]
  46. Mariat, D.; Firmesse, O.; Levenez, F.; Guimarăes, V.D.; Sokol, H.; Doré, J.; Corthier, G.; Furet, J.P. The Firmicutes/Bacteroidetes ratio of the human microbiota changes with age. BMC Microbiol. 2009, 9, 123. [Google Scholar] [CrossRef]
  47. O’Toole, P.W.; Jeffery, I.B. Gut microbiota and aging. Science 2015, 350, 1214–1215. [Google Scholar] [CrossRef]
  48. Mutuyemungu, E.; Singh, M.; Liu, S.; Rose, D.J. Intestinal gas production by the gut microbiota: A review. J. Funct. Foods 2023, 100, 105367. [Google Scholar] [CrossRef]
  49. Pi, X.; Yu, Z.; Yang, X.; Du, Z.; Liu, W. Effects of Zymosan on Short-Chain Fatty Acid and Gas Production in in vitro Fermentation Models of the Human Intestinal Microbiota. Front. Nutr. 2022, 9, 921137. [Google Scholar] [CrossRef]
  50. Hodgkinson, K.; Abbar, F.A.; Dobranowski, P.; Manoogian, J.; Butcher, J.; Figeys, D.; Mack, D.; Stintzi, A. Butyrate’s role in human health and the current progress towards its clinical application to treat gastrointestinal disease. Clin. Nutr. 2023, 42, 61–75. [Google Scholar] [CrossRef]
  51. Machiels, K.; Joossens, M.; Sabino, J.; Preter, V.D.; Arijs, I.; Eeckhaut, V.; Ballet, V.; Claes, K.; Immerseel, F.V.; Verbeke, K.; et al. A decrease of the butyrate-producing species Roseburia hominis and Faecalibacterium prausnitzii defines dysbiosis in patients with ulcerative colitis. Gut 2014, 63, 1275–1283. [Google Scholar] [CrossRef]
  52. Louis, P.; Flint, H.J. Formation of propionate and butyrate by the human colonic microbiota. Environ. Microbiol. 2017, 19, 29–41. [Google Scholar] [CrossRef]
  53. Kim, J.S.; Lee, K.C.; Suh, M.K.; Han, K.I.; Eom, M.K.; Lee, J.H.; Park, S.H.; Kang, S.W.; Park, J.E.; Oh, B.S.; et al. Mediterraneibacter butyricigenes sp. nov., a butyrate-producing bacterium isolated from human faeces. J. Microbiol. 2019, 57, 38–44. [Google Scholar] [CrossRef]
  54. Vacca, M.; Celano, G.; Calabrese, F.M.; Portincasa, P.; Gobbetti, M.; Angelis, M.D. The Controversial Role of Human Gut Lachnospiraceae. Microorganisms 2020, 8, 573. [Google Scholar] [CrossRef]
  55. Lopez-Siles, M.; Duncan, S.H.; Garcia-Gil, L.J.; Martinez-Medina, M. Faecalibacterium prausnitzii: From microbiology to diagnostics and prognostics. ISME J. 2017, 11, 841–852. [Google Scholar] [CrossRef]
  56. Pessione, E. Lactic acid bacteria contribution to gut microbiota complexity: Lights and shadows. Front. Cell. Infect. Microbiol. 2012, 2, 86. [Google Scholar] [CrossRef]
  57. Iraporda, C.; Errea, A.; Romanin, D.E.; Cayet, D.; Pereyra, E.; Pignataro, O.; Sirard, J.C.; Garrote, G.L.; Abraham, A.G.; Rumbo, M. Lactate and short chain fatty acids produced by microbial fermentation downregulate proinflammatory responses in intestinal epithelial cells and myeloid cells. Immunobiology 2015, 220, 1161–1169. [Google Scholar] [CrossRef]
  58. Lee, T.Y. Lactate: A multifunctional signaling molecule. J. Yeungnam Med. Sci. 2021, 38, 183–193. [Google Scholar] [CrossRef]
  59. Zhang, D.; Jian, Y.P.; Zhang, Y.N.; Li, Y.; Gu, L.T.; Sun, H.H.; Liu, M.D.; Zhao, H.L.; Wang, Y.S.; Xu, Z.X. Short-chain fatty acids in diseases. Cell Commun. Signal 2023, 21, 212. [Google Scholar] [CrossRef]
  60. Esquivel-Elizondo, S.; Ilhan, Z.E.; Garcia-Peña, E.I.; Krajmalnik-Brown, R. Insights into Butyrate Production in a Controlled Fermentation System via Gene Predictions. Msystems 2017, 2, e00051-17. [Google Scholar] [CrossRef]
  61. Weghoff, M.C.; Bertsch, J.; Müller, V. A novel mode of lactate metabolism in strictly anaerobic bacteria. Environ. Microbiol. 2015, 17, 670–677. [Google Scholar] [CrossRef]
  62. Detman, A.; Laubitz, D.; Chojnacka, A.; Kiela, P.R.; Salamon, A.; Barberan, A.; Chen, Y.; Yang, F.; Blaszczyk, M.K.; Sikora, A. Dynamics of dark fermentation microbial communities in the light of lactate and butyrate production. Microbiome 2021, 9, 158. [Google Scholar] [CrossRef]
  63. Duncan, S.H.; Holtrop, G.; Lobley, G.E.; Calder, A.G.; Stewart, C.S.; Flint, H.J. Contribution of acetate to butyrate formation by human faecal bacteria. Br. J. Nutr. 2004, 91, 915–923. [Google Scholar] [CrossRef]
  64. Teklebrhan, T.; Tan, Z. Diet Supplementation with Sulfur Amino Acids Modulated Fermentation Metabolome and Gut Microbiome in Goats. Front. Microbiol. 2022, 13, 870385. [Google Scholar] [CrossRef]
  65. Tejedor-Sanz, S.; Stevens, E.T.; Li, S.; Finnegan, P.; Nelson, J.; Knoesen, A.; Light, S.H.; Ajo-Franklin, C.M.; Marco, M.L. Extracellular electron transfer increases fermentation in lactic acid bacteria via a hybrid metabolism. eLife 2022, 11, e70684. [Google Scholar] [CrossRef]
  66. Habicht, K.S.; Salling, L.; Thamdrup, B.; Canfield, D.E. Effect of low sulfate concentrations on lactate oxidation and isotope fractionation during sulfate reduction by Archaeoglobus fulgidus strain Z. Appl. Environ. Microbiol. 2005, 71, 3770–3777. [Google Scholar] [CrossRef]
  67. Plugge, C.M.; Zhang, W.; Scholten, J.C.M.; Stams, A.J.M. Metabolic flexibility of sulfate-reducing bacteria. Front. Microbiol. 2011, 2, 81. [Google Scholar] [CrossRef]
  68. Macy, J.M.; Santini, J.M.; Pauling, B.V.; O’Neill, A.H.; Sly, L.I. Two new arsenate/sulfate-reducing bacteria: Mechanisms of arsenate reduction. Arch. Microbiol. 2000, 173, 49–57. [Google Scholar] [CrossRef]
  69. Kushkevych, I.; Kotrsová, V.; Dordević, D.; Buňková, L.; Vítězová, M.; Amedei, A. Hydrogen Sulfide Effects on the Survival of Lactobacilli with Emphasis on the Development of Inflammatory Bowel Diseases. Biomolecules 2019, 9, 752. [Google Scholar] [CrossRef]
  70. Halpern, M.D.; Denning, P.W. The role of intestinal epithelial barrier function in the development of NEC. Tissue Barriers 2015, 3, e1000707. [Google Scholar] [CrossRef]
  71. Rios-Arce, N.D.; Collins, F.L.; Schepper, J.D.; Steury, M.D.; Raehtz, S.; Mallin, H.; Schoenherr, D.T.; Parameswaran, N.; McCabe, L.R. Epithelial Barrier Function in Gut-Bone Signaling. Adv. Exp. Med. Biol. 2017, 1033, 151–183. [Google Scholar] [CrossRef]
  72. He, X.; Li, J.; Huang, Z.; Xue, B.; Zhu, J.; You, M.; Liu, X.; Wang, X.; Liu, Y.; Chen, S.; et al. Hydrogen sulfide preserves intestinal barrier repair function through sulfhydration of RPS20 in experimental colitis. Res. Sq. 2024. preprint. [Google Scholar] [CrossRef]
  73. Tu, J.; Zhang, J.; Chen, G. Higher dietary butyrate intake is associated with better cognitive function in older adults: Evidence from a cross-sectional study. Front. Aging Neurosci. 2025, 17, 1522498. [Google Scholar] [CrossRef]
  74. Recharla, N.; Geesala, R.; Shi, X.Z. Gut Microbial Metabolite Butyrate and Its Therapeutic Role in Inflammatory Bowel Disease: A Literature Review. Nutrients 2023, 15, 2275. [Google Scholar] [CrossRef]
  75. Qaisar, R.; Iqbal, M.S.; Ahmad, F.; Karim, A. Oral butyrate improves postural balance by repairing leaky gut in geriatric adults. Gait Posture 2025, 121, 370–376. [Google Scholar] [CrossRef] [PubMed]
Figure 1. Total SCFA (A) and butyrate (B) levels vary more by age than by treatment. Bars represent the mean of six samples with standard deviation. The results of paired samples Wilcox tests (within ages) or Dunn’s tests (across ages), with Benjamini–Hochberg correction for significant differences among groups are shown by lines and asterisks above the plots.
Sci 07 00102 g001
Figure 2. Total cell counts in infants are the most affected by H2S treatment. Bars represent the percentage of cells in treated samples relative to untreated samples (n = 6 per age/treatment).
Sci 07 00102 g002
Figure 3. Alpha diversity measures differ by age. Boxplots show n = 6 samples per age group and treatment type. Panels (A,B) are NSC samples and panels (C,D) are H2S samples. Significant differences between age groups were determined using the Wilcoxon rank-sum test with Benjamini–Hochberg p-value adjustment. Dots are outlier values. * = p < 0.05.
Sci 07 00102 g003
Figure 4. Microbial communities differ primarily by age rather than treatment. Principle coordinates analysis of weighted UniFrac distance shows that the samples are arranged in an age progression. The table represents the results of the pairwise PERMANOVA testing for clustering by age. ** = p < 0.01, *** = p < 0.001, ns = not significant.
Sci 07 00102 g004
Figure 5. Microbial community composition varies by age, but the selected butyrate-associated taxa are affected by treatment. (A) Average relative abundances of n = 6 samples per age/treatment with the 4 most abundant families in each phylum colored separately. Grey and red boxes indicate NSC and SSP treatments, respectively. (B) Species counts of the families identified in panel (A).
Sci 07 00102 g005
Figure 6. Selected butyrate-associated taxa are affected by treatment in an age-dependent manner. Panels (AC): abundances of three species which are correlated with butyrate concentrations. * = p < 0.05, ** = p < 0.01, *** = p < 0.001.
Sci 07 00102 g006
Figure 7. Lactate concentrations and abundances of taxa associated with lactate metabolism. (A) Measured concentrations of lactate. The figure is organized in the same manner as Figure 1. * = p < 0.05, ** = p < 0.01, *** = p < 0.001. (B) HUMAnN-inferred MetaCyc pathways associated with lactate metabolism and the taxa associated with them. The number represents the counts of species containing those pathways, grouped by families. (C) Abundances of selected taxa associated with lactate production or consumption.
Sci 07 00102 g007
Figure 8. Abundances of taxa associated with lactate metabolism. Pathways for microbial lactate conversion and the abundances of taxa associated with those pathways.
Sci 07 00102 g008
Figure 9. TEER measurements.
Sci 07 00102 g009
Disclaimer/Publisher’s Note: The statements, opinions and data contained in all publications are solely those of the individual author(s) and contributor(s) and not of MDPI and/or the editor(s). MDPI and/or the editor(s) disclaim responsibility for any injury to people or property resulting from any ideas, methods, instructions or products referred to in the content.

