

Exergy Assessment and Exergetic Resilience of the Large-Scale Gas Oil Hydrocracking Process


Abstract
1. Introduction
2. Materials and Methods
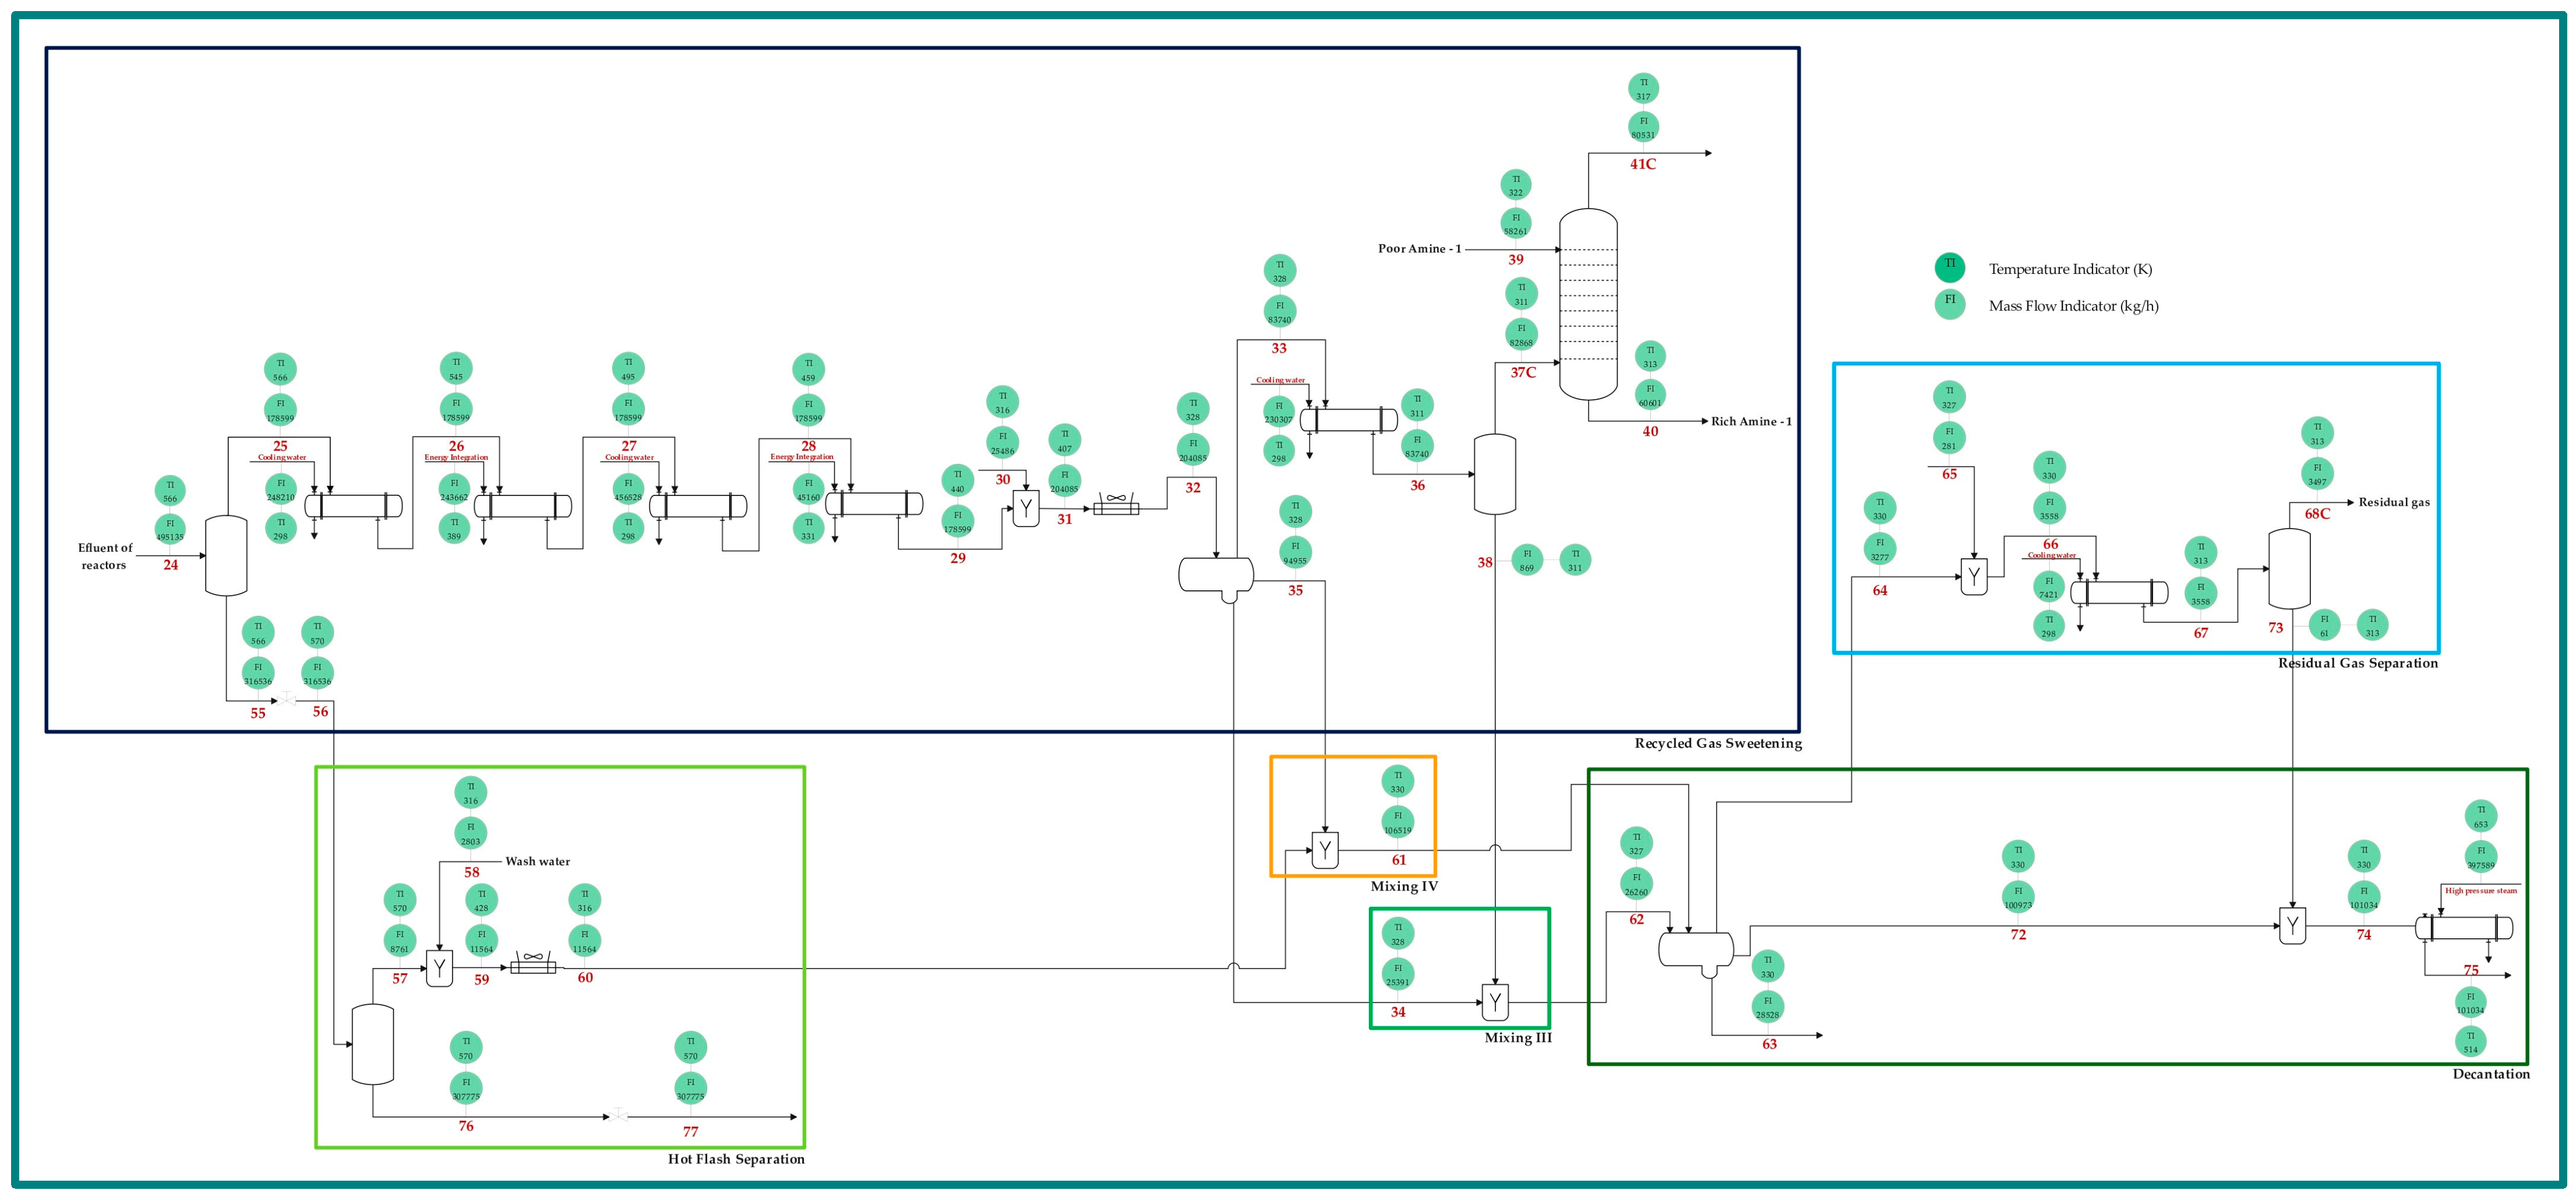
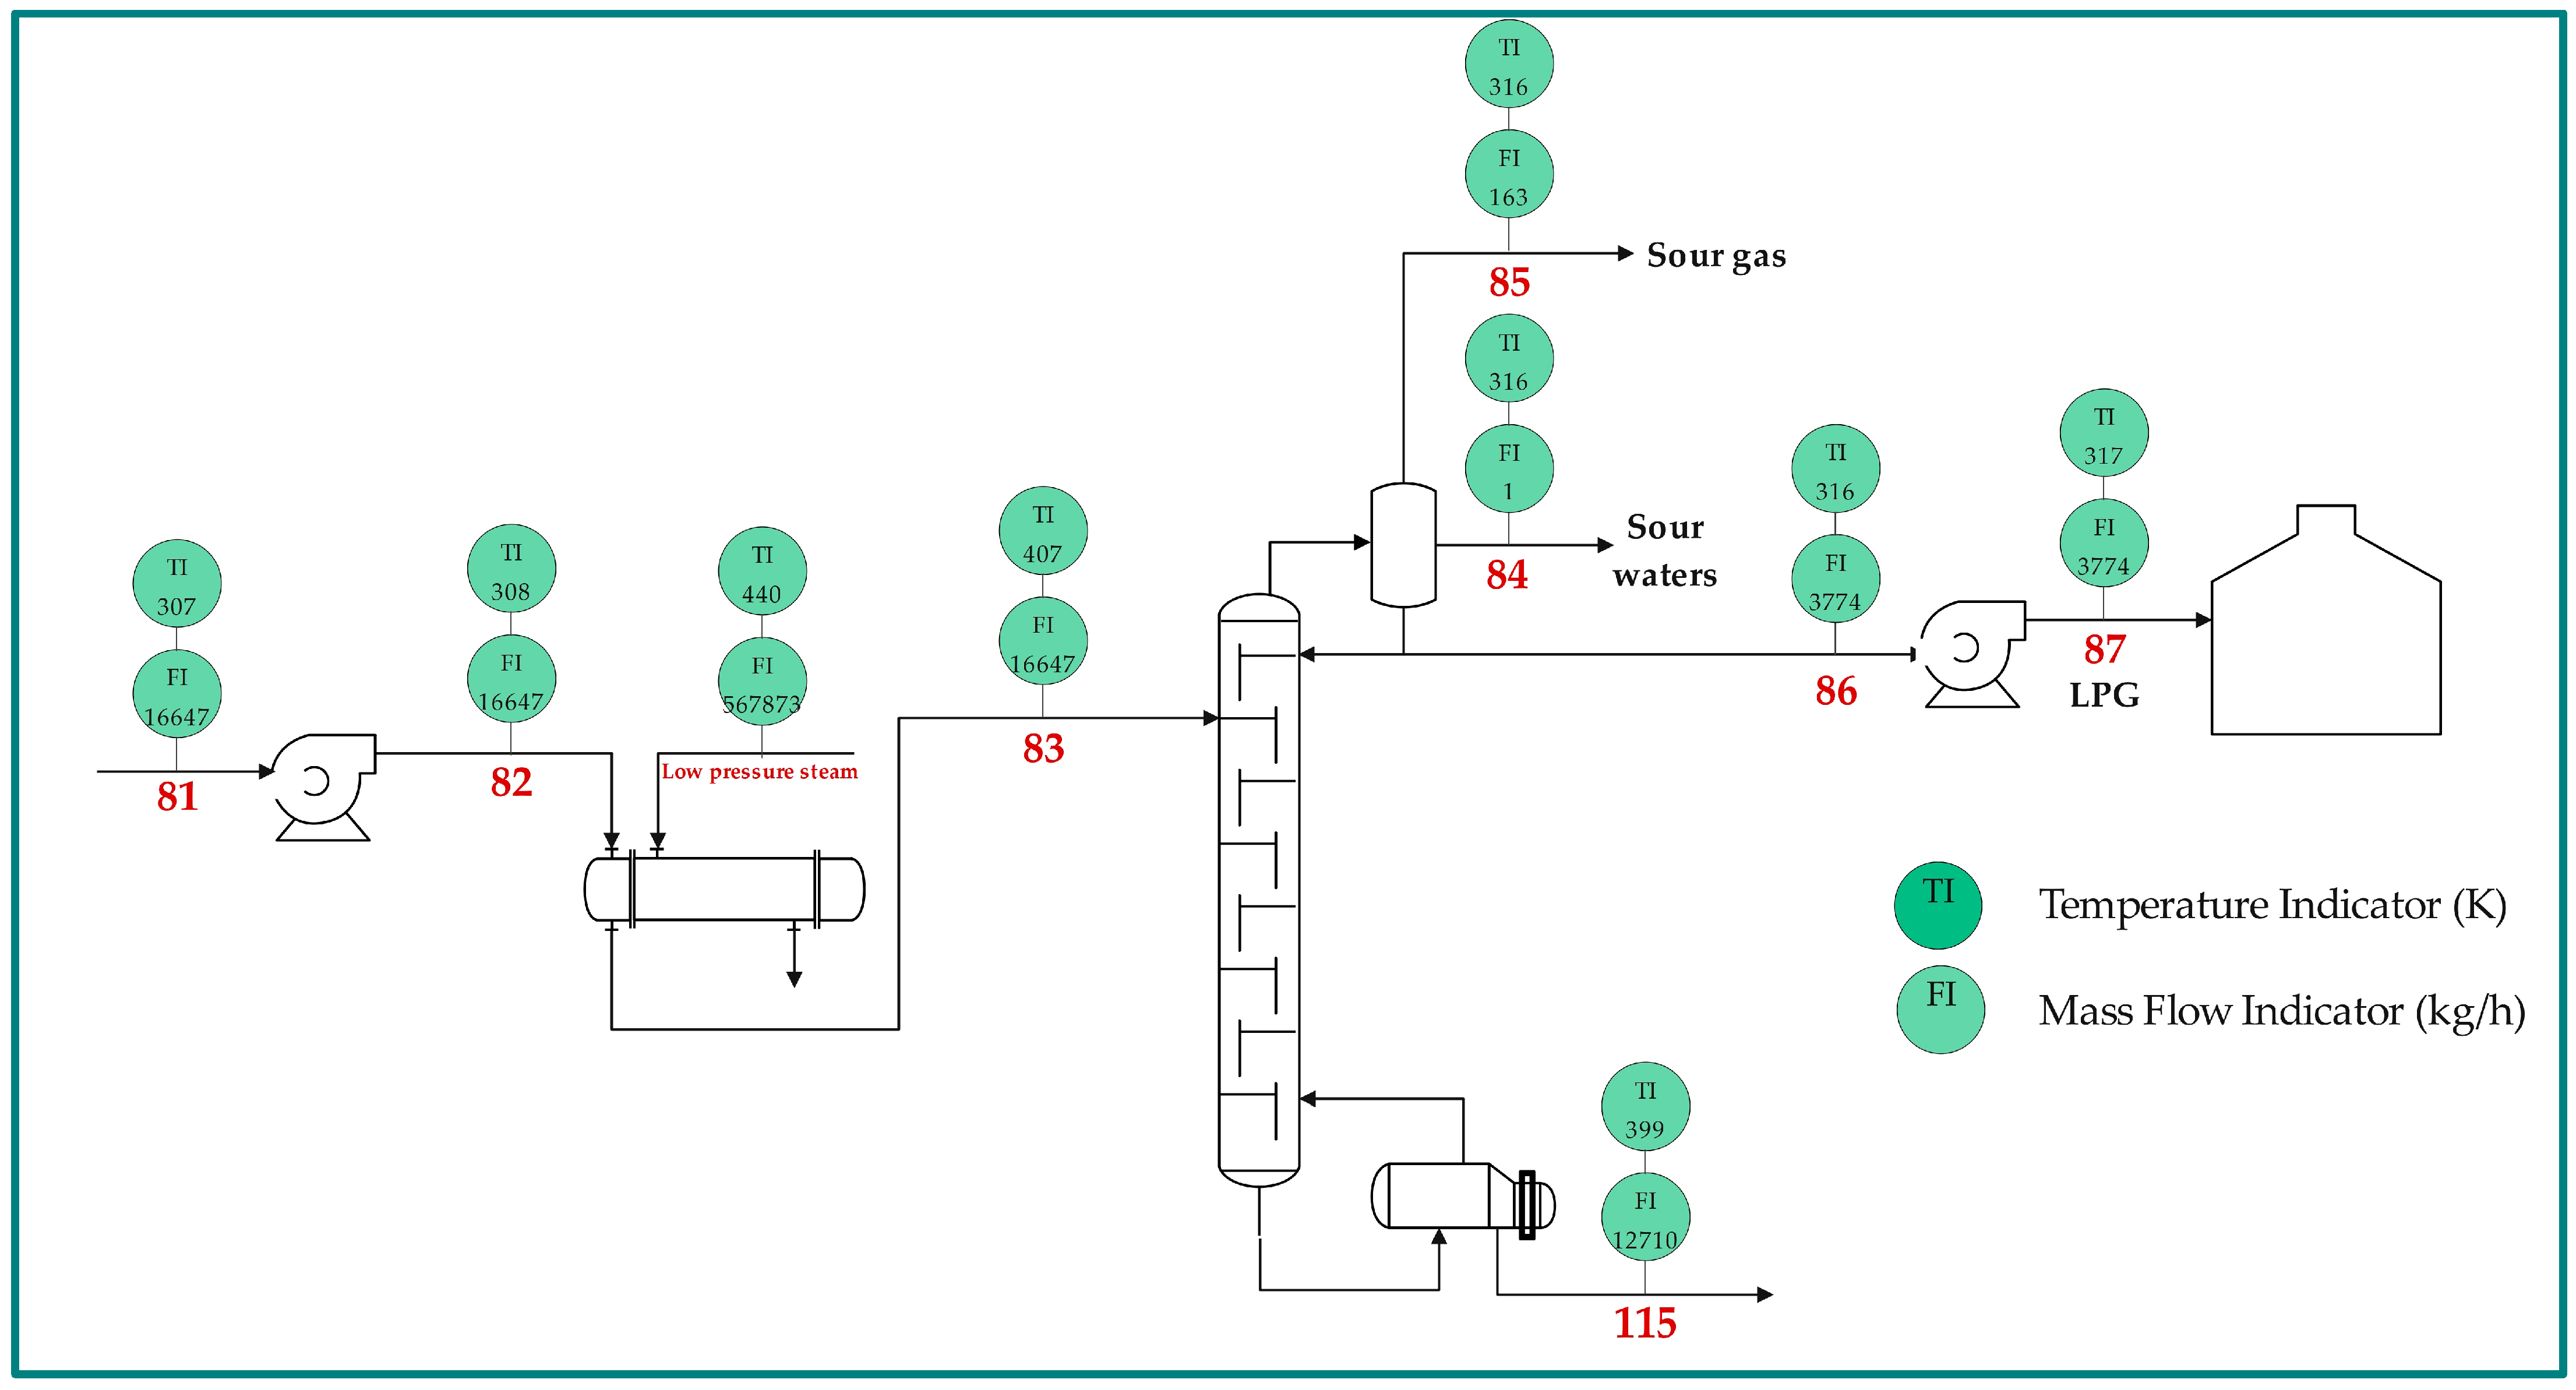
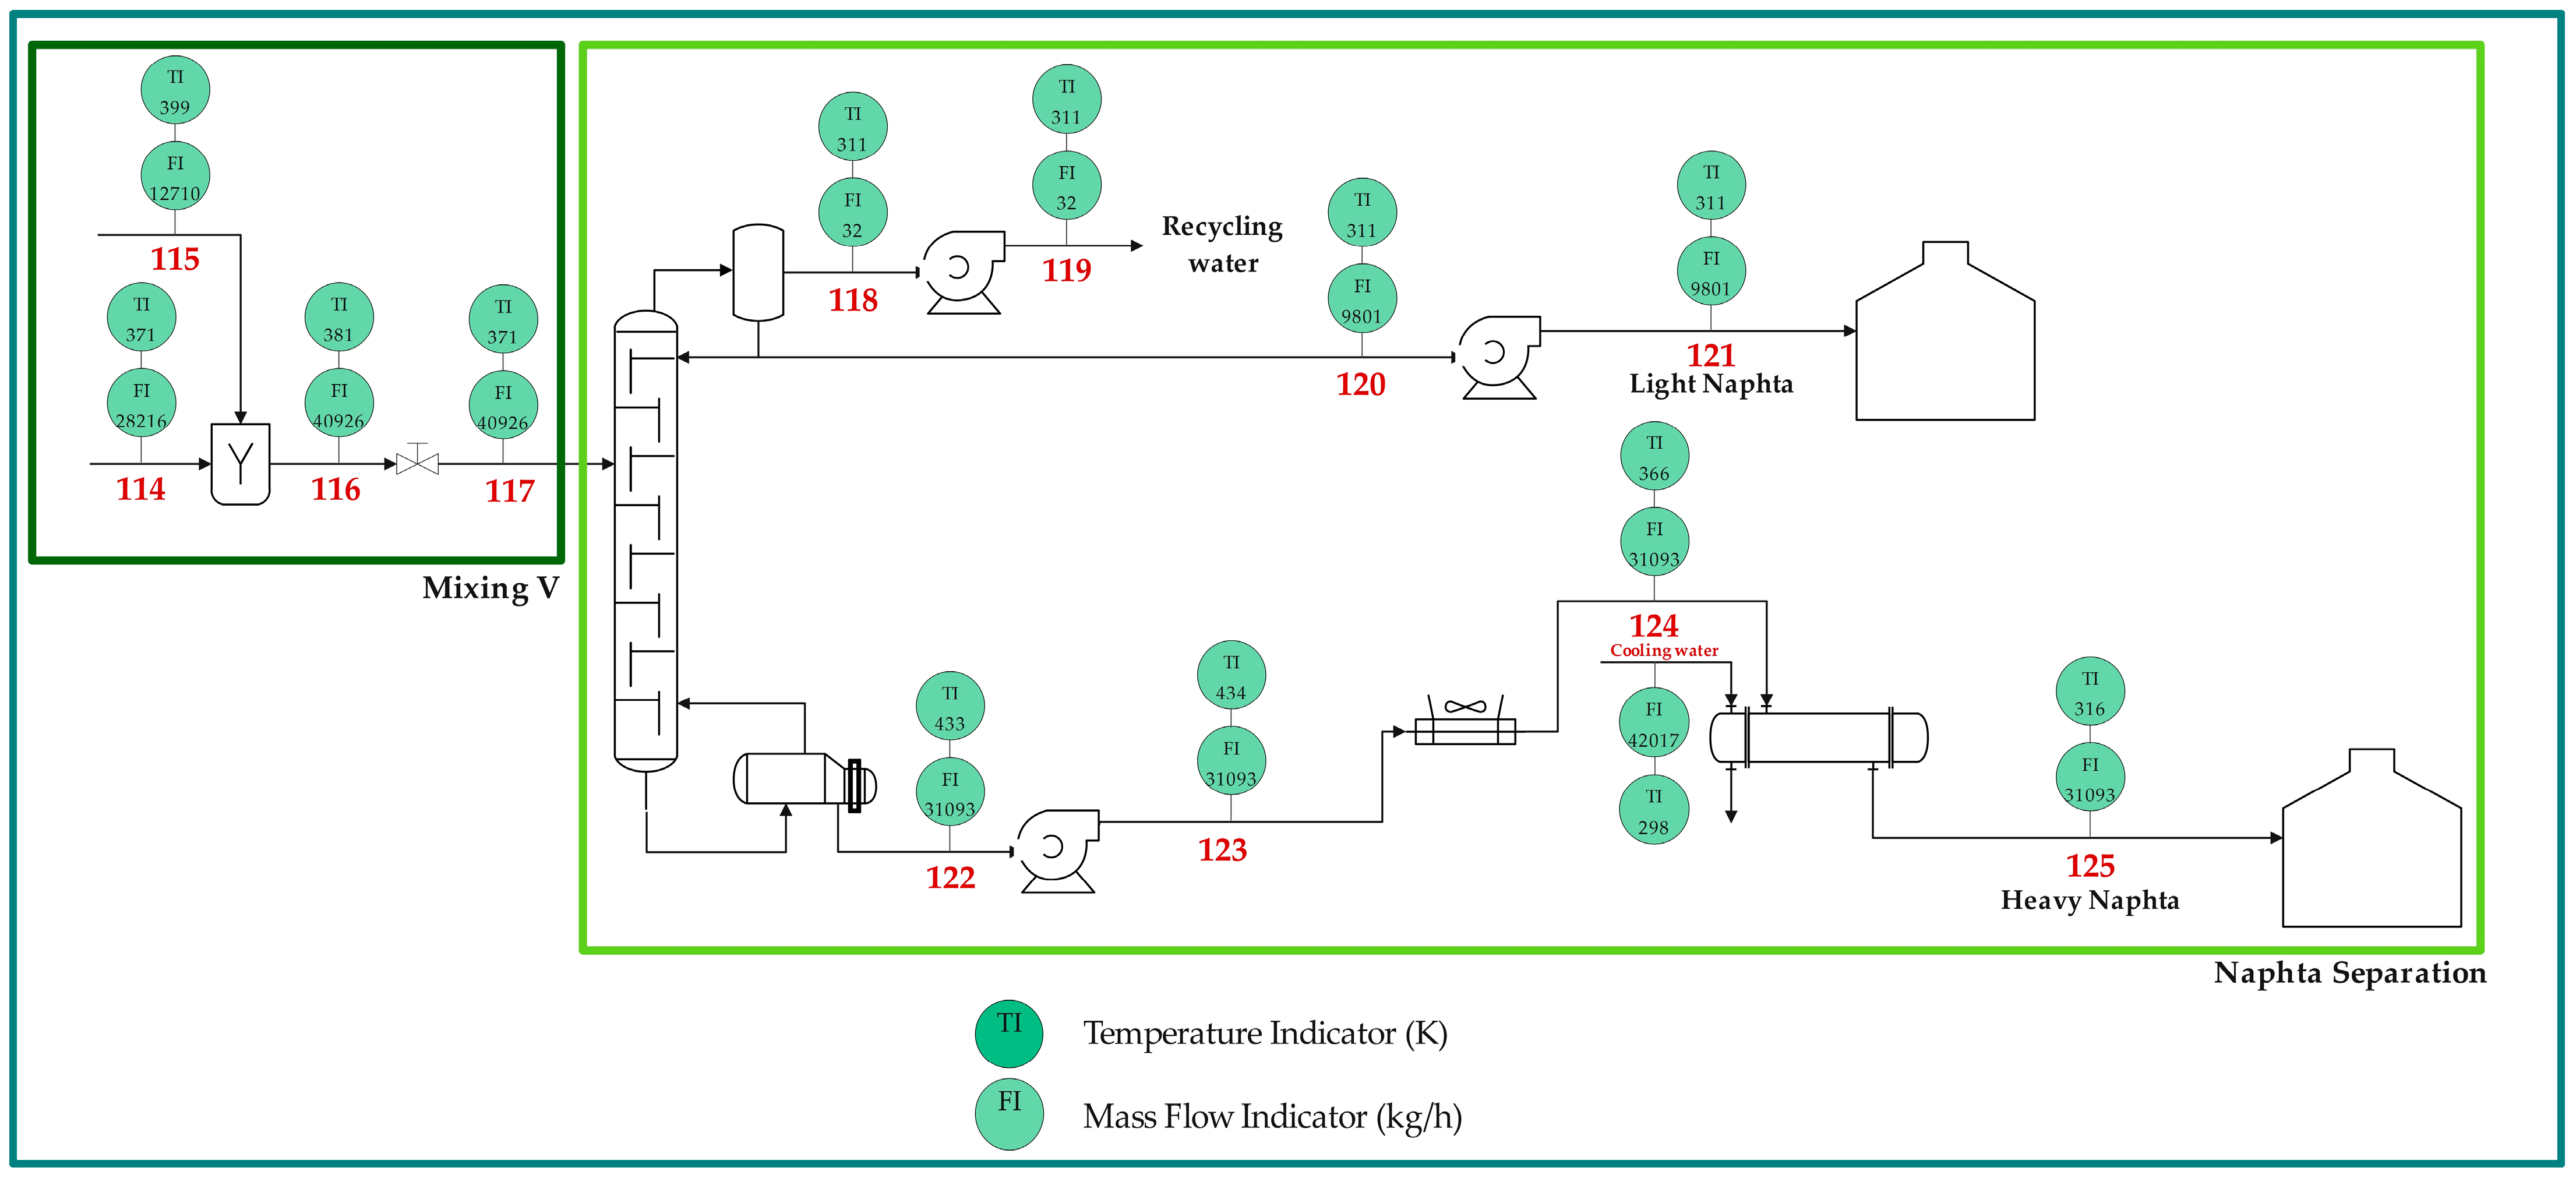
2.1. Process Description
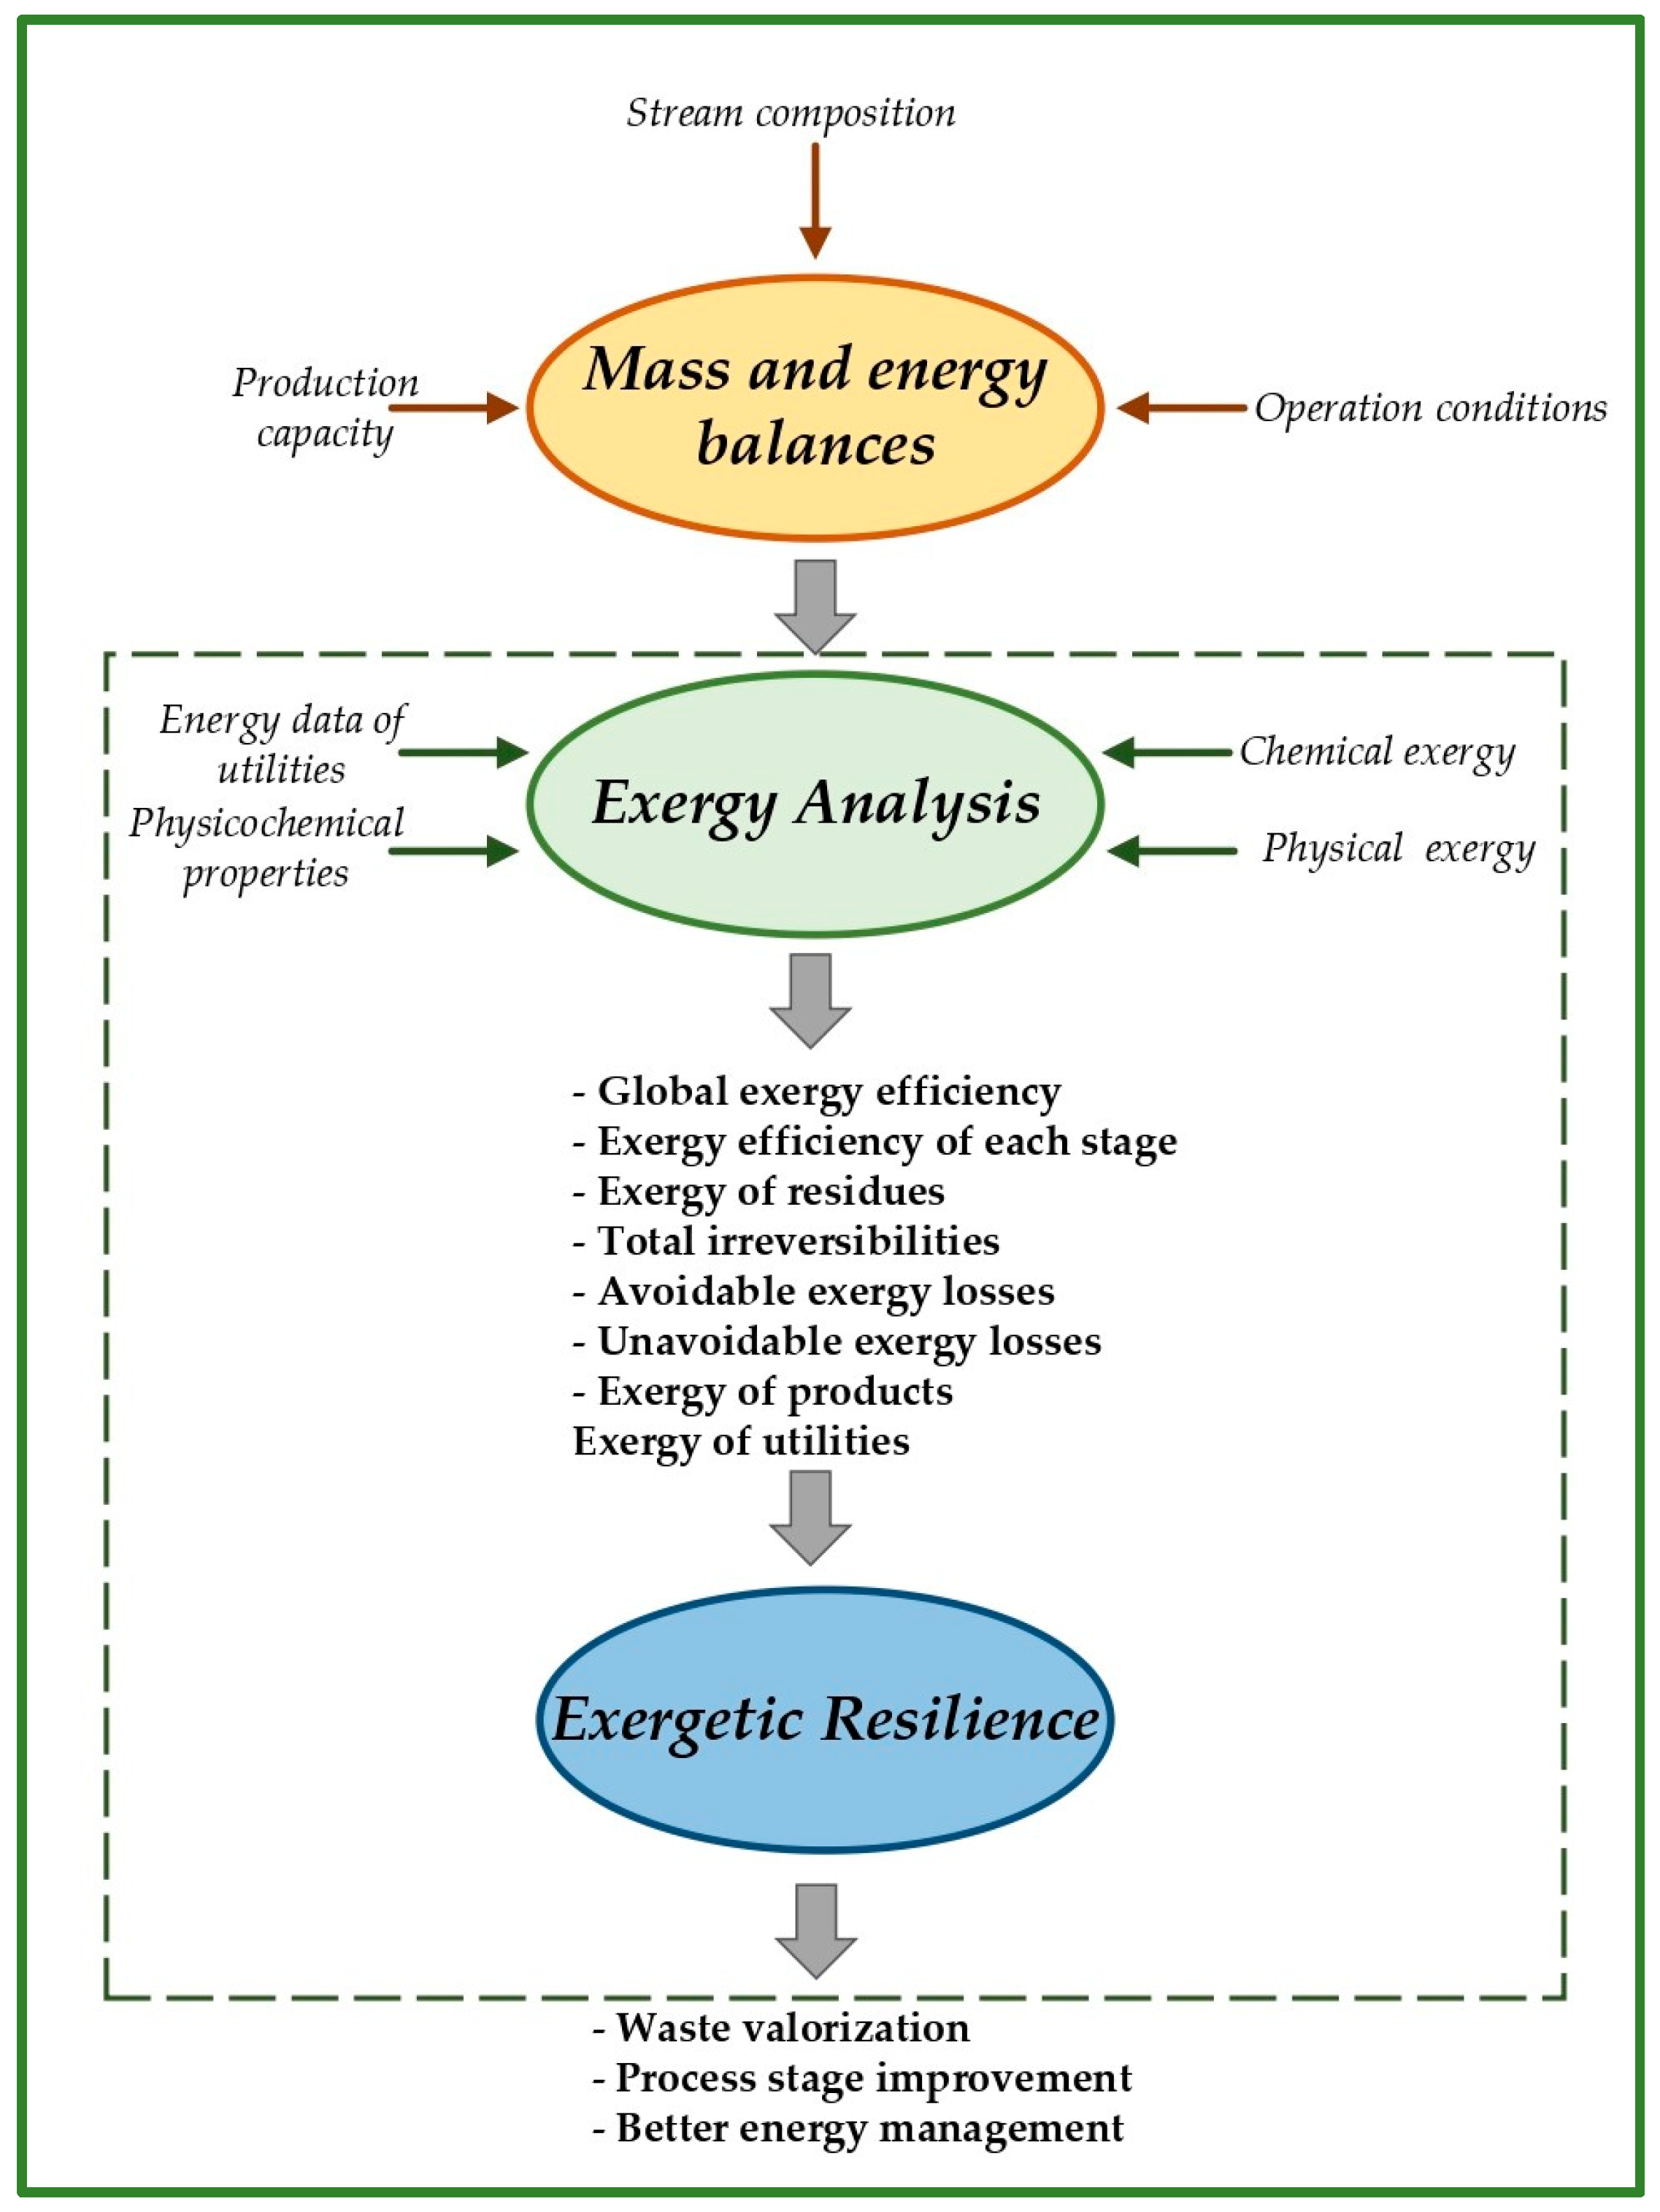
2.2. Exergy Analysis Using Computer-Aided Process Engineering (CAPE)
2.3. Exergetic Resilience Analysis
3. Results and Discussion
3.1. Exergy Analysis of the Gasoil Hydrocracking Process
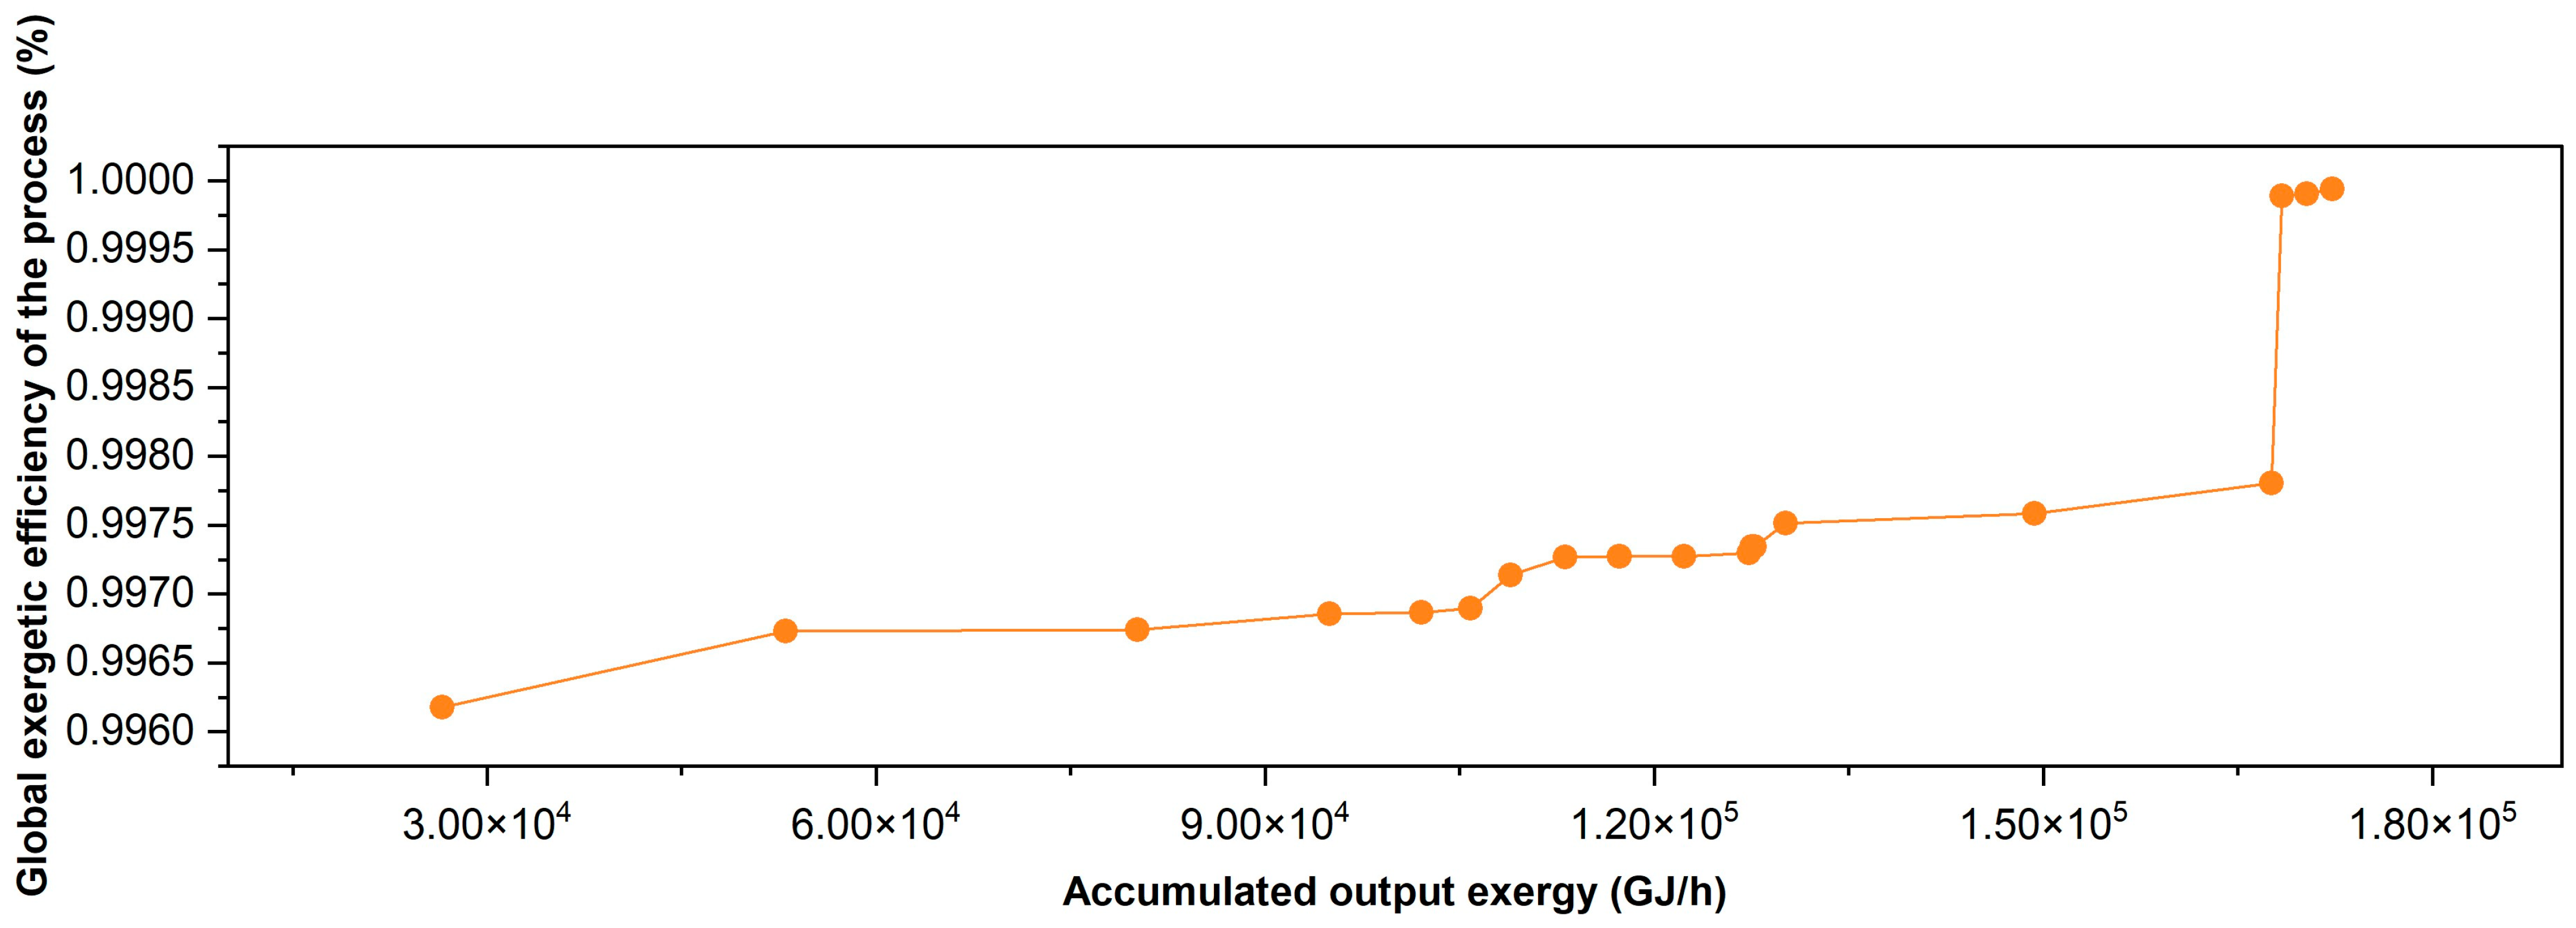
3.2. Exergetic Resilience Analysis of the Gasoil Hydrocracking Process
4. Conclusions
Author Contributions
Funding
Institutional Review Board Statement
Informed Consent Statement
Data Availability Statement
Acknowledgments
Conflicts of Interest
References
- Zhongming, Z.; Linong, L.; Xiaona, Y.; Wangqiang, Z.; Wei, L. AR6 Climate Change 2021: The Physical Science Basis. Available online: https://www.unep.org/resources/report/climate-change-2021-physical-science-basis-working-group-i-contribution-sixth (accessed on 5 August 2024).
- Morales, M.; Gonzalez-García, S.; Aroca, G.; Moreira, M.T. Life cycle assessment of gasoline production and use in Chile. Sci. Total Environ. 2015, 505, 833–843. [Google Scholar] [CrossRef] [PubMed]
- Zhengfu, B.; Inyang, H.I.; Daniels, J.L.; Frank, O.; Struthers, S. Environmental issues from coal mining and their solutions. Min. Sci. Technol. 2010, 20, 215–223. [Google Scholar]
- Ahmad, W. On the dynamic dependence and investment performance of crude oil and clean energy stocks. Res. Int. Bus. Financ. 2017, 42, 376–389. [Google Scholar] [CrossRef]
- Organic Oil Recovery Reservoir Optimisation With No Capital Expense. Available online: https://www.oilfieldtechnology.com/magazine/oilfield-technology/june-2024/ (accessed on 5 August 2024).
- Oil and GAS industry Faces Moment of Truth–and Opportunity to Adapt–as Clean Energy Transitions Advance. Available online: https://www.iea.org/news/oil-and-gas-industry-faces-moment-of-truth-and-opportunity-to-adapt-as-clean-energy-transitions-advance (accessed on 5 August 2024).
- Global Energy Perspective 2023. Available online: https://www.mckinsey.com/industries/oil-and-gas/our-insights/global-energy-perspective-2023 (accessed on 5 August 2024).
- Greenhouse Gas Emissions from Energy Data Explorer. Available online: https://www.iea.org/data-and-statistics/data-tools/greenhouse-gas-emissions-from-energy-data-explorer (accessed on 5 August 2024).
- Cano-Londono, N.A.; Médina, O.E.; Mozo, I.; Céspedes, S.; Franco, C.A.; Cortés, F.B. Viability of the steam-based extraction of extra-heavy crude oil using nanoparticles: Exergy and life-cycle assessment. Energy 2024, 304, 131929. [Google Scholar] [CrossRef]
- Aitani, A.M. Oil Refining and Products. Encycl. Energy 2024, 49, 715–729. [Google Scholar]
- Ancheyta, J.; Speight, J.G. Hydroprocessing of Heavy Oils and Residua; CRC Press: Boca Raton, FL, USA, 2007. [Google Scholar]
- Araújo, K. The emerging field of energy transitions: Progress, challenges, and opportunities. Energy Res. Soc. Sci. 2014, 1, 112–121. [Google Scholar] [CrossRef]
- Fattouh, B.; Poudineh, R.; West, R. The rise of renewables and energy transition: What adaptation strategy exists for oil companies and oil-exporting countries? Energy Transit. 2019, 3, 45–58. [Google Scholar] [CrossRef]
- Shojaeddini, E.; Naimoli, S.; Ladislaw, S.; Bazilian, M. Oil and gas company strategies regarding the energy transition. Progress. Energy 2019, 1, 012001. [Google Scholar] [CrossRef]
- Tracking Clean Energy Progress 2017–Analysis. 2024. Available online: https://www.iea.org/reports/tracking-clean-energy-progress-2017 (accessed on 31 July 2024).
- Kanaboshi, H.; Sano, F.; Oda, J.; Akimoto, K.; Onishi, N. Cost-Efficient Measures in the Oil Refinery and Petrochemical Sectors for the Reduction of CO2 Emissions under the Paris Agreement and Air Pollution under the MARPOL Convention. Energy Clim. Chang. 2021, 2, 100027. [Google Scholar] [CrossRef]
- Boldyryev, S.; Gil, T. Debottlenecking of existing hydrocracking unit by improved heat recovery for energy and carbon dioxide savings. Energy Convers. Manag. 2021, 238, 114164. [Google Scholar] [CrossRef]
- Bhutani, N.; Rangaiah, G.P.; Ray, A.K. First-Principles, Data-Based, and Hybrid Modeling and Optimization of an Industrial Hydrocracking Unit. Ind. Eng. Chem. Res. 2006, 45, 7807–7816. [Google Scholar] [CrossRef]
- Kaminsky, E.F.; Khavkin, V.A. Deep Oil Processing: Technological and Environmental Aspects; Technique: Moscow, Russia, 2001. (In Russian) [Google Scholar]
- Kapustin, V.M.; Gureev, A.A. Technology of Oil Refining, Part 2, Destructive Processes; KolosS: Moscow, Russia, 2007. (In Russian) [Google Scholar]
- Hydrocracking at the Refinery in Burgas Will Cost LUKOIL $ 1.1 Billion, Website: News and Reviews of the Petrochemical Industry RCC.ru. Available online: http://rcc.ru/article/gidrokreking-na-npz-v-burgase-oboydetsya-quot-lukoyluquotv-1-1-mlrd5441# (accessed on 5 August 2024). (In Russian).
- Iplik, E.; Aslanidou, I.; Kyprianidis, K. Hydrocracking: A Perspective towards Digitalization. Sustainability 2020, 12, 7058. [Google Scholar] [CrossRef]
- Gundersen, T. An Introduction to the Concept of Exergy and Energy Quality; Department of Energy and Process Engineering Norwegian University of Science and Technology: Trondheim, Norway, 2011; Volume 4. [Google Scholar]
- Orozco, C.A.; Velasquez, H.I.; Cano, N.A.; Florez-Orrego, D. Exergy analysis of alluvial gold mining. In Proceedings of the 33th International Conference on Efficiency, Cost, Optimization, Simulation and Environmental Impact of Energy Systems, ECOS 2020, Osaka, Japan, 29 June–3 July 2020; pp. 2141–2152. [Google Scholar]
- Velasquez, H.I.; Loaiza, C.A.O.; Cano, N.A.; Hasenstab, C. Evaluation of the extractive gold process: Open-pit mining through exergy analysis. In Proceedings of the ECOS 2019—Proceedings of the 32nd International Conference on Efficiency, Cost, Optimization, Simulation and Environmental Impact of Energy Systems, Wroclaw, Poland, 23–28 June 2019; pp. 4291–4303. [Google Scholar]
- de Oliveira, S., Jr. Exergy: Production, Cost and Renewability; Springer Science & Business Media: Berlin/Heidelberg, Germany, 2012. [Google Scholar]
- Szargut, J.; Morris, D.R.; Steward, F.R.J.C.; Processes, M. Exergy Analysis of Thermal, Chemical, and Metallurgical Processes; Hemisphere: London, UK, 1998. [Google Scholar]
- Bandyopadhyay, R.; Alkilde, O.F.; Upadhyayula, S. Applying pinch and exergy analysis for energy efficient design of diesel hydrotreating unit. J. Clean. Prod. 2019, 232, 337–349. [Google Scholar] [CrossRef]
- Goodarzvand-Chegini, F.; GhasemiKafrudi, E. Application of exergy analysis to improve the heat integration efficiency in a hydrocracking process. Energy Environ. 2017, 28, 564–579. [Google Scholar] [CrossRef]
- Moreno-Sader, K.; Meramo-Hurtado, S.I.; González-Delgado, A.D. Computer-aided environmental and exergy analysis as decision-making tools for selecting bio-oil feedstocks. Renew. Sustain. Energy Rev. 2019, 112, 42–57. [Google Scholar] [CrossRef]
- González-Delgado, Á.D.; Moreno-Sader, K.A.; Martínez-Consuegra, J.D. Sustainable Biorefining of Shrimp: Developments from Computer Aided Process Engineering; Corporación Universitaria Minuto de Dios–UNIMINUTO: Cartagena, Colombia, 2022; (In Spanish). [Google Scholar] [CrossRef]
- Bernardo, P.; Barbieri, G.; Drioli, E. An Exergetic Analysis of Membrane Unit Operations Integrated in the Ethylene Production Cycle. Chem. Eng. Res. Des. 2006, 84, 405–411. [Google Scholar] [CrossRef]
- Leal-Navarro, J.; Mestre-Escudero, R.; Puerta-Arana, A.; León-Pulido, J.; González-Delgado, Á.D. Evaluating the Exergetic Performance of the Amine Treatment Unit in a Latin-American Refinery. ACS Omega 2019, 4, 21993–21997. [Google Scholar] [CrossRef]
- Hamedi, M.; Omidkhah, M.; Sadrameli, S.M.; Khoshgoftar, M.H. Exergetic, exergoeconomic, and exergoenvironmental analyses of an existing industrial olefin plant. Sustain. Energy Technol. Assess. 2022, 52, 102175. [Google Scholar] [CrossRef]
- Da Cruz, F.E.; De Oliveira Junior, S. Petroleum Refinery Hydrogen Production Unit: Exergy and Production Cost Evaluation. Int. J. Thermodyn. 2008, 11, 187–193. [Google Scholar]
- González-Delgado, Á.D.; García-Martínez, J.B.; Barajas-Solano, A.F. A Technoeconomic Resilience and Exergy Analysis Approach for the Evaluation of a Vaccine Production Plant in North-East Colombia. Sustainability 2022, 15, 287. [Google Scholar] [CrossRef]
- Peralta-Ruiz, Y.; González-Delgado, Á.D.; Kafarov, V. Evaluation of alternatives for microalgae oil extraction based on exergy analysis. Appl. Energy 2013, 101, 226–236. [Google Scholar] [CrossRef]
- Wang, J.; Chen, Y.; Lior, N.; Li, W. Energy, exergy and environmental analysis of a hybrid combined cooling heating and power system integrated with compound parabolic concentrated-photovoltaic thermal solar collectors. Energy 2019, 185, 463–476. [Google Scholar] [CrossRef]
- Taheri, K.; Gadow, R.; Killinger, A. Exergy analysis as a developed concept of energy efficiency optimized processes: The case of thermal spray processes. Proc. CIRP 2014, 17, 511–516. [Google Scholar] [CrossRef]
- Kalogirou, S.A. Solar thermal collectors and applications. Prog. Energy Combust. Sci. 2004, 30, 231–295. [Google Scholar] [CrossRef]
- Atheaya, D. Exergy analysis of photovoltaic thermal (PVT) compound parabolic concentrator (CPC) for constant collection temperature mode. Sol. Energy 2016, 135, 222–231. [Google Scholar] [CrossRef]
- Valizadeh, M. Exergy performance assessment of a linear parabolic through photovoltaic thermal collector. Renew. Energy 2019, 138, 1028–1041. [Google Scholar] [CrossRef]
- Ghazouani, M.; Bouya, M.; Benaissa, M. Thermo-economic and exergy analysis and optimization of small PTC collectors for solar heat integration in industrial processes. Renew. Energy 2020, 152, 984–998. [Google Scholar] [CrossRef]
- Rant, Z. Energy value and pricing. Stroj. Vestn. -J. Mech. Eng. 1955, 1, 4–7. [Google Scholar]
- Gaggioli, R.A.; Paulus, D.M. Available energy–Part II: Gibbs extended. J. Energy Resour. Technol. 2002, 124, 110–115. [Google Scholar] [CrossRef]
- Gaggioli, R.A.; Richardson, D.H.; Bowman, A.J. Available energy–Part I: Gibbs revisited. J. Energy Resour. Technol–Trans. ASME 2002, 124, 105–109. [Google Scholar] [CrossRef]
- Sciubba, E.; Wall, G. A brief commented history of exergy from the beginnings to 2004. Int. J. Therm. 2010, 10, 1–26. [Google Scholar]
- Terzi, R. Application of exergy analysis to energy systems. Appl. Exergy 2018, 109–123. [Google Scholar] [CrossRef]
- Li, X.; Zanwar, A.; Jayswal, A.; Lou, H.H.; Huang, Y. Incorporating Exergy Analysis and Inherent Safety Analysis for Sustainability Assessment of Biofuels. Ind. Eng. Chem. Res. 2011, 50, 2981–2993. [Google Scholar] [CrossRef]
- Casisi, M.; Khedr, S.; Reini, M. The Thermoeconomic Environment and the exergy-based cost accounting of technological and biological systems. Energy 2022, 262, 125117. [Google Scholar] [CrossRef]
- Arteaga, S.; González, J.; Ojeda, K.; Pájaro, M.; González, Á. Computer-Aided Exergy Analysis of a Palm Based-Biorefinery for Producing Palm Oil, Kernel Oil and Hydrogen. Contemp. Eng. Sci. 2018, 11, 537–545. [Google Scholar] [CrossRef]
- Hinderink, A.P.; Kerkhof, F.P.J.M.; Lie, A.B.K.; De Swaan Arons, J.; Van Der Kooi, H.J. Exergy analysis with a flowsheeting simulator—I. Theory; calculating exergies of material streams. Chem. Eng. Sci. 1996, 51, 4693–4700. [Google Scholar] [CrossRef]
- Querol, E.; Gonzalez-Regueral, B.; Perez-Benedito, J.L. Practical Approach to Exergy and Thermoeconomic Analyses of Industrial Processes; Springer: Berlin/Heidelberg, Germany, 2013; Volume 92. [Google Scholar]
- Muñoz, F.L.; Meramo, S.; Ricardez-Sandoval, L.; González-Delgado, A.D.; Castillo, B.C.; Quiroga, A.G.; Baptiste, B.L.G.; León-Pulido, J. Insights from an exergy analysis of a green chemistry chitosan biorefinery. Chem. Eng. Res. Des. 2019, 194, 666–677. [Google Scholar] [CrossRef]
- Tsatsaronis, G.; Park, M.H. On avoidable and unavoidable exergy destructions and investment costs in thermal systems. Energy Convers. Manag. 2002, 43, 1259–1270. [Google Scholar] [CrossRef]
- Dincer, I.; Rosen, M.A. Exergy and Industrial Ecology. Exergy—Energy, Environment and Sustainable Development; Elsevier: Oxford, UK, 2007; pp. 417–423. [Google Scholar]


| Name | Symbol | Equation | No. |
|---|---|---|---|
| Exergy losses (MJ/h) | (1) | ||
| Total input exergy (MJ/h) | (2) | ||
| Total output exergy (MJ/h) | (3) | ||
| Total exergy of a substance (MJ/h) | (4) | ||
| Chemical exergy of a mixture (MJ/h) | (5) | ||
| Standard chemical exergy for component i not present in the reference environment (MJ/h) | (6) | ||
| Standard chemical exergy of component i of the reference environment (MJ/h) | (7) | ||
| Physical exergy (MJ/h) | (8) | ||
| Physical exergy of an ideal gas (MJ/h) | (9) | ||
| Physical exergy of a substance in solid or liquid state (MJ/h) | (10) | ||
| Utilities exergy (MJ/h) | (11) | ||
| Exergy per work (MJ/h) | (12) | ||
| Exergy per heat (MJ/h) | (13) | ||
| Total destroyed exergy (MJ/h) | (14) | ||
| Exergetic efficiency (%) | (15) | ||
| Destroyed exergy (%) | (16) |
| Stream Number | 1 | 3 | 13 | 18 | 20 | 21 |
|---|---|---|---|---|---|---|
| Stream | Charge | Recycle Hydrogen | Quench Hydrogen to Reaction Stage I | UCO | Quench Hydrogen to Reaction Stage II | Recycle Hydrogen to Reaction Stage II |
| Temperature (K) | 385.37 | 391.48 | 338.71 | 610.93 | 338.71 | 391.48 |
| Pressure (atm) | 4.40 | 165.60 | 165.60 | 153.70 | 165.60 | 165.60 |
| Mass flow (kg/h) | 221,147 | 22,515 | 34,398 | 185,381 | 8574 | 22,645 |
| Mass composition | ||||||
| Liquid water | 0.000 | 0.000 | 0.000 | 0.000 | 0.000 | 0.000 |
| Water steam | 0.000 | 0.002 | 0.004 | 0.000 | 0.004 | 0.002 |
| Ammonia (Vapor phase) | 0.000 | 0.000 | 0.000 | 0.000 | 0.000 | 0.000 |
| Hydrogen sulfide (Vapor phase) | 0.000 | 0.000 | 0.000 | 0.000 | 0.000 | 0.000 |
| Hydrogen (Vapor phase) | 0.000 | 0.584 | 0.522 | 0.000 | 0.522 | 0.584 |
| Methane (Vapor phase) | 0.000 | 0.203 | 0.233 | 0.000 | 0.233 | 0.203 |
| LPG (Liquid phase) | 0.000 | 0.000 | 0.000 | 0.000 | 0.000 | 0.000 |
| LPG (Vapor phase) | 0.000 | 0.154 | 0.161 | 0.000 | 0.161 | 0.154 |
| Light Naphta (Liquid phase) | 0.000 | 0.000 | 0.000 | 0.000 | 0.000 | 0.000 |
| Light Naphta (Vapor phase) | 0.000 | 0.040 | 0.070 | 0.000 | 0.070 | 0.040 |
| Charge (Liquid phase) | 1.000 | 0.000 | 0.000 | 0.000 | 0.000 | 0.000 |
| Charge (Vapor phase) | 0.000 | 0.000 | 0.000 | 0.000 | 0.000 | 0.000 |
| Heavy Naphta (Liquid Phase) | 0.000 | 0.000 | 0.000 | 0.000 | 0.000 | 0.000 |
| Heavy Naphta (Vapor Phase) | 0.000 | 0.015 | 0.011 | 0.000 | 0.011 | 0.015 |
| Kerosene (Liquid phase) | 0.000 | 0.000 | 0.000 | 0.000 | 0.000 | 0.000 |
| Kerosene (Vapor phase) | 0.000 | 0.001 | 0.000 | 0.000 | 0.000 | 0.001 |
| Diesel (Liquid phase) | 0.000 | 0.000 | 0.000 | 0.000 | 0.000 | 0.000 |
| Diesel (Vapor phase) | 0.000 | 0.000 | 0.000 | 0.000 | 0.000 | 0.000 |
| UCO (Liquid phase) | 0.000 | 0.000 | 0.000 | 1.000 | 0.000 | 0.000 |
| UCO (Vapor phase) | 0.000 | 0.000 | 0.000 | 0.000 | 0.000 | 0.000 |
| Nitrogen (Vapor phase) | 0.000 | 0.000 | 0.000 | 0.000 | 0.000 | 0.000 |
| Oxygen (Vapor phase) | 0.000 | 0.000 | 0.000 | 0.000 | 0.000 | 0.000 |
| Carbon Dioxide (Vapor phase) | 0.000 | 0.000 | 0.000 | 0.000 | 0.000 | 0.000 |
| Carbon Monoxide (Vapor phase) | 0.000 | 0.000 | 0.000 | 0.000 | 0.000 | 0.000 |
| Methyldiethanolamine (Liquid phase) | 0.000 | 0.000 | 0.000 | 0.000 | 0.000 | 0.000 |
| 1.000 | 1.000 | 1.000 | 1.000 | 1.000 | 1.000 |
| Stream Number | 24 | 45 | Hydrogen (Final Product) | 87 | 97 | 104 | 109 | 121 | 125 |
|---|---|---|---|---|---|---|---|---|---|
| Stream | Effluent of Reactors | Make-Up hydrogen | LPG | UCO to FCC | Diesel | Kerosene | Light Naphta | Heavy Naphta | |
| Temperature (K) | 565.86 | 298.15 | 337.44 | 316.72 | 610.93 | 316.48 | 316.48 | 311.34 | 316.48 |
| Pressure (atm) | 145.67 | 21.28 | 24.82 | 11.21 | 153.70 | 2.00 | 2.00 | 10.87 | 10.39 |
| Mass flow (kg/h) | 495,135 | 32,628 | 25,513 | 3774 | 9114 | 106,595 | 60,537 | 9801 | 31,093 |
| Mass composition | |||||||||
| Liquid water | 0.000 | 0.000 | 0.000 | 0.000 | 0.000 | 0.000 | 0.000 | 0.000 | 0.000 |
| Water steam | 0.000 | 0.001 | 0.004 | 0.000 | 0.000 | 0.000 | 0.000 | 0.000 | 0.000 |
| Ammonia (Vapor phase) | 0.002 | 0.000 | 0.000 | 0.001 | 0.000 | 0.000 | 0.000 | 0.000 | 0.000 |
| Hydrogen sulfide (Vapor phase) | 0.005 | 0.000 | 0.000 | 0.015 | 0.000 | 0.000 | 0.000 | 0.000 | 0.000 |
| Hydrogen (Vapor phase) | 0.087 | 0.608 | 0.540 | 0.000 | 0.000 | 0.000 | 0.000 | 0.000 | 0.000 |
| Methane (Vapor phase) | 0.040 | 0.192 | 0.224 | 0.002 | 0.000 | 0.000 | 0.000 | 0.000 | 0.000 |
| LPG (Liquid phase) | 0.003 | 0.000 | 0.000 | 0.968 | 0.000 | 0.000 | 0.000 | 0.255 | 0.000 |
| LPG (Vapor phase) | 0.040 | 0.152 | 0.155 | 0.000 | 0.000 | 0.000 | 0.000 | 0.000 | 0.000 |
| Light Naphta (Liquid phase) | 0.003 | 0.000 | 0.000 | 0.013 | 0.000 | 0.000 | 0.000 | 0.703 | 0.000 |
| Light Naphta (Vapor phase) | 0.025 | 0.029 | 0.067 | 0.000 | 0.000 | 0.000 | 0.000 | 0.000 | 0.000 |
| Charge (Liquid phase) | 0.000 | 0.000 | 0.000 | 0.000 | 0.000 | 0.000 | 0.000 | 0.000 | 0.000 |
| Charge (Vapor phase) | 0.000 | 0.000 | 0.000 | 0.000 | 0.000 | 0.000 | 0.000 | 0.000 | 0.000 |
| Heavy Naphta (Liquid Phase) | 0.016 | 0.000 | 0.000 | 0.000 | 0.000 | 0.000 | 0.007 | 0.042 | 0.982 |
| Heavy Naphta (Vapor Phase) | 0.050 | 0.016 | 0.010 | 0.000 | 0.000 | 0.000 | 0.000 | 0.000 | 0.000 |
| Kerosene (Liquid phase) | 0.055 | 0.000 | 0.000 | 0.000 | 0.000 | 0.015 | 0.993 | 0.000 | 0.018 |
| Kerosene (Vapor phase) | 0.071 | 0.001 | 0.000 | 0.000 | 0.000 | 0.000 | 0.000 | 0.000 | 0.000 |
| Diesel (Liquid phase) | 0.167 | 0.000 | 0.000 | 0.000 | 0.000 | 0.959 | 0.000 | 0.000 | 0.000 |
| Diesel (Vapor phase) | 0.039 | 0.000 | 0.000 | 0.000 | 0.000 | 0.000 | 0.000 | 0.000 | 0.000 |
| UCO (Liquid phase) | 0.392 | 0.000 | 0.000 | 0.000 | 1.000 | 0.025 | 0.000 | 0.000 | 0.000 |
| UCO (Vapor phase) | 0.006 | 0.000 | 0.000 | 0.000 | 0.000 | 0.000 | 0.000 | 0.000 | 0.000 |
| Nitrogen (Vapor phase) | 0.000 | 0.000 | 0.000 | 0.000 | 0.000 | 0.000 | 0.000 | 0.000 | 0.000 |
| Oxygen (Vapor phase) | 0.000 | 0.000 | 0.000 | 0.000 | 0.000 | 0.000 | 0.000 | 0.000 | 0.000 |
| Carbon Dioxide (Vapor phase) | 0.000 | 0.000 | 0.000 | 0.000 | 0.000 | 0.000 | 0.000 | 0.000 | 0.000 |
| Carbon Monoxide (Vapor phase) | 0.000 | 0.000 | 0.000 | 0.000 | 0.000 | 0.000 | 0.000 | 0.000 | 0.000 |
| Methyldiethanolamine (Liquid phase) | 0.000 | 0.000 | 0.000 | 0.000 | 0.000 | 0.000 | 0.000 | 0.000 | 0.000 |
| 1.000 | 1.000 | 1.000 | 1.000 | 1.000 | 1.000 | 1.000 | 1.000 | 1.000 |
| Stream | Physical Exergy (MJ/h) | Chemical Exergy (MJ/h) |
|---|---|---|
| 1—Charge | 5879.95 | 10,386,290.72 |
| 3—Recycle Hydrogen | 90,823.93 | 1,996,917.04 |
| Air—1 | 10,340.72 | 245.50 |
| Fuel gas—1 | 57,371.85 | 3663.51 |
| 13—Quench hydrogen to Reaction Stage I | 123,030.01 | 2,903,214.98 |
| 17—Hydrocracked Hydrocarbons from Reaction Stage I | 280,533.41 | 14,867,259.35 |
| 18—UCO | 59,159.07 | 8,526,068.65 |
| Air—2 | 2542.79 | 60.37 |
| Fuel gas—2 | 4972.03 | 900.86 |
| 20—Quench hydrogen to Reaction Stage II | 30,666.59 | 723,658.44 |
| 21—Recycle hydrogen to Reaction Stage II | 91,346.71 | 2,008,377.59 |
| 23—Hydrocracked Hydrocarbons from Reaction Stage II | 168,973.98 | 11,171,370.30 |
| 24—Effluent of reactors | 448,804.63 | 26,037,710.54 |
| 30—Wash water | 495.78 | 1089.02 |
| 34—Sour water | 590.79 | 9907.72 |
| 35—Hydrocarbons from Recycle Gas Sweetening | 3691.87 | 4,497,309.68 |
| 38—Hydrocarbons from Recycle Gas Sweetening | 26.51 | 22,684.92 |
| 39—Poor Amine | 1027.09 | 669,458.17 |
| 40—Rich Amine | 870.34 | 724,018.20 |
| 41C—Recycle gas Cutter | 278,039.12 | 6,796,742.54 |
| 43—Recycle gas | 155,393.08 | 3,666,870.24 |
| Hydrogen to PSA Stage | 87,815.13 | 2,072,207.37 |
| 44—Recycle gas to Mixing II | 44,821.28 | 1,057,664.94 |
| 45—Make-up hydrogen | 78,531.54 | 2,947,722.12 |
| 52—Compressed Hydrogen | 136,160.01 | 2,947,730.08 |
| 54—Hydrogen to Separation II | 182,170.10 | 4,005,318.74 |
| 56—Hot flash gas from Recycle Gas Sweetening | 77,141.91 | 14,742,538.66 |
| 58—Wash water | 54.53 | 119.79 |
| 60—Cooled gas | 3009.96 | 455,829.67 |
| 62—Hydrocarbons with sour water | 4996.09 | 4,950,770.45 |
| 63—Sour water | 615.52 | 32,496.32 |
| 64—Overhead gas from Decantation | 282.38 | 10,116.98 |
| 68C—Gas Cutter | 3777.30 | 206,076.79 |
| 69—Poor Amine | 4413.24 | 228,925.93 |
| 70—Rich Amine | 15.31 | 29,990.44 |
| 71C—Residual gas Cutter | 10.03 | 3858.31 |
| Residues from PSA | 4372.02 | 225,166.73 |
| Hydrogen (Final Product) | 477.40 | 114,158.67 |
| 73—Hydrocarbons from Residual Gas Separation | 58,708.02 | 2,204,443.10 |
| 75—Hydrocarbons mix to Stripping Stage | 0.32 | 1011.99 |
| 77—Hot flash liquid | 15,800.66 | 4,773,518.44 |
| 78—Medium steam | 70,552.96 | 14,288,392.29 |
| 79—Sour water | 3451.94 | 2111.17 |
| 80—Sour gas | 6.26 | 1023.24 |
| 81—Naphta | 604.70 | 115,014.58 |
| 84—Sour water | 153.67 | 799,115.05 |
| 85—Sour gas | 0.00 | 0.55 |
| 87—Liquefied Petroleum Gas | 23.12 | 7605.37 |
| 88—Hydrocarbons from the Stripping Stage | 141,889.20 | 18,148,257.77 |
| Air—3 | 4126.08 | 97.96 |
| Fuel gas—3 | 8026.05 | 1461.79 |
| 93—Low steam | 2854.43 | 2018.86 |
| 97—UCO to FCC | 2908.38 | 419,160.27 |
| 104—Diesel | 138.24 | 5,015,731.21 |
| 109—Kerosene | 78.83 | 2,857,000.32 |
| 111—Recycling water | 127.58 | 164.51 |
| 112—Fuel gas | 0.16 | 32.42 |
| 114—Naphta to Naphta Separator | 5441.81 | 1,335,600.40 |
| 115—Light/Heavy Naphta | 500.97 | 610,235.07 |
| 117—Mixture to Naphta Separator | 957.41 | 1,945,255.25 |
| 119—Recycling water | 0.07 | 1.35 |
| 121—Light Naphta | 67.53 | 472,412.19 |
| 125—Heavy Naphta | 80.26 | 1,473,608.08 |
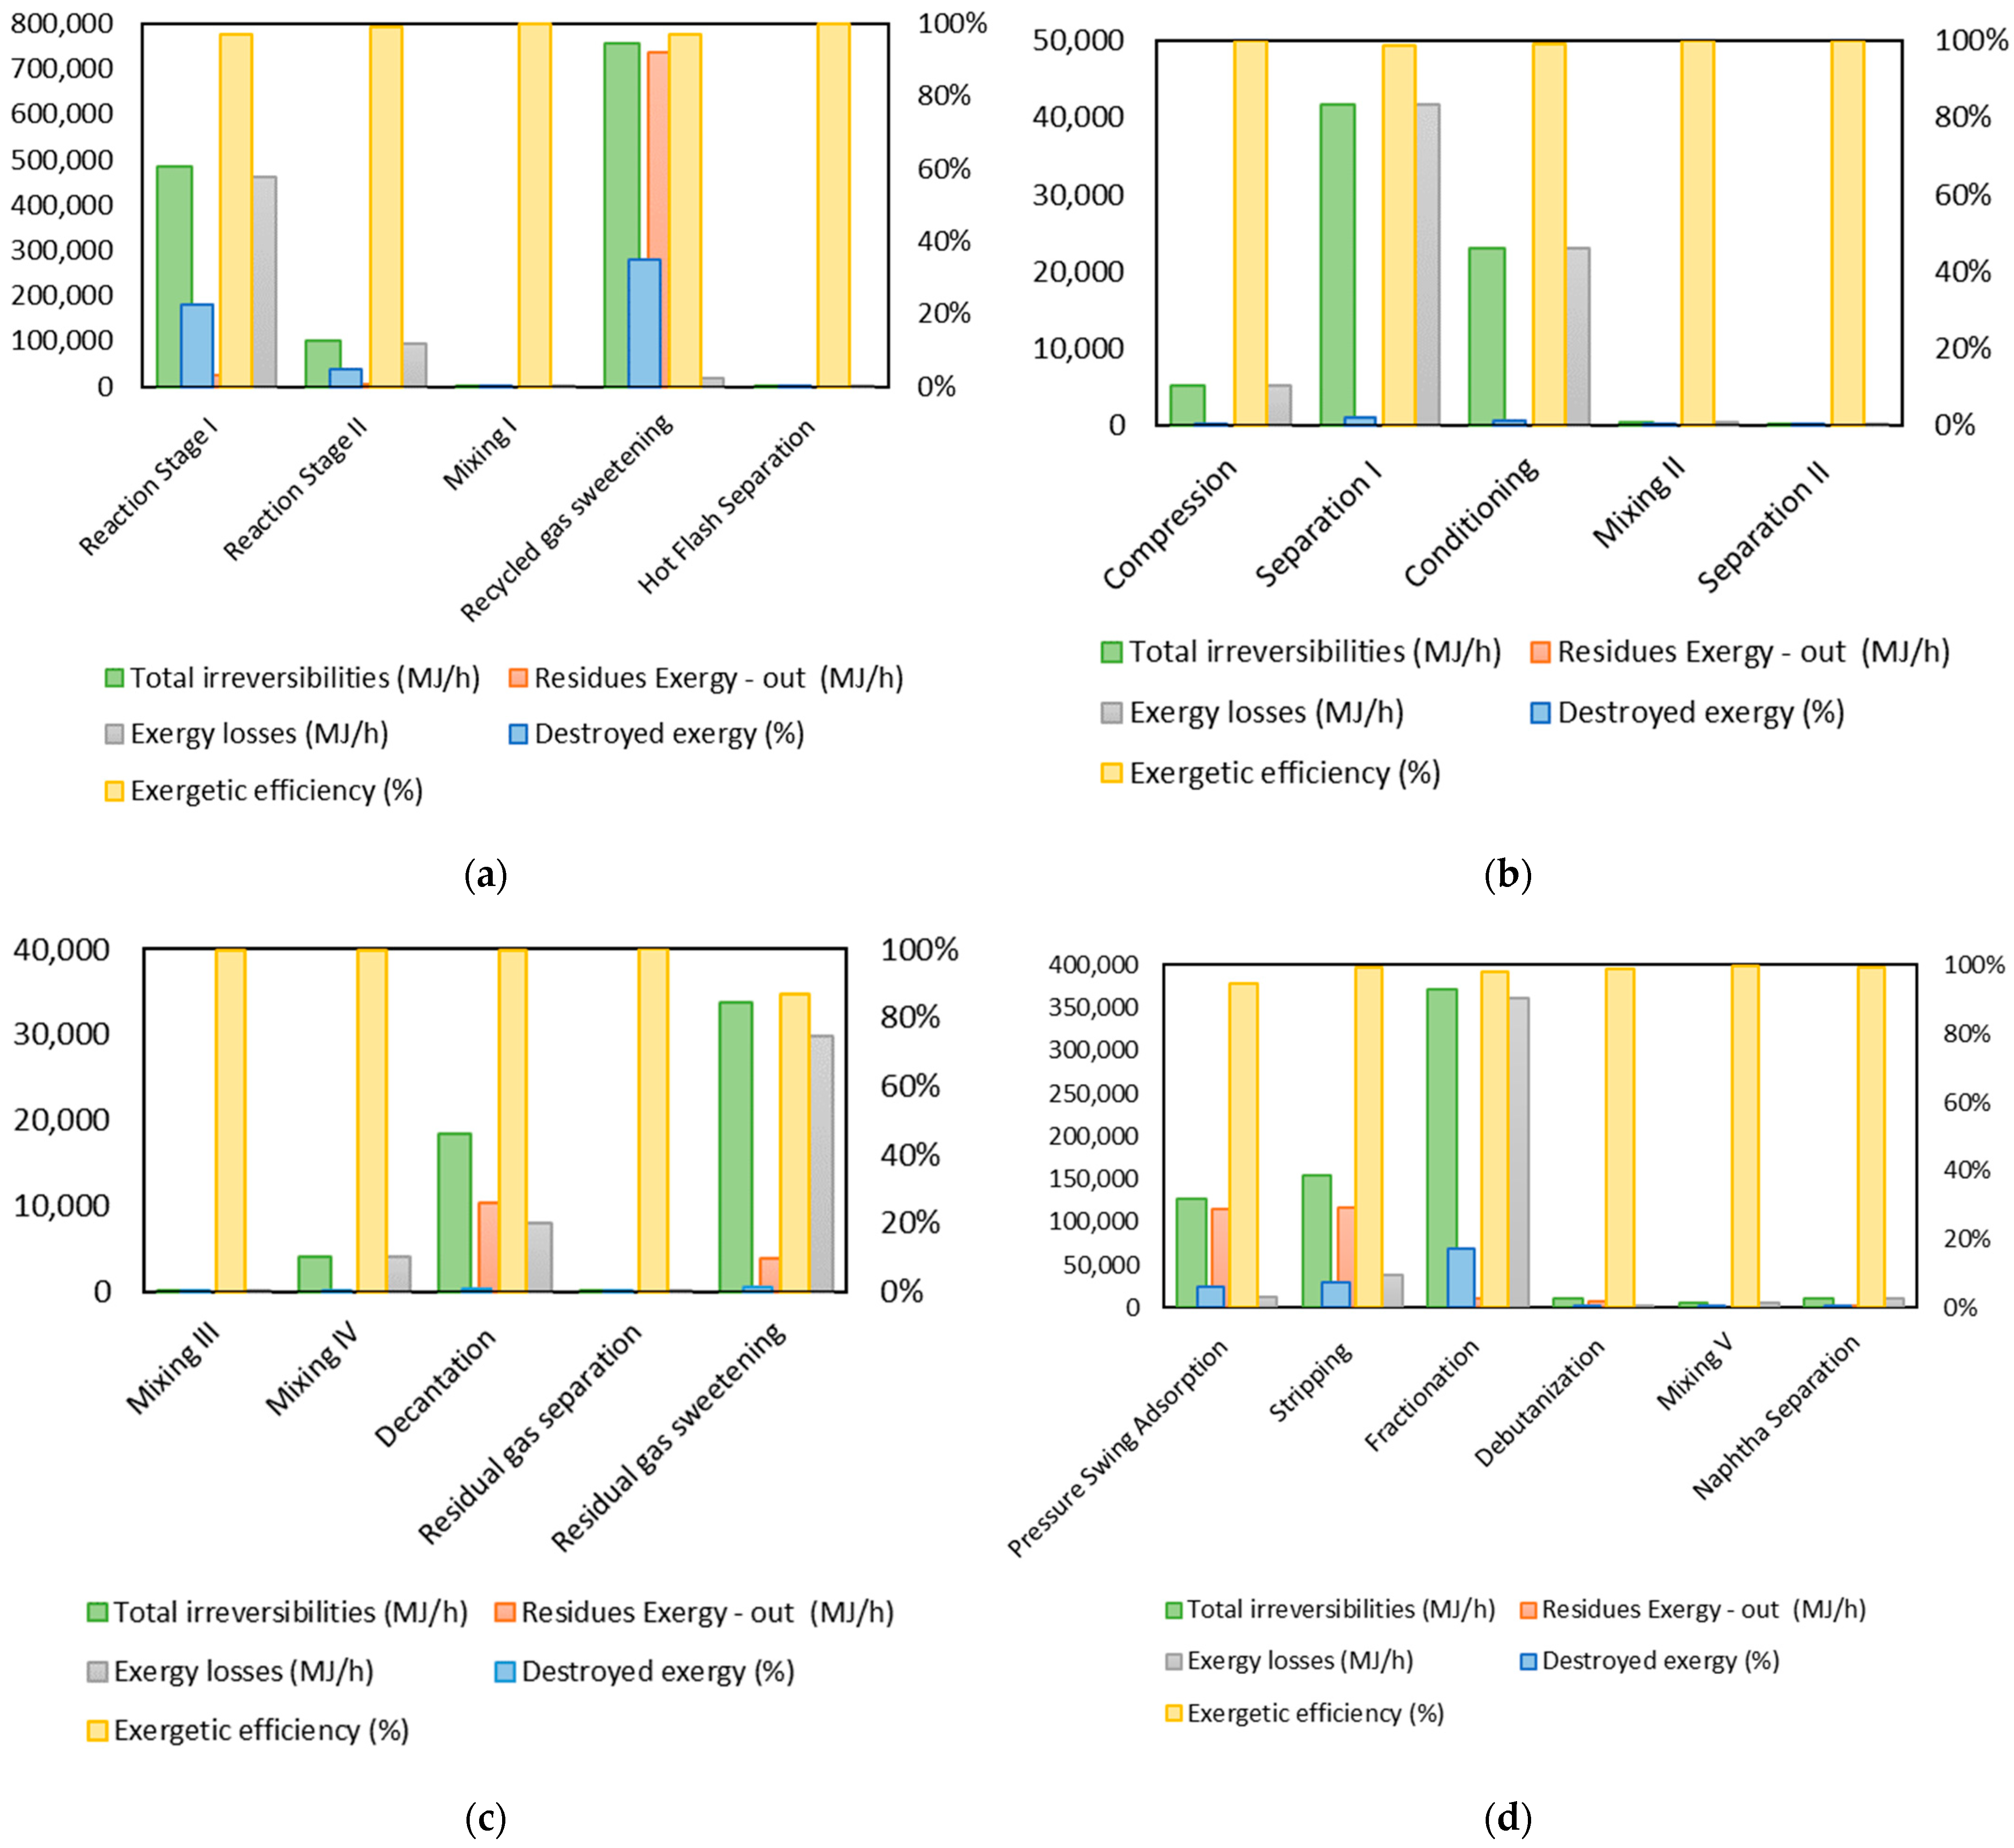
| Stage | (MJ/h) | (MJ/h) | Residues Exergy –Out (MJ/h) | Total Irreversibilities (MJ/h) | Destroyed Exergy (%) | Exergetic Efficiency (%) |
|---|---|---|---|---|---|---|
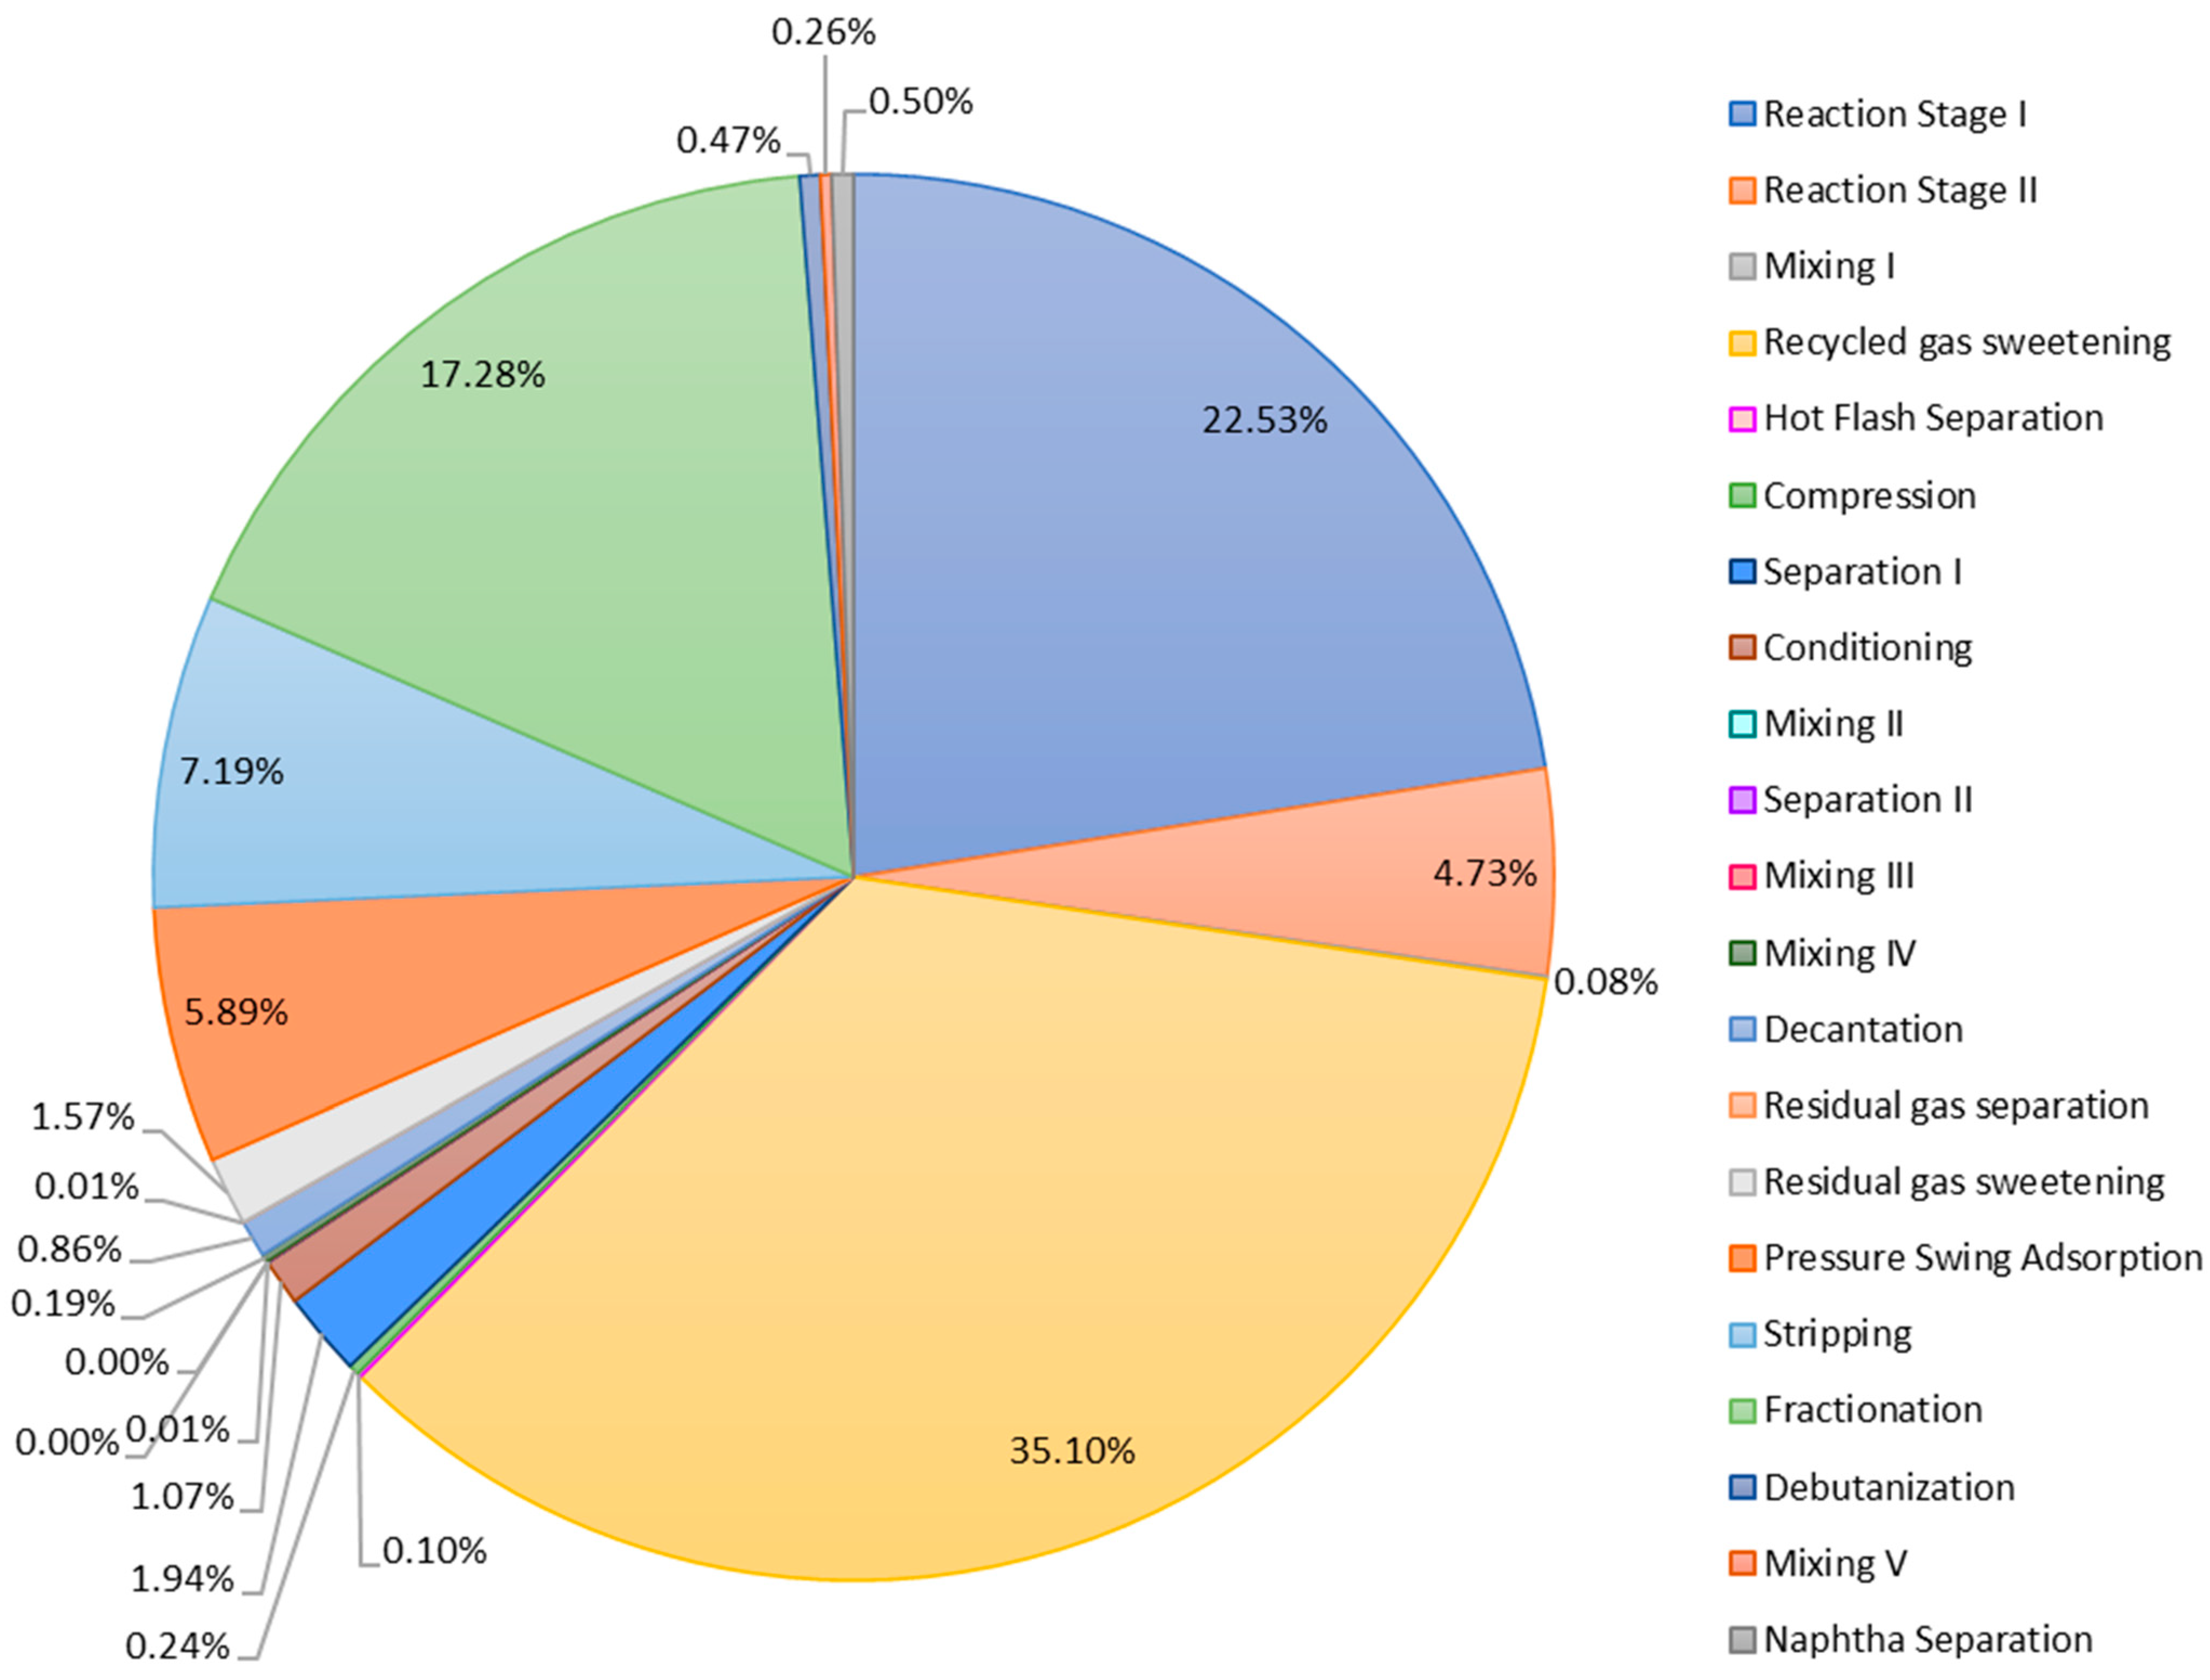
| Reaction Stage I | 6641.02 | 109,019.55 | 61,035.37 | 484,610.65 | 22.53% | 96.90% |
| Reaction Stage II | 0.00 | 196.14 | 5872.89 | 101,732.07 | 4.73% | 99.11% |
| Mixing I | 0.00 | 0.00 | 0,00 | 1621.87 | 0.08% | 99.99% |
| Recycle Gas Sweetening | 72.00 | 14,734.91 | 735,387.05 | 755,216.93 | 35.10% | 97.22% |
| Hot Flash Separation | 1.73 | 0.00 | 0.00 | 2071.74 | 0.10% | 99.99% |
| Compression | 15,195.91 | 0.00 | 0.00 | 5205.54 | 0.24% | 99.93% |
| Separation I | 0.00 | 0.00 | 0.00 | 41,693.29 | 1.94% | 98.91% |
| Conditioning | 80,613.13 | 0.00 | 0.00 | 22,976.70 | 1.07% | 99.26% |
| Mixing II | 0.00 | 0.00 | 0.00 | 306.90 | 0.01% | 99.99% |
| Separation II | 0.00 | 0.00 | 0.00 | 23.58 | 0.00% | 100.00% |
| Mixing III | 0.00 | 0.00 | 0.00 | 98.10 | 0.00% | 99.70% |
| Mixing IV | 0.00 | 0.00 | 0.00 | 4074.64 | 0.19% | 99.92% |
| Decantation | 0.00 | 27,701.84 | 10,399.36 | 18,419.34 | 0.86% | 99.63% |
| Residual Gas Separation | 0.00 | 0.00 | 0.00 | 121.31 | 0.01% | 99.95% |
| Residual Gas Sweetening | 0.00 | 0.00 | 3868.34 | 33,806.16 | 1.57% | 87.16% |
| Pressure Swing Adsorption | 0.00 | 214.61 | 114,636.07 | 126,624.74 | 5.89% | 94.70% |
| Stripping | 0.00 | 90,239.58 | 116,648.78 | 154,651.34 | 7.19% | 99.20% |
| Fractionation | 8951.68 | 284,788.73 | 9812.51 | 371,697.53 | 17.28% | 98.00% |
| Debutanization | 18.18 | 3147.94 | 7629.04 | 10,072.81 | 0.47% | 98.74% |
| Mixing V | 0.00 | 0.00 | 0.00 | 5565.60 | 0.26% | 99.71% |
| Naphtha Separation | 89.07 | 10,693.41 | 1.42 | 10,827.07 | 0.50% | 99.45% |
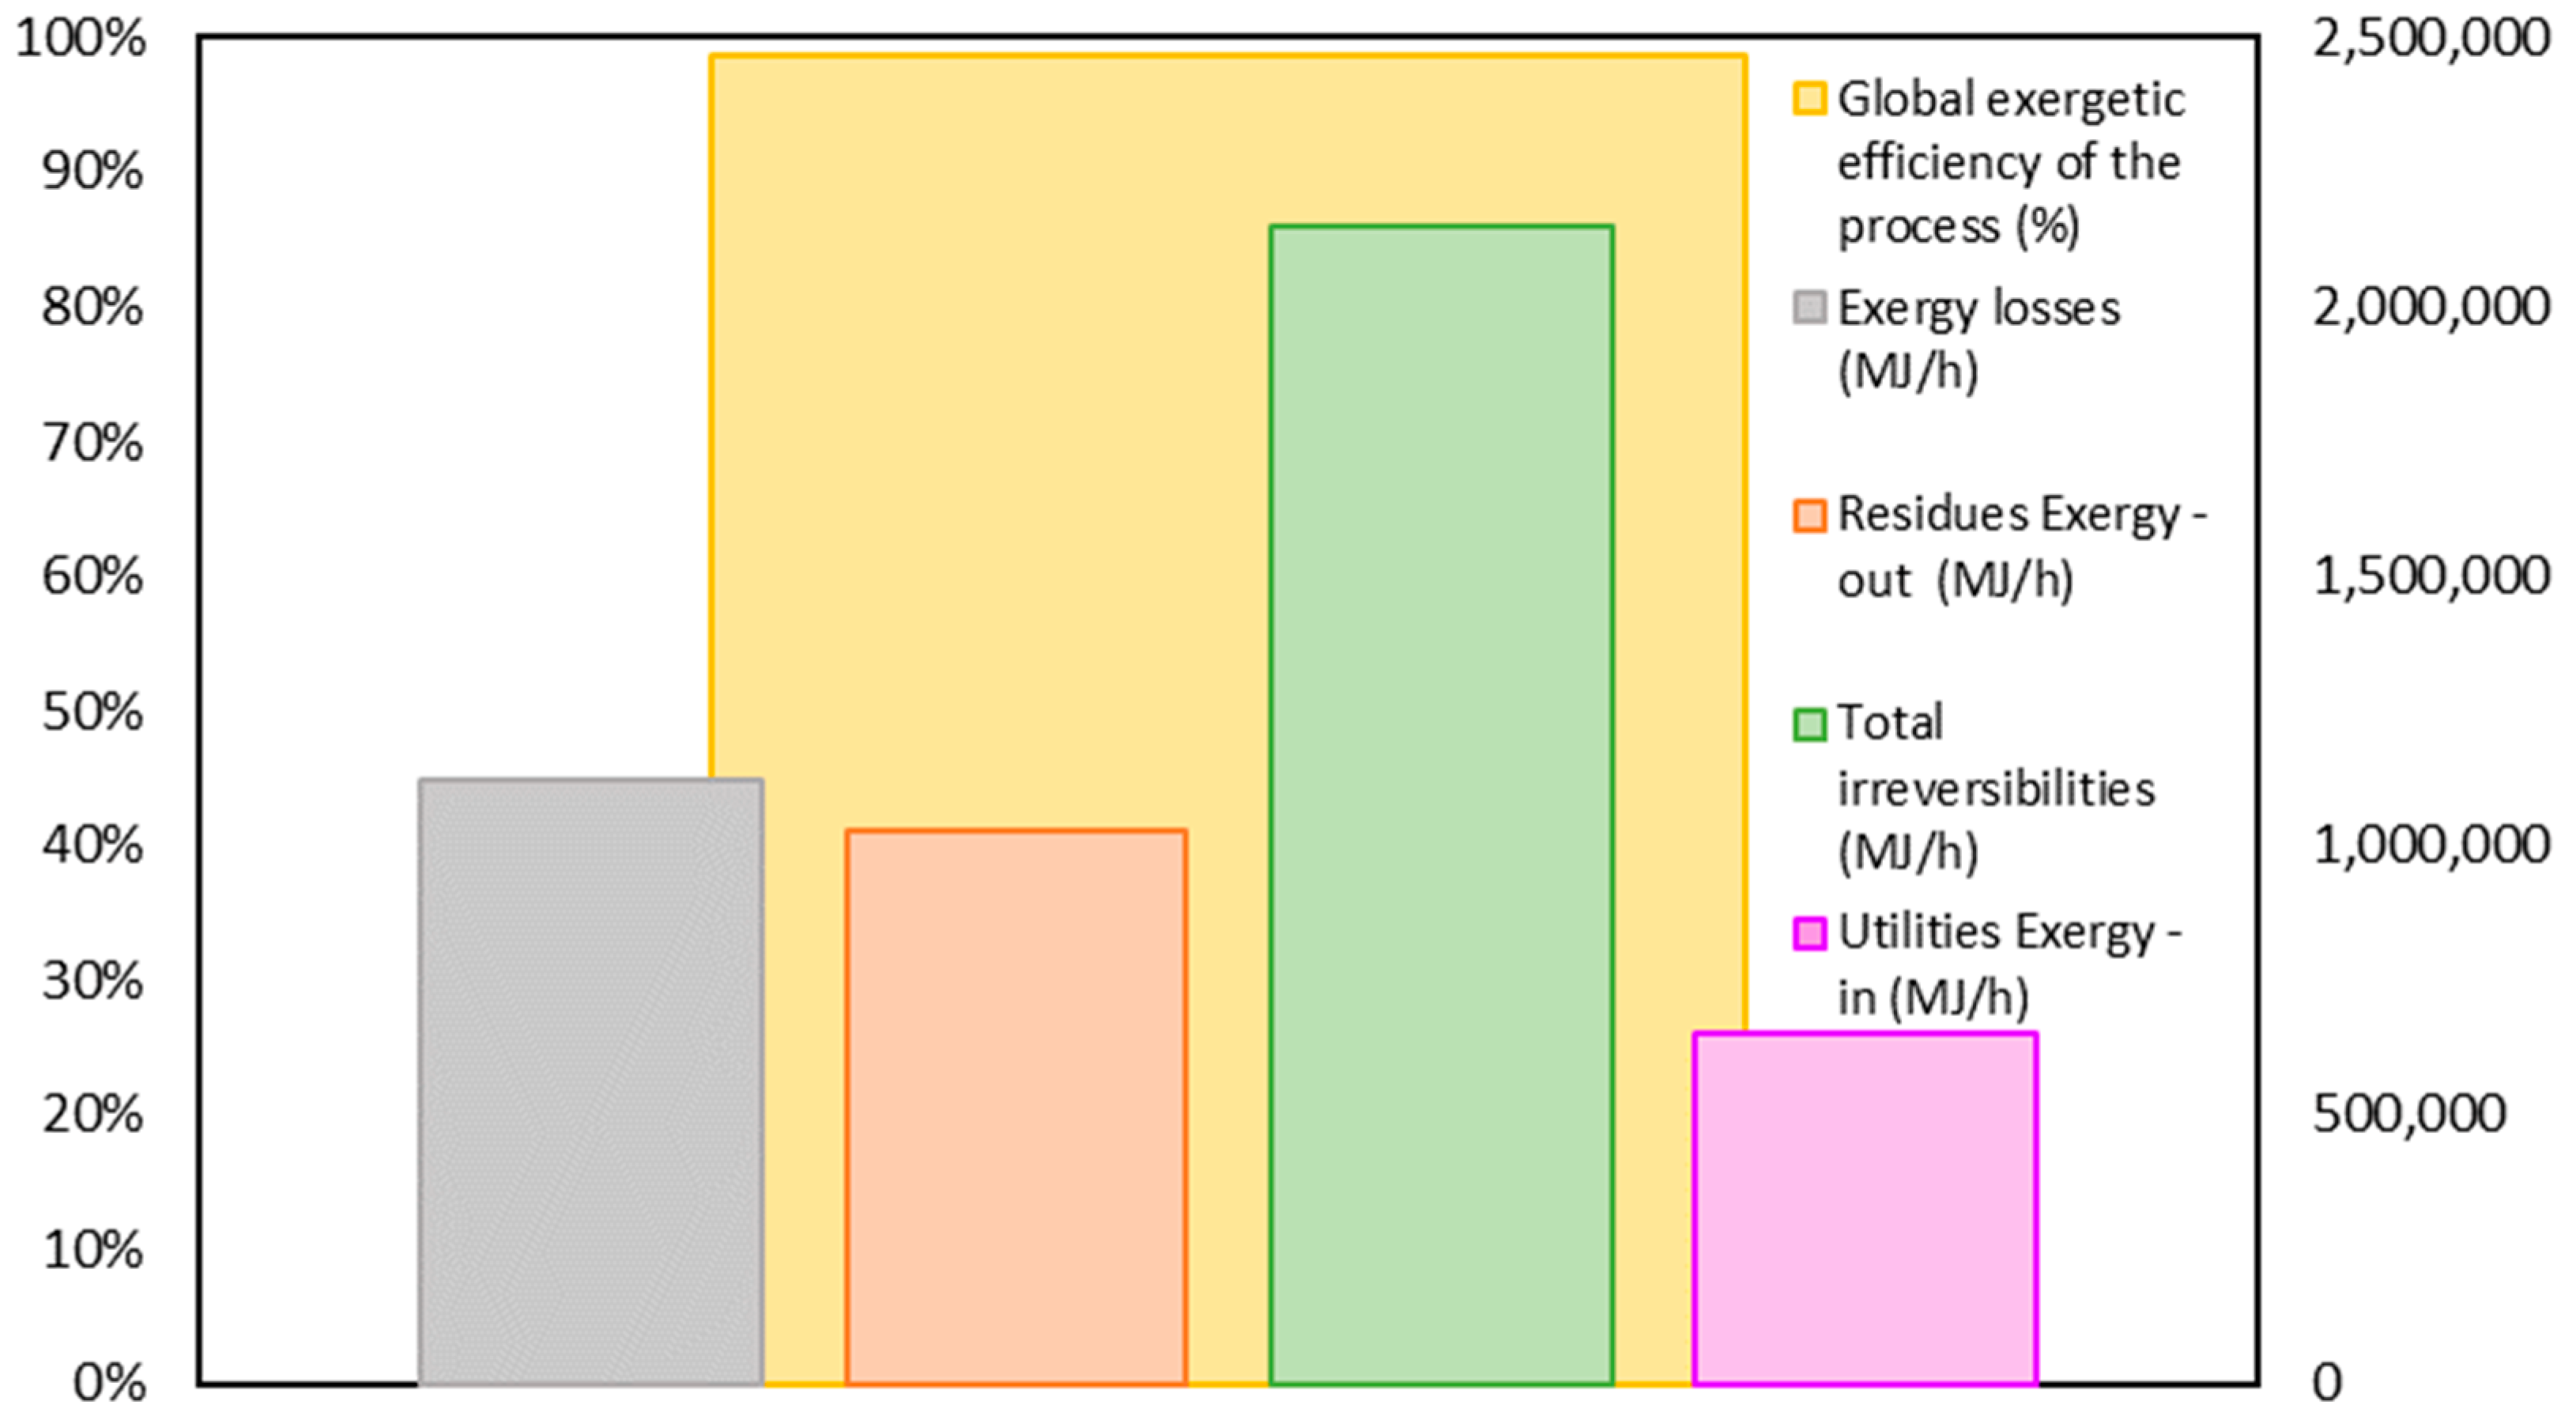
| Total | 111,582.72 | 540,736.7 | 1,065,290.83 | 2,151,417.91 | 100.00% |
Disclaimer/Publisher’s Note: The statements, opinions and data contained in all publications are solely those of the individual author(s) and contributor(s) and not of MDPI and/or the editor(s). MDPI and/or the editor(s) disclaim responsibility for any injury to people or property resulting from any ideas, methods, instructions or products referred to in the content. |
© 2025 by the authors. Licensee MDPI, Basel, Switzerland. This article is an open access article distributed under the terms and conditions of the Creative Commons Attribution (CC BY) license (https://creativecommons.org/licenses/by/4.0/).
Share and Cite
Acosta-Esalas, L.J.; González-Delgado, Á.D. Exergy Assessment and Exergetic Resilience of the Large-Scale Gas Oil Hydrocracking Process. Sci 2025, 7, 65. https://doi.org/10.3390/sci7020065
Acosta-Esalas LJ, González-Delgado ÁD. Exergy Assessment and Exergetic Resilience of the Large-Scale Gas Oil Hydrocracking Process. Sci. 2025; 7(2):65. https://doi.org/10.3390/sci7020065
Chicago/Turabian StyleAcosta-Esalas, Luisa José, and Ángel Darío González-Delgado. 2025. "Exergy Assessment and Exergetic Resilience of the Large-Scale Gas Oil Hydrocracking Process" Sci 7, no. 2: 65. https://doi.org/10.3390/sci7020065
APA StyleAcosta-Esalas, L. J., & González-Delgado, Á. D. (2025). Exergy Assessment and Exergetic Resilience of the Large-Scale Gas Oil Hydrocracking Process. Sci, 7(2), 65. https://doi.org/10.3390/sci7020065