1. Introduction
Thyroid diseases are among the most prevalent endocrine disorders, affecting millions of individuals globally. These conditions arise from dysfunctions in the thyroid gland—a critical regulator of metabolism, growth, and energy homeostasis through the secretion of hormones such as thyroxine (T4) and triiodothyronine (T3). The thyroid-stimulating hormone (TSH), produced by the pituitary gland, tightly controls their production. Disruptions in this hormonal balance can lead to two primary thyroid disorders: hypothyroidism (underactive thyroid) and hyperthyroidism (overactive thyroid). Hypothyroidism, characterised by insufficient hormone production, often results in fatigue, weight gain, and depression, whereas hyperthyroidism, marked by excessive hormone release, can cause weight loss, anxiety, and cardiovascular complications [
1].
The global burden of thyroid diseases is particularly high in regions with iodine deficiency [
2], as iodine is essential for thyroid hormone synthesis. However, even in iodine-sufficient areas, autoimmune disorders such as Hashimoto’s thyroiditis (leading to hypothyroidism) and Graves’ disease (causing hyperthyroidism) significantly contribute to thyroid dysfunction [
3]. Epidemiological studies indicate that thyroid disorders disproportionately affect women, with a prevalence nearly ten times higher than in men [
4]. While these conditions can occur at any age, they are most frequently diagnosed in individuals between 17 and 45 years, with peak incidence during a woman’s fourth or fifth decade of life [
5,
6]. Diagnosing thyroid diseases remains challenging due to overlapping symptoms with other conditions and the reliance on blood tests measuring TSH, T3, and T4 levels [
7]. Laboratory results can be influenced by noise, variability in testing methods, and individual physiological differences, leading to misdiagnosis or delayed detection [
8]. Alarmingly, studies indicate that patients often endure an average of 4.5 years before receiving an accurate thyroid disease diagnosis [
9].To address these diagnostic inefficiencies, this research leverages advanced machine learning (ML) and deep learning (DL) techniques to develop a robust classification model capable of distinguishing between different thyroid disease conditions. By integrating diverse ML algorithms, we aim to enhance diagnostic accuracy, reduce delays, and support clinicians in early and precise thyroid disease detection.
2. Related Work
The thyroid gland has the vital function of secreting active T3 and T4 hormones, which are necessary for controlling the metabolism of the body. Thyroid dysfunction can result in various forms of thyroid disorders, with hypothyroidism and hyperthyroidism being the most prevalent.
Hypothyroidism is characterised by the deficient production of thyroid hormones by the thyroid gland [
10]; in other words, there are high levels of TSH and lowered levels of T3 and T4. Common symptoms include increased body weight, exhaustion, heightened sensitivity to low temperatures, difficulty passing stool, and dry skin [
11].
Hyperthyroidism refers to a condition characterised by excessive production of thyroid hormones. In other words, there is a deficiency of TSH and an excess of T3 and T4. The symptoms encompass weight loss, heightened appetite, heart palpitations, intolerance to heat, anxiety, and additional manifestations [
11].
The major causes of thyroid diseases are malfunction of the autoimmune system [
12], inadequate levels of iodine in the body, exposure to radiation therapy, gland excision, and intake of medications like lithium, ageing and pregnancy [
13].
Thyroid diseases are normally diagnosed through traditional methods, using clinical examinations, laboratory blood tests, imaging techniques, and a fine needle aspiration (FNA) biopsy. Thyroid Function Tests (TFTs) are used to assess the levels of thyroid hormones (T3 and T4) and TSH in the blood. Variations in the normal range of T3, T4, and TSH, which are 80–200 ng/dL, 4.5–11.2 mcg/dL, and 0.4–4.0 mIU/L, respectively, may be an indication of hyperthyroidism or hypothyroidism.
In the diagnosis of thyroid disease, recent advancements have extended beyond traditional methods. The utilisation of advanced diagnostic methods involves machine learning, deep learning, and web-based system approaches that use computational algorithms to analyse diverse results or data obtained from traditional approaches and complex datasets. Consequently, they provide a more precise, efficient, and prompt diagnosis by identifying patterns studied within the data.
Bahaj et al. utilised FNAC to diagnose thyroid disease nodes in 314 patients from a tertiary referral centre in Makkah [
14]. The accuracy of the findings was 74.8%, with a specificity score of 82.1%. Over the years, numerous remarkable studies have been conducted in the field of medicine, utilising various machine learning methods, including the classification of thyroid diseases [
15]. Chen et al. identified ultrasonic traits associated with cancerous thyroid nodes using a combination of logistic lasso regression (LLR) and Random Forest (RF), which achieved an accuracy of 82% [
16].
Olatunji et al. utilised RF, SVM, NB and ANN techniques on data from Saudi Arabia for early categorisation of thyroid disease [
17]. They found RF to be most effective with 90.91% accuracy using seven features. Bordline synthetic oversampling approach (BL_SMOTE) was proposed in conjunction with ensemble classifiers, RF and DT, to predict thyroid disease [
18]. Sankar et al. assessed the efficacy of the XGBoost algorithm with that of LR, KNN, and DT for predicting thyroid disease. These algorithms were applied to the UCI thyroid dataset [
19]. XGBoostproved to be the best, with accuracy score of 98.59%.
Nugroho et al. utilised the MoRbAC approach in a web-based application to automatically classify malignant objects in ultrasound images [
20]. The application employed a streamlined Chan-Vese active contour model and image morphological procedures. After being tested on twenty images of thyroid lumps and breast lesions, the system achieved a precision of 98.75%.
N. Ananthi et al. employed reactJS to develop a web application that predicts six classes of thyroid diseases [
21]. The ResNet algorithm was applied to detect thyroid diseases, while the techniques of optimisation and loss minimisation were utilised to boost performance accuracy. The web app’s functionality involved inputting an X-ray image of the neck area into the web application, which then analyses the image using a pre-trained model based on a thyroid image dataset. A prediction of the thyroid type is then made based on the learned patterns.
Considering the discussion in the section above, the following research questions are examined in this research:
RQ1: Which biomarkers are the most significant contributors to classifying different types of thyroid diseases?
RQ2: How do resampling techniques impact models’ performance in accurately classifying thyroid diseases?
RQ3: How does the integration of a machine learning model into a web-based application enhance the prompt classification of thyroid disease?
3. Methodology
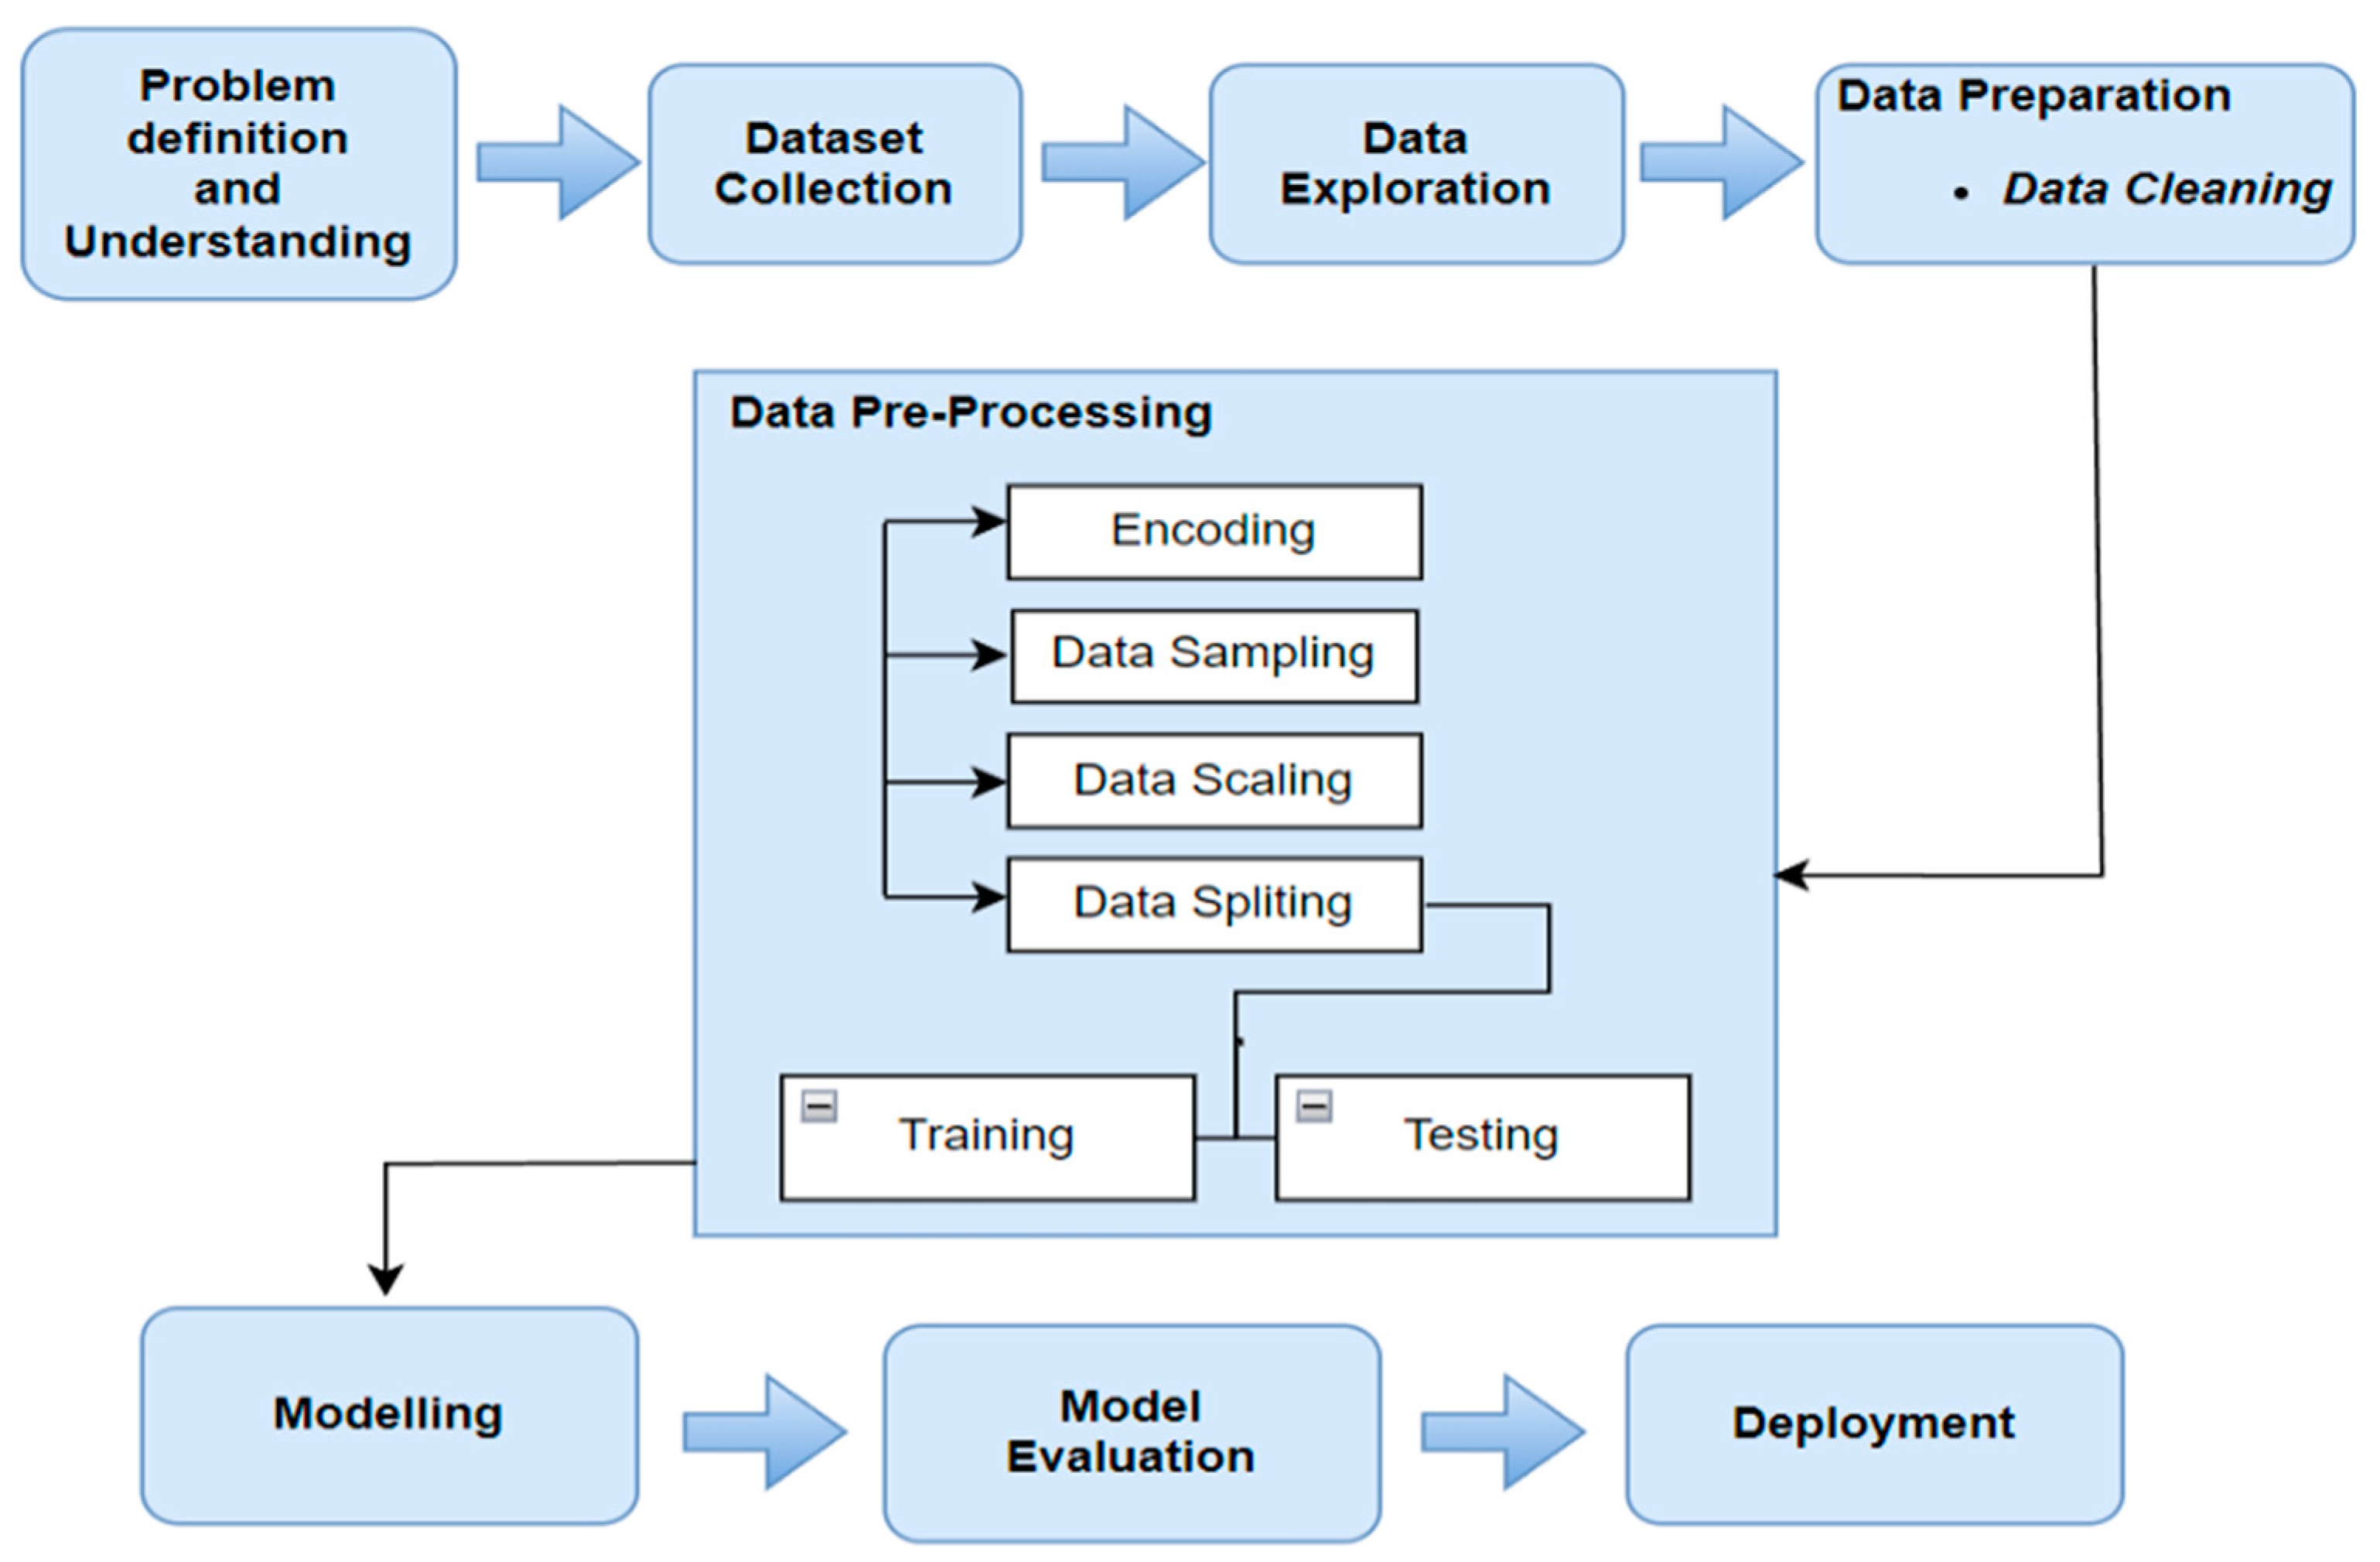
The methodology utilised in this project encompasses the multiple phases of the data science lifecycle. The proposed model designed for this project is presented in
Figure 1, which comprises nine distinct phases outlining the various tasks carried out in this study. It commences with problem understanding and progresses through data collection, culminating in the deployment of the model in a web-based application. The design of the model was specifically tailored to achieve a precise classification of thyroid diseases (TDs).
The thyroid disease dataset used for this research was obtained from Kaggle (
https://www.kaggle.com/datasets/emmanuelfwerr/thyroid-disease-data accessed on 12 October 2023), comprising 9172 patient observations and 31 attributes. The dataset comprises a consolidated compilation of thyroid illness records sourced from the UCI repository. The dataset is deemed appropriate for this research because of the significant number of patients’ records and limited prior research on it. The dataset is explicitly designed for classification, making it ideal for developing models to diagnose thyroid conditions. Its multivariate nature allows for complex analysis of patient data, aligning with health and medicine research needs. It offers robust characteristics and significant advantages for thyroid disease research. Because is open access, it allows for open collaboration, reproducibility, and extension to other medical datasets.
Table 1 provides details about the attributes of the data.
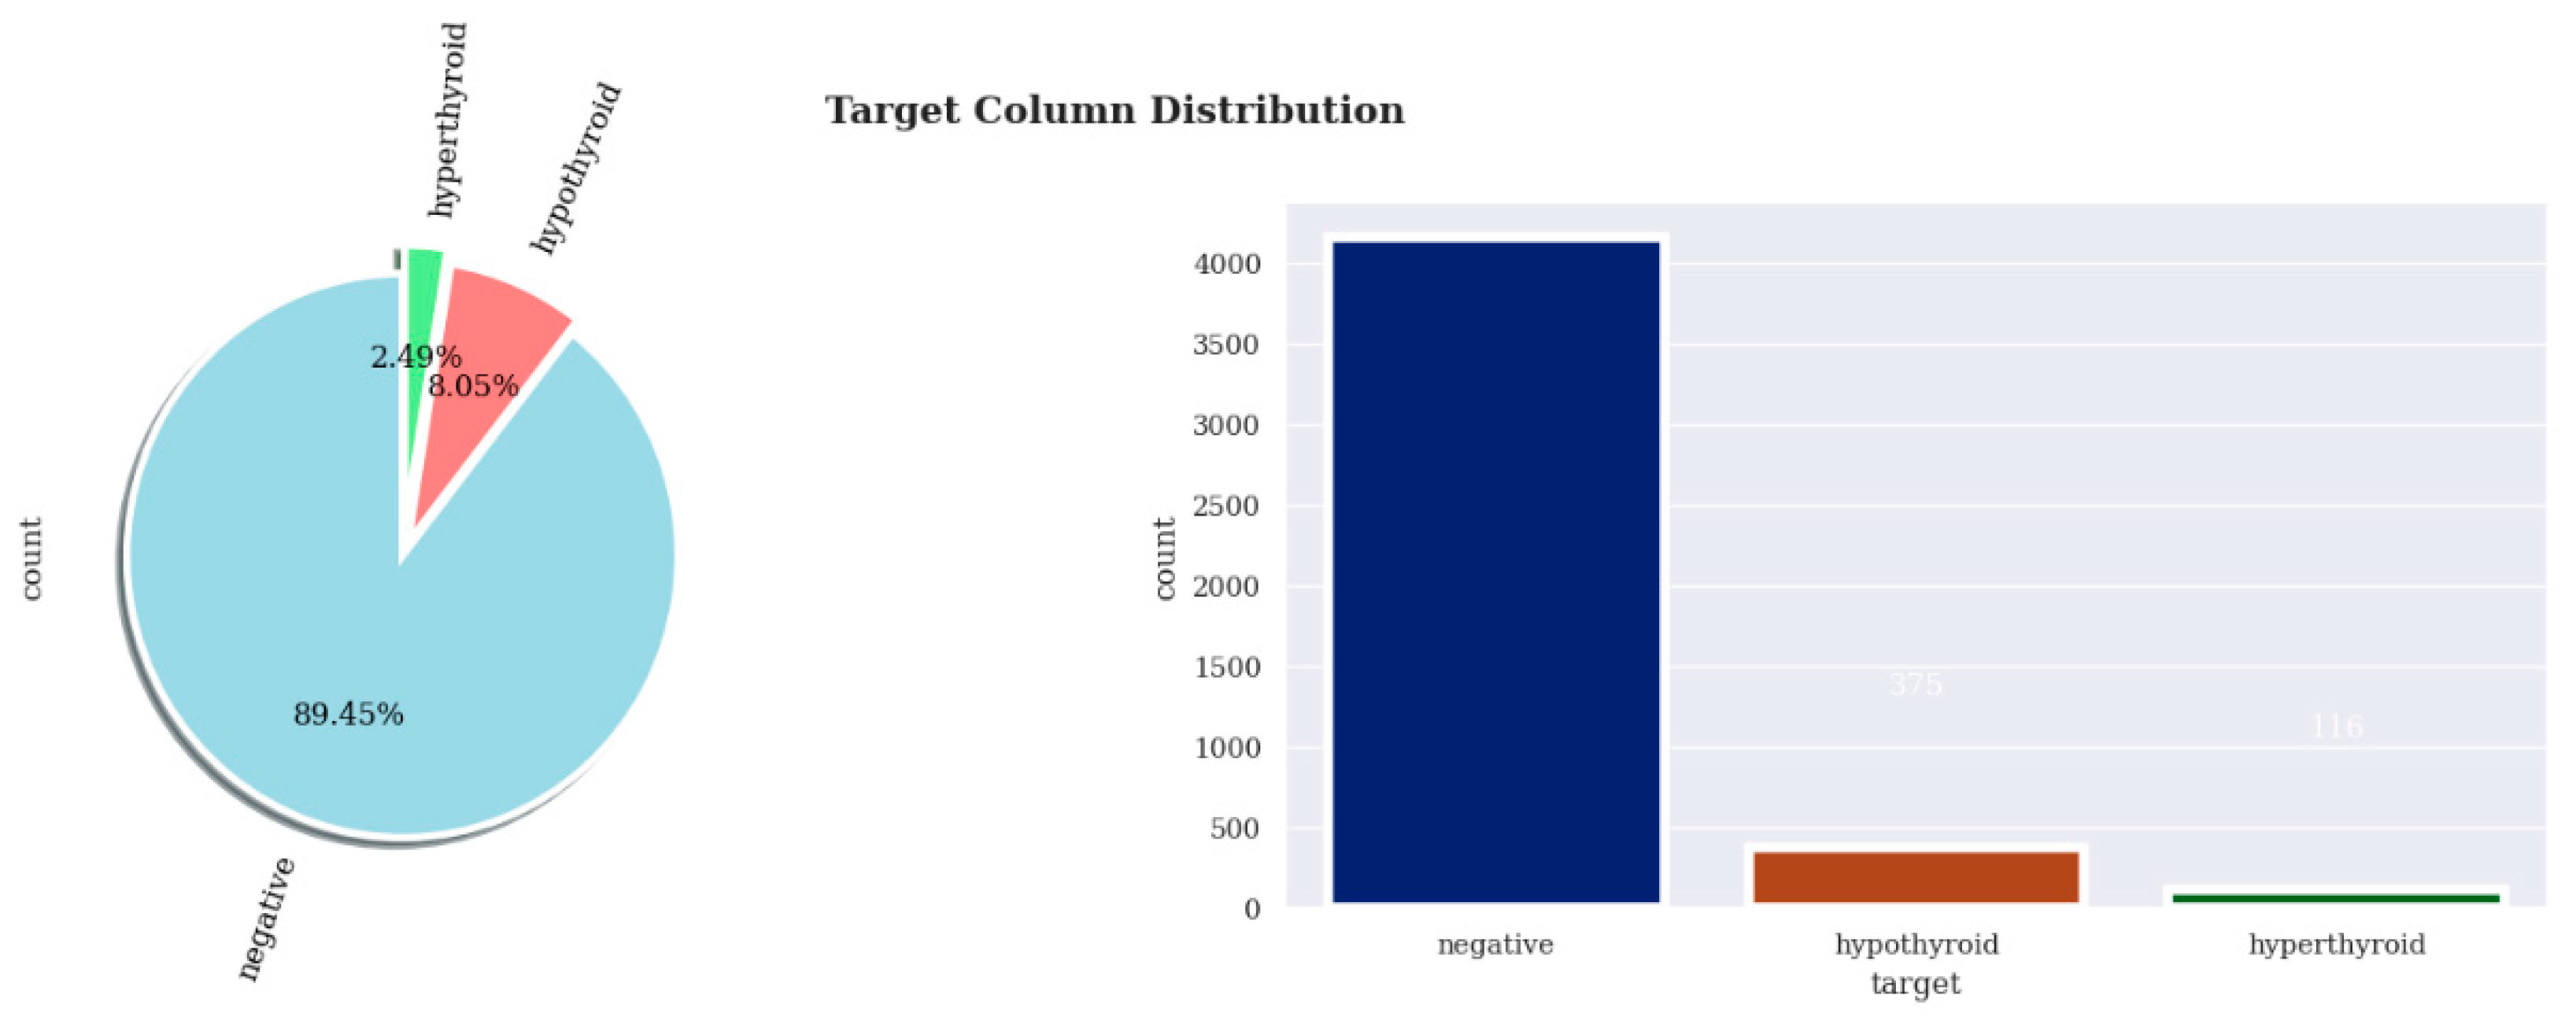
The dataset’s target feature comprises a range of medical diagnoses related to thyroid disease. However, for the purpose of this research, only patient cases with diagnoses classified as “negative”, “hypothyroid”, or “hyperthyroid” are taken into account. “Negative” signifies that a patient does not have any signs of thyroid disease. In the execution of the models, 22 attributes are utilised, comprising sixteen (16) categorical variables and six (6) continuous variables. In the data-cleaning step, the target variables were appropriately mapped to their respective classes, ensuring a refined and prepared dataset for subsequent model implementation. Firstly, categorical features were encoded into numerical values, and then the data were standardised using Standardscaler (z-score normalisation). Resolving the issue of data imbalance was also a crucial aspect of the preprocessing phase. Resampling techniques were utilised to address the significant imbalance and unequal distribution of classes in the target variable of the dataset. The purpose of this strategic intervention was to synchronise the distribution and ensure an unbiased representation of the target variable. The data were partitioned into model training and model testing, with 80% of the data assigned to model training and the remaining 20% assigned to the testing dataset.
The label-encoding technique was utilised by assigning a distinct label to a categorical variable with an integer value. In machine learning, data resampling methods are often applied to address the issue of class imbalance in a dataset [
22]. An unbalanced dataset is characterised by a significant difference in instances between one target class label and the other(s). In this project’s work, the dataset is highly imbalanced. The target variable consists of three classes: “negative”, which accounts for 89.45% of observations in the dataset; “hypothyroid”, with 8.05% of the observations; and “hyperthyroid”, with just 2.49% of the observations. Resampling techniques are used to resolve the class imbalance in the target variable under consideration.The dataset was standardisedusing the “StandardScaler” method, which applies z-score normalisation to ensure a consistent scale. The StandardScaler function transforms each feature in a dataset, setting the average value to zero and the standard deviation value to one.
Flask is recognised for its lightweight nature and user-friendly characteristics, without relying on specific database libraries or tools to function [
23]. In this study, flask is employed in conjunction with Bootstrap, HTML, and CSS for the website’s design. Flask is employed for backend development, whereas Bootstrap is utilised for frontend user interface design. The trained model is stored in a pickle file, indicating that the objects undergo transformation into a byte stream before being stored in a file or database.
Figure 2 shows the flask framework’s architectural configuration, which illustrates the interaction between the website and the trained model in the pickle file.
4. Implementation and Results
The implementation of the proposed model commenced with configuring all the libraries, modules, and functions in the Visual Studio Code IDE 2022. Subsequently, the data were imported into the programme using the Pandas library. Following data loading, the exploratory data analysis (EDA) commenced using several python visualisation packages, including Seaborn, Matplotlib, and the python function. These tools were employed to analyse and visually represent the correlation between different features within the datasets. During the exploratory data analysis (EDA) phase, univariate [
24], bivariate, and multivariate analyses were conducted to better understand the data’s characteristics. These analyses were then visualised to enhance our insights further. The subsequent stages of implementation entailed data preparation for modelling, which encompassed removing outliers, scaling the data, and addressing the problem of data imbalance through resampling techniques such as oversampling and undersampling. It was also crucial to address the data imbalance issue, as it can adversely affect the predictive performance of the models.
The dataset was partitioned into distinct training and testing datasets for modelling without data sampling. Additional splitting was performed to model the resampled data. The data underwent training and testing procedures utilising the five models. Hyperparameter tuning was employed to optimise the model’s performance and alleviate the issues related to overfitting. The model’s performance was subsequently evaluated using accuracy, precision, recall, F1-Score, and ROC metrics. The importance of the most efficient features for the best-performing algorithm was determined and utilised as input data for the web application in predicting and classifying thyroid disease.
4.1. Exploratory Data Analysis
4.1.1. Univariate Analysis
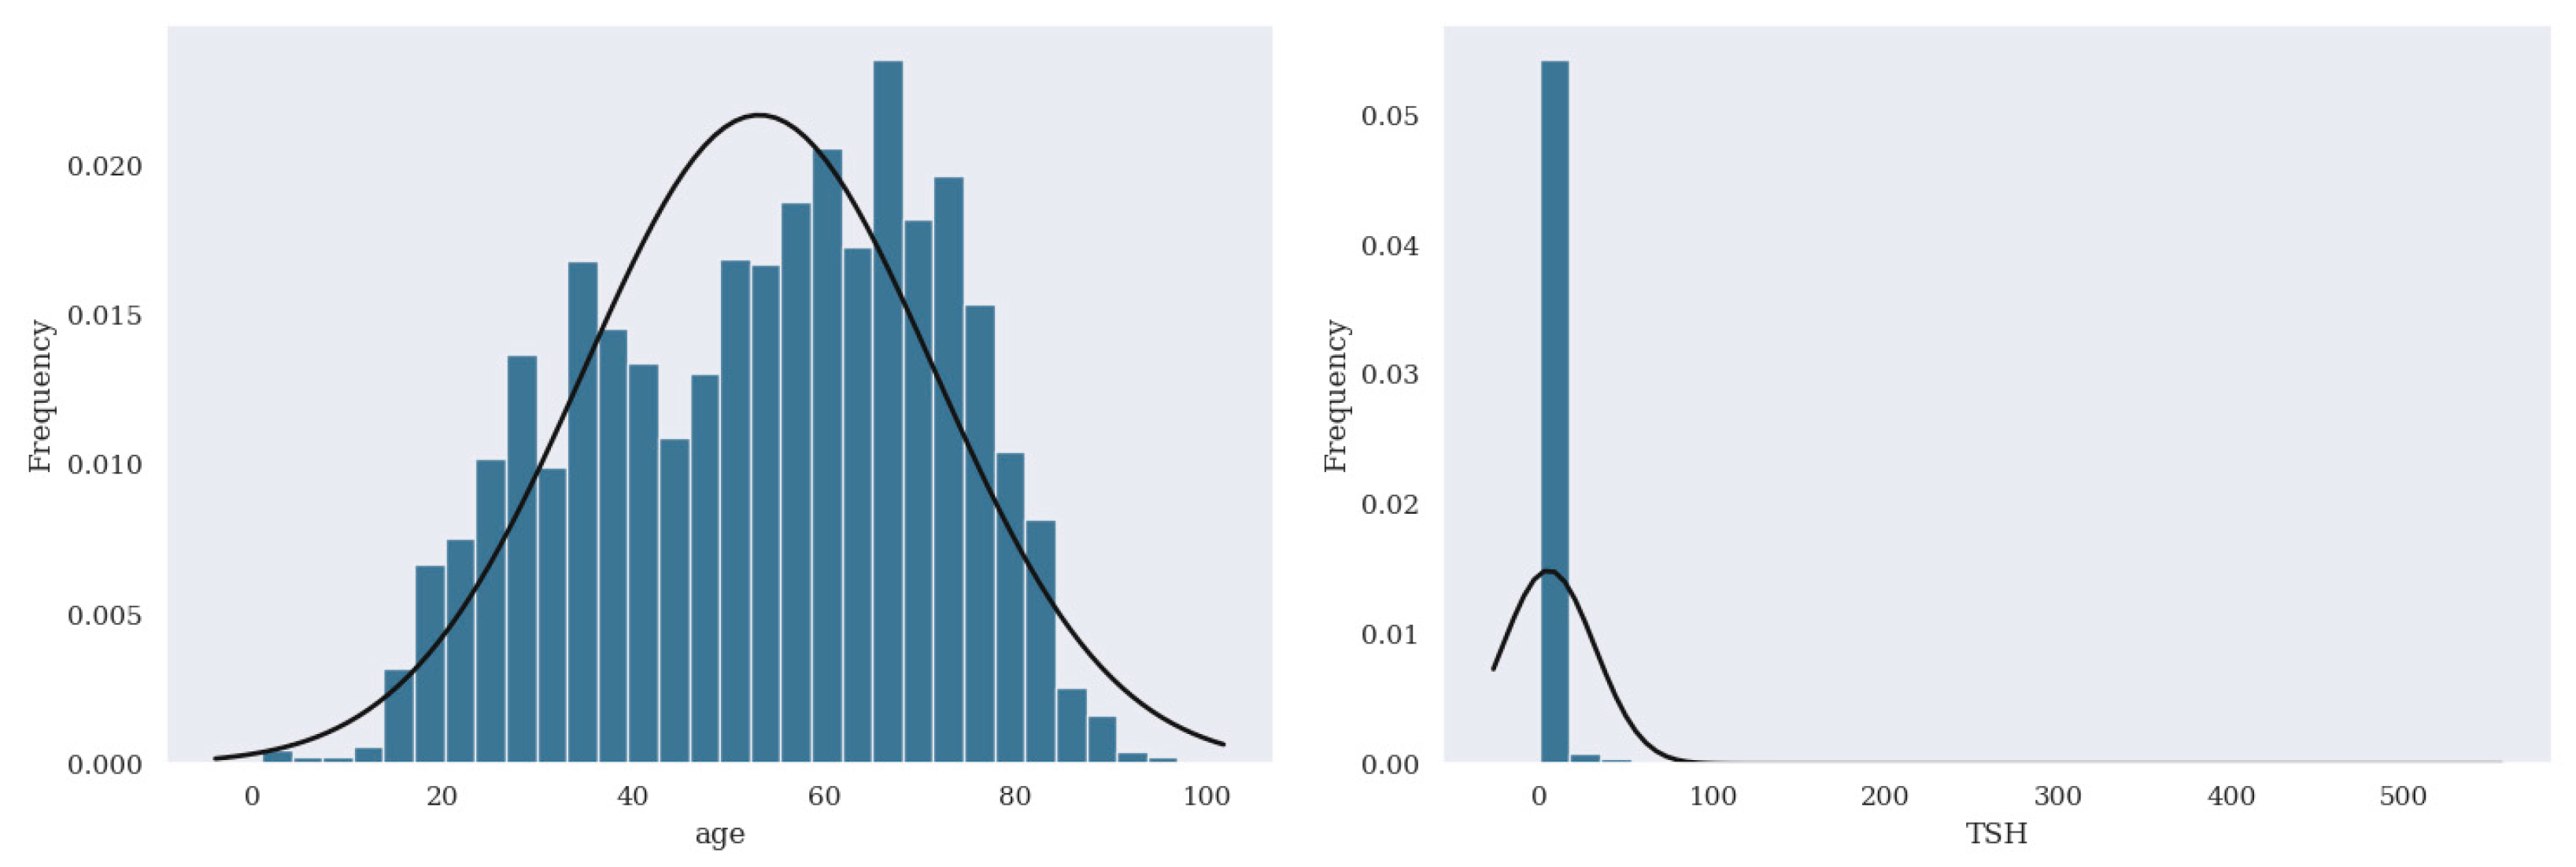
Univariate analysis involves statistically examining and visually representing the distribution of and variability in a single variable at a time [
24].
Figure 3 displays the histogram distribution of the numerical variables or features in the dataset. The distribution of Age and T4U was found to be approximately normal, with the majority of the data concentrated around the mean at the centre. Nevertheless, TSH, T3, and FTI exhibited a positively skewed distribution, with most data concentrated on the lower values. This suggests that the average value is higher than the median value.
4.1.2. Bivariate Analysis
Bivariate analysis [
25] involves the concurrent analysis of two features of a dataset in order to ascertain the relationship or correlation between the two variables. In this study, bivariate analysis was carried out by examining the target variable, which comprises the categories of thyroid disease, against other features in the dataset.
4.2. Model Performance
This study employed five classification models to classify thyroid diseases accurately. The model’s performance was assessed using assessment metrics such as accuracy (ACC), precision (PREC), recall, F1-Score, and ROC curve.
The first modelling experiment was the application of classification models to the imbalanced dataset depicted in
Figure 4.
Table 2 shows the performance of each classifier model across various evaluation metrics using the identified optimal hyperparameters. Notably, the Decision Tree classifier (DTC) achieved the highest accuracy of 99.46%, surpassing all other classifiers. However, when dealing with imbalanced data, it is advisable not to rely solely on the accuracy score; the F1-Score can be used as it considers the mean of precision and recall. DTC remains the highest-performing classifier based on the F1-Score at 99.45%.
The SMOTE oversampling technique was employed to augment the instances in the minority class of the target variable. The new distribution of the target class after oversampling is depicted in
Figure 5.
Table 3 presents the performance metrics of various classifier models evaluated with optimal hyperparameters. The Gradient Boosting Classifier (GBC) outperforms all other models, achieving an impressive accuracy and an F1-Score of 99.76%. This highlights the superior effectiveness of the GBC in this context, making it the most reliable model among those tested.
The risk of overfitting brought on by duplication is an inherent limitation of this method. The Gradient Boosting Classifier’s (GBC) performance surpasses that of all other classifiers with an accuracy and F1-Score of 99.76%.
In this last modelling experiment, the classification models were applied to the undersampled data. The random undersampling technique was utilised to decrease the number of instances in the majority class—the new distribution of the target class after undersampling is shown in
Figure 6. Once again, the Gradient Boosting Classifier (GBC) outperforms all other classifiers, achieving the highest accuracy and F1-Score of 99.14% and 99.13%, respectively.
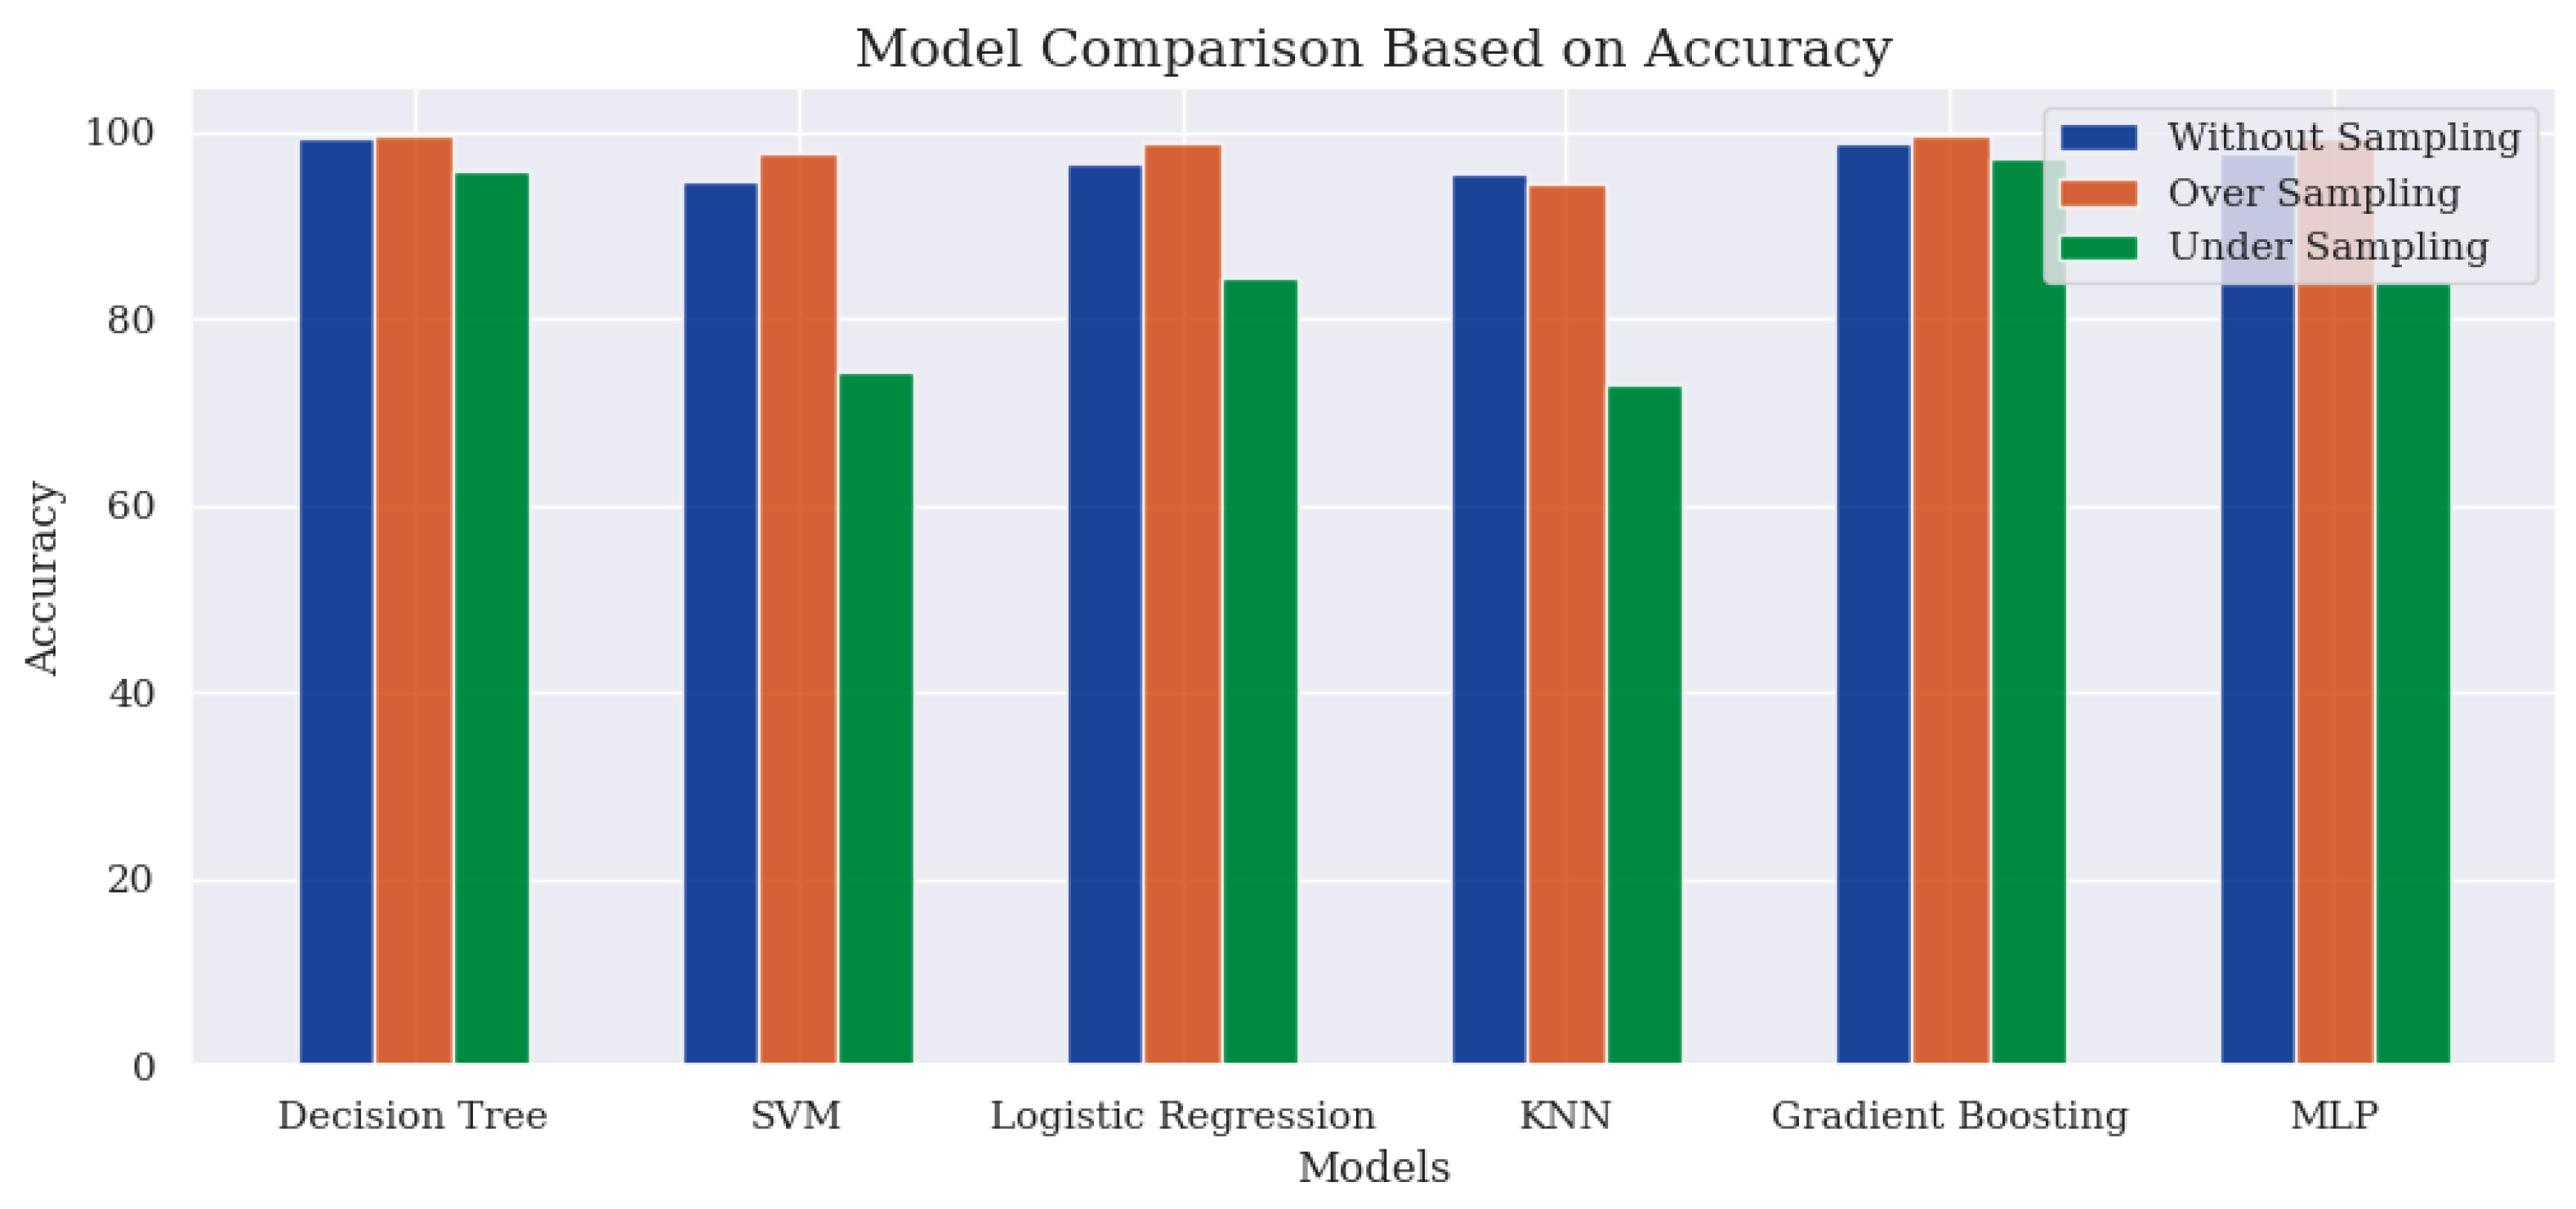
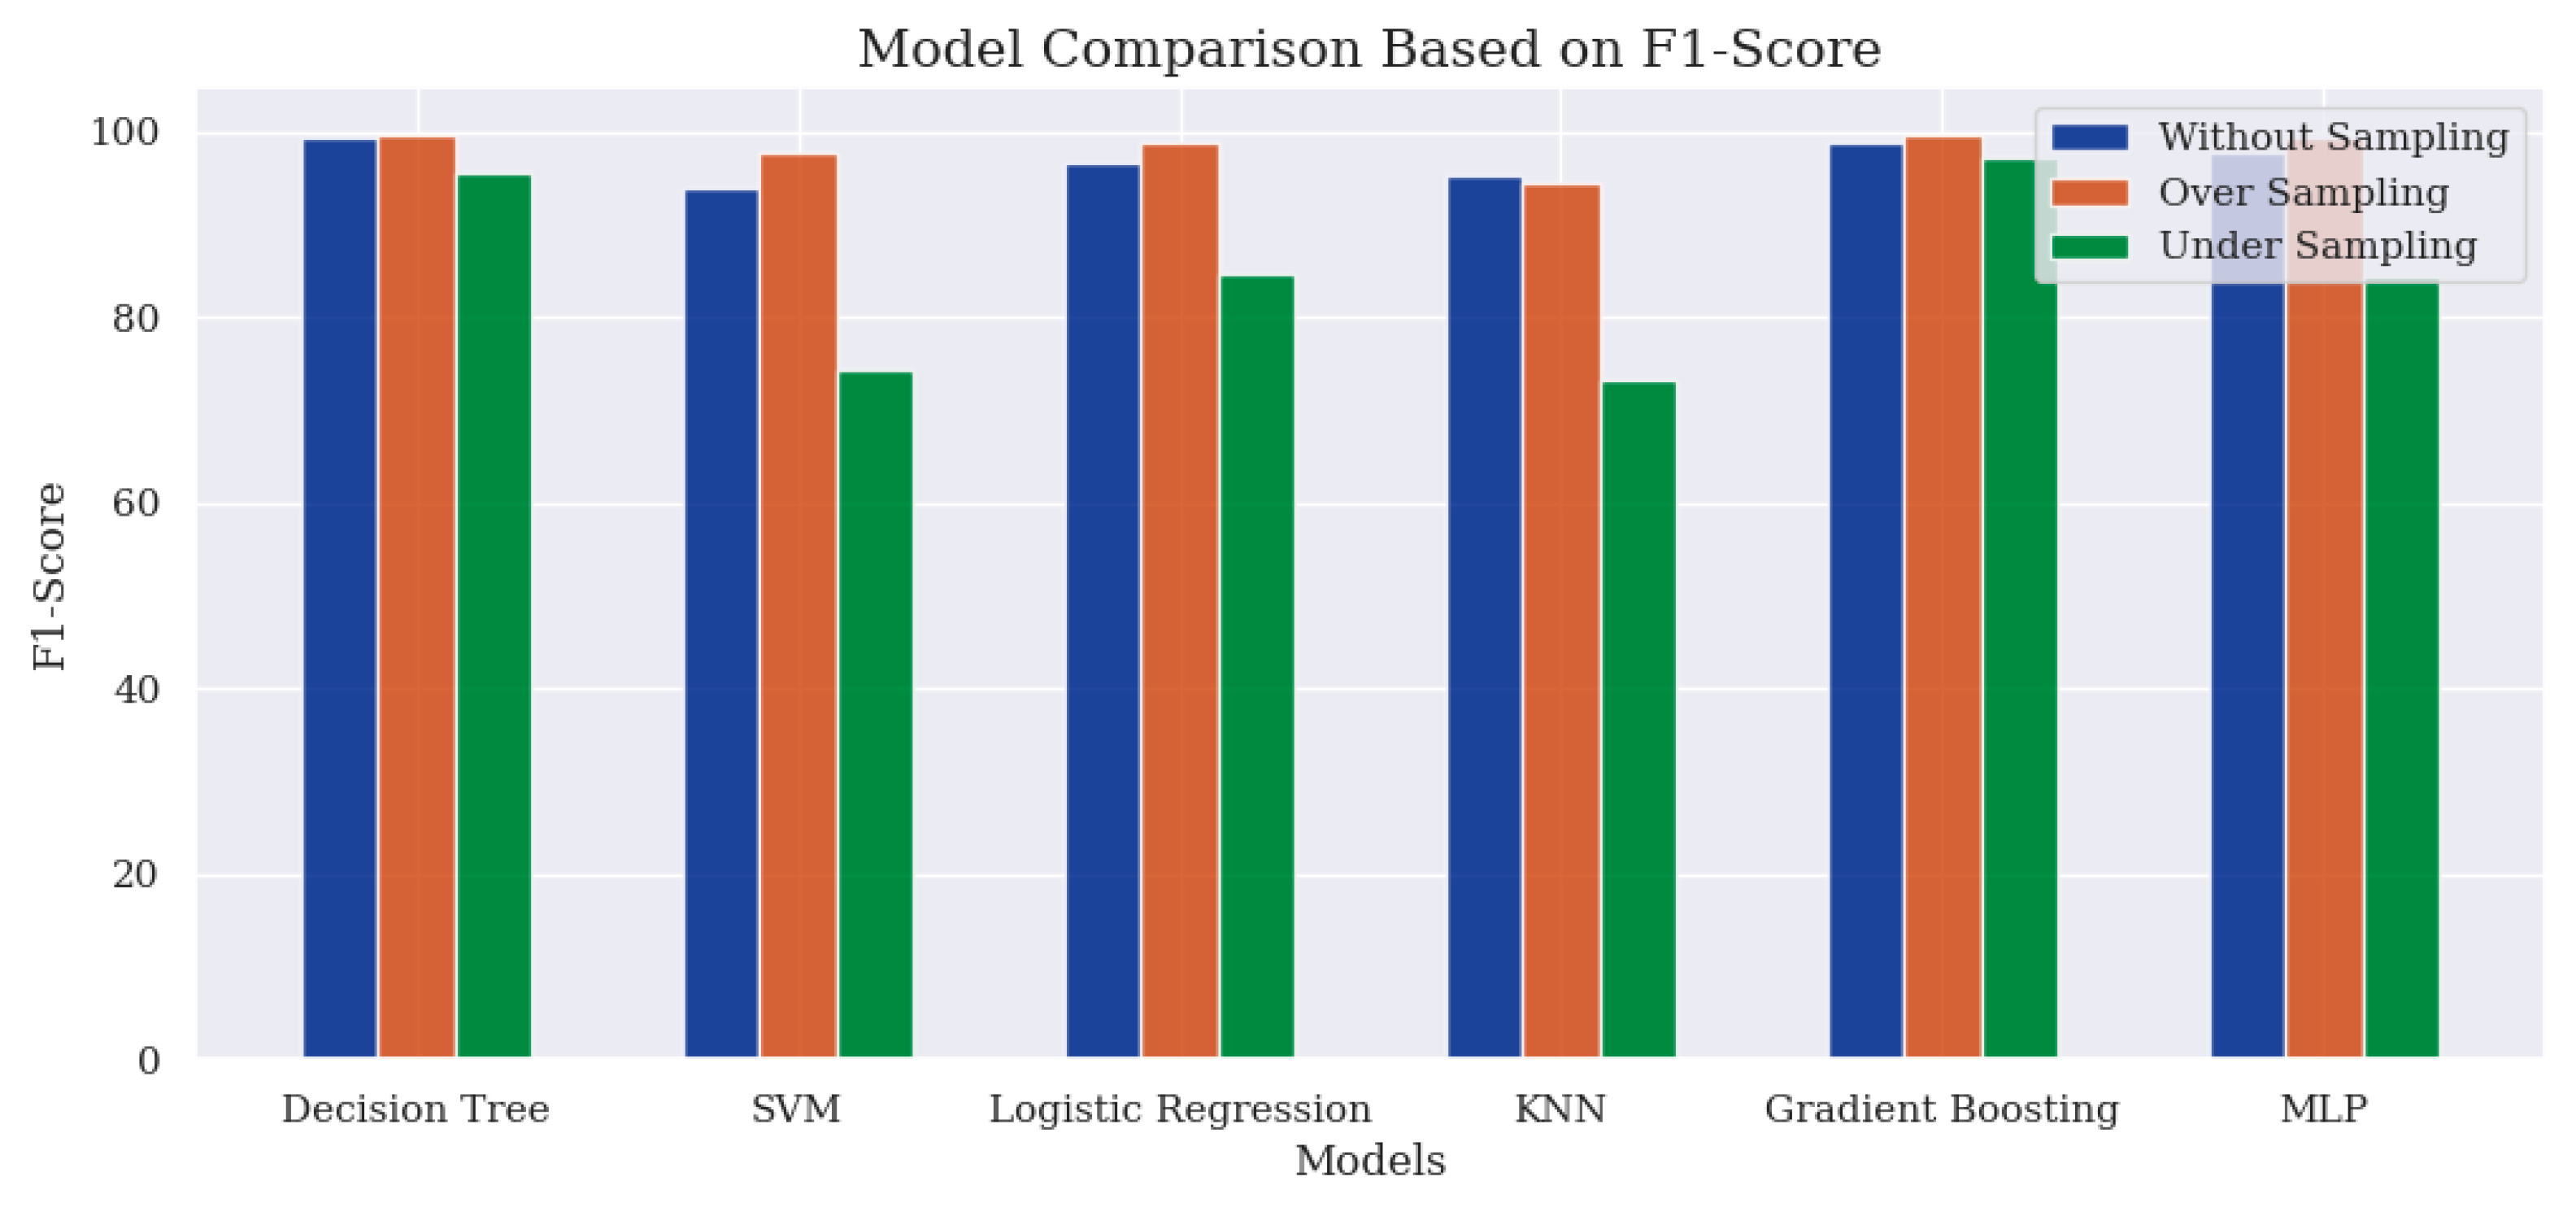
In evaluating the models for classifying thyroid diseases using different sampling techniques, the evaluation metrics considered are accuracy and F1-Score.
Table 4 summarises each classifier model’s performance across various sampling techniques based on these two evaluation metrics.
In
Figure 7 and
Figure 8, the findings highlight a better performance when using the oversampling technique, with Gradient Boosting attaining the highest score of 99.67%. However, an exception in performance is observed for the KNN model, where both the accuracy score and the F1-Score are slightly higher than those achieved with the oversampling technique. The performance derived from the without-sampling technique is unreliable as it is based on a skewed dataset. In the undersampling technique, most classifier models exhibited poor performance due to insufficient samples for effective learning during the training process.
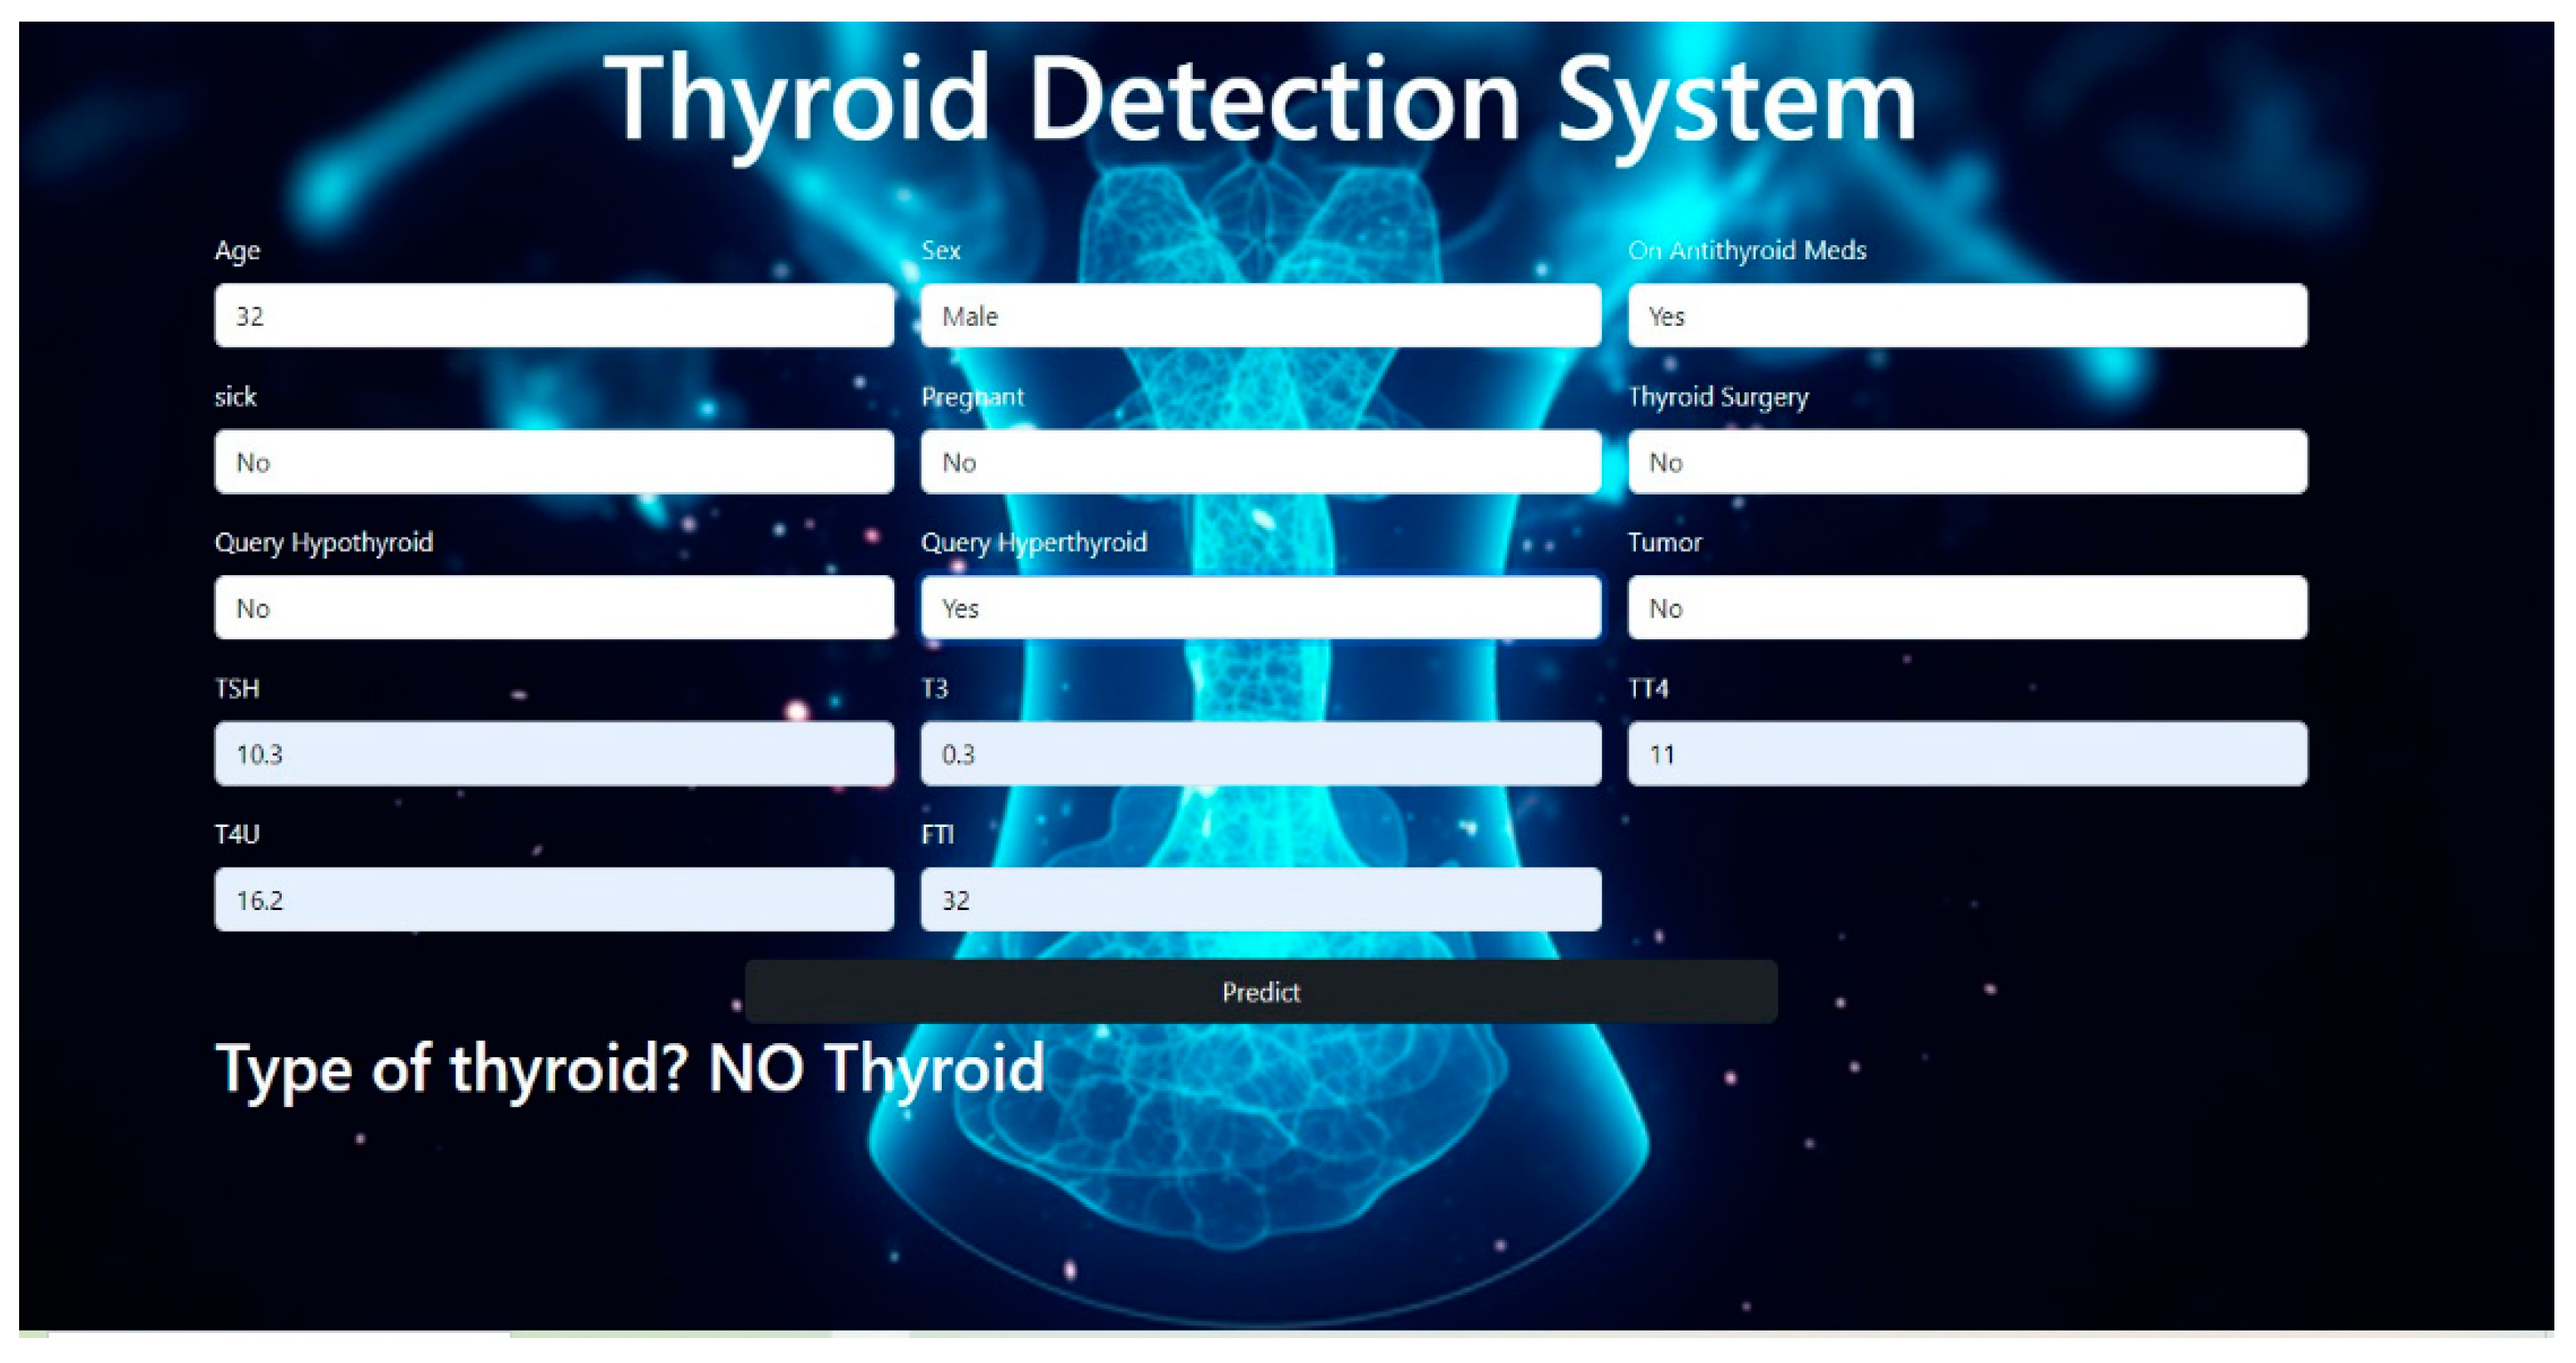
4.3. Web Application Performance
The web application accurately classified the different classes of thyroid diseases.
Figure 9 and
Figure 10 illustrate the different classification outcomes for “No thyroid” and “Hyperthyroid”.
5. Discussion
In response to RQ1 concerning biomarkers, the findings indicate that biomarkers serve as quantifiable indicators capable of elucidating specific biological states or pathological conditions. These markers play a pivotal role in the classification and diagnosis of various thyroid disorders [
26]. The dataset analysed in this study encompasses five principal biomarkers: thyroid-stimulating hormone (TSH), triiodothyronine (T3), total thyroxine (TT4), thyroxine utilisation (T4U), and free thyroxine index (FTI). Among these, TSH emerges as the most diagnostically significant biomarker for distinguishing between different thyroid diseases, demonstrating a substantial importance value of 0.78.This observation aligns with the research findings of Duggal et al. [
5] and Sinha, B. et al. [
3], emphasising the increasing significance of the TSH test as the primary factor in laboratory thyroid function testing for classifying thyroid diseases. In addition, the feature importance chart indicates that FTI and T3 substantially impacted the categorisation of thyroid illnesses, with importance values of about 0.15 and 0.08, respectively. These findings also highlight the relevance of FTI and T3 in understanding and differentiating thyroid conditions, thereby enhancing the diagnostic procedure. Recognising the most significant biomarkers is crucial for expediting the diagnostic process for healthcare professionals [
26]. Equipped with this information, healthcare practitioners can precisely select the appropriate tests and examinations, resulting in more efficient and accurate diagnoses.
In addressing Research RQ2—
How do resampling techniques impact model performance in accurately classifying thyroid diseases?—the findings underscore the critical role of resampling in mitigating bias and enhancing predictive accuracy, particularly in imbalanced datasets. Thyroid disease datasets often exhibit class imbalance [
27], where in certain diagnostic categories are underrepresented compared to others. Without resampling, machine learning models trained on such imbalanced data tend to exhibit a skewed performance, achieving high accuracy for the majority class while failing to generalise effectively to minority classes. This occurs because the model is inherently biased toward the dominant class, prioritising it during training due to its higher prevalence.
Resampling techniques, such as oversampling the minority class or undersampling the majority class, address this issue by rebalancing the dataset distribution. These methods ensure that the model is exposed to a more equitable representation of all classes during training, thereby improving its ability to discern and classify underrepresented thyroid conditions. Consequently, resampling fosters unbiased model performance, reducing the risk of misclassification and enhancing diagnostic reliability. Empirical validation in this study demonstrates that resampling significantly improves metrics such as precision, recall, and F1-Score—particularly for minority classes—which are crucial for clinical decision-making in thyroid disease diagnosis. SMOTE oversampling and random undersampling techniques were used to balance the dataset’s target variable. Analysis of Table above revealed that the oversampling technique yielded superior results compared to the undersampling technique in terms of accuracy and F1-Score for all classifiers. This is because synthetic instances of the target class have been generated, enhancing the learning process of models and enabling them to make precise and dependable categorisations of thyroid disease. Undersampling results in data loss, which leads to fewer instances for the model to learn from, thereby impeding its performance. Modelling without resampling technique may have exhibited good accuracy and F1-Score, but it cannot be considered reliable since the models were primarily learned from the majority class during training.
Another impact of resampling techniques on the model’s performance is that it enhances the model’s generality. This implies that the model not only learned from the instances of the dominant class but also from those of the lesser class. Thus, improving the model’s performance on unfamiliar data and mitigating the problem of overfitting during training is crucial when developing models for real-world applications. In summary, resampling techniques aid in mitigating bias and enhancing the generality of models when classifying various types of thyroid disease, resulting in improved and dependable model performance.
RQ3 investigates how integrating machine learning models into web-based applications can optimise the timely classification of thyroid diseases. This integration offers two principal advantages that enhance diagnostic efficiency and reliability. First, the web application automates the analytical process by employing a pre-trained machine learning model capable of identifying complex patterns associated with various thyroid disorders. This automated system demonstrates significantly faster processing speeds compared to traditional manual interpretation of laboratory results. Upon receiving the input data, the model rapidly executes feature extraction, pattern recognition, and classification, thereby generating near-instantaneous diagnostic feedback. Such expeditious analysis enables healthcare providers to accelerate clinical decision-making while maintaining diagnostic precision—a critical factor in the effective management of thyroid pathologies.
Second, the implementation of this computational system substantially mitigates the potential for human error inherent in manual diagnostic processes. The machine learning model achieves this through its capacity to (1) consistently apply learned diagnostic criteria without cognitive biases or fatigue-related variations, and (2) systematically process all relevant biomarkers according to its optimised decision boundaries. This dual mechanism not only reduces diagnostic inaccuracies but also eliminates the need for time-consuming re-evaluations of test results. Consequently, the integration enhances overall classification efficiency while improving the reliability of thyroid disease diagnostics. The system’s combined advantages of rapid processing and error reduction demonstrate the transformative potential of machine learning integration in clinical decision support systems for endocrinology. Thirdly, the web app has a friendly interface that aids effortless navigation and lets users enter necessary data from the front end. The machine learning model efficiently processes the inputted data at the backend, which provides transparent feedback on the front end. The user-friendly interface promotes regular utilisation of the web application, thereby delivering expedited outcomes. The web-based applications can be accessed remotely from any location, alleviating the need to send test results to specialised physicians for analysis. The fact that healthcare practitioners can access the web app from different locations facilitates prompt diagnosis without being limited by geographic constraints.
Limitations
The insights gained from the models’ performance and this research’s findings have been valuable. However, a few limitations require consideration and are crucial to the robustness of the proposed model. Firstly, the dataset used was relatively small in size and characterised by a high degree of imbalance. Another constraint is the unequal representation of categorical variables compared to continuous variables in the dataset. The diagnosis of thyroid disease typically involves a comprehensive assessment, including various clinical, pathological, and serological characteristics [
28]. This could comprise thyroid function tests to quantify hormone levels, ultrasound to ascertain the size and texture of the gland, and an examination of clinical symptoms like fluctuations in weight, tolerance to heat, irregularities in heart rate, BMI, and more. Antibody tests are frequently utilised to detect the existence of antibodies that might affect the thyroid gland [
29]. However, the dataset lacks essential information about most of these diagnostic components, limiting the proposed model’s robustness.
6. Conclusions and Future Work
This research utilised a range of machine learning models, including a deep learning model, to accurately classify three thyroid disease classes: no thyroid, hyperthyroid, and hypothyroid. Resampling techniques were employed to tackle the problem of class imbalance, and it was found that the SMOTE oversampling technique was the most effective. The experimental results proved that the Gradient Boosting Classifier (GBC) utilising the oversampling technique achieved superior performance compared to other classifier models, with an accuracy and F1-Score of 99.76%. Although the performance of models utilising the without-sampling technique appeared satisfactory, it may yield deceptive outcomes due to modelling on an imbalanced dataset. The utilisation of the undersampling technique resulted in poor outcomes across the majority of the models. This study further presents the deployment of the best-performing model into a web-based application for thyroid disease classification. This deployment aims to offer users an attractive interface and efficient diagnostics. This study also identified thyroid-stimulating hormone (TSH) as the most significant biomarker, providing valuable insights into thyroid diseases and emphasising the importance of TSH in diagnosis. Overall, this study presented valuable insights that can assist healthcare practitioners in promptly diagnosing thyroid diseases. While the current model demonstrates strong performance on the three targeted thyroid conditions, its architecture and algorithmic approach show potential for broader applicability. The Gradient Boosting Classifier (GBC) framework, combined with SMOTE, could be adapted to classify additional thyroid disorders (e.g., thyroiditis or nodules) or even other medical domains with similar biomarker-based diagnostics. The model’s reliance on feature importance (e.g., TSH) suggests generalisability to datasets with comparable clinical indicators. There are still opportunities to broaden its scope. Potential areas for future endeavours involve using Super Learners (SL) with the resampling techniques [
30] utilised in this research and evaluating their performance against individual models using the same metrics employed in this study. The web app interface will be enhanced by introducing an option for users to upload test results in addition to manual input. This would provide increased flexibility and convenience for users. Lastly, the proposed model will be extended to a medical image dataset, thereby enhancing the model’s robustness and application.
Author Contributions
Conceptualisation, O.O.; methodology, O.O.; software, O.O.; validation, O.O. and M.Z.I.; writing—original draft preparation, O.O. and M.Z.I.; writing—review and editing, O.O., M.Z.I. and X.W.; supervision, M.Z.I. All authors have read and agreed to the published version of the manuscript.
Funding
This manuscript was completed without external funding. All aspects of this research, including data collection, analysis, interpretation, and manuscript preparation, were undertaken with internal resources and support.
Institutional Review Board Statement
Not applicable.
Informed Consent Statement
Not applicable.
Data Availability Statement
Data can be made available on request.
Conflicts of Interest
The authors declare no conflicts of interest.
References
- Farling, P.A. Thyroid disease. Br. J. Anaesth. 2000, 85, 15–28. [Google Scholar] [CrossRef] [PubMed]
- Zimmermann, M.B.; Boelaert, K. Iodine deficiency and thyroid disorders. Lancet Diabetes Endocrinol. 2015, 3, 286–295. [Google Scholar] [CrossRef]
- Sinha, B.B.; Ahsan, M.; Dhanalakshmi, R. Light GBM empowered by whale optimization for thyroid disease detection. Int. J. Inf. Technol. 2023, 15, 2053–2062. [Google Scholar]
- Ashraf, M.; Chetty, G.; Tran, D. Feature selection techniques on thyroid, hepatitis, and breast cancer datasets. Int. J. Data Min. Intell. Inf. Technol. Appl. 2013, 3, 1–8. [Google Scholar]
- Duggal, P.; Shukla, S. Prediction of thyroid disorders using advanced machine learning techniques. In Proceedings of the 2020 10th International Conference on Cloud Computing, Data Science & Engineering, Noida, India, 29–31 January 2020; pp. 670–675. [Google Scholar]
- Yadav, D.C.; Pal, S. Thyroid prediction using ensemble data mining techniques. Int. J. Inf. Technol. 2022, 14, 1273–1283. [Google Scholar] [CrossRef]
- Soh, S.B.; Aw, T.C. Laboratory testing in thyroid conditions-pitfalls and clinical utility. Ann. Lab. Med. 2019, 39, 3–14. [Google Scholar] [CrossRef]
- Nguyen, Q.T.; Lee, E.J.; Huang, M.G.; Park, Y.I.; Khullar, A.; Plodkowski, R.A. Diagnosis and treatment of patients with thyroid cancer. Am. Health Drug Benefits 2015, 8, 30. [Google Scholar]
- Montagna, C.; Zangelidis, A. People’s Experience with Thyroid Disease: Survey Report; University of Aberdeen, Business School: Aberdeen, UK, 2023. [Google Scholar]
- Chiovato, L.; Magri, F.; Carlé, A. Hypothyroidism in context: Where we’ve been and where we’re going. Adv. Ther. 2019, 36, 47–58. [Google Scholar] [CrossRef]
- Chiasera, J.M. Back to the basics: Thyroid gland structure, function and pathology. Clin. Lab. Sci. 2013, 26, 112. [Google Scholar] [CrossRef]
- Viswanath, D. Understanding auto immune diseases-a review. IOSR J. Dent. Med. Sci. 2013, 6, 8–15. [Google Scholar] [CrossRef]
- Akash, K.T.; Usman, F.M.; Kumar, T.N.; Ahmed, M.R.; Gudodagi, R. Predicting thyroid dysfunction using machine learning techniques. In Proceedings of the 2023 12th International Conference on Advanced Computing (ICoAC), Chennai, India, 17–19 August 2023; pp. 1–8. [Google Scholar]
- Bahaj, A.S.; Alkaff, H.H.; Melebari, B.N.; Melebari, A.N.; Sayed, S.I.; Mujtaba, S.S.; Abdelmonim, S.K.; Alghamdi, S.A.; Alghamdi, F.E.; Suliman, O.A.A.; et al. Role of fine–needle aspiration cytology in evaluating thyroid nodules: A retrospective study from a tertiary care center of Western region, Saudi Arabia. Saudi Med. J. 2020, 41, 1098. [Google Scholar] [CrossRef]
- Gupta, P.; Rustam, F.; Kanwal, K.; Aljedaani, W.; Alfarhood, S.; Safran, M.; Ashraf, I. Detecting thyroid disease using optimized machine learning model based on differential evolution. Int. J. Comput. Intell. Syst. 2024, 17, 3. [Google Scholar] [CrossRef]
- Chen, D.; Hu, J.; Zhu, M.; Tang, N.; Yang, Y.; Feng, Y. Diagnosis of thyroid nodules for ultrasonographic characteristics indicative of malignancy using random forest. BioData Min. 2020, 13, 1–21. [Google Scholar] [CrossRef] [PubMed]
- Olatunji, S.O.; Alotaibi, S.; Almutairi, E.; Alrabae, Z.; Almajid, Y.; Altabee, R.; Alhiyafi, J. Early diagnosis of thyroid cancer diseases using computational intelligence techniques: A case study of a Saudi Arabian dataset. Comput. Biol. Med. 2021, 131, 104267. [Google Scholar] [CrossRef]
- Raza, A.; Eid, F.; Montero, E.C.; Noya, I.D.; Ashraf, I. Enhanced interpretable thyroid disease diagnosis by leveraging synthetic oversampling and machine learning models. BMC Med. Inform. Decis. Mak. 2024, 24, 364. [Google Scholar] [CrossRef] [PubMed]
- Sankar, S.; Potti, A.; Chandrika, G.N.; Ramasubbareddy, S. Thyroid disease prediction using XGBoost algorithms. J. Mob. Multimed. 2022, 18, 1–18. [Google Scholar] [CrossRef]
- Nugroho, A.; Fauzi, A.; Sunarko, B.; Wibawanto, H.; Mulwinda, A.; Iksan, N. Web based application system for cancerous object detection in ultrasound images. AIP Conf. Proc. 2023, 2727, 020001. [Google Scholar]
- Ananthi, N.; Kumaran, K.; Duraiarumugam, S.S.L.; Lavanya, P.M.; Ganesan, S.; Sathiya, G.R.; Surya, J. Detecting six different types of Thyroid Diseases using Deep Learning approaches. In Proceedings of the 2022 International conference on advances in computing, communication and applied informatics (ACCAI), Chennai, India, 28–29 January 2022; pp. 1–8. [Google Scholar]
- Abdelkhalek, A.; Mashaly, M. Addressing the class imbalance problem in network intrusion detection systems using data resampling and deep learning. J. Super Comput. 2023, 79, 10611–10644. [Google Scholar] [CrossRef]
- Lado, M.J. Flask Web Framework Building Interactive Web Applications with SQLite Database: A Practical, Hands-on Guide for Beginners to Intermediate Developers, Including Real-World Projects and Step-by-Step Instructions for Creating Dynamic and Engaging Web Experiences; Amazon Digital Services LLC-Kdp: Seattle, WA, USA, 2025. [Google Scholar]
- Todorov, H.; Searle-White, E.; Gerber, S. Applying univariate vs. multivariate statistics to investigate therapeutic efficacy in (pre)clinical trials: A Monte Carlo simulation study on the example of a controlled preclinical neuro trauma trial. PLoS ONE 2020, 15, e0230798. [Google Scholar] [CrossRef]
- Åsberg, A.; Mikkelsen, G. A bivariate reference interval for TSH and free thyroxine. Scand. J. Clin. Lab. Investig. 2024, 84, 521–526. [Google Scholar] [CrossRef]
- Strimbu, K.; Tavel, J.A. What are biomarkers? Curr. Opin. HIV AIDS 2010, 5, 463–466. [Google Scholar] [CrossRef] [PubMed]
- Ali, A.; Shamsuddin, S.M.; Ralescu, A.L. Classification with class imbalance problem. Int. J. Adv. Soft Compu. Appl. 2013, 5, 176–204. [Google Scholar]
- Attia, J.; Margetts, P.; Guyatt, G. Diagnosis of thyroid disease in hospitalized patients: A systematic review. Arch. Intern. Med. 1999, 159, 658–665. [Google Scholar] [CrossRef] [PubMed]
- Vargas-Uricoechea, H.; Pinzón-Fernández, M.V.; Bastidas-Sánchez, B.E.; Jojoa-Tobar, E.; Ramírez-Bejarano, L.E.; Murillo-Palacios, J. The usefulness of thyroid antibodies in the diagnostic approach to autoimmune thyroid disease. Antibodies 2023, 12, 48. [Google Scholar] [CrossRef]
- Afshan, N.; Mushtaq, Z.; Alamri, F.S.; Qureshi, M.F.; Khan, N.A.; Siddique, I. Efficient thyroid disorder identification with weighted voting ensemble of super learners by using adaptive synthetic sampling technique. AIMS Math. 2023, 8, 24274–24309. [Google Scholar] [CrossRef]
| Disclaimer/Publisher’s Note: The statements, opinions and data contained in all publications are solely those of the individual author(s) and contributor(s) and not of MDPI and/or the editor(s). MDPI and/or the editor(s) disclaim responsibility for any injury to people or property resulting from any ideas, methods, instructions or products referred to in the content. |
© 2025 by the authors. Licensee MDPI, Basel, Switzerland. This article is an open access article distributed under the terms and conditions of the Creative Commons Attribution (CC BY) license (https://creativecommons.org/licenses/by/4.0/).


