Article

A Simulation of the Biomechanical Behavior of Orthodontic Miniscrews for Infrazygomatic Anchorage: An In Vitro Study

Postgraduate School of Orthodontics, University of Ferrara, Via Luigi Borsari 46, 44121 Ferrara, Italy
*
Author to whom correspondence should be addressed.
Submission received: 6 March 2025 / Revised: 28 March 2025 / Accepted: 6 May 2025 / Published: 9 May 2025

Abstract

:
Background: This study aims to investigate the biomechanical characteristics of orthodontic miniscrews manufactured for use in infrazygomatic crests. Methods: This study analyzed the Zygomatic Spider Screw (HDC, Thiene, Italy), considering four variables: length, insertion angle, insertion depth, support thickness. Twenty-two configurations were tested on 66 miniscrews, all with a diameter of 2 mm, and were inserted into D1 bone-like supports. After compression tests, the deformation angles and linear distances between the tips of the miniscrews were measured. Results: Power analysis showed 99% power for the deformation angles and linear distance. The ICC indicated the good repeatability of the results, with values above 0.70. The mean maximum load values ranged from 21.5 N to 228.8 N, while the mean deformations ranged from 0.45 mm to 2.26 mm. Miniscrews with greater insertion depths (6 and 8 mm) exhibited approximately twice the average deformation (1.5 mm) compared to those inserted at 2 and 4 mm (0.71 mm). It was noted that miniscrews with higher deformation and a lower applied load were those with a working part length of 10 mm and an insertion depth of 2 mm, while those with lower deformation and a better load-bearing capacity were those with a working part length of 6 mm that were fully inserted into the bone support. Conclusions: The miniscrew design and insertion depth significantly affect biomechanical properties. It is advisable to maximize the insertion depth and minimize the distance between the support and the point of force application. The insertion angle did not prove to be a determining factor in the load.

1. Introduction

Temporary anchorage devices (TADs) have been used widely during orthodontic treatment. These devices are miniscrews that are temporarily fixed into the bone to provide direct or indirect anchorage, rendering tooth movement more predictable and efficient, allowing more efficient orthodontic mechanics, and requiring less patient cooperation [1].
The biomechanical behavior of miniscrews has been extensively tested both through in vitro and in vivo studies [2,3,4,5]. A lot of factors are related to screw failure, including the screw diameter, the screw length, the screw taper, the shape of screw thread, the insertion method (self-drilling vs. self-tapping), the insertion torque, the insertion angle, the treatment period, the amount of loading, the direction of loading, and microfracture of the alveolar bone [6].
According to the literature, the rates of stationary anchorage failure of miniscrews under orthodontic loading vary between 11% and 30%, resulting in the loss of stability and the necessity for the screw to be removed and replaced [7,8].
Another important factor to be considered for stability is bone density, because failure is often a result of low bone density due to inadequate cortical thickness [9].
In contrast to the interradicular alveolar bone, the infrazygomatic crest has larger bone mass and higher bone density, along with a thicker buccal cortex [10]. It is anatomically described as a pillar of highly cortical bone running between the upper molar dentoalveolar area and the maxillary zygomatic process. It is used for both direct miniscrew insertion and the placement of miniplates, providing so-called “extraradicular anchorage” that should not interfere with the root movements of various elements. It is considered a stable site that offers good anchorage as it allows for bicortical engagement, thereby increasing the primary stability of the miniscrews [11].
Several studies in the literature have aimed to precisely determine the anatomy of the infrazygomatic crest. Most of these studies explored gender, age, and skeletal divergence differences with the goal of developing guidelines to assist clinicians in the safe and stable insertion of skeletal anchorage [12,13]. However, it is also important to investigate the maximum load capacity that a material can withstand (the maximum yield load) before reaching its yield point, at which it begins to deform permanently (plastic deformation). Indeed, understanding the deformation and maximum load related to the construction characteristics of the miniscrews, the support (specifically, the working length and bone thickness), and their insertion methods (the depth and angle) could help clinicians choose the most effective miniscrews for each patient type.
Based on this premise, the aim of this study is to conduct in vitro simulations of the biomechanical behavior of the Zygomatic Spider Screw (HDC, Health Development Company, Thiene, Italy). These screws, introduced in 2021 and never tested before, were specifically designed for use in the infrazygomatic crest. Therefore, the rationale of this study lies in investigating the potential differences in their biomechanical behavior, specifically in terms of the maximum yield load and plastic deformation, by correlating these factors with the applied load.

2. Materials and Methods

This study examined the Zygomatic Spider Screw produced by HDC (Health Development Company, Thiene, Italy), considering four variables (Table 1) and thus generating 22 different clinical configurations (Table 2).
A combination of specific insertion depths (2-4-6-8 mm) was chosen to account for potential variations in clinical practice. Regarding the insertion angles, 60° and 80° were selected, as the thickness of the buccal crest may require the screw to be inserted directly into the crest or the insertion angle to be adjusted accordingly. Each configuration was tested using three samples, totaling 66 miniscrews overall.
These miniscrews, all with a diameter of 2 mm, were made from a medical-grade titanium alloy (Ti-6Al-4V). The insertion of the samples into the supports, made of PEEK (polyether ether ketone), was manually performed by the same operator using a dedicated screwdriver. The PEEK supports, measuring 5 × 2.5 × 6 mm and featuring a pilot hole to facilitate insertion, were prepared with pre-drilled holes using a column drill and a 1.1 mm diameter drill bit. The hardness of the supports was assessed to be equivalent to that of a D1 bone, aiming to replicate the cortical bone.
To control the insertion depth of the miniscrews, an electronic caliper was used to measure the distance from the base of the support to the head of the miniscrew. All miniscrews underwent a compression test using a testing machine with a load cell of 1 kN. During the test, the load was applied through a 5 mm diameter tip chuck, which descended at a speed of 1 mm/minute, focusing the force on the junction between the head and the transmucosal collar of the miniscrew (Figure 1).
Test data were acquired using the AFH-LD version 2.0.2.4 software directly connected to the testing machine. After the tests, the miniscrews were unscrewed from the supports and digitized using a laboratory scanner. To facilitate scanning without data loss, the heads of the miniscrews were bonded to metal supports using a cyanoacrylate adhesive.
Subsequently, an opacifying powder was applied to the miniscrews before scanning them using a Neway+ Advance scanner (OPEN TECH3D, Brescia, Italy). The obtained data were processed using the Exocad software (v.3.2, Exocad GmbH, Darmstadt, Germany) for 3D file reprocessing, which included removing unnecessary parts and exporting files in the STL format. The STL files were then imported into the Geomagic Control X software (v.24.1.0, Geomagic, Research Triangle Park, NC, USA) to superimpose the tested miniscrews with reference miniscrews and to assess any deformations.
To evaluate and measure the deformation of the screws, the following aspects were examined:
-
Deformation angle: the angle described by the long axes of the two screws (Figure 2);
-
Linear distance between the tips of the miniscrews (Figure 3).

2.1. Statistical Analysis

2.1.1. Power Analysis

The post-hoc power value was determined to assess the correctness of the decision to reject H0. Considering n = 22, alpha = 0.05 (5%), and the medians of the two variables, the power value was calculated for each (power ranges from 0, 0%, to 1, 100%; higher values indicate greater test certainty).

2.1.2. Repeatability

To evaluate the proper execution and repeatability of the tests, the Intraclass Correlation Coefficient (ICC) was calculated, ranging from 0 (no repeatability) to 1 (perfect repeatability). Values below 0.5 indicate poor repeatability, values between 0.5 and 0.6 indicate modest repeatability, values between 0.6 and 0.7 indicate fair repeatability, values between 0.7 and 0.8 indicate good repeatability, values between 0.8 and 0.9 indicate excellent repeatability, and values above 0.9 indicate outstanding repeatability.

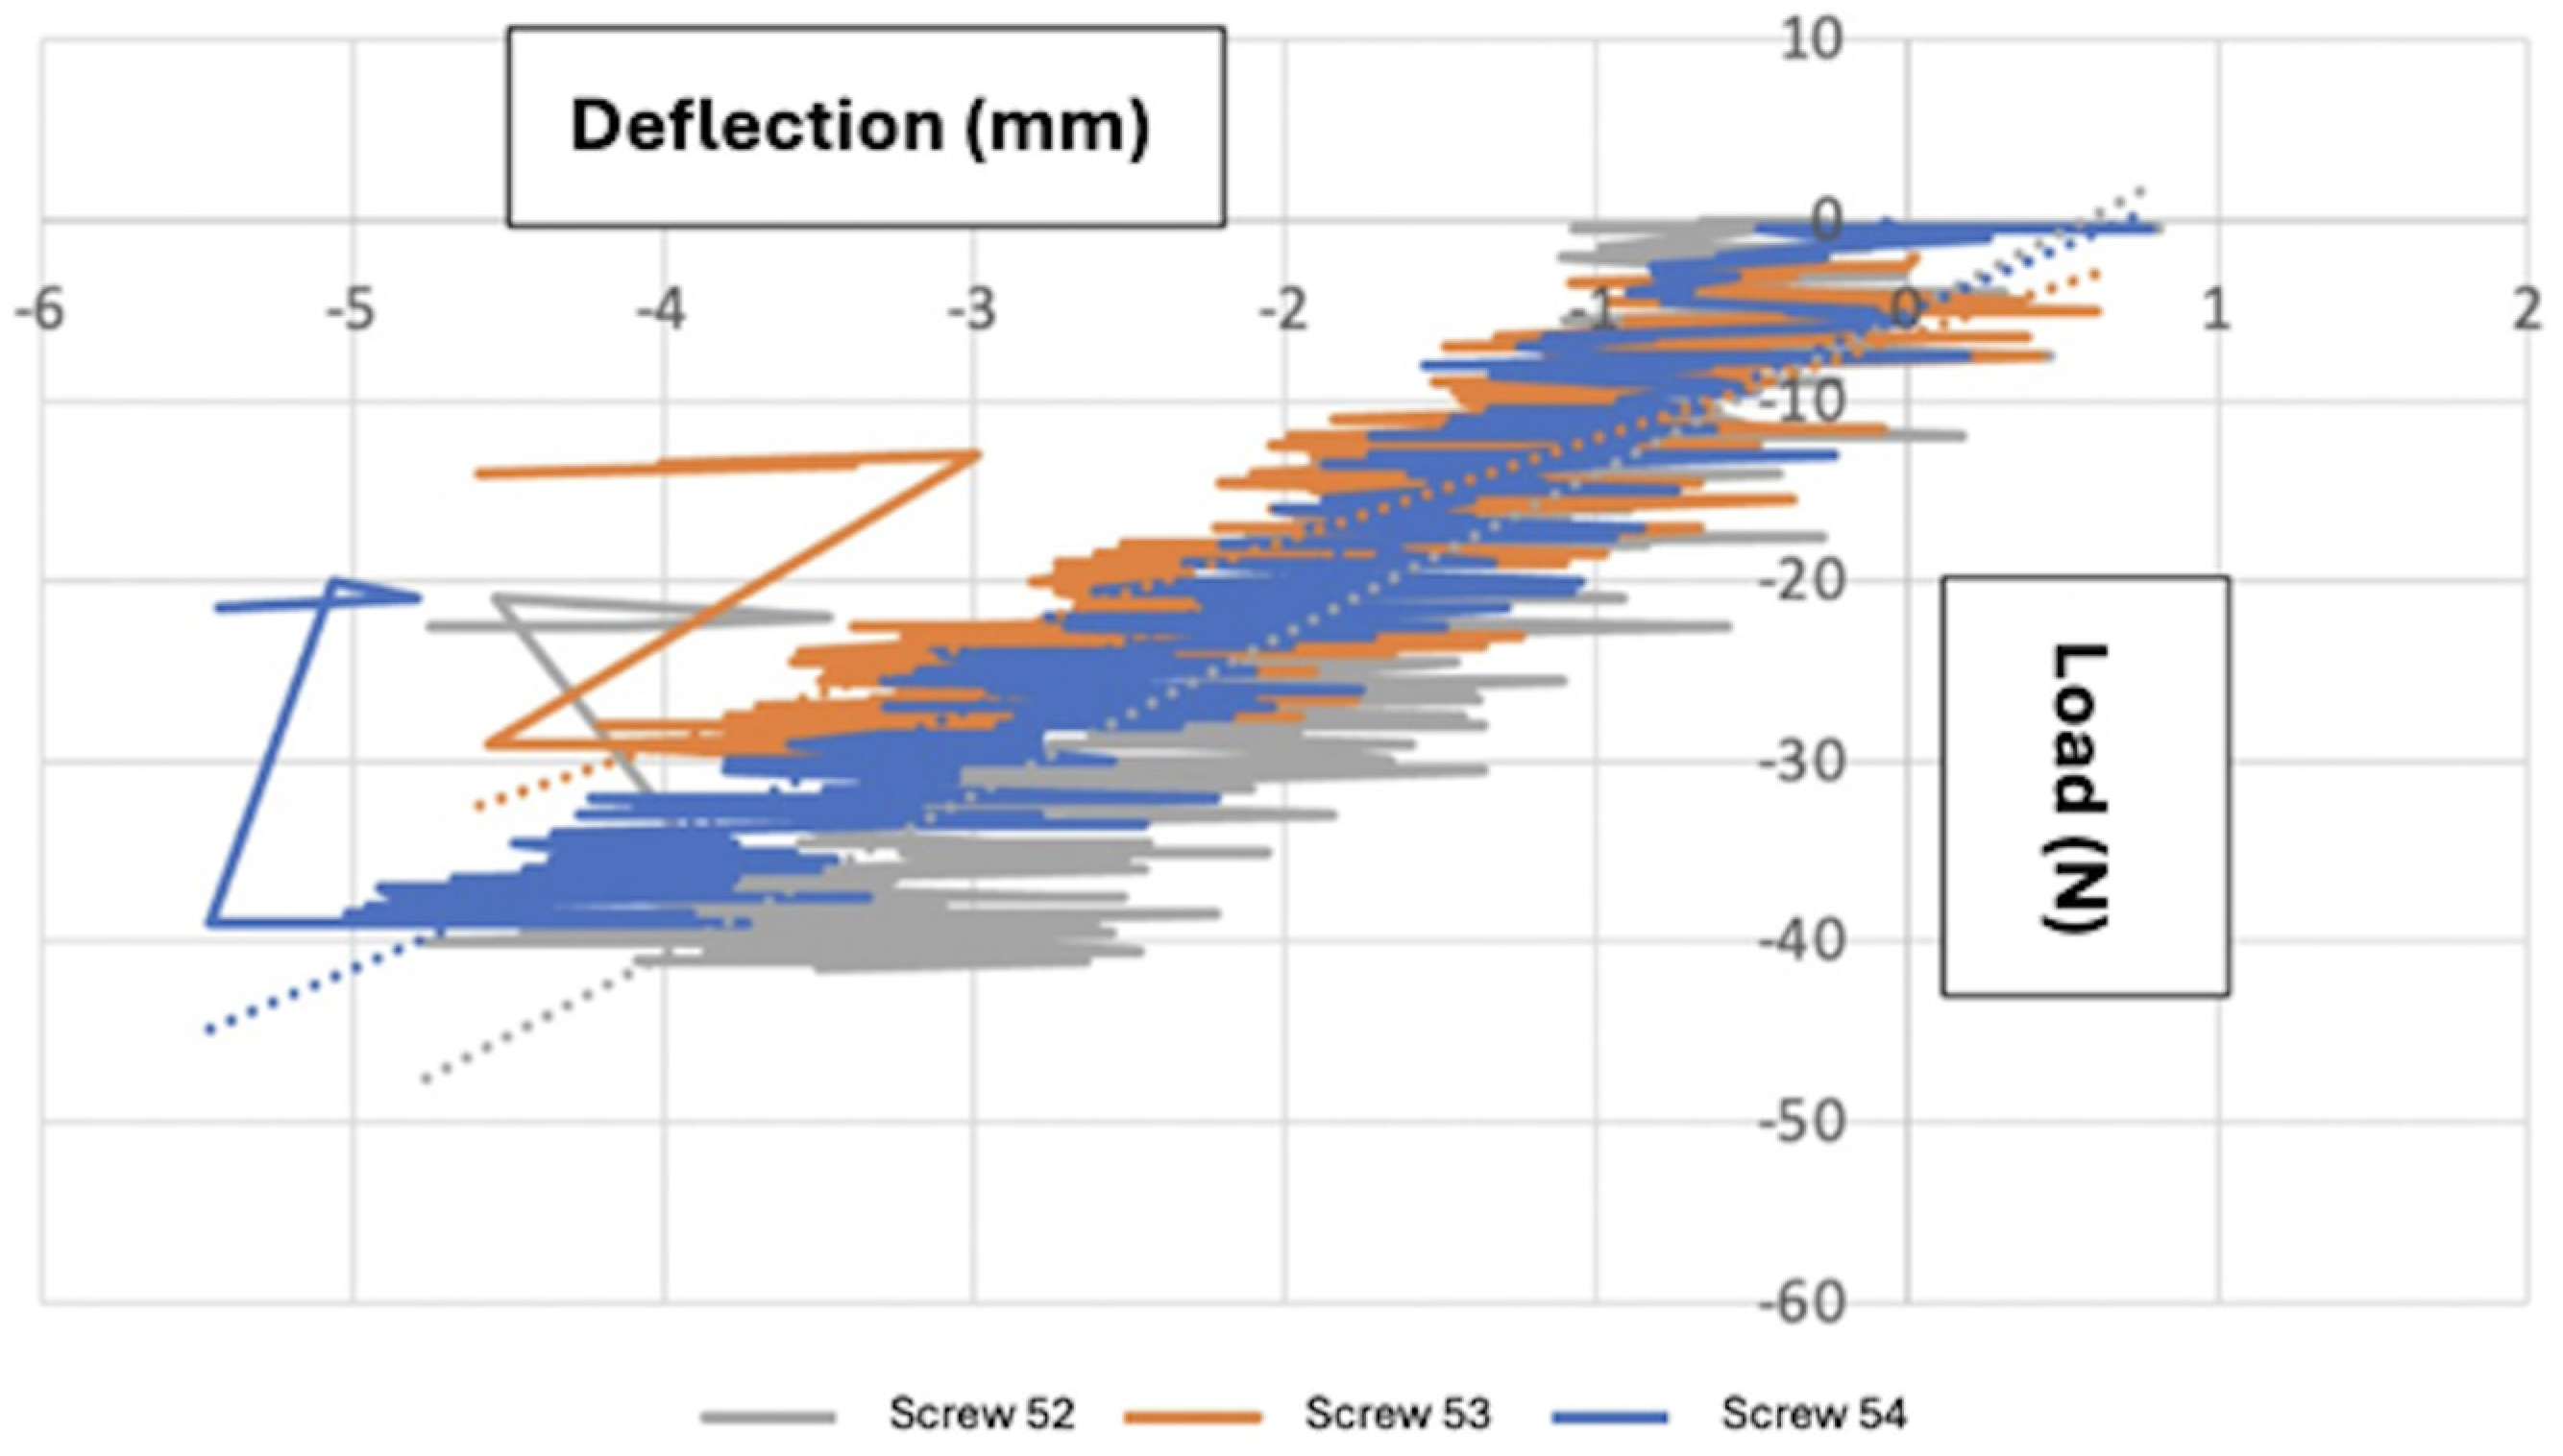
2.1.3. Load–Deflection Curve

Tests for each sample determined the maximum yield load sustained by the miniscrews. Data were graphed in Microsoft Excel, with the deflection and applied force. The maximum yield load, in Newtons, was identified from each graph, representing the force supported by the screw until failure due to a loss of contact between the chuck and the miniscrew.

2.1.4. Descriptive Statistical Analysis (Mean, Standard Deviation, Minimum, and Maximum) for Load and Deformation

Data on the maximum yield load, the force failure point, and miniscrew deformation were gathered in Microsoft Excel. Descriptive statistical analysis was calculated for each tested combination. This study also examines how experimental factors affect maximum load and deformation.

2.1.5. Non-Parametric Single-Sample
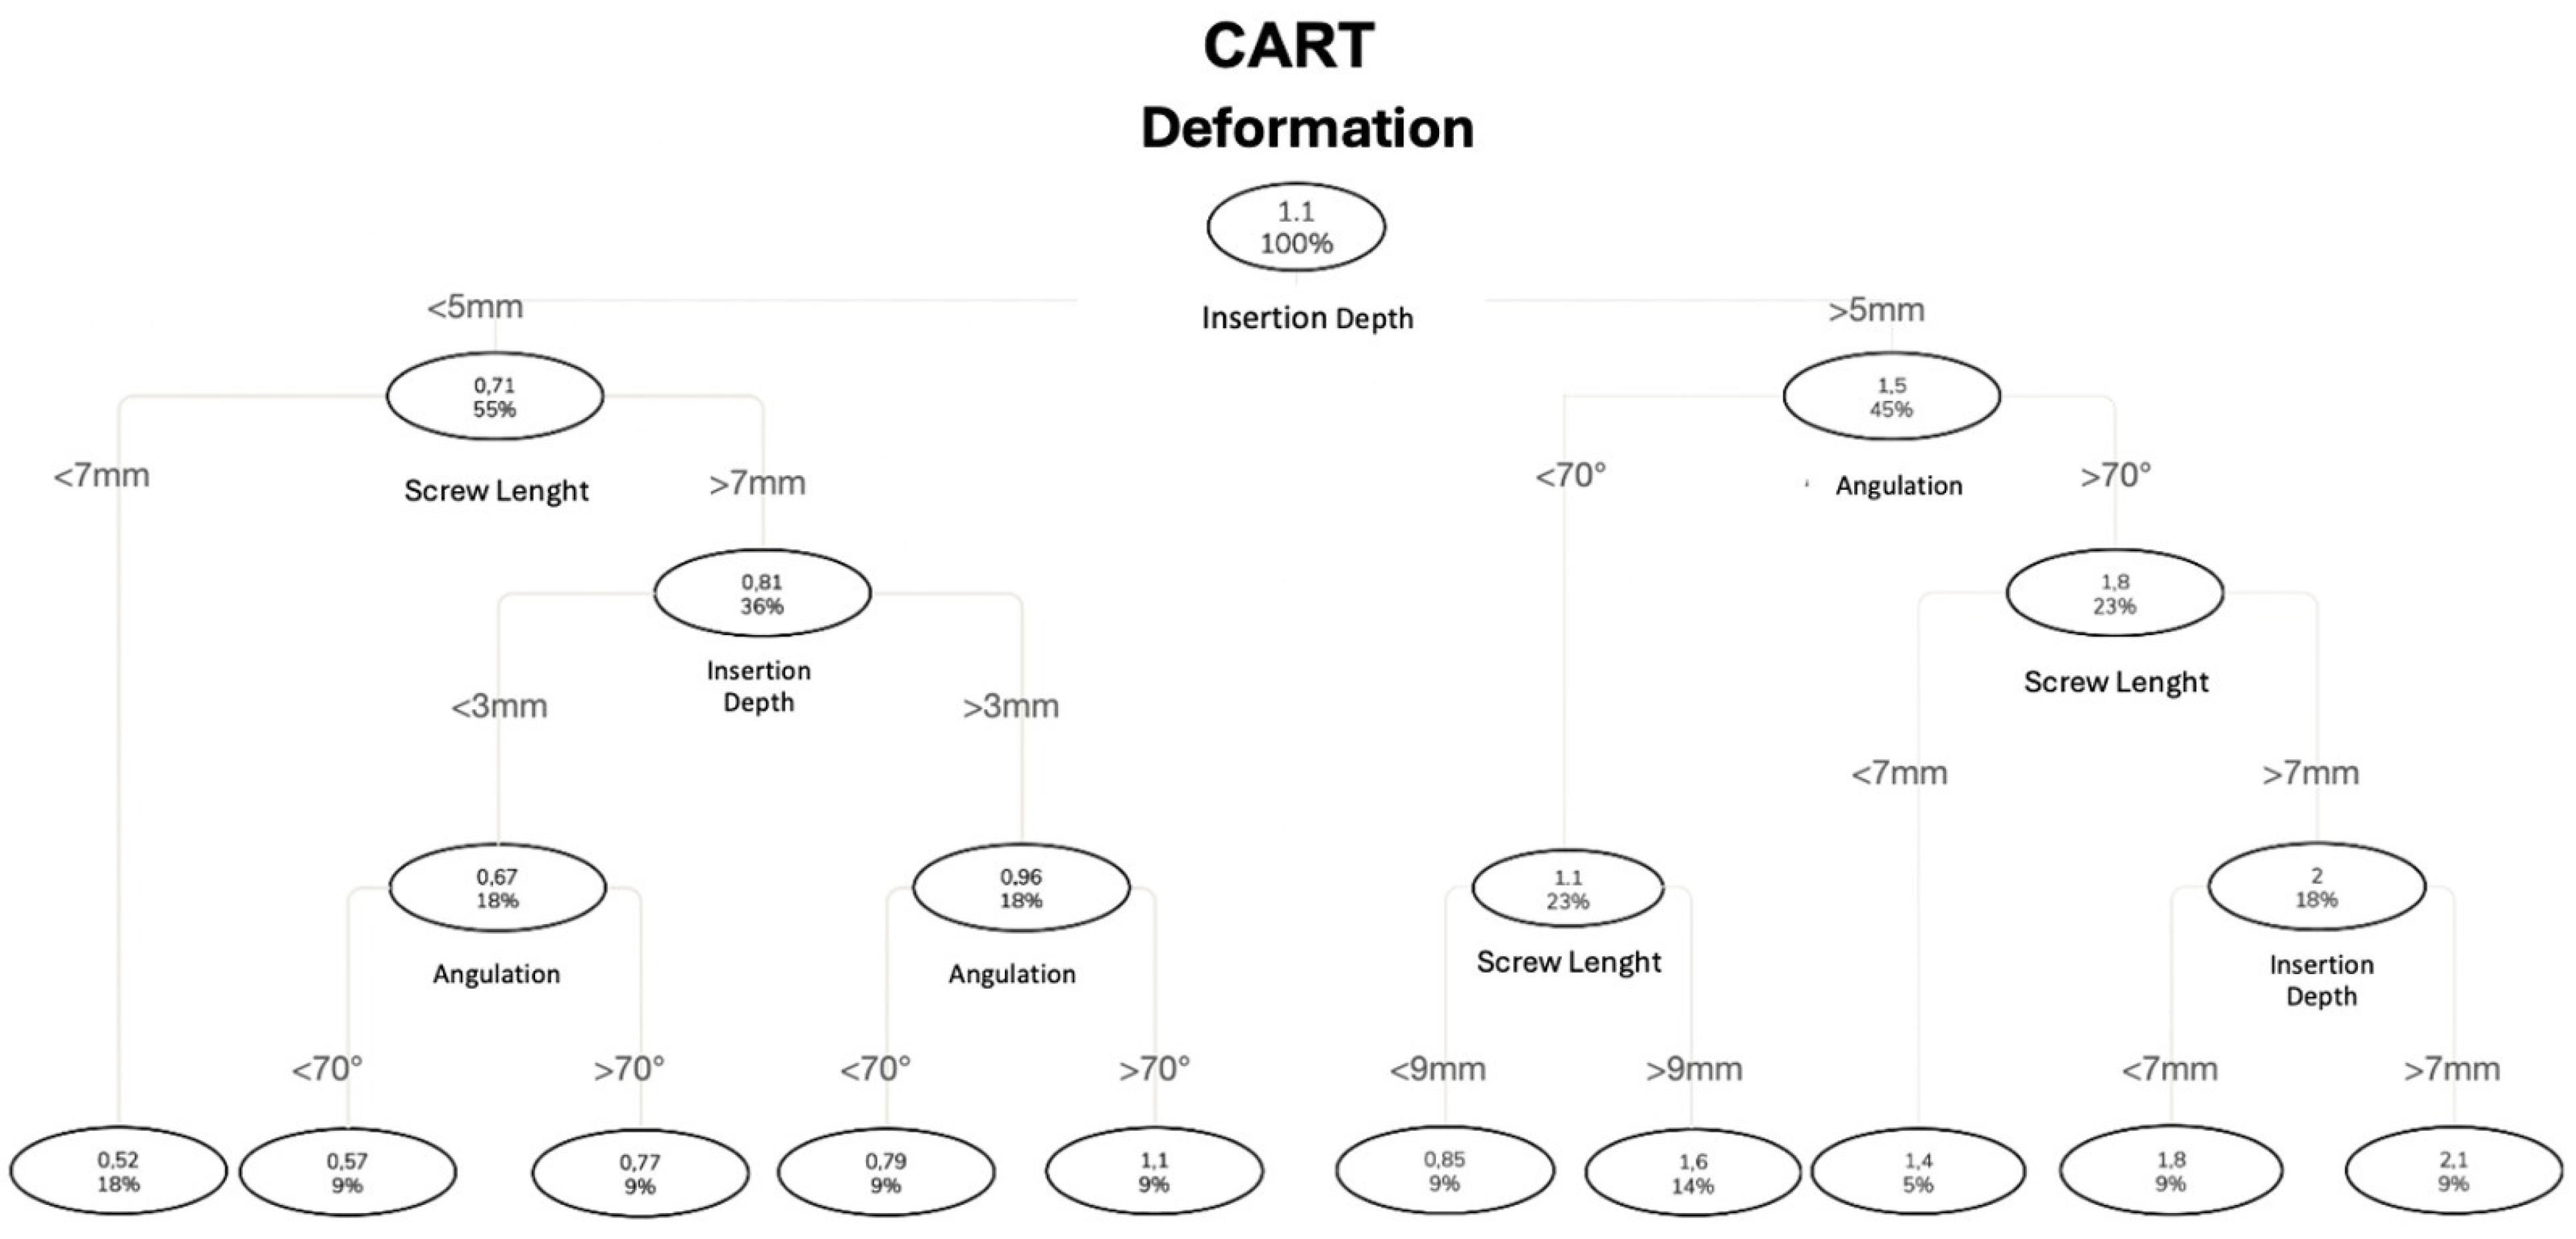
Due to the small sample size (n < 30), a non-parametric single-sample Wilcoxon test was used instead of assuming normality. This test assessed if a numerical variable’s median was significantly different from a predetermined value. The null hypothesis was that the variable’s median is zero, and it would be rejected if the p-value was less than 0.05, indicating a significant difference from zero.

2.1.6. CART

The statistical analyses utilized Model-Based Recursive Partitioning, a variant of Classification and Regression Trees (CART), to correlate the insertion angle, the length of the working part, and the insertion depth of the miniscrew with the maximum load and deformation. For continuous responses, divisions were based on F-ANOVA tests with a 5% significance level. The analyses were performed using the R Statistical software, with the statistical significance set at 5%.

3. Results

3.1. Power Analysis

The power analysis was conducted on two variables: the deformation angle and the linear distance between the screws. Considering the observations, n = 22, alpha = 0.05 (=5%), and the medians of the two variables, the power value was calculated. In both cases, a power value of 99% was recorded for the two analyzed variables. Therefore, it was ensured that the test of median = 0 in the population was correctly rejected.

3.2. Repeatability

The analysis aimed to compare the values obtained from each individual test, verifying that the values obtained exhibited the same trend for both loads, represented by the Y axis, and the deflection, represented by the X axis. In this case, all ICC values were above 0.70 and were significantly different from 0 (p < 0.05), indicating good repeatability.

3.3. Load–Deflection Curve

The graph (Figure 4) shows the load–deflection curve resulting from the tests on the samples.
The deflection in mm is represented on the X axis, while the force in Newtons is indicated on the Y axis. Each graph corresponds to a specific combination of the working part length, the insertion angle, the support thickness, and the insertion depth. Within each graph, three curves related to the three tested samples for that specific combination are displayed. In the context of this study, the load value causing the loss of contact between the chuck and the screw head–neck junction, indicative of material yielding, was considered.

3.4. Descriptive Statistics (Mean, Standard Deviation, Minimum, and Maximum) for Maximum Yield Load

Table 3 shows the maximum yield load values and descriptive statistics for each combination.
The highest average load is 228.8 N for screws with a 6 mm length, a 2 mm diameter, a 60° insertion angle, and a 6 mm insertion depth. The lowest average load is 21.5 N for screws with a 10 mm length, a 2 mm diameter, a 60° insertion angle, and a 2 mm insertion depth. Doubling the insertion depth doubles the load-bearing capacity. The 6 mm screws fully inserted into the bone support withstand the highest load, while 10 mm screws in 2 mm supports have a significantly reduced load-bearing capacity.

3.5. CART for Maximum Yield Load

The customized CART tree for maximum yield load identified key features and their optimal values for prediction (Figure 5).
Statistical analysis shows that the maximum yield load is significantly affected by the length of the working part and insertion depth of the screw. A greater insertion depth increases load capacity, while longer screws reduce it. Screws with an 8–10 mm working part average 30 N, which increases to 89 N with a 6 mm insertion depth. Screws with a 6 mm working part fully inserted sustain an average load of 217 N, but this drops to 44 N with a 2 mm insertion depth.

3.6. Descriptive Statistics (Mean, Standard Deviation, Minimum, and Maximum) for Deformation

Table 4 and Table 5 present the deformation values for each tested sample and the results of the descriptive statistical analysis for each combination.
There is a linear trend between the deformation angle and linear point-to-point distance, where an increase in the deformation angle corresponds to a greater linear distance between the screw tips. The highest average deformation value is 2.26 mm with a deformation angle of 12.9°, recorded for screws with a length of 10 mm, a diameter of 2 mm, an 80° insertion angle, and an 8 mm insertion depth. The lowest average deformation value is 0.45 mm with a deformation angle of 2.17°, recorded for screws with a length of 6 mm, a diameter of 2 mm, a 60° insertion angle, and a 2 mm insertion depth.

3.7. Non-Parametric Single-Sample Tests

The tests are statistically significant (p < 0.05); therefore, the null hypothesis that the median of the variable is not significantly different from 0, or that the difference from the hypothesized value is significant, is rejected.

3.8. CART for Deformation

The customized CART tree for screw plastic deformation highlighted key features for prediction (Figure 6).
Deformation is significantly affected by the working part length, the insertion depth, and the insertion angle, with increases in these variables leading to greater deformation. For 2–4 mm insertion depths, the average deformation is 0.71 mm, while for 6–8 mm depths, it is 1.5 mm. A 6 mm screw with a 4 mm insertion depth shows 0.52 mm deformation, increasing to 1.08 mm for a 10 mm screw. Greater deformation is seen at an 80° insertion angle. Comparing with the load, a 10 mm screw with a 2 mm depth deforms 0.66 mm with a 21.5 N load, while a 6 mm screw with a 6 mm depth deforms 0.73 mm but sustains 228.8 N.

4. Discussion

The biomechanical behavior of miniscrews has been extensively tested both in vitro and in vivo [2,3,4,5]. Several authors have considered that if mini-implant failure (a loss of stability) represents the most frequent drawback during their use, screw fracture is certainly the most undesirable complication [14]. Indeed, once a miniscrew fractures, it should be removed from the bone, which can be a difficult and not always successful procedure. For these reasons, fractured miniscrews are sometimes left inside the bone [6].
The aim of this study was to investigate the biomechanical characteristics of orthodontic miniscrews designed and manufactured for use in the infrazygomatic crest. The objective was to determine the maximum yield load and plastic deformation of the miniscrews in vitro, providing useful indications for the selection of the most appropriate miniscrews for each anatomical insertion site.
Regarding the maximum yield load, the numerical data clearly show that miniscrews with a greater insertion depth and a shorter distance from the bone support tend to withstand higher loads. Indeed, miniscrews with a working part length of 6 mm, a diameter of 2 mm, an insertion angle of 60° relative to the support, and an insertion depth of 6 mm showed an average maximum load of 228.8 N. Conversely, miniscrews with a working part length of 10 mm, a diameter of 2 mm, an insertion depth of 2 mm, and an insertion angle of 60° recorded an average load of 21.5 N, indicating lower load resistance. The insertion angle instead did not prove to be a determining factor in the load.
The data align with the study by Colonna et al., which reported an average maximum load of 249 N for miniscrews with a length of 13 mm and a diameter of 2 mm, inserted at a 45° angle with a force application point 3 mm from the support. In the same study, a maximum load of 47 N was recorded for miniscrews of the same dimensions inserted at a 90° angle with a 7 mm head-to-block distance. These findings demonstrate that increasing the distance from the support leads to a reduction in the applicable load [15].
The parameter of deformation was further investigated, highlighting the insertion depth as the most significant factor. It was observed that miniscrews with a greater insertion depth, such as 6 and 8 mm, recorded double the average deformation (1.5 mm) compared to those with depths of 2 and 4 mm (0.71 mm). Among the tested combinations, 6 mm miniscrews inserted into 2 mm bone supports showed the lowest average deformation at 0.51 mm. Conversely, 8 and 10 mm miniscrews with an insertion depth of 8 mm exhibited the highest deformation, with an average of 2.1 mm. Additionally, it was noted that miniscrews with greater deformation and lower applied load were those with a working part length of 10 mm and an insertion depth of 2 mm, while those with less deformation and better load-bearing capacity were those with a working part length of 6 mm fully engaged in the bone support.
Overall, all of the miniscrews demonstrated resistance to the orthodontic loads that are commonly used, although deformations occurred. However, no miniscrew fractures occurred under the orthodontic forces mentioned in the literature [16].
Furthermore, it was highlighted that the distance between the miniscrew head and the bone support has a significant effect on maximum load and deformation values. An increase in the miniscrew length, and thus a reduction in the insertion depth into the bone block, led to a decrease in the maximum load and an increase in deformation. Finally, the importance of considering the working part length and the force leverage arm in choosing the most suitable anchoring device characteristics was suggested.
However, it should be kept in mind that even in the worst-case scenario, the lower average value is about six times greater than the most critical force used for orthodontic distalization (350 g), thus meeting clinical requirements in all cases. Therefore, from a theoretical standpoint, all described scenarios satisfy biomechanical demands. The data align with Phiton’s study, which found that all tested miniscrews endured forces exceeding orthodontic loads before deforming. He recorded a minimum force of 44.54 N (approximately 4.5 kg) needed to induce a 0.5 mm deformation in miniscrews measuring 1.5 mm in diameter and 7 mm in length. This applied load was greater than that observed in our study [16].
However, it is preferable to insert the screw in a way that leaves a small portion outside the bone and mucosa to minimize tissue interference and reduce patient discomfort.
If insertion is performed without a preliminary CBCT analysis (for radioprotection reasons, following the ALARA principle) and considering that the thickness ranges from 5.2 mm to 8.8 mm [11], it is advisable to use screws with a 6 mm thread to avoid the risk of the spirals remaining outside the mucosa in the final position. This could lead to plaque accumulation, potentially triggering inflammatory processes.
Despite these significant results, this study has some limitations. The tested samples were inserted into bone-like supports of type D1, typically found in the infrazygomatic crest. Due to its hardness, the material was able to withstand the applied load without deforming or breaking. This allowed us to obtain results strictly related to the deformation of the screw. However, the thin thickness of these supports may not guarantee the total immobilization of the miniscrews. During the application of high loads, there is a possibility that the sample may tilt in the opposite direction within the support, influencing the test results and preventing a completely independent assessment of the biomechanical characteristics of the device. Moreover, the in vitro test could not fully replicate the biological complexity that a clinician encounters in daily orthodontic practice. However, as described above, the average load value exceeds typical clinical requirements.
Additionally, the lack of assessment of the Maximal Insertion Torque (MIT) is another limitation of this study, due to fact that it was not registered during miniscrew insertion with a dynamometric screw hand-driver. As a matter of fact, MIT values below 5–10 Ncm have been associated with higher failure rates in orthodontic miniscrews, but this is probably not the case in this study because during insertion into a heavy bone density pillar like the infrazygomatic crest, the miniscrew would surely exceed this value [17,18].
To ensure a more accurate and independent evaluation of the biomechanical characteristics of miniscrews, it would be necessary to test them in metallic blocks to avoid any displacement during tests. However, this option would not fully reflect the real situation in which miniscrews are inserted directly into bone tissue. It might be more advantageous to perform tests on miniscrews inserted into synthetic bone blocks to simulate a more realistic condition of bicortical insertion and to obtain more representative results.
Even though in vitro studies have these limitations, they represent a crucial step before moving on to in vivo studies, allowing researchers to test the effectiveness of a method. Future research should focus on the possibility of conducting in vivo studies, such as clinical trials or studies on cadavers, while considering cost-effectiveness and the biological aspect.

5. Conclusions

In conclusion, the following can be stated:
-
The design of the miniscrews and their insertion method statistically and significantly influence the biomechanical properties of the system.
-
The parameter of maximum yield load statistically and significantly increases with the increasing insertion depth.
-
The parameter of maximum yield load statistically and significantly decreases with the increasing distance between the support and the point of force application.
-
The parameter of deformation statistically and significantly increases with the increasing length of the miniscrew and the leverage arm.
-
No statistically significant differences were found between insertion angles of 60° or 80°.
-
It is advisable to seek the maximum insertion depth and reduce the distance between the support and the point of force application while maintaining compatibility with the patient’s biomechanical needs and anatomical characteristics.
-
Clinically, all of the miniscrews demonstrated sufficient resistance to commonly applied orthodontic loads, confirming their ability to withstand forces typically used in clinical practice. Moreover, to minimize tissue interference, inflammatory processes and patient discomfort, it is preferable to insert the screw in a way that leaves a small portion outside of the bone and mucosa.

Author Contributions

Conceptualization, L.L., M.P. and F.C.; methodology, L.L.; software, F.P. and D.T.; validation, L.L., M.P. and F.C.; formal analysis, F.C.; investigation, N.A. and D.T.; resources, L.L.; data curation, M.P. and F.C.; writing—original draft preparation, D.T. and M.C.; writing—review and editing, N.A. and F.C.; visualization, F.C.; supervision, L.L. and F.C.; project administration, L.L.; funding acquisition, L.L. All authors have read and agreed to the published version of the manuscript.

Funding

This research received no external funding.

Institutional Review Board Statement

The study was conducted in accordance with the Declaration of Helsinki and was approved by the University of Ferrara Postgraduate School Ethics Committee (registration number 7/2021).

Informed Consent Statement

Not applicable.

Data Availability Statement

All authors ensured that all of the data and materials, as well as the software application or custom code, support their published claims and comply with field standards. The raw data supporting the conclusions of this article will be made available by the corresponding author on request.

Conflicts of Interest

The authors declare no conflicts of interest.

References

  1. Lima, A., Jr.; Domingos, R.G.; Cunha Ribeiro, A.N.; Rino Neto, J.; de Paiva, J.B. Safe sites for orthodontic miniscrew insertion in the infrazygomatic crest area in different facial types: A tomographic study. Am. J. Orthod. Dentofac. Orthop. 2022, 161, 37–45. [Google Scholar] [CrossRef] [PubMed]
  2. Lim, S.-A.; Cha, J.-Y.; Hwang, C.-J. Insertion Torque of Orthodontic Miniscrews According to Changes in Shape, Diameter and Length. Angle Orthod. 2008, 78, 234–240. [Google Scholar] [CrossRef] [PubMed]
  3. Ajami, S.; Mina, A.; Nabavizadeh, S.A. Stress distributions of a bracket type orthodontic miniscrew and the surrounding bone under moment loadings: Three-dimensional finite element analysis. J. Orthod. Sci. 2016, 5, 64–69. [Google Scholar] [CrossRef] [PubMed]
  4. Chung, K.; Kim, S.-H.; Kook, Y. C-orthodontic microimplant for distalization of mandibular dentition in Class III correction. Angle Orthod. 2005, 75, 119–128. [Google Scholar] [CrossRef] [PubMed]
  5. Mesko, M.E.; Skupien, J.A.; Valentini, F.; Pereira-Cenci, T. Can we close large prosthetic space with orthodontics? Int. J. Orthod. Milwaukee 2013, 24, 41–44. [Google Scholar] [PubMed]
  6. Kuroda, S.; Tanaka, E. Risks and complications of miniscrew anchorage in clinical orthodontics. Jpn. Dent. Sci. Rev. 2014, 50, 79–85. [Google Scholar] [CrossRef]
  7. Büchter, A.; Wiechmann, D.; Koerdt, S.; Wiesmann, H.P.; Piffko, J.; Meyer, U. Load-related implant reaction of mini-implants used for orthodontic anchorage. Clin. Oral Implant. Res. 2005, 16, 473–479. [Google Scholar] [CrossRef] [PubMed]
  8. Cheng, S.-J.; Tseng, I.-Y.; Lee, J.-J.; Kok, S.-H. A prospective study of the risk factors associated with failure of mini-implants used for orthodontic anchorage. Int. J. Oral Maxillofac. Implant. 2004, 19, 100–106. [Google Scholar]
  9. Kravitz, N.D.; Kusnoto, B. Risks and complications of orthodontic miniscrews. Am. J. Orthod. Dentofac. Orthop. 2007, 131, S43–S51. [Google Scholar] [CrossRef] [PubMed]
  10. Jia, X.; Huang, X. Morphometric analysis of the infrazygomatic crest zone in 84 mini-implants using cone-beam CT. Chin. J. Stomatol. 2018, 53, 8–12. [Google Scholar]
  11. Liou, E.J.; Chen, P.-H.; Wang, Y.-C.; Lin, J.C.-Y. A computed tomographic image study on the thickness of the infrazygomatic crest of the maxilla and its clinical implications for miniscrew insertion. Am. J. Orthod. Dentofac. Orthop. 2007, 131, 352–356. [Google Scholar] [CrossRef] [PubMed]
  12. Jia, X.; Chen, X.; Huang, X. Influence of orthodontic mini-implant penetration of the maxillary sinus in the infrazygomatic crest region. Am. J. Orthod. Dentofac. Orthop. 2018, 153, 656–661. [Google Scholar] [CrossRef] [PubMed]
  13. Du, B.; Zhu, J.; Li, L.; Fan, T.; Tan, J.; Li, J. Bone depth and thickness of different infrazygomatic crest miniscrew insertion paths between the first and second maxillary molars for distal tooth movement: A 3-dimensional assessment. Am. J. Orthod. Dentofac. Orthop. 2021, 160, 113–123. [Google Scholar] [CrossRef] [PubMed]
  14. Vargas, E.O.A.; de Lima, R.L.; Nojima, L.I. Mandibular buccal shelf and infrazygomatic crest thicknesses in patients with different vertical facial heights. Am. J. Orthod. Dentofac. Orthop. 2020, 158, 349–356. [Google Scholar] [CrossRef] [PubMed]
  15. Colonna, A.; Drudi, M.; Spedicato, G.A.; Mollica, F.; Mazzanti, V.; Paoletto, E.; Maino, G.; Siciliani, G.; Lombardo, L. Assessment of stiffness and load deflection of orthodontic miniscrews used for palatal anchorage: An in vitro biomechanical study. Int. Orthod. 2020, 18, 809–819. [Google Scholar] [CrossRef] [PubMed]
  16. Pithon, M.M.; Nojima, L.I.; Nojima, M.G.; Ruellas, A. Assessment of flexural strength and fracture of orthodontic mini-implants. Rev. Dent. Press Ortod. Ortop. Facial 2008, 13, 128–133. [Google Scholar] [CrossRef]
  17. Palone, M.; Darsiè, A.; Maino, G.B.; Siciliani, G.; Spedicato, G.A.; Lombardo, L. Analysis of biological and structural factors implicated in the clinical success of orthodontic miniscrews at posterior maxillary interradicular sites. Clin. Oral Investig. 2022, 26, 3523–3532. [Google Scholar] [CrossRef] [PubMed]
  18. Chang, C.H.; Lin, J.-H.; Roberts, W.E. Success of infrazygomatic crest bone screws: Patient age, insertion angle, sinus penetration, and terminal insertion torque. Am. J. Orthod. Dentofac. Orthop. 2022, 161, 783–790. [Google Scholar] [CrossRef] [PubMed]
Figure 1. A representation of the point of force application on the miniscrew.
Sci 07 00064 g001
Figure 2. Deformation angle: the angle described by the long axes of the two screws.
Sci 07 00064 g002
Figure 3. Linear distance between the tips of the miniscrews.
Sci 07 00064 g003
Figure 4. Load–deflection curve.
Sci 07 00064 g004
Figure 5. CART for maximum yield load.
Sci 07 00064 g005
Figure 6. CART for deformation.
Sci 07 00064 g006
Table 1. The variables of the screws examined.
Variables
Length of the working part of the miniscrews6 mm
8 mm
10 mm
Miniscrew inclination relative to the support60°
80°
Insertion depth2 mm
4 mm
6 mm
8 mm
Support thickness2 mm
6 mm
Table 2. Sample combination.
Sample Combination
Sample CombinationWorking Part Length (mm)Diameter (mm)Inclination (°)Insertion Depth (mm)Support Thickness (mm)
1628066
2626066
3828066
4826066
5828086
6826086
71028066
81026066
91028086
101026086
11628022
12626022
13628042
14626042
15828022
16826022
17828042
18826042
191028022
201026022
211028042
221026042
Table 3. Descriptive statistics (mean, standard deviation, minimum, and maximum) for maximum yield load.
Sample CombinationMiniscrewSample Load ValuesDescriptive Load Statistics
Screw 1Screw 2Screw 3Observations (N)Mean (N)SD (N)Min (N)Max (N)
Force (N)Force (N)Force (N)
12 × 6 80° 6 mm200.5201212.53204.76.8200.5212.5
22 × 6 60° 6 mm293.5169.5223.53228.862.2169.5293.5
32 × 8 60° 6 mm8394993928.28399
42 × 8 60° 8 mm162.5178115.5315232.5115.5178
52 × 8 80° 8 mm161241.5191.5319840.6161241.5
62 × 8 80° 6 mm10893.5109.53103.78.893.5109.5
72 × 10 80° 6 mm81.510680.5389.314.480.5106
82 × 10 80° 8 mm99.51001113103.56.599.5111
92 × 10 60° 6 mm59.581.576372.311.459.581.5
102 × 10 60° 8 mm122.58798.53102.718.187122.5
112 × 6 60° 4 mm58.562.548356.37.54862.5
122 × 6 60° 2 mm2438.558340.217.12458
132 × 6 80° 4 mm139.5120.597311921.397139.5
142 × 6 80° 2 mm48.555.536.5346.89.636.555.5
152 × 8 60° 4 mm576062.5359.82.85762.5
162 × 8 60° 2 mm3224.534.5330.35.224.534.5
172 × 8 80° 4 mm826981377.37.26982
182 × 8 80° 2 mm41.529.539336.76.329.541.5
192 × 10 60° 2 mm24.522.517.5321.53.617.524.5
202 × 10 60° 4 mm435249.5348.24.64352
212 × 10 80° 2 mm30.53132331.20.830.532
222 × 10 80° 4 mm5554.551.5353.71.951.555
Total Observations22222266
Table 4. Descriptive statistics (mean, standard deviation, minimum, and maximum) for tip-to-tip linear distance.
Sample Deformation ValuesDescriptive Deformation Statistics
Tip-to-Tip Linear Distance
Sample CombinationsMiniscrewsScrew 1 (mm)Screw 2 (mm)Screw 3 (mm)Observations (N)Mean (mm) SD (mm)Min (mm)Max (mm)
12 × 6 80° 6 mm1.561.141.431.370.211.141.56
22 × 6 60° 6 mm0.740.80.6430.730.080.640.8
32 × 8 60° 6 mm0.271.50.3730.710.680.271.5
42 × 8 60° 8 mm0.720.991.631.10.450.721.6
52 × 8 80° 8 mm2.531.991.2231.910.661.222.53
62 × 8 80° 6 mm2.6421.0331.890.811.032.64
72 × 10 80° 6 mm1.842.191.431.810.41.42.19
82 × 10 80° 8 mm3.241.452.0932.260.911.453.24
92 × 10 60° 6 mm2.010.521.7531.430.80.522.01
102 × 10 60° 8 mm1.872.081.0831.680.531.082.08
112 × 6 60° 4 mm0.590.60.3830.520.120.380.6
122 × 6 60° 2 mm0.310.650.430.450.180.310.65
132 × 6 80° 4 mm0.930.190.430.510.380.190.93
142 × 6 80° 2 mm0.610.220.930.580.340.220.9
152 × 8 60° 4 mm0.860.740.2830.630.310.280.86
162 × 8 60° 2 mm0.660.340.5130.50.160.340.66
172 × 8 80° 4 mm1.081.380.6631.040.360.661.38
182 × 8 80° 2 mm1.011.220.4130.880.420.411.22
192 × 10 60° 2 mm0.730.710.4830.640.140.480.73
202 × 10 60° 4 mm0.670.871.3530.960.350.671.35
212 × 10 80° 2 mm0.730.490.7730.660.150.490.77
222 × 10 80° 4 mm1.221.171.231.20.031.171.22
Total Observations22222266
Table 5. Descriptive statistics (mean, standard deviation, minimum, and maximum) for deformation angle.
Sample Deformation ValuesDescriptive Deformation Statistics
Deformation Angle
Sample CombinationsMiniscrewsScrew 1 (°)Screw 2 (°)Screw 3 (°)Observations (N)Mean (°)SD (°)Min (°)Max (°)
12 × 6 80° 6 mm3.24.4734.871.943.27
22 × 6 60° 6 mm0.54.24.3332.170.54.3
32 × 8 60° 6 mm31.14.532.871.71.14.5
42 × 8 60° 8 mm4.86.12.934.61.612.96.1
52 × 8 80° 8 mm11.58.85.538.635.511.5
62 × 8 80° 6 mm11.994.638.53.684.611.9
72 × 10 80° 6 mm867.437.131.0368
82 × 10 80° 8 mm12.95.68.438.973.685.612.9
92 × 10 60° 6 mm7.926.935.63.162.97.9
102 × 10 60° 8 mm7.28.45.4371.515.48.4
112 × 6 60° 4 mm2.92.81.832.50.611.82.9
122 × 6 60° 2 mm1.23.61.732.171.271.23.6
132 × 6 80° 4 mm3.11.52.232.270.81.53.1
142 × 6 80° 2 mm2.81.92.932.530.551.92.9
152 × 8 60° 4 mm4.912.132.672.0114.9
162 × 8 60° 2 mm1.53.3232.270.931.53.3
172 × 8 80° 4 mm4.65.41.833.931.891.85.4
182 × 8 80° 2 mm2.63.45.233.731.332.65.2
192 × 10 60° 2 mm33.21.932.70.71.93.2
202 × 10 60° 4 mm3.84.23.333.770.453.34.2
212 × 10 80° 2 mm3.93.21.232.771.41.23.9
222 × 10 80° 4 mm4.84.64.534.630.154.54.8
Total Observations22222266
Disclaimer/Publisher’s Note: The statements, opinions and data contained in all publications are solely those of the individual author(s) and contributor(s) and not of MDPI and/or the editor(s). MDPI and/or the editor(s) disclaim responsibility for any injury to people or property resulting from any ideas, methods, instructions or products referred to in the content.

