1. Introduction
In this study, the focus is on nitrogen oxides (NO
x), which is the sum of nitric oxide (NO) and nitrogen dioxide (NO
2). NO
x is emitted to the atmosphere as NO, both anthropogenically, through fossil fuel combustion, agriculture, and biomass burning [
1], and naturally from soil bacteria and lightning [
2]. The concentration of either of the two pollutants (NO or NO
2) in the total amount of NO
x depends on various factors such as the initial emissions, ambient concentrations of ozone (O
3), photochemical reactions, meteorological conditions, and the presence of other pollutants [
3].
Nitrogen compounds play an important role in atmospheric chemistry and air quality as they determine the concentrations and the distribution of O
3 in the troposphere [
4]. In the presence of the hydroxyl (OH) radical, nitrogen compounds form nitric acid (HNO
3) [
5], which contributes to acid rain. The acidification of rain-water is a major environmental problem as it impacts the ecosystem and human health [
6].
NO
x concentrations are short-lived in the atmosphere, with a lifetime of several hours in the boundary layer during daytime [
7]. Evidence shows that the lifetime of NO
x undergoes seasonal variability with a longer lifetime in winter than in summer, 21 h versus 5.9 h, respectively [
8]. NO
x seasonal variability is dependent on the chemical environment and its oxidation. The latter is driven by photochemically produced hydrogen oxide radicals during the daytime. In summer, NO
x is largely depleted by OH oxidation during the day and N
2O
5 hydrolysis, which produces HNO
3 at night. In winter, the NO
x lifespan is substantially longer because of the lower levels of OH and RO
2 radicals [
8]. NO
x has several atmospheric sinks by which it is removed from the atmosphere. These processes include photolysis [
9], formation of HNO
3 [
10], formation of organic nitrates and peroxyacetyl (PAN) [
11], deposition [
12], and conversion to particulate nitrate (NO
3) [
13]. All these different uptake and removal processes influence both the global nitrogen cycles and regional air quality.
According to the European Environment Agency (EEA), the exposure to NO
x at concentrations above the threshold suggested by the World Health Organization (WHO), led to 49,000 premature deaths in continental Europe during the year 2020 [
14]. The most common causes of premature death attributed to air pollution are heart disease and stroke, followed by lung disease and lung cancer. Model studies show that with the introduction of the new Euro 7 vehicle emission standards, NO
x emissions will be further reduced by 93% and can prevent circa 38,000 premature deaths by 2050 [
15]. To further mitigate the number of premature deaths related to NO
x emissions, the European Union (EU) enhanced the air quality guidelines for 2030 in the form of limits and target values that are closer to the WHO guidelines. The new guidelines for the protection of human health, vegetation, and natural ecosystems are enforced by the EU Ambient Air Quality Directive 2024/2881 [
16].
On a regional scale, the Mediterranean basin is mainly influenced by anthropogenic emissions originating from transportation, energy production, agriculture, industrial activities, and urbanisation due to rapid population growth. The NO
x emissions associated with agriculture and industrial activities are 19% and 15%, respectively [
17]. The transportation sector, including road and maritime transport, is the major source of NO
x emissions, particularly in urban and coastal areas, respectively. Road transport contributes to approximately 37% of the NO
x emissions [
17]. Ship emissions account for 16% of the total NO
x emissions in the European Sea areas [
18] and 45% of the NO
x emissions in the western part of the Mediterranean region [
19]. On 1st May 2025, the Mediterranean region will become a Sulphur Emission Control Area (SECA), under MARPOL Annex VI Regulation 14 [
20]. In time, following SECA, the Mediterranean will stand a chance of being declared an Emissions Controlled Area (ECA) to limit the NO
x emissions from maritime transport.
Emissions originating from anthropogenic activities are significantly impacting air quality and human health across Europe and the Mediterranean basin. For this reason, several air quality networks have been set up to continuously monitor various pollutants. This paper concerns data analysis of ground-level observations of atmospheric NOx concentrations and wind data collected in the Central Mediterranean. The data set spans thirteen years and is the longest of its kind in the region.
2. Methodology: Monitoring Site, Instrumentation, and Data Processing
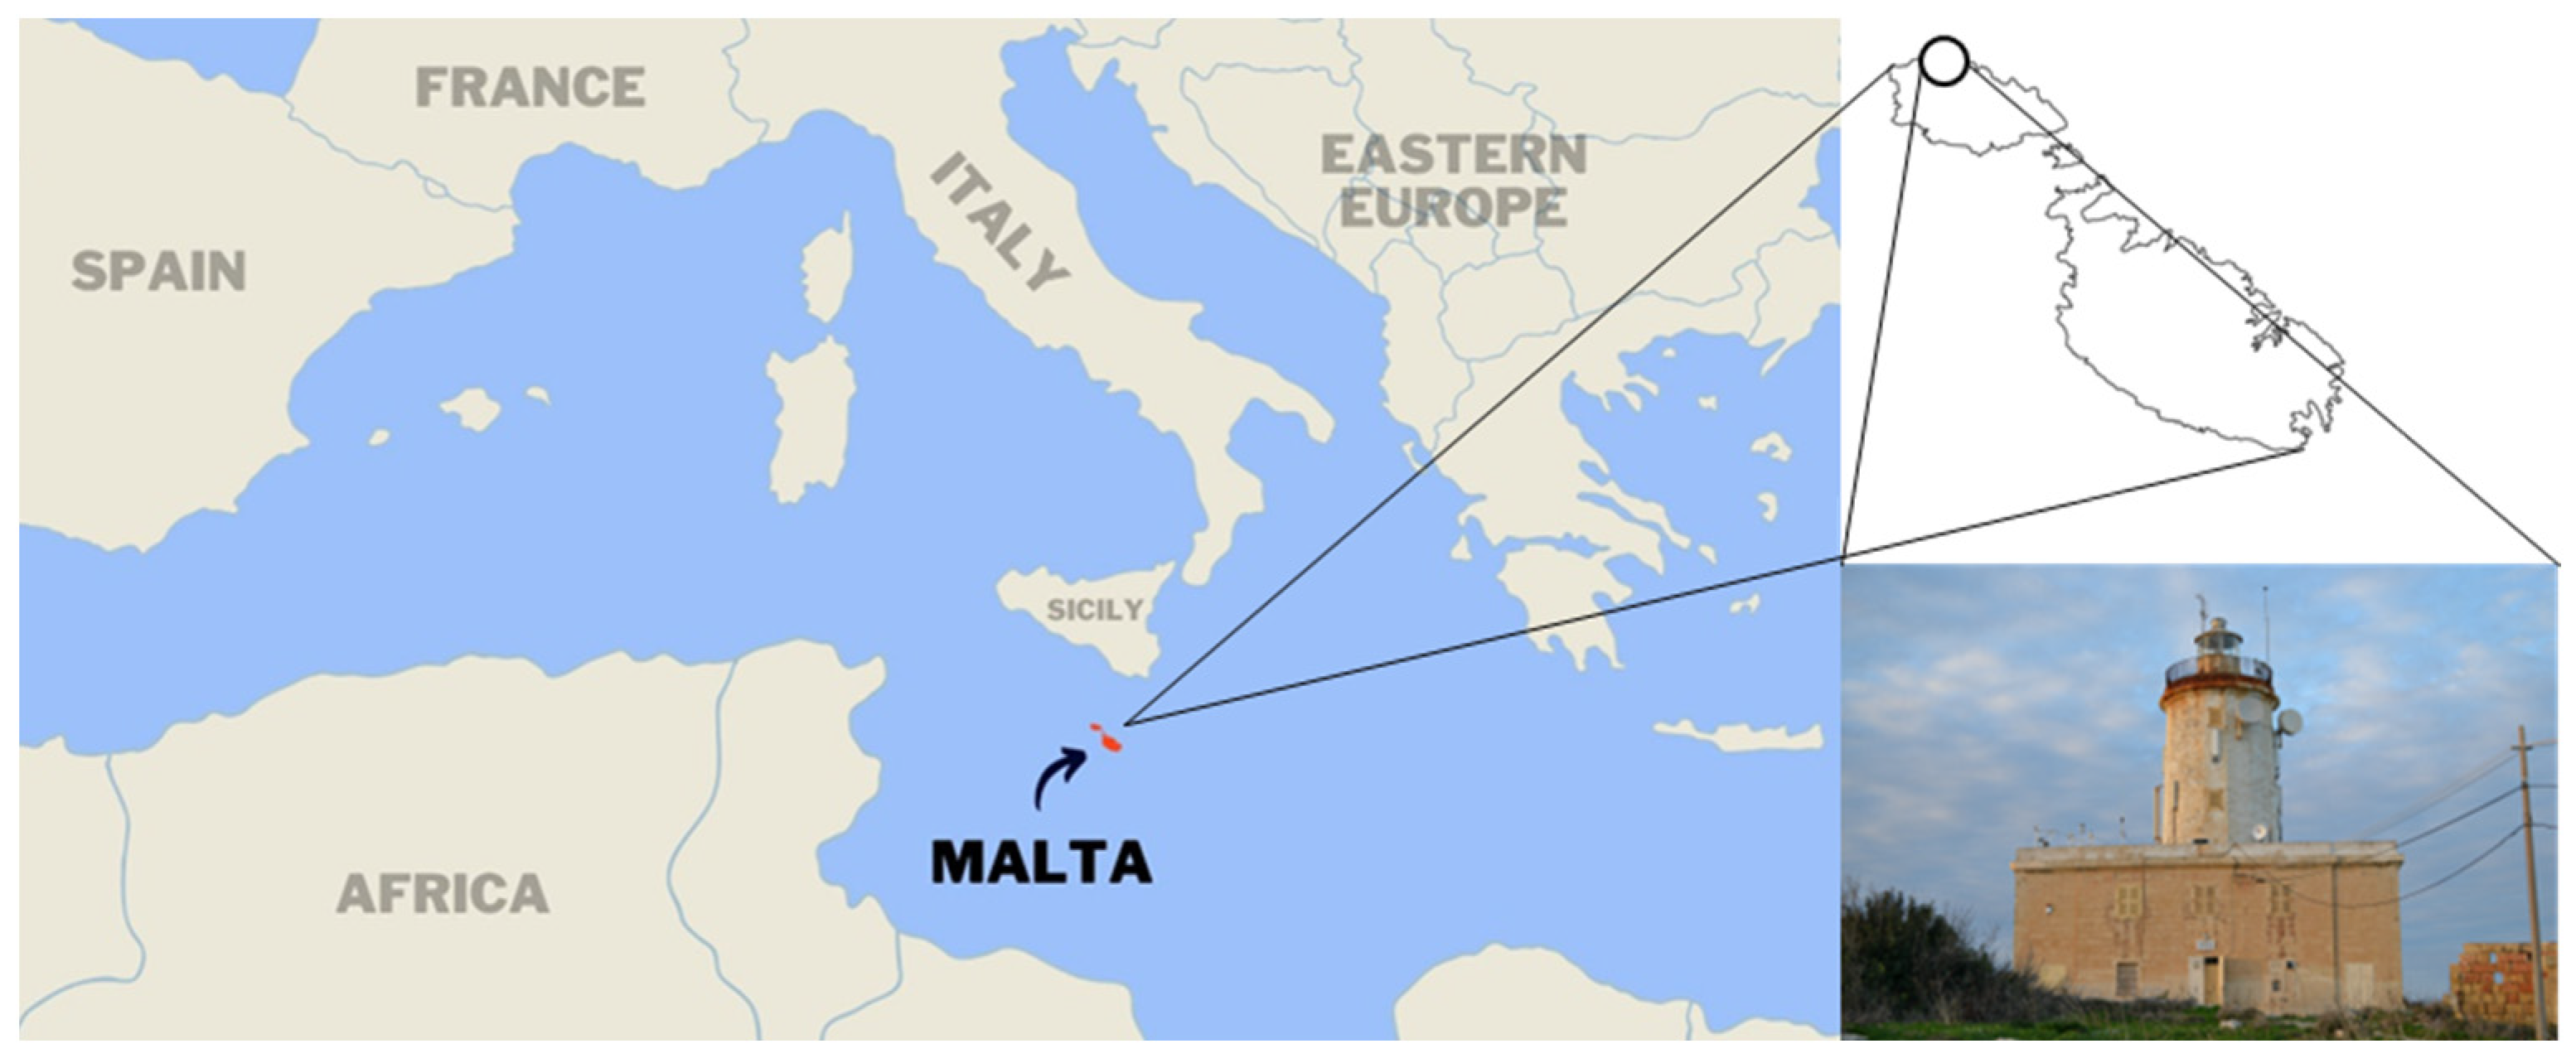
The NO
x measurements were recorded at the Giordan Lighthouse Atmospheric Observatory, which is located on the Northwest side of the island of Gozo; approximately 36° 40′ N, 14° 30′ E, and 167 m above sea level as depicted in
Figure 1. The station is close to the coastline and faces the sea within the sector 260°–60°. This station is part of the Global Atmosphere Watch (GAW) network and is strategically located to monitor background air quality levels, especially concerning marine and regional pollution sources. During spring, the prevailing winds at Giordan Lighthouse are characterised by air masses from North Africa, which sometimes lead to Sahara dust events [
21]. In the summer months, the station is dominated by high-pressure zones leading to high temperatures and strong solar radiation. In summer, the weather conditions are relatively homogenous for the whole Mediterranean basin and are characterised by North-Westerly winds and sea-breeze circulations driven by land–sea thermal contrast [
22]. Conversely, during the fall and winter seasons, the station is influenced by lower temperatures and more variable winds. The station is occasionally influenced by extreme weather conditions like heatwaves in summer and rainy, windy periods in winter. Such events are typically observed in the Mediterranean climate.
The monitoring site is affected by various distant anthropogenic sources of pollution. The prevailing wind transports contaminated air masses from several distinct points and moving sources downwind, towards the Giordan Lighthouse. Indeed, during Northernly winds, the monitoring site is influenced by ship emissions originating in the Straits of Sicily [
23]. The presence of large oil refining plants and industrial hubs located on the island of Sicily [
24] is felt (in terms of air pollution) when the prevailing wind is from the North-East sectors. In the case of South-Easterly winds, vehicular emissions, and light industries on the main island of Malta dominate the scenario.
The station at the Giordan Lighthouse started its operations in 1997. A detailed description of the installed instruments and acquired initial funding is given in [
25,
26].
The NO
x measurements started on 20th January 2011 and lasted until 31st July 2023. As far as can be ascertained, this is the longest data set of NO
x measurements in the Central Mediterranean. The measurements were recorded with a Thermo Scientific Model 42i NO
x analyser. This instrument operates on the chemiluminescence technique to measure the atmospheric nitrogen oxide concentrations [
27]. Basically, the sample ambient NO reacts with ozone (O
3), released by the instrument itself to produce a characteristic luminescence with an intensity linearly proportional to the NO concentration. To measure NO
2 concentrations, some of the ambient air passes through a molybdenum NO
2-to-NO converter heated to about 325 °C capable of reducing atmospheric NO
2 in NO. However, evidence shows that molybdenum converters partly convert other oxidised nitrogen compounds such as nitric acid (HNO
3), alkyl nitrates, and peroxyacetyl nitrate (PAN) to NO [
28]. Therefore, such NO
2 measurements are surrogate because the resultant values systematically overestimate the true values due to the said interferences, especially when sampling photochemically aged air masses [
29]. Published work has shown that molybdenum converters overestimated NO
2 measurements by 50% at a rural site in Switzerland due to the high presence of PAN concentrations [
29].
The NO
x analyser is calibrated twice a year according to the calibration procedure specified in the instructions manual of the instrument. For the background check, the zero gas is generated on-site via the Thermo Scientific Model 111 zero air supply generator. For the span check of the NO channel, the certified NO span gas mixture of 1 ppm is diluted to 25 ppb via the Thermo Scientific Model 146i gas calibrator. The certified span gas comes in a 10-litre cylinder from Air Liquide, Germany. For the span check of the NO
2 channel, the NO
2 span gas is generated on-site via the built-in gas phase titration of the Thermo Scientific Model 146i gas calibrator. During the calibration procedure both the zero and span gases are supplied in access and ambient pressure. As the measured concentrations for each calibration cycle are stabilised, the instrument’s calibration factors are adjusted to reflect the target values. The instrument’s lower detectable limit is 0.40 ppb at 60 s average time [
27].
Meteorological parameters including air temperature, relative humidity, wind speed, and wind direction have been recorded since January 1997. A detailed description of the meteorological sensors and analyses of the atmospheric parameters is provided in [
30].
The measurements at Giordan Lighthouse Observatory are recorded every minute. On a daily basis, the data are checked and flagged according to the specified EBAS standard procedure. On an annual basis, the data are averaged to hourly averages and uploaded to the EBAS database, which is hosted by the Norwegian Institute for Air Research (NILU). The hourly averaged data are submitted to the EBAS repository in Greenwich Mean Time (GMT) format. Once the data are submitted to EBAS, it is manually checked for consistency. Any anomalies in the data are conveyed to the data originators for review and resubmission. Once data passes the EBAS quality assurance procedure, it is published on the EBAS website (
https://ebas-data.nilu.no/, accessed on 1 November 2024). For this paper, the data were downloaded from the EBAS repository. However, in order to align with the Malta time zone, the time series has been adjusted to GMT +1.
It is worth mentioning that a minor data gap in the NOx records exists from 28th July 2020 until 1st September 2020. During this interval, the NOx analyser was sent to the Thermo Fisher Scientific Service Centre, Cheshire, United Kingdom for a general check. On the 31st of July 2023, the station was temporarily shut down due to the start of major works on the only country road leading to Giordan Lighthouse, making the site inaccessible. By the time of writing this paper, the measuring facility is still not operational. It is hoped that operations will be resumed by the end of March 2025.
3. Results and Discussion
In the following subsections, the results are discussed in detail. First, a discussion of the trends is given followed by details concerning seasonal and diurnal variability. The influence of wind direction on trace gas concentrations is also discussed. All the data analysis was performed with the International Business Machines (IBM) Corporation Statistical Package for the Social Sciences (SPSS) software (
https://www.ibm.com/spss, accessed on 1 November 2024).
3.1. Trends Analysis
Over the years, historical measurements of NO
x concentrations have been gathered through a combination of ground-based monitoring stations, emission inventories, and satellite observations. Evidence shows that NO
x emissions across Europe were increasing between 1950 and 1980 due to an upward trend in fuel consumption by road transport, industrial activities, and energy generation. Between 1990 and 2005, NO
x levels decreased by more than 30% compared to the previous decades [
31]. In 2022, NO
x emissions decreased by a further 50% compared to those for the year 2005, for the EU-27 [
32]. The reductions are mainly observed in the case of road transport due to policy actions that have been taken, including the regulation of emission standards for vehicles (referring to Euro 1–6) and the requirements for the improvement of fuel quality [
33]. This decline can also be attributed to other factors such as the adoption of cleaner technologies such as electric cars and a shift towards renewable energy sources.
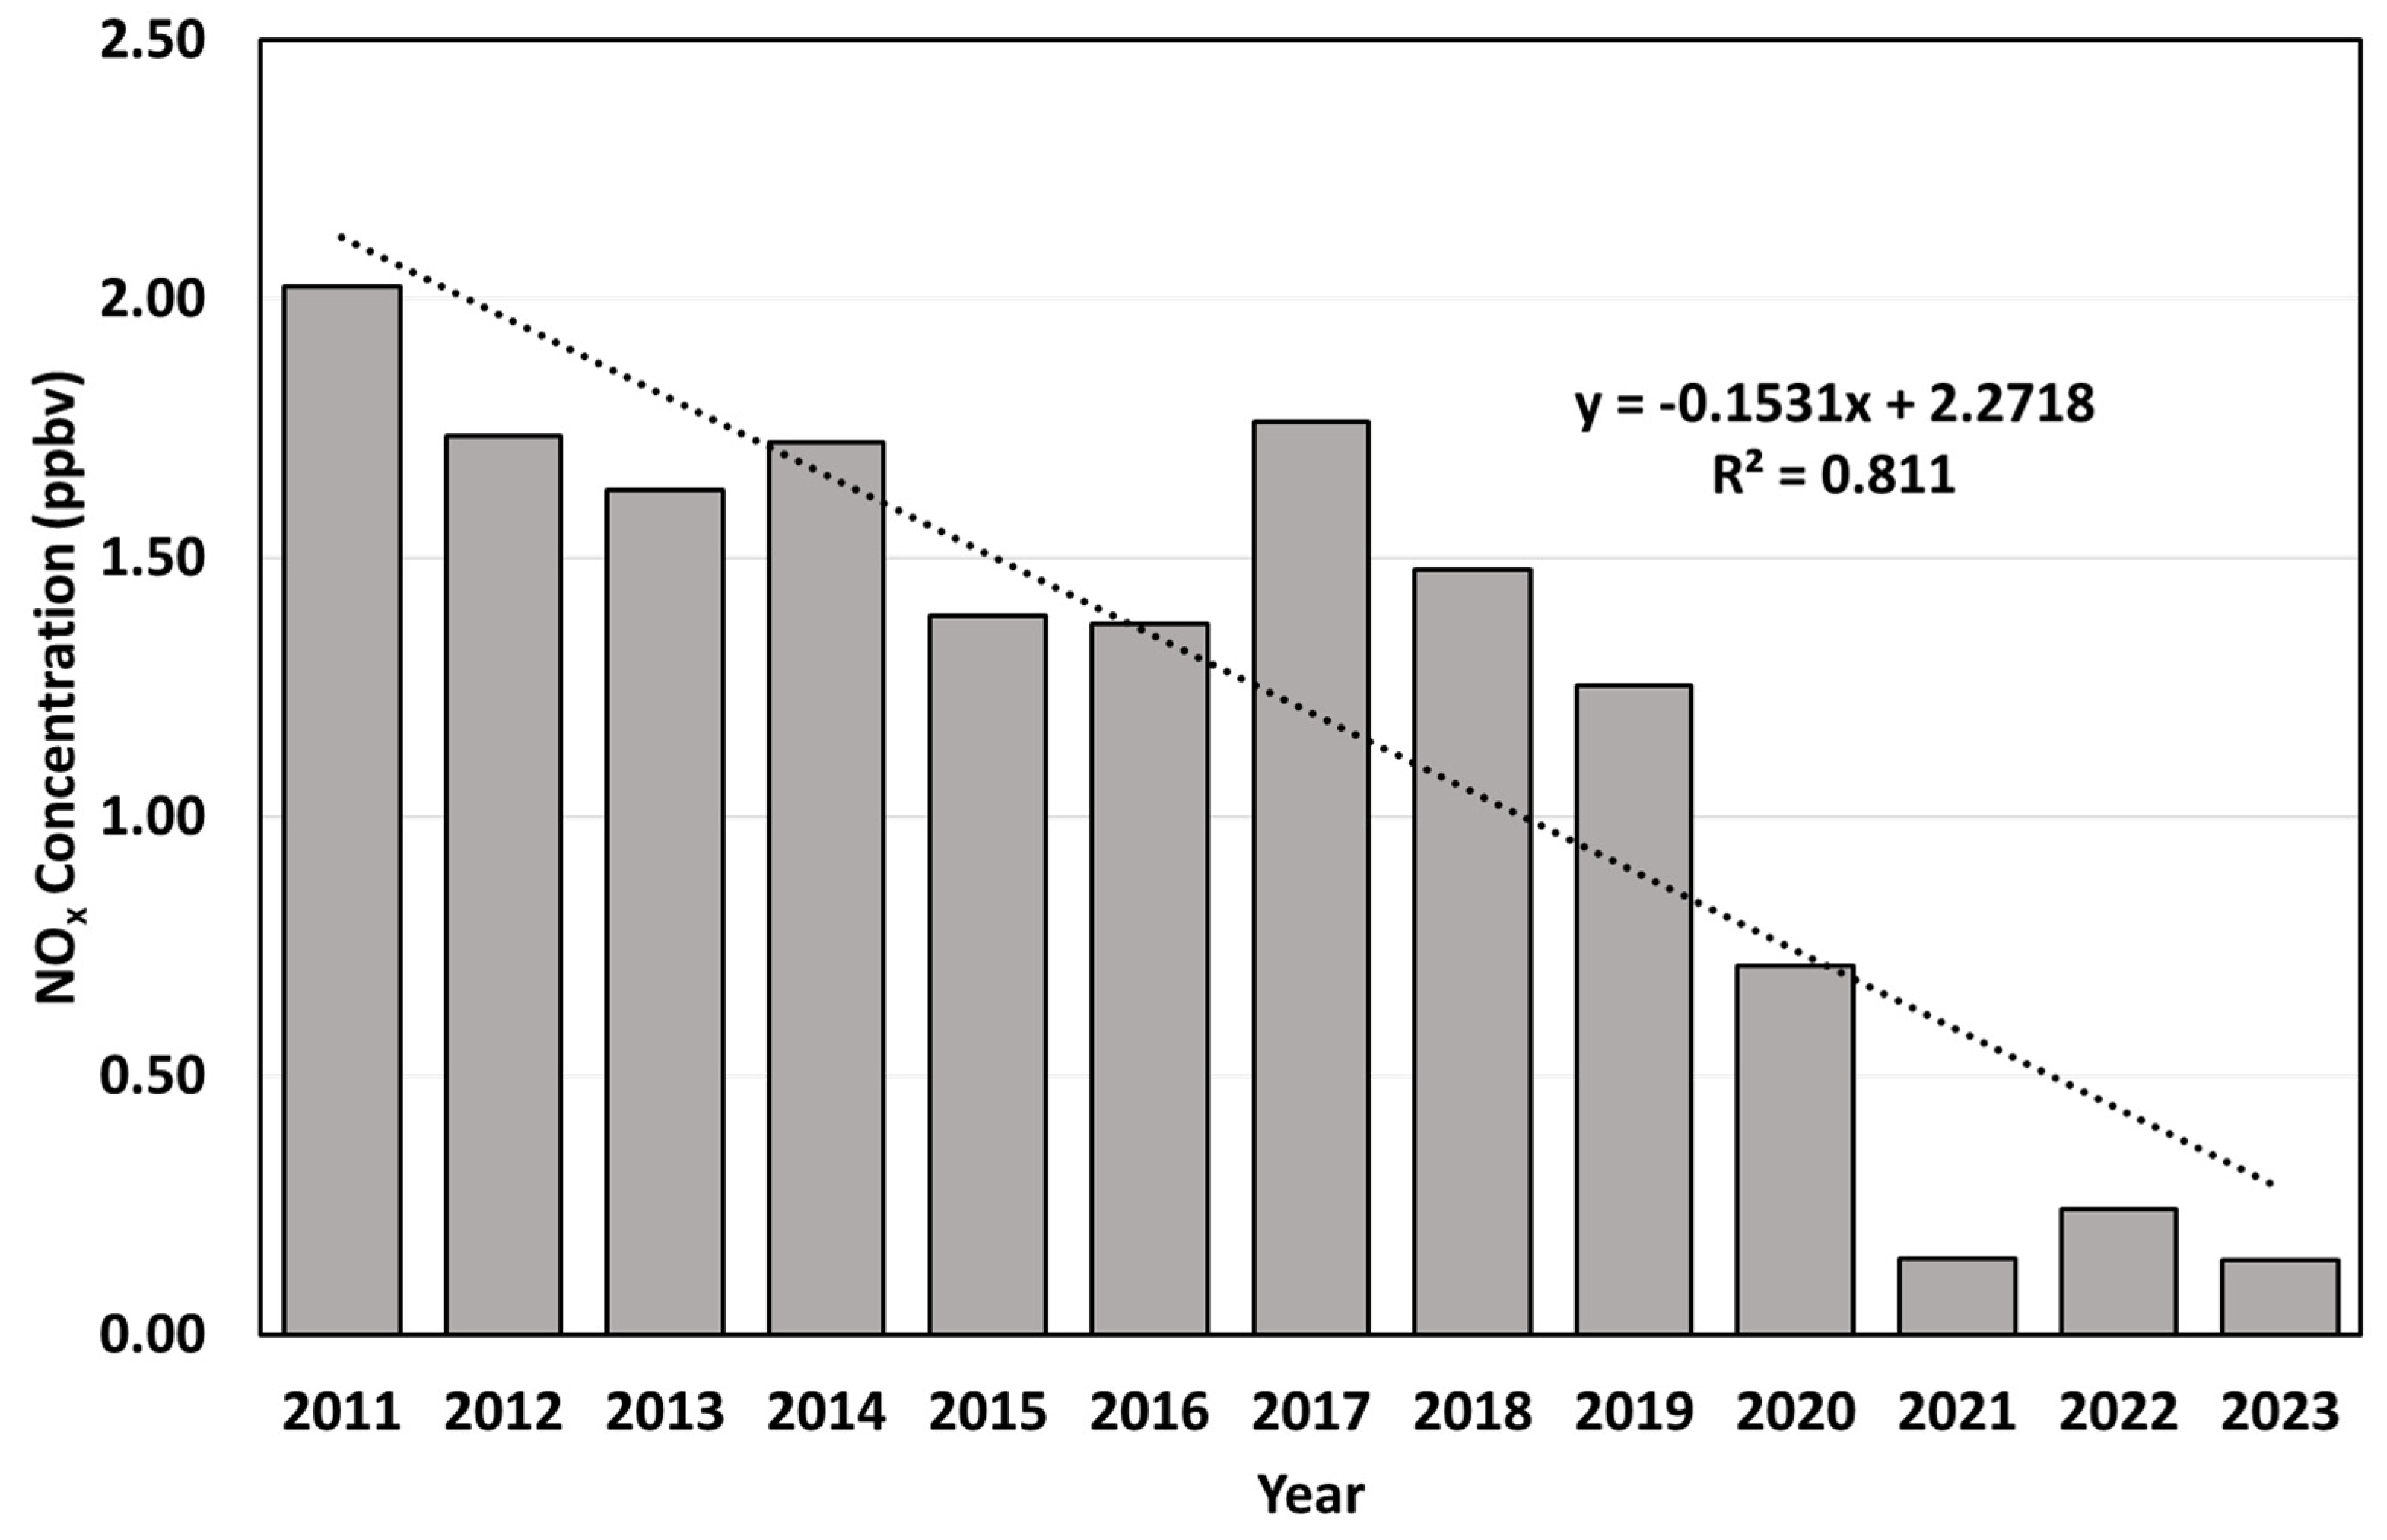
The analysis of the NO
x observations from the Giordan Lighthouse station reveals a clear annual trend as demonstrated in
Figure 2. An overall decrease in the NO
x concentration is observed, from 2.02 ppbv in 2011 to 0.15 ppbv in 2023. The NO
x concentration is decreasing at an annual rate of 0.15 ppbv per year. This agrees with what has been reported for Europe and the Mediterranean region during the last decade [
32].
Referring to
Figure 2, the NO
x annual averages also reveal the dramatic reduction in the NO
x levels during the COVID-19 pandemic spanning the years 2020 and 2022. On the 16th of March 2020, the Maltese government announced the first partial lockdowns, which included the closure of premises hosting indoor activities such as bars, restaurants, cinemas, and schools. These partial lockdowns restricted the mobility of people and led to a dramatic decrease in tourist arrivals to Malta. In fact, the NO
x levels in the year 2020 decreased by 43% compared to 2019. Further reductions were also recorded for the year 2021. These reductions were only temporary, and NO
x levels started to increase again in the year 2022 due to the rebound of transport volumes. It is worth noting that the only exception to the general downward trend is the year 2017. The increase in the NO
x levels during that year might be potentially due to the boom in local construction activities. The trend analysis for the pre-COVID-19 pandemic (2012–2019) also reveals that NO
x concentrations were decreasing at a slow rate of 0.07 ppbv per annum. The decline in NO
x concentrations in the Central Mediterranean contrasts with what has been reported in [
34] where greenhouse gas concentrations, particularly carbon dioxide and methane, are increasing at a substantial rate per annum.
3.2. Seasonal Variability
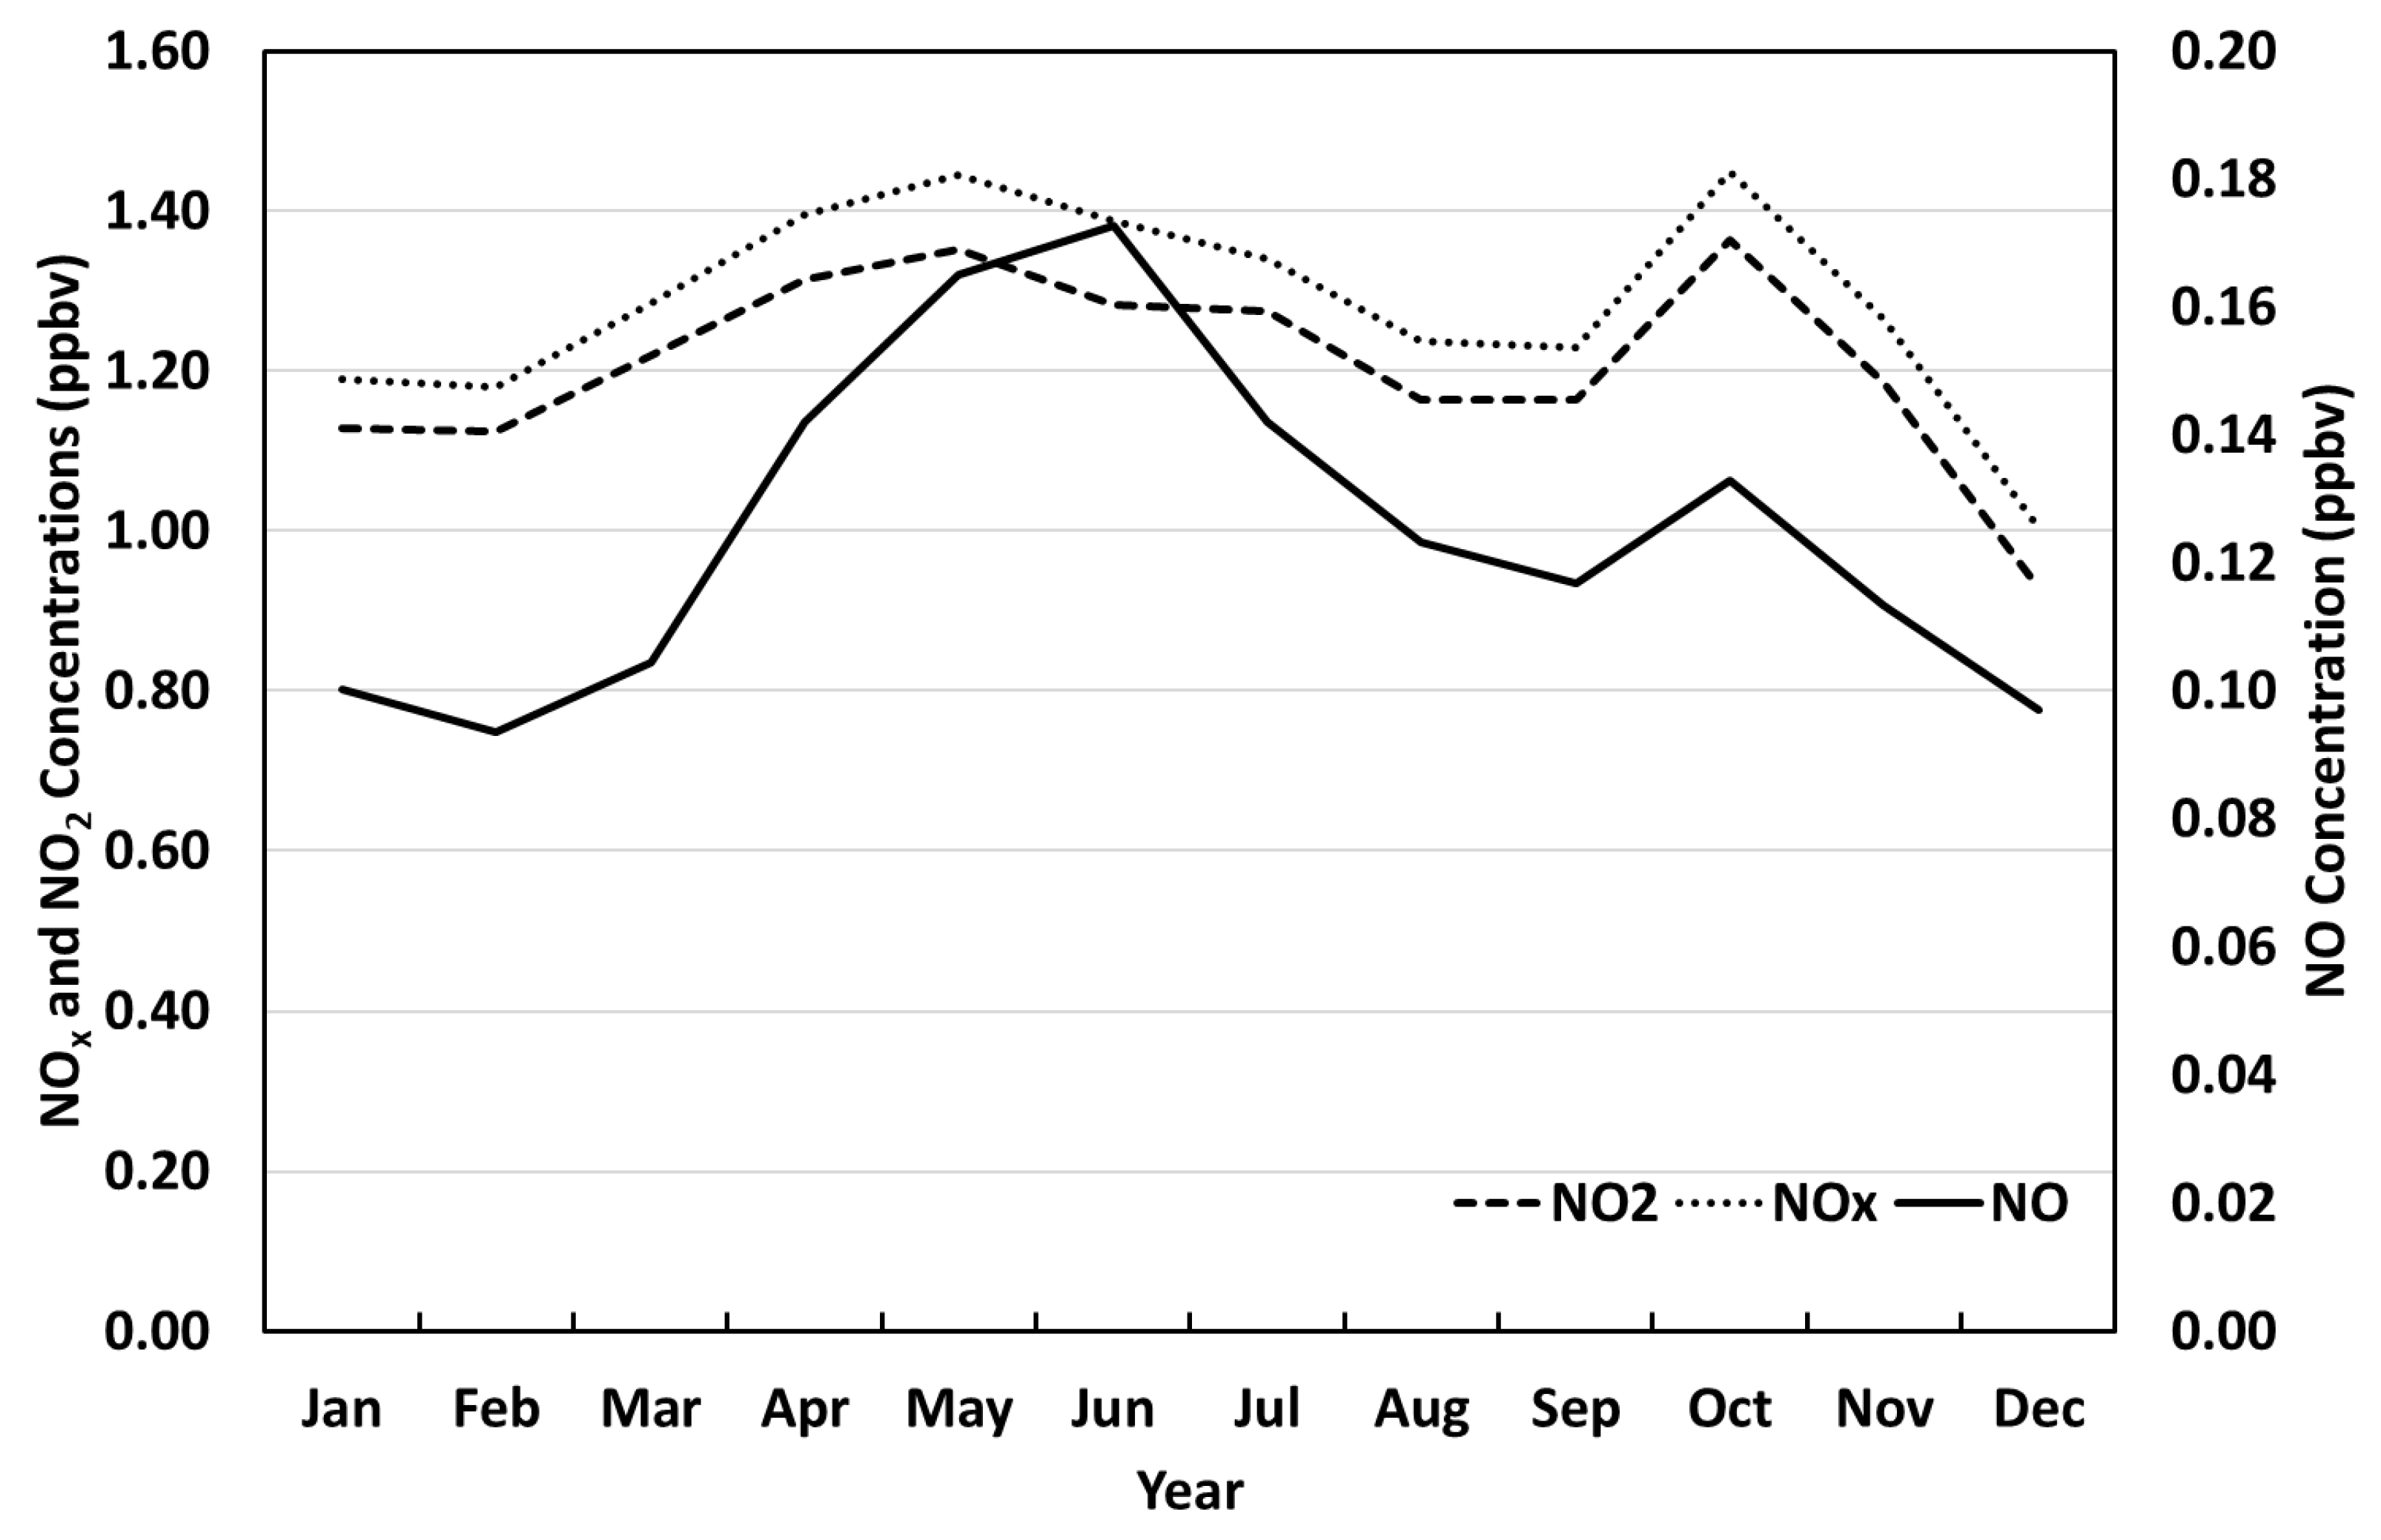
This section concerns the data analysis pertaining to the seasonal cycles of the NO
x compounds under consideration. For this analysis, the monthly mean concentrations of NO, NO
2, and NO
x were calculated from the hourly values. The monthly mean concentration for each month of the year is presented in
Figure 3. It is evident that clear seasonal cycles exist. NO concentrations reach a maximum in June, a secondary maximum in October, and a minimum in February. While the concentrations of NO
2 and NO
x both exhibit maxima in October and minima in December.
The NO
x seasonal cycles observed in the Central Mediterranean contrast with what was observed at Mt. Cimone in Italy, where NO levels are characterised by a peak in February–March and a minimum in summer [
35]. Similar observations have been recorded at two Northern Greek cities, namely Thessaloniki and Ioannina, with a NO
2 maximum during winter and a minimum during the summer months due to high atmospheric photochemical activity [
36]. NO
x concentrations in Northern and Central Europe tend to peak in the winter months due to increased emissions from domestic heating systems and limited atmospheric mixing. In the case of Southern Europe and the Central Mediterranean, localised and high NO
x emissions during the summer months are mainly associated with an increase in tourism. For example, at the urban air quality station in Patission, Greece, the NO seasonal minimum is recorded in August and the maximum in November. While the NO
2 seasonal minimum levels are exhibited in August and the maximum values in June [
37].
NO seasonal concentration for the Giordan Lighthouse station varies from 0.09 ppbv to 0.17 ppbv and has a seasonal amplitude of 63%. The monthly concentration range for NO
2 and NO
x spans from 1.36 ppbv and 1.45 ppbv to 0.93 ppbv and 1.00 ppbv, respectively. The seasonal amplitude for NO
2 and NO
x is 36% and 35%, respectively. From the relevant analysis, one concludes that NO has the highest seasonal variation with the maximum exhibited during the spring and summer transition. This contrasts with what is reported for Northern and Central Europe where peaks of NO concentrations are exhibited during the winter season. The unique characteristic presented by the NO seasonal variability in the Central Mediterranean can be attributed to several factors. June is usually associated with the start of the holiday season and an increase in tourism. Furthermore, there is an increase in vessels’ activities in the Straits of Sicily and around the Maltese Islands, as reported in [
23]. Although NO is directly emitted in the atmosphere mainly from incomplete combustion processes, the spring/summer seasonal transition could enhance the NO contributions from the marine boundary layer due to variations in the height of the atmospheric mixing layer.
3.3. Diurnal Variability
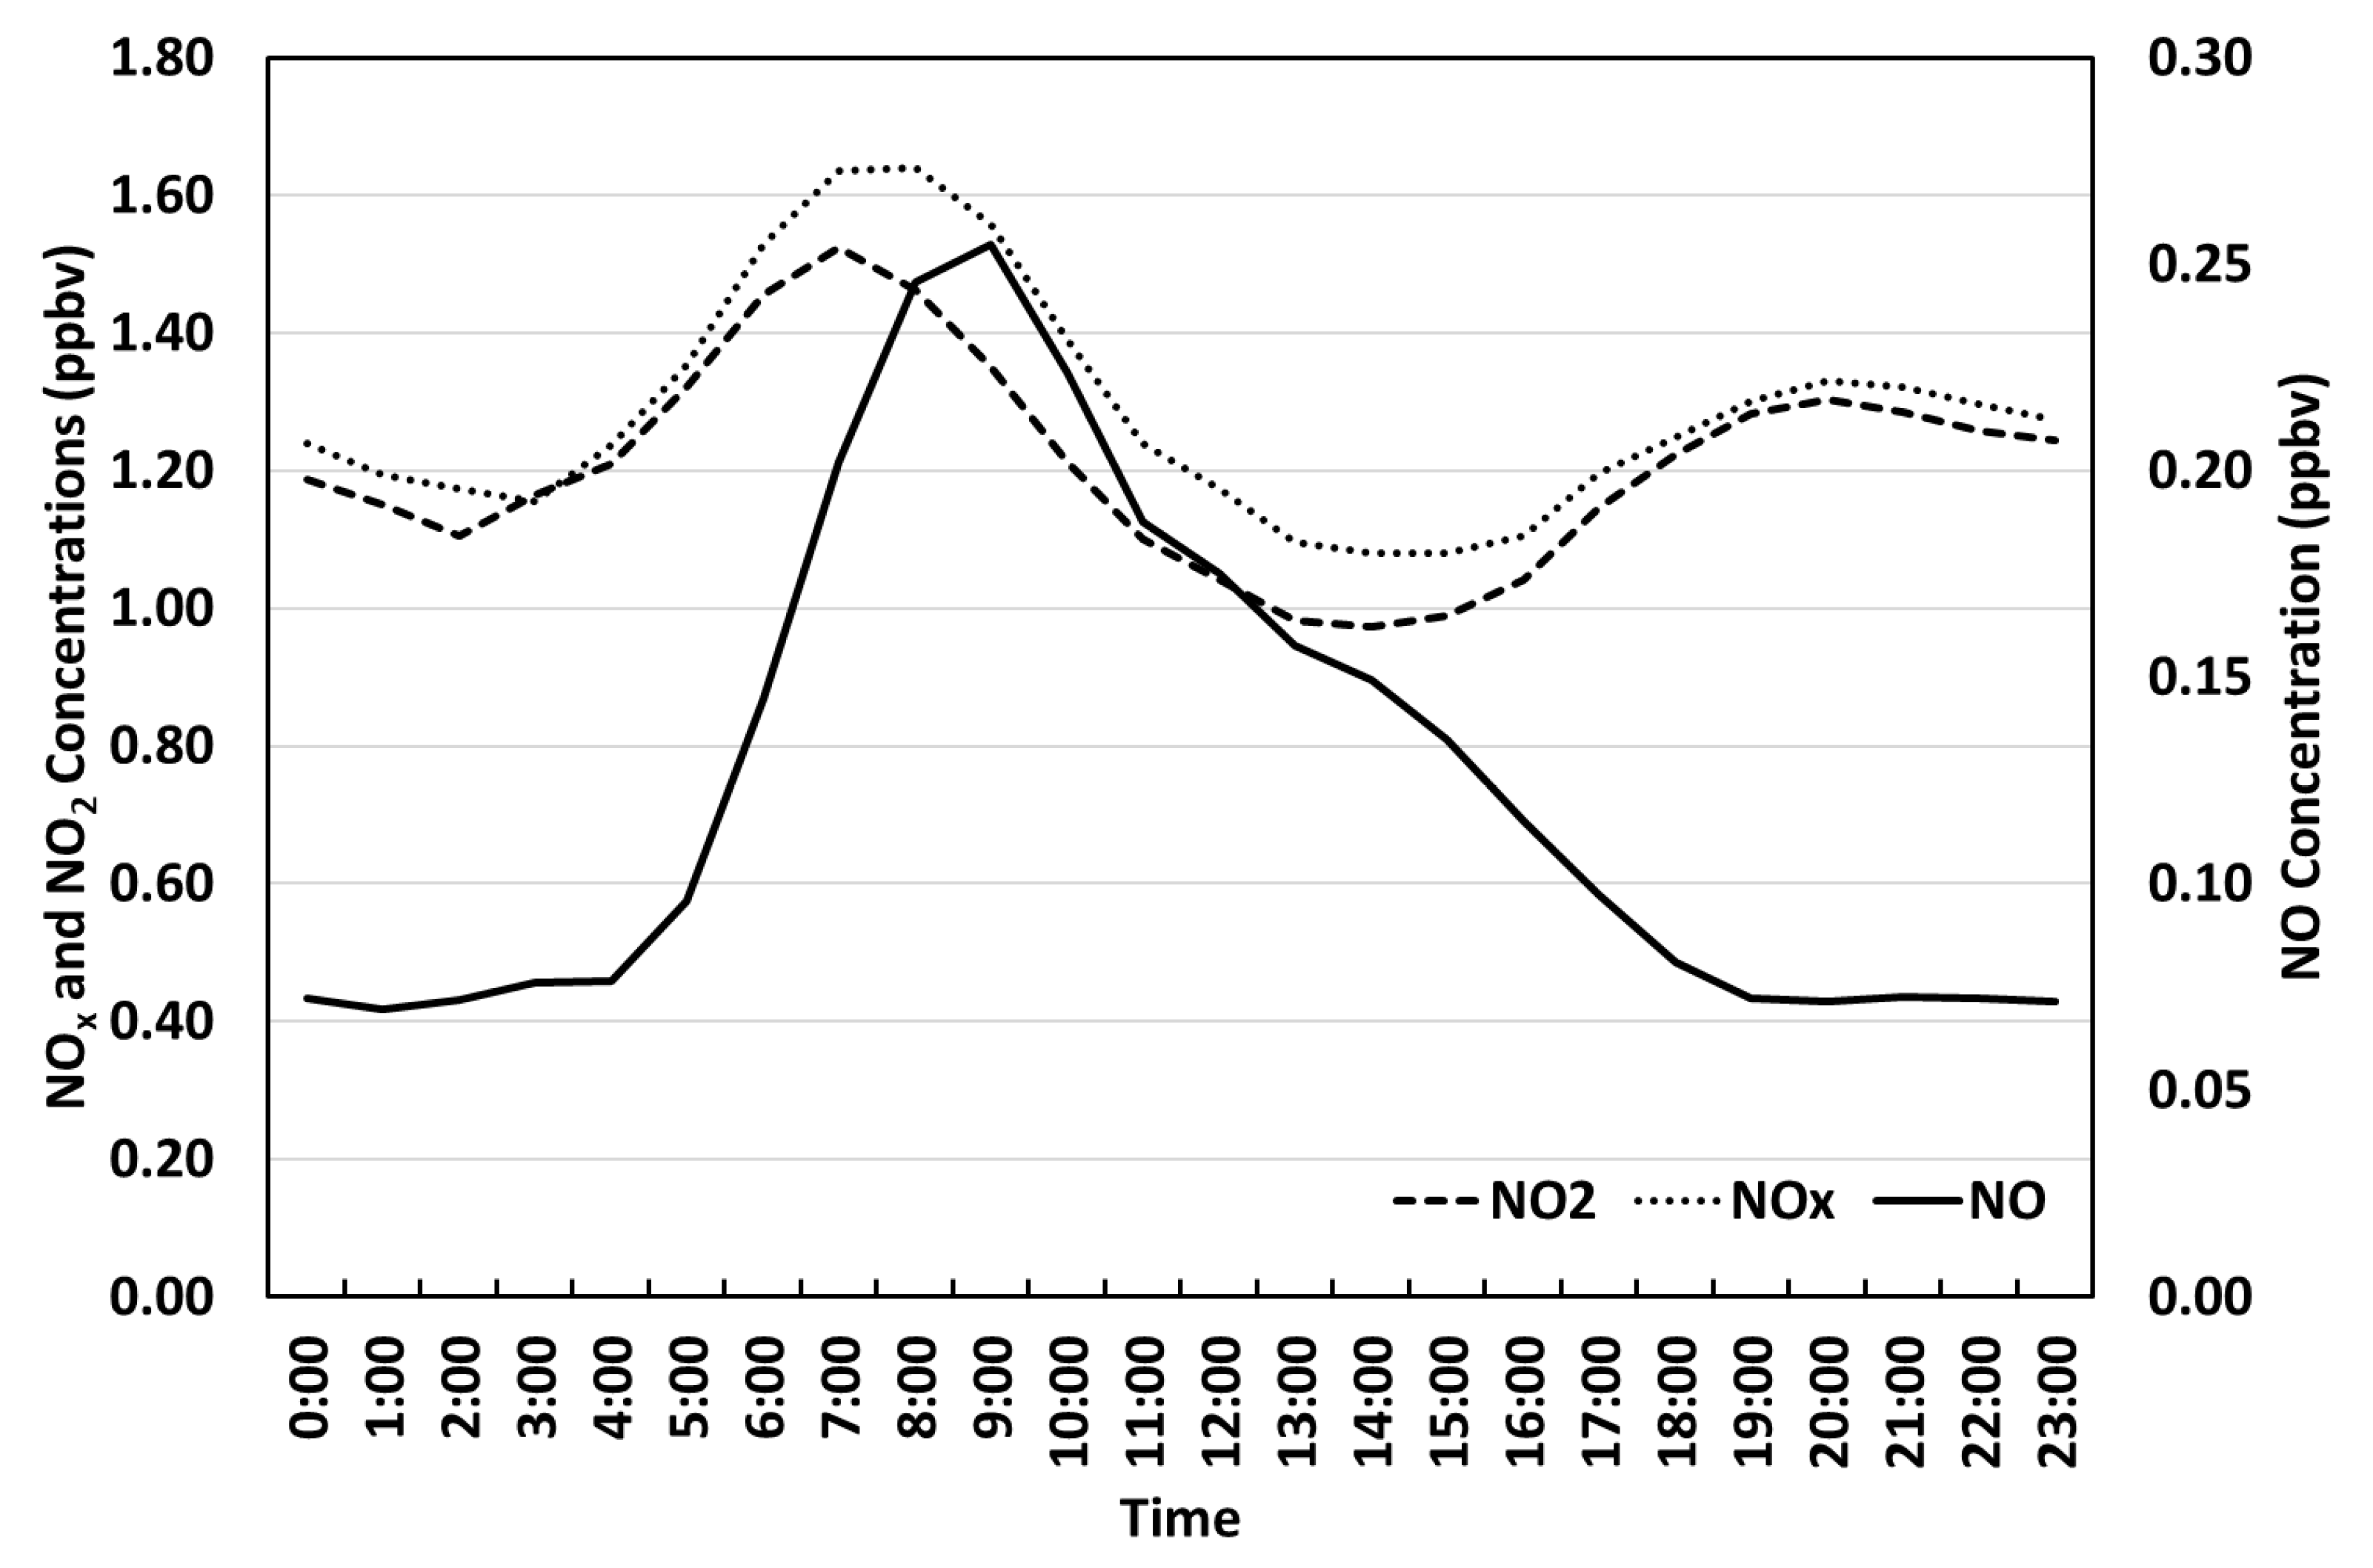
The diurnal variations in the compounds in question are shown in
Figure 4. The NO
2 concentration exhibits a bimodal distribution with a maximum at 7:00 and a secondary maximum at 20:00. While the NO concentration only exhibits a maximum at 9:00. These diurnal variations are somewhat unique compared to observations in Athens, Greece, where the morning NO peak precedes the NO
2 peak by some hours [
37]. It is a well-known fact that more than 95% of the NO
x is emitted as NO, which is later oxidised to NO
2 by different photochemical reactions [
38]. Therefore, the NO maximum must precede that of NO
2. However, in the case of the Giordan Lighthouse station, the NO
2 maximum anticipates the NO maximum by two hours. One possible explanation of this phenomenon is the augmentation of the ageing oxidised nitrogen compounds trapped in the nocturnal boundary layer, caused by advective transport. The NO
2 morning bias can also be associated with the molybdenum converter of the NO
x analyser.
NO concentrations show a pronounced maximum at 9:00, which is mainly attributed to the morning rush hours, when human activities and traffic emissions are also elevated. Then, after approximately 10:00, the NO concentration starts to decline due to an increase in solar radiation and enhanced photochemical activity involving O
3. In the afternoon, when the O
3 production is high, the NO is converted to NO
2, which leads to a broader secondary maximum of the NO
2 concentration in the evening. The fact that NO does not present a secondary maximum in the evening, due to elevated O
3 concentration usually found in rural areas, means that the Giordan Lighthouse station is indeed rural in character and acts as a background station for the Maltese Islands. Similar observations for NO have been observed in the case of rural sites such as that reported for Southern Spain [
39] and the Marmara Region of Turkey [
40].
The percentage diurnal amplitudes, after normalisation, for NO, NO2, and NOx concentrations are 148%, 46%, and 44%, respectively, for the thirteen-year period considered. Although NO is much less abundant than NO2, the relevant analysis reveals that NO has a diurnal variance, which is approximately three times higher than that for NO2 due to the fact that NO is a very reactive gas and acts as a catalyst in the presence of ozone.
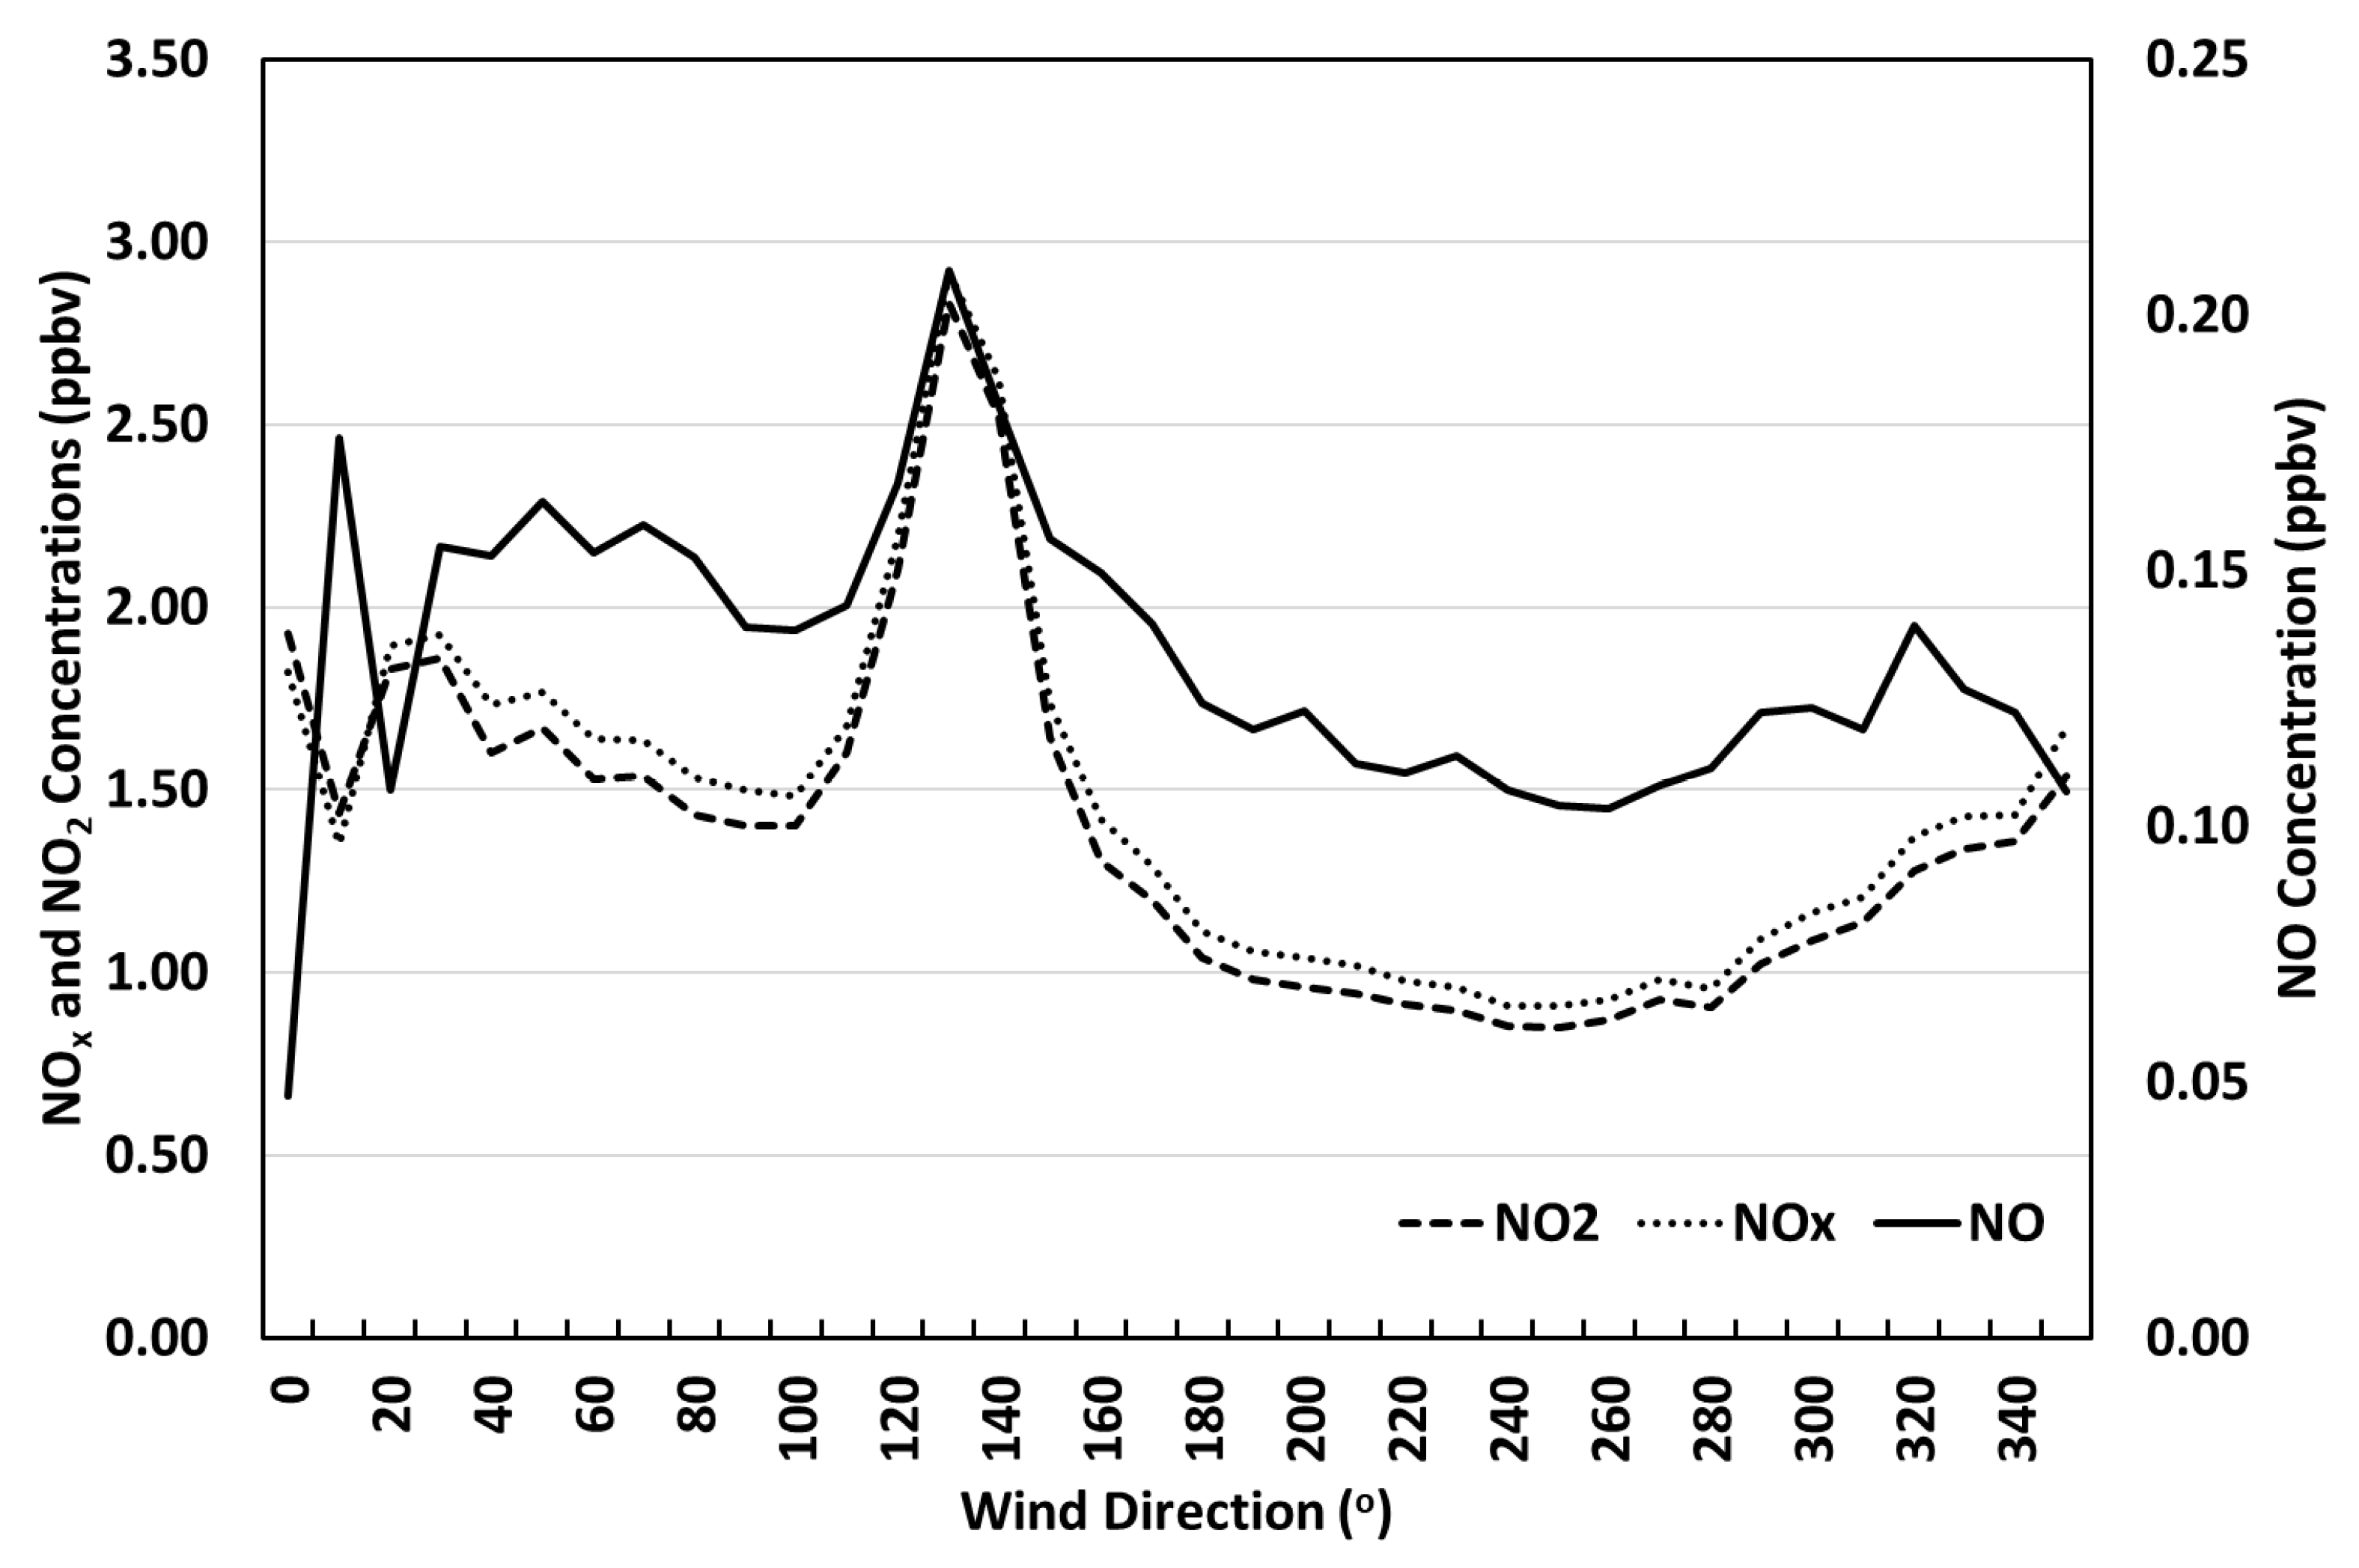
3.4. Influence of Wind Direction
The concentrations of the compounds in question have also been investigated with respect to wind direction (refer to
Figure 5). The associated analysis reveals that both NO and NO
2 correlate well with wind direction except for the Northerly winds, particularly when the prevailing wind is from the sector 350°–20°. Both NO and NO
2 show a strong correlation with wind direction when the wind is blowing from the South-East sector. This characteristic is due to the quenching effect of O
3 as a result of high NO emissions originating from anthropogenic activities, particularly road transport on the main island of Malta. Indeed, in [
41], it is reported that when the prevailing wind is from the South-East sector, the O
3 concentrations exhibit minimum values with respect to the other wind sectors. Winds from the South-East sector transport polluted air masses originating from the main island of Malta. According to the Malta National Statistics Office (NSO), the number of registered vehicles on the Maltese Islands totaled 438,567 by the end of 2023 [
42]. This equates to a car density of 1135 vehicles km
−2. Practically, the entire automobile stock is fueled by diesel (∼40%) or petrol (∼60%), and the average age of passenger cars in Malta at the time stood at 15.73 years [
42]. This means that most of the vehicles were built to comply with far less rigorous emissions standards than those defined by Euro 6. Indeed, motor vehicles in Malta are a major source of anthropogenic NO
x emissions. This explains the said phenomenon.
All the nitrogen compounds discussed here reach a maximum when the wind is blowing from the South-East sector (120°–130°). The minimum for NO2 and NOx are exhibited when the prevailing wind is from the South-West sector, particularly from the sector, 240°–250°. NO exhibits a minimum when the wind is blowing from the North. The amplitude as a function of wind direction for NO, NO2, and NOx is 123%, 157%, and 151%, respectively. This analysis shows that the level of NO2 concentration depends on the prevailing wind due to the photochemical reaction with O3.
3.5. Correlation Analysis with Meteorological Parameters
The influence of meteorological parameters such as temperature, relative humidity, wind speed, and wind direction on the NOx concentrations was investigated for the study period. Analysis showed that the hourly averages for the ambient temperature varied from approximately 1 to 40 °C. Linear regression analysis revealed that NOx concentrations have a very weak but positive correlation with temperature (R2 = 0.010). However, the correlation with relative humidity is statistically insignificant (R2 = 0.001). With respect to wind direction, the NOx concentrations are negatively correlated (R2 = 0.028). Correlation with wind speed is weak (R2 = 0.006).
4. Conclusions
The main purpose of this work is to provide a first characterisation of the variability of atmospheric oxides of nitrogen, at the Giordan Lighthouse station, which forms part of the Global Atmosphere Watch network of the World Meteorological Organisation, in the Central Mediterranean. At an altitude of 167 m above mean sea level, Giordan Lighthouse represents a relatively ideal site to investigate the baseline conditions of the oxides of nitrogen, in the most southern area of Europe. Analysis and observations concerning concentrations of the said compounds over a 13-year period are presented and discussed. This data set consists of the longest record of ground-level concentrations of the oxides of nitrogen in the atmosphere, in the Central Mediterranean, in recent times. Annual, seasonal, diurnal, and wind variabilities of NO
x concentrations were investigated. Trend analysis reveals that NO
x concentrations are decreasing at a rate of 0.15 ppbv per year. This agrees with what was reported for Europe during the last decade [
33] due to the rigorous emissions standard introduced over the past years defined by Euro 1–6. NO
x annual averages also reveal a dramatic reduction in NO
x levels during the COVID-19 pandemic.
The analysed data indicates that oxides of nitrogen exhibit a unique seasonal variability. Monthly averages of NO concentrations vary from 0.09 ppbv in February to 0.17 ppbv in June. Monthly mean concentrations of NO2 fluctuate from 0.93 ppbv in December to 1.36 ppbv in October. In Northern and Central Europe, NOx concentrations peak in the winter months due to increased emissions from domestic heating systems and limited atmospheric mixing. Hence, this leads to an increase in the NOx lifespan due to shorter days in which photochemical reactions are at a minimum as compared to summer. However, in the case of the Central Mediterranean, NO concentrations exhibit maxima in June. This localised phenomenon/abnormality is mainly attributed to an increase in tourism in Southern Europe during the warmer months. Regarding seasonal amplitudes (respective values in brackets), NO (63%) has much higher seasonal variability compared to NO2 (36%). Concentrations of the oxides of nitrogen also exhibit a diurnal variability. Usually, the diurnal peak of NO concentrations precedes that of NO2. However, in the case of the Giordan Lighthouse station, the diurnal peak of NO2 concentrations precedes that of NO, by two hours. This is attributed to the ageing NO2 trace gas, which is trapped in the atmospheric boundary layer as the mixing height decreases during the night-time. The NO2 diurnal variability presents a bimodal distribution with a peak in the early morning and a secondary maximum late in the evening. NO concentrations only exhibit a peak around 9:00. These characteristics are associated with rural and background sites due to the high presence of O3. The percentage diurnal amplitudes for NO and NO2 concentrations are 148% and 46%, respectively. Wind direction dependence was also investigated. It was found that both NO and NO2 correlate well with wind direction, except when the wind is blowing approximately from the North sector. Furthermore, both NO and NO2 exhibit maxima and strong correlation when the prevailing wind is from the South-East sector due to high NO emissions from the main island of Malta and quenching of O3. The percentage amplitudes for NO and NO2 with respect to the wind direction are 123% and 157%, respectively.
Overall, trend analyses indicate that NOx concentrations are decreasing in comparison to both the Central Mediterranean and Continental Europe due to collective efforts and implementation of stricter emissions standards, particularly those pertaining to land transport on the Maltese Islands. Hopefully, cooperation amongst the Mediterranean countries and the relevant stakeholders will lead to the establishment of an emission control area in the Mediterranean basin to further reduce NOx emissions from maritime transport.

