
From Radar Sensor to Floating Car Data: Evaluating Speed Distribution Heterogeneity on Rural Road Segments Using Non-Parametric Similarity Measures

 ,
,  ,
, 
 and
and 
Abstract
1. Introduction
2. Materials
- Time Reference: Date and time of data acquisition;
- Lane: The specific lane on which the vehicle was traveling;
- Direction: The direction of travel;
- Speed: The speed of the vehicle recorded in km/h;
- Vehicle Class: A code identifying the vehicle type (e.g., cars and trucks).
- Identification Code: Unique identifier for each data point;
- Longitude and Latitude: Vehicle location coordinates in WGS 84 format;
- Direction: Direction of travel expressed as an azimuth angle;
- Speed: Vehicle speed at the time of signal emission;
- Date and Time: Timestamp of the GPS signal;
- Signal Quality: Quality of the GPS signal;
- Vehicle ID: Unique identifier for each vehicle;
- Vehicle Type: Classification of the vehicle.
3. Methods
3.1. Homogeneity and Non-Homogeneity
3.2. Histograms and Histograms Series
3.3. Similarity and Dissimilarity Measures in Large Datasets and Histogram Series
- D(p,q) ≥ 0 for all p and q defined over R (non-negativity);
- D(p,q) = 0 if and only if p = q (identity of indiscernible).
- D(p,q) = D(q,p) (symmetry);
- D(p,q) ≤ D(p,g) + D(g,q) for any distribution g over R (triangle inequality).
3.4. Wasserstein Metric
4. Speed Probability Distribution on Two-Lane Road Segments
4.1. Establishing Baseline Data for Analyzing Speed Distribution Similarity
- Signal Frequency Check: Vehicles with data points recorded at frequencies lower than 1 Hz could indicate gaps in the trajectory and were flagged for further inspection;
- Temporal and Spatial Continuity: For each vehicle, the sequence of recorded positions (latitude, longitude, and corresponding timestamps) has been examined to ensure that the vehicles followed a logical and continuous progression along the road. Significant gaps in time between successive data points, or abrupt, unrealistic jumps in spatial position (which could not be explained by the vehicle’s speed or the road’s geometry), were used as indicators of a non-continuous trajectory;
- Cross-Reference with Road Geometry: If the trajectory data suggested that a vehicle deviated significantly from the expected path without any corresponding road features that could explain such a deviation (e.g., intersections, exits), this was considered a lack of continuity.
4.2. Speed Distributions Heterogeneity and Similarity Measure
5. Result and Discussion
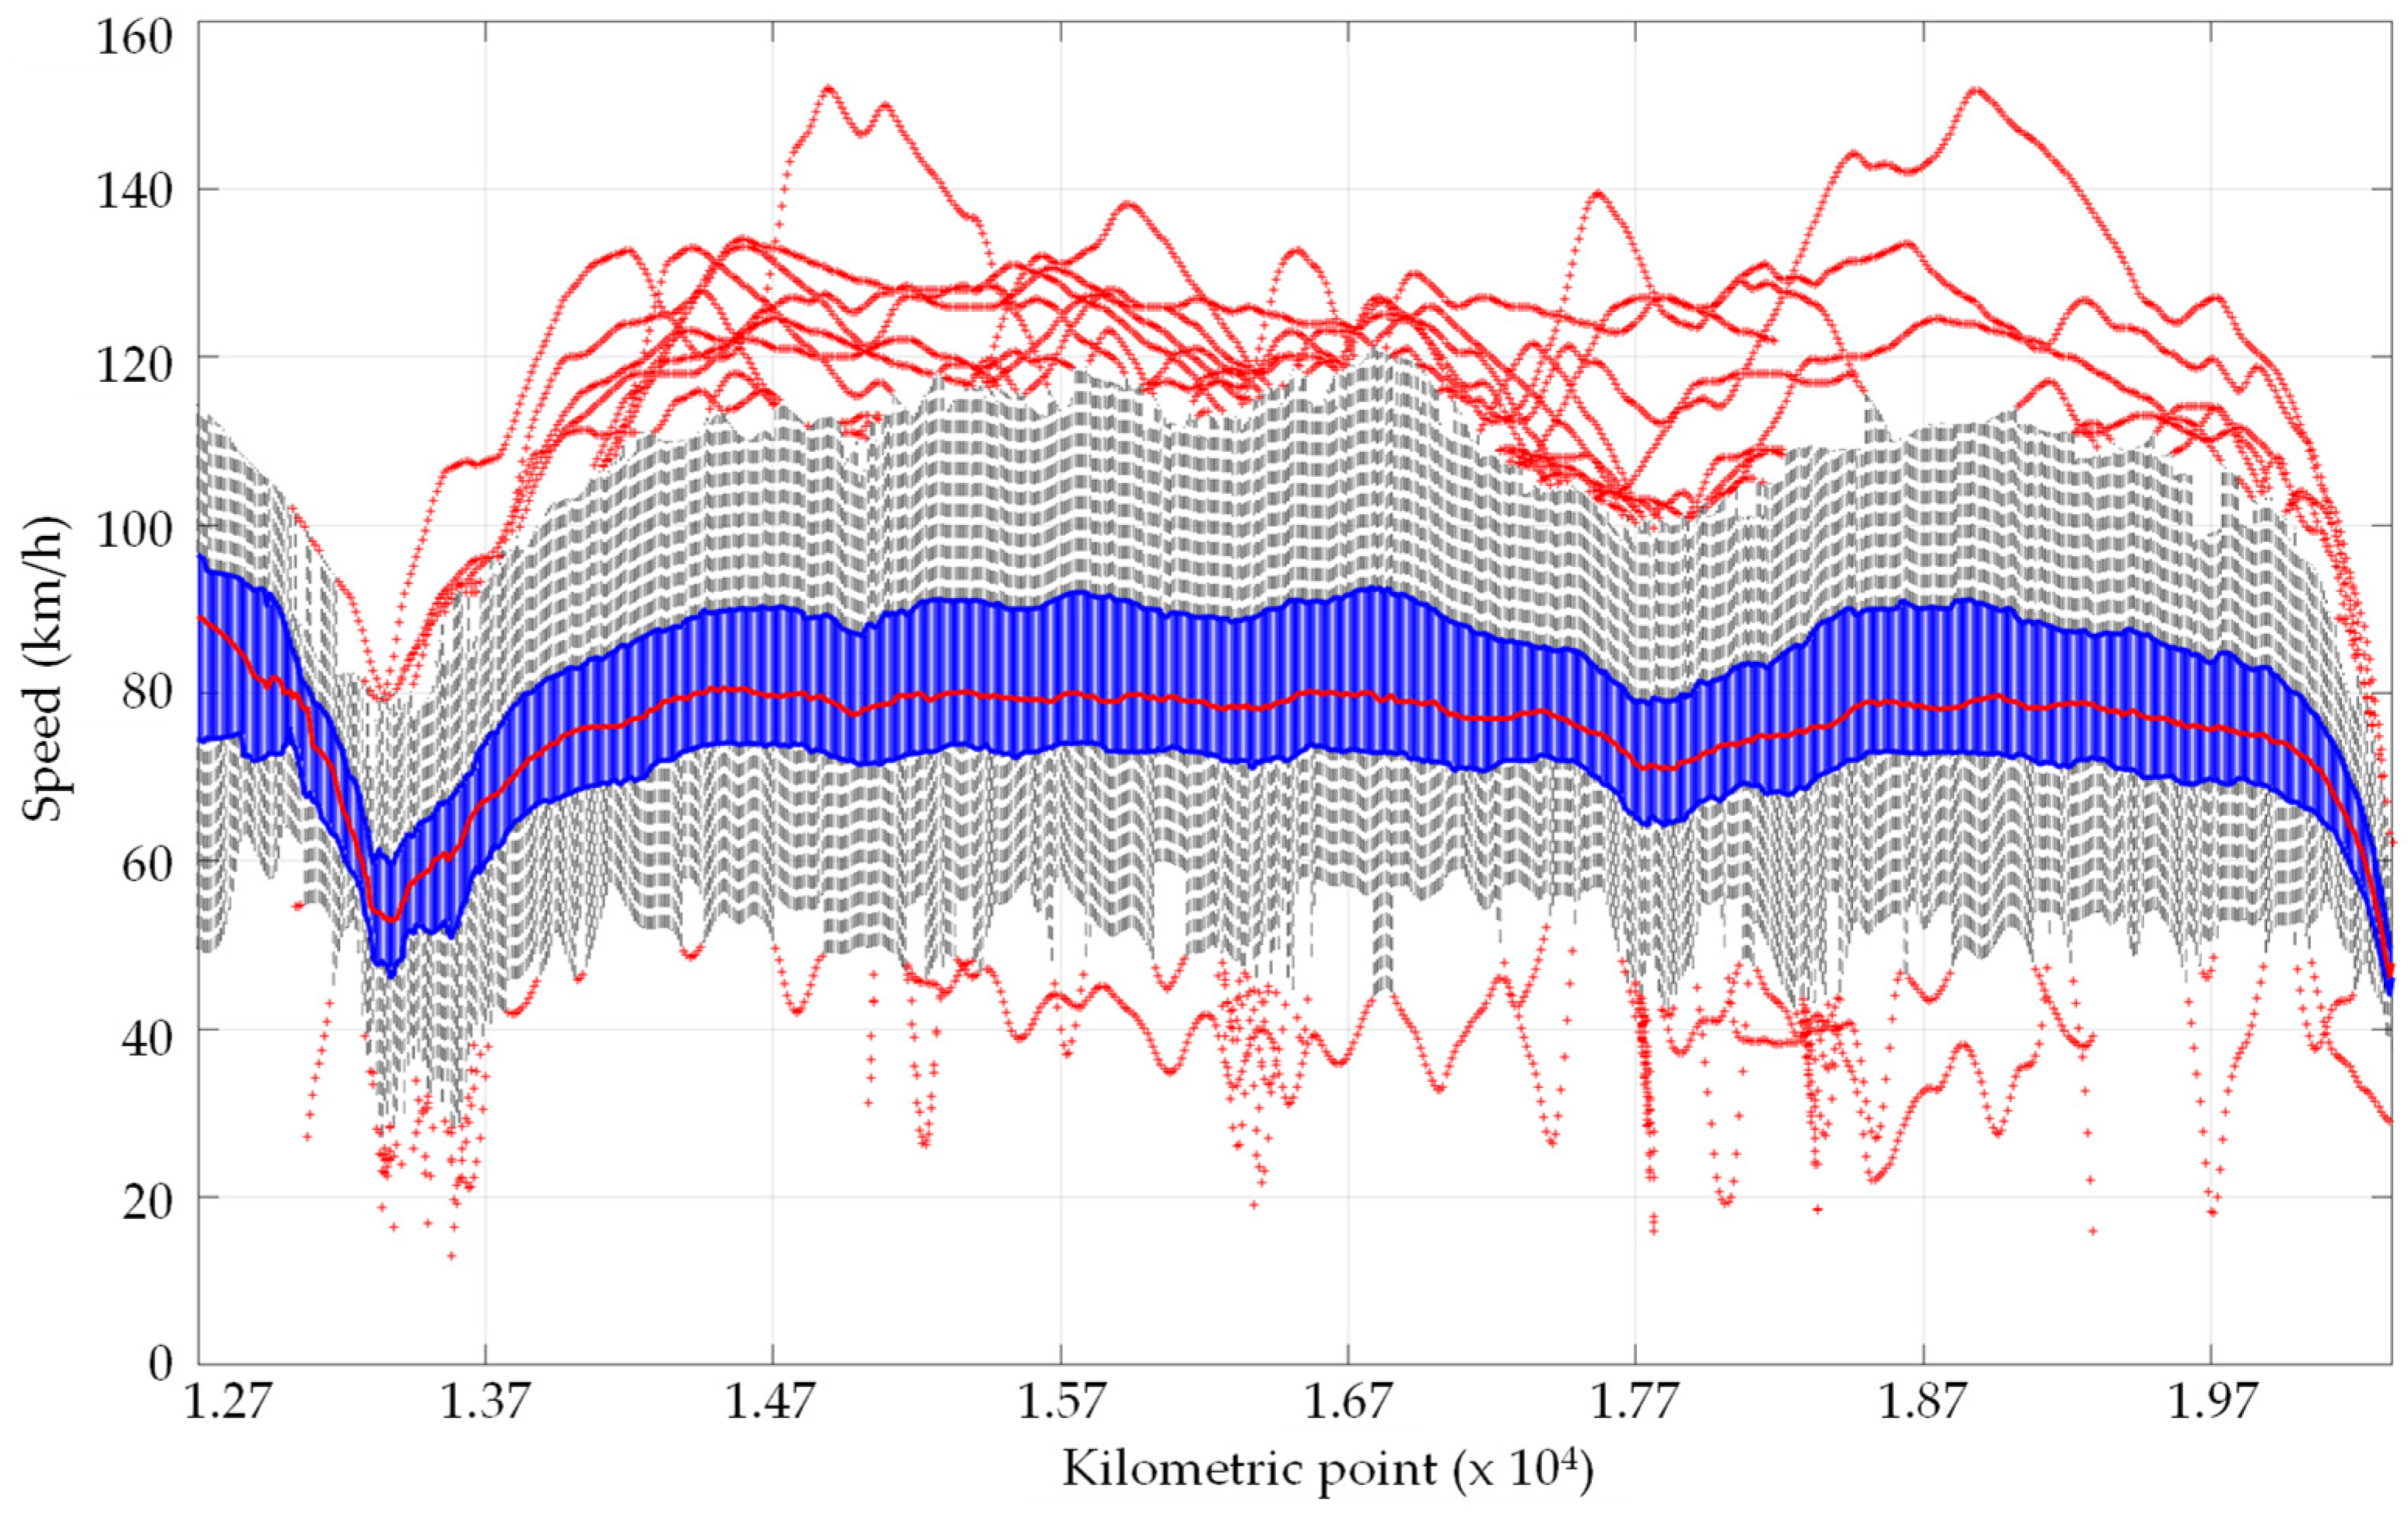
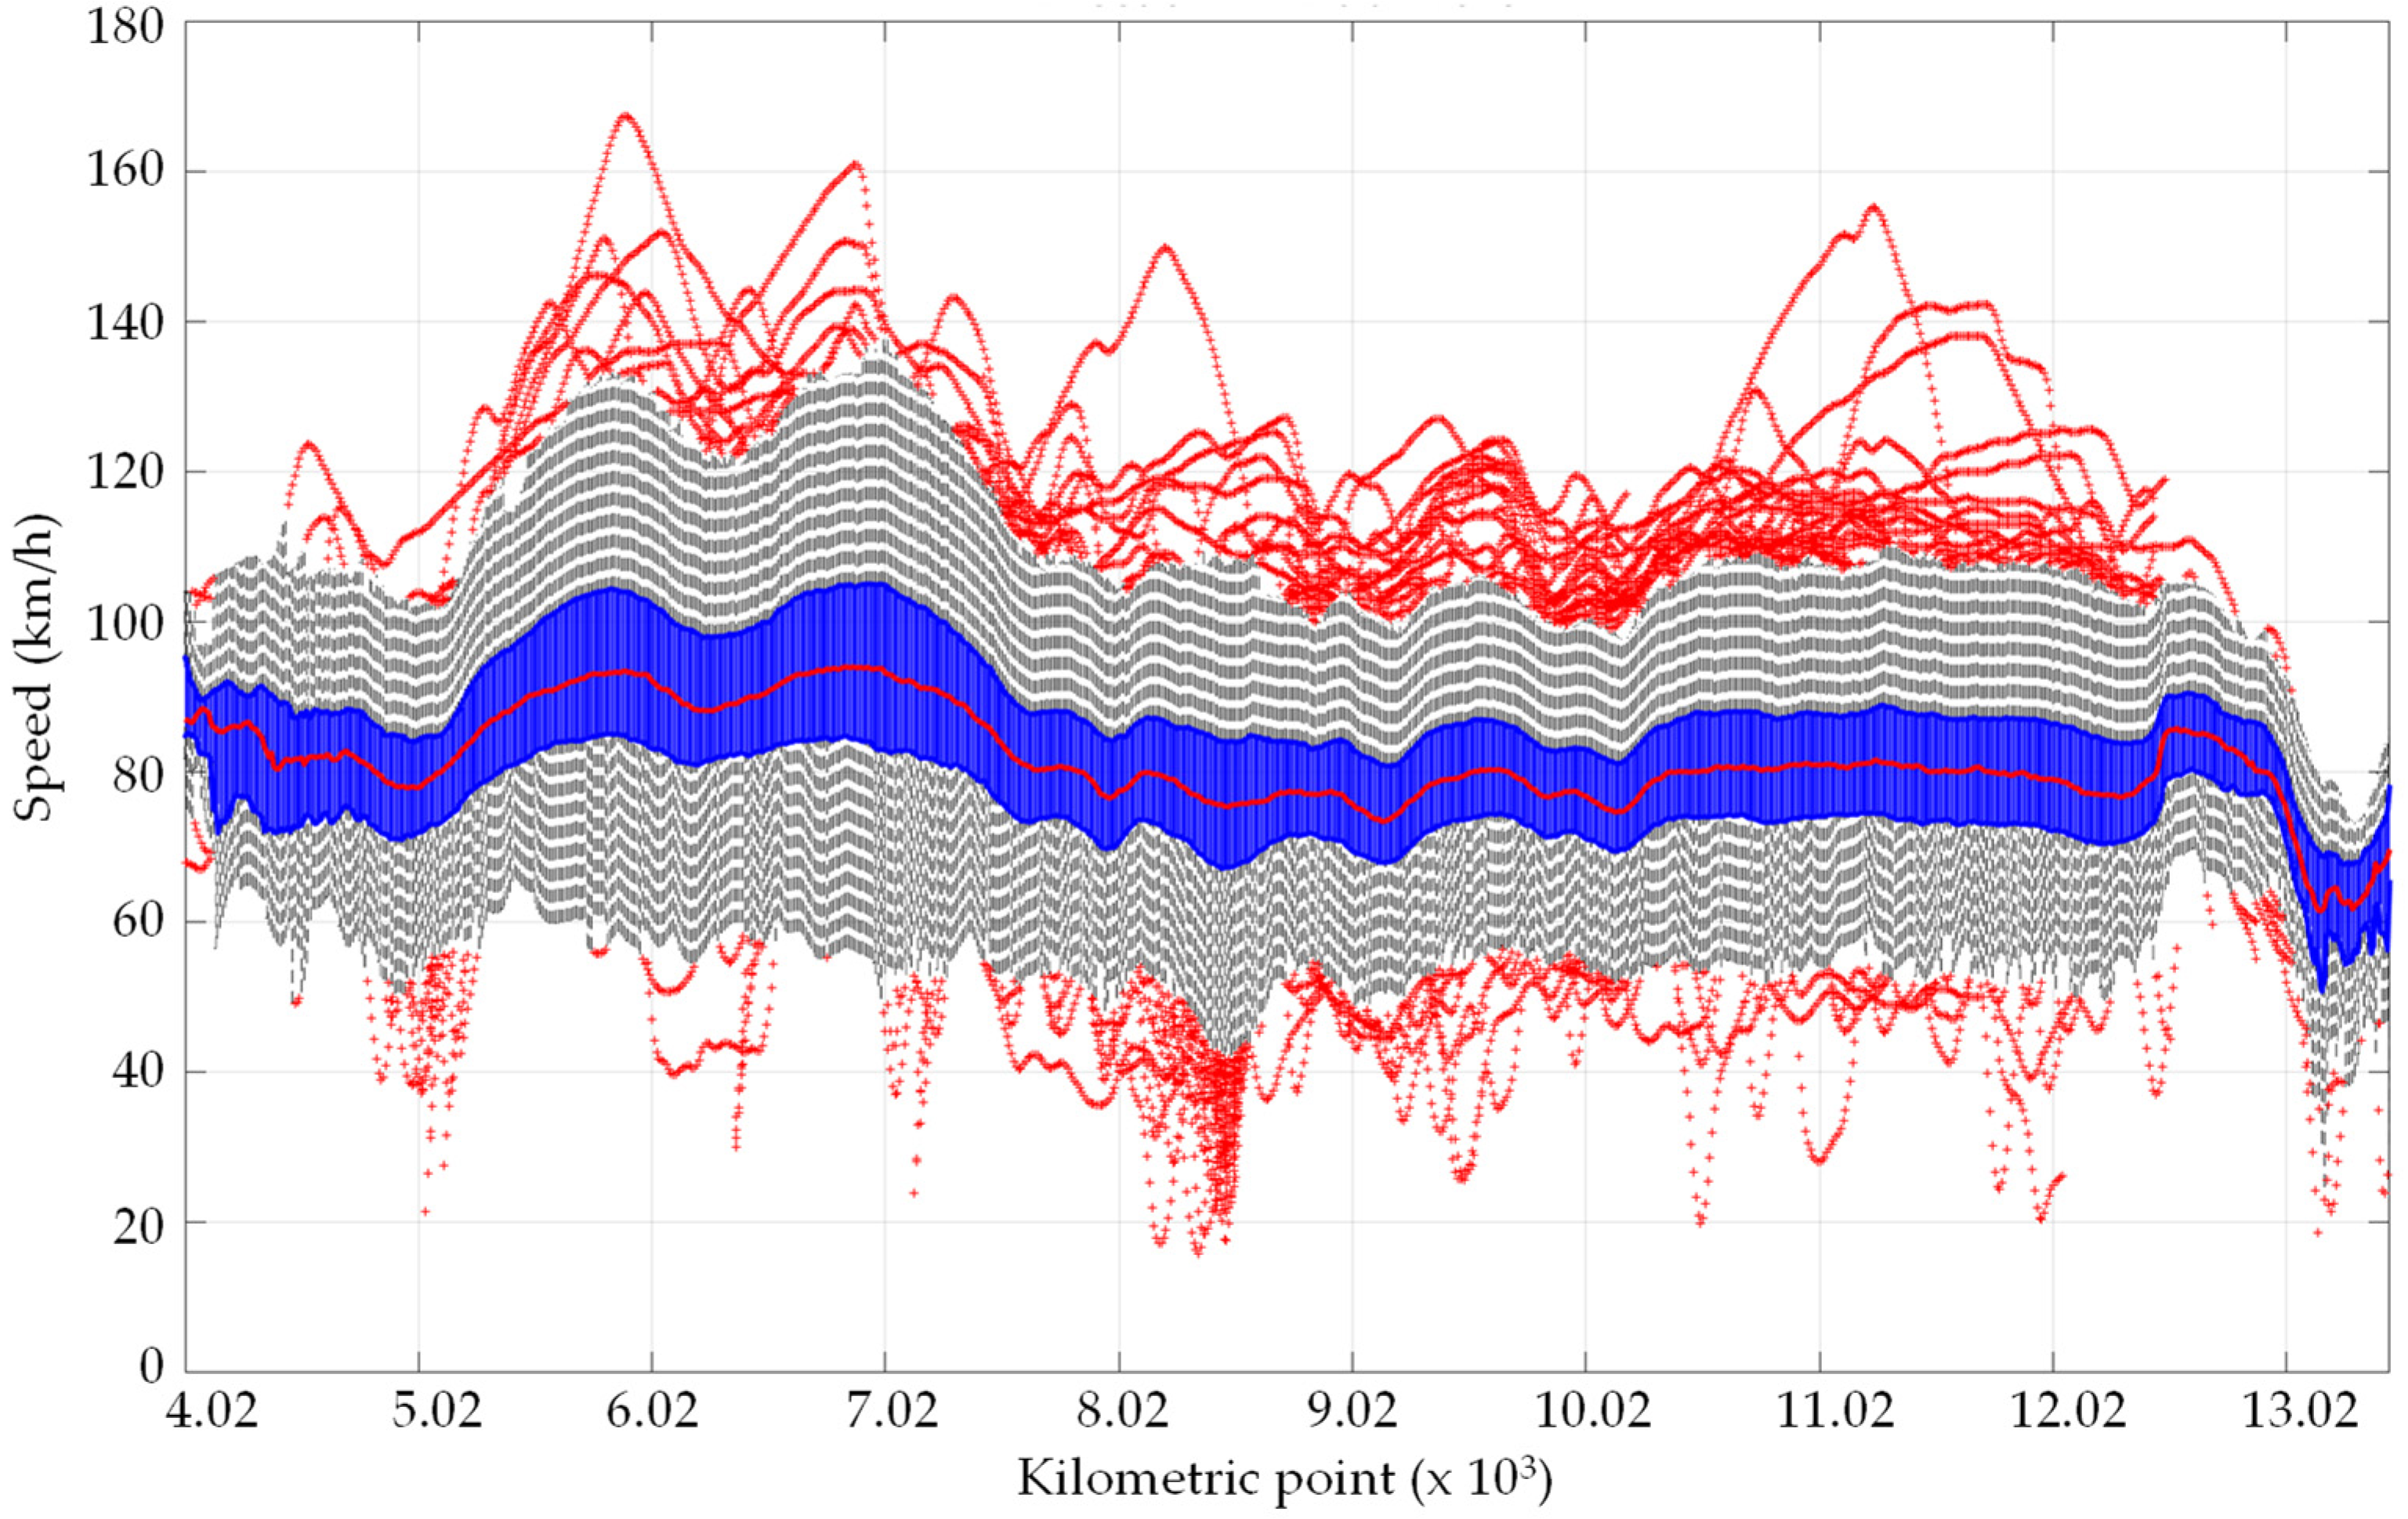
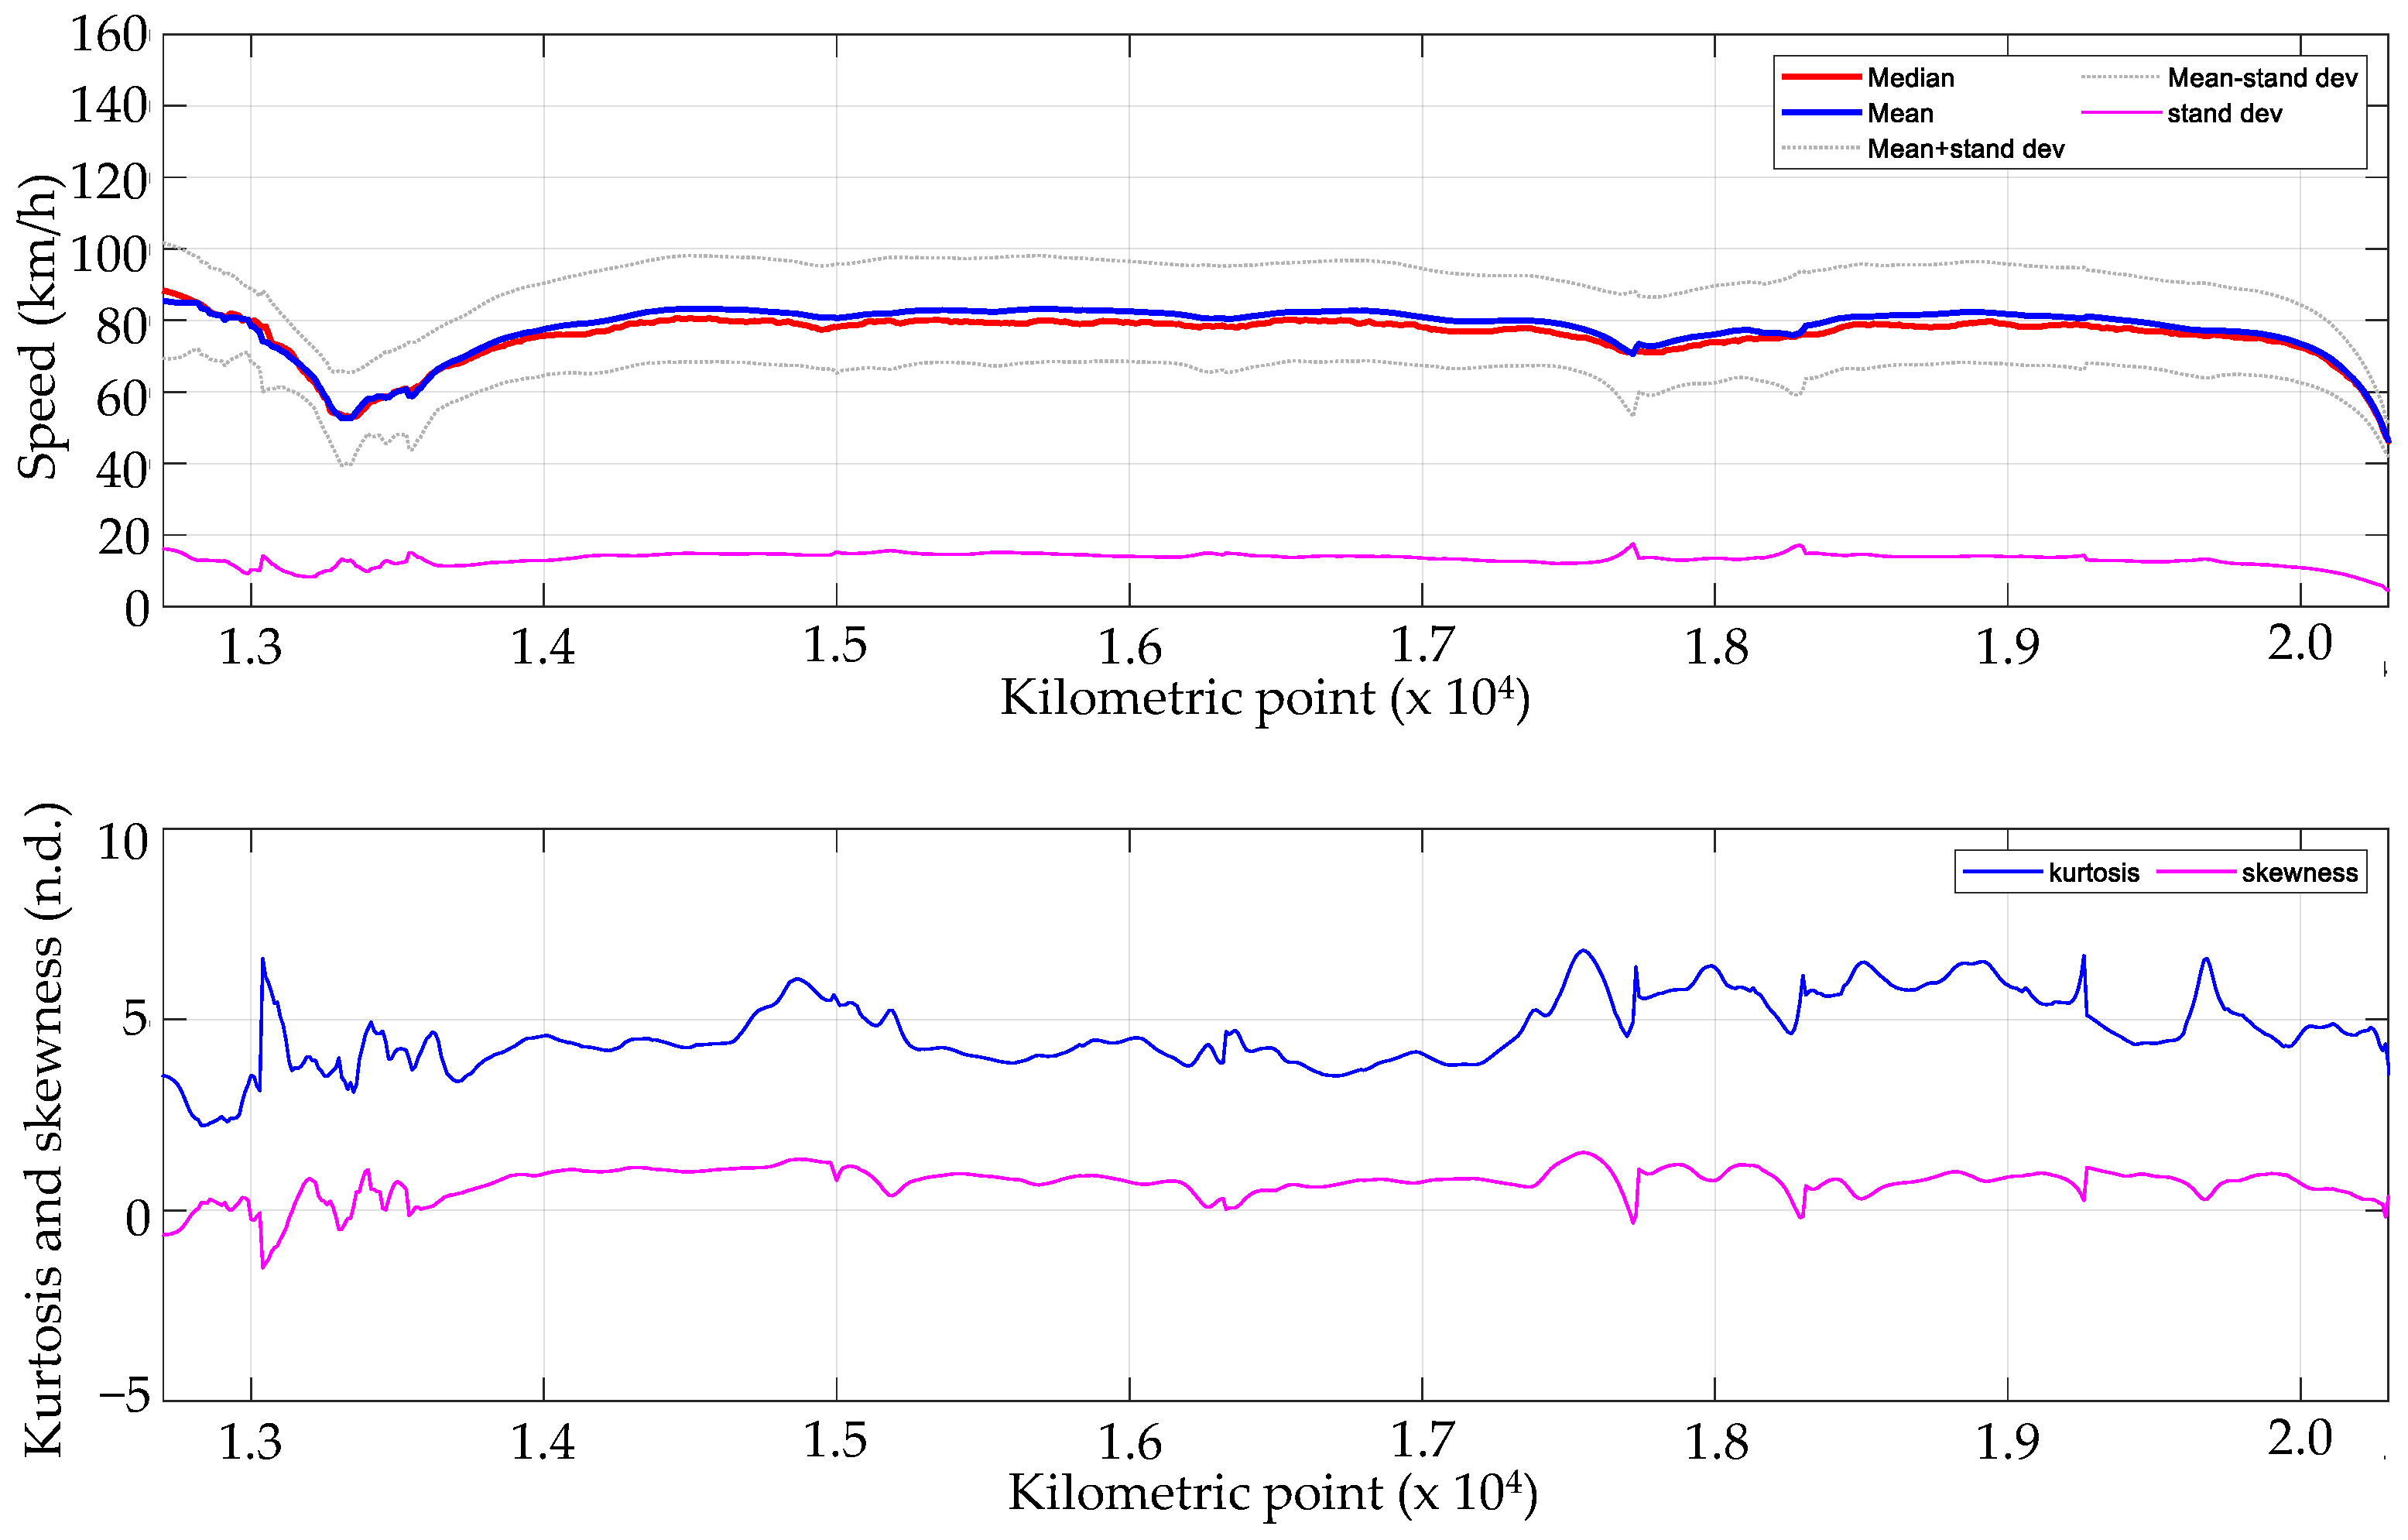
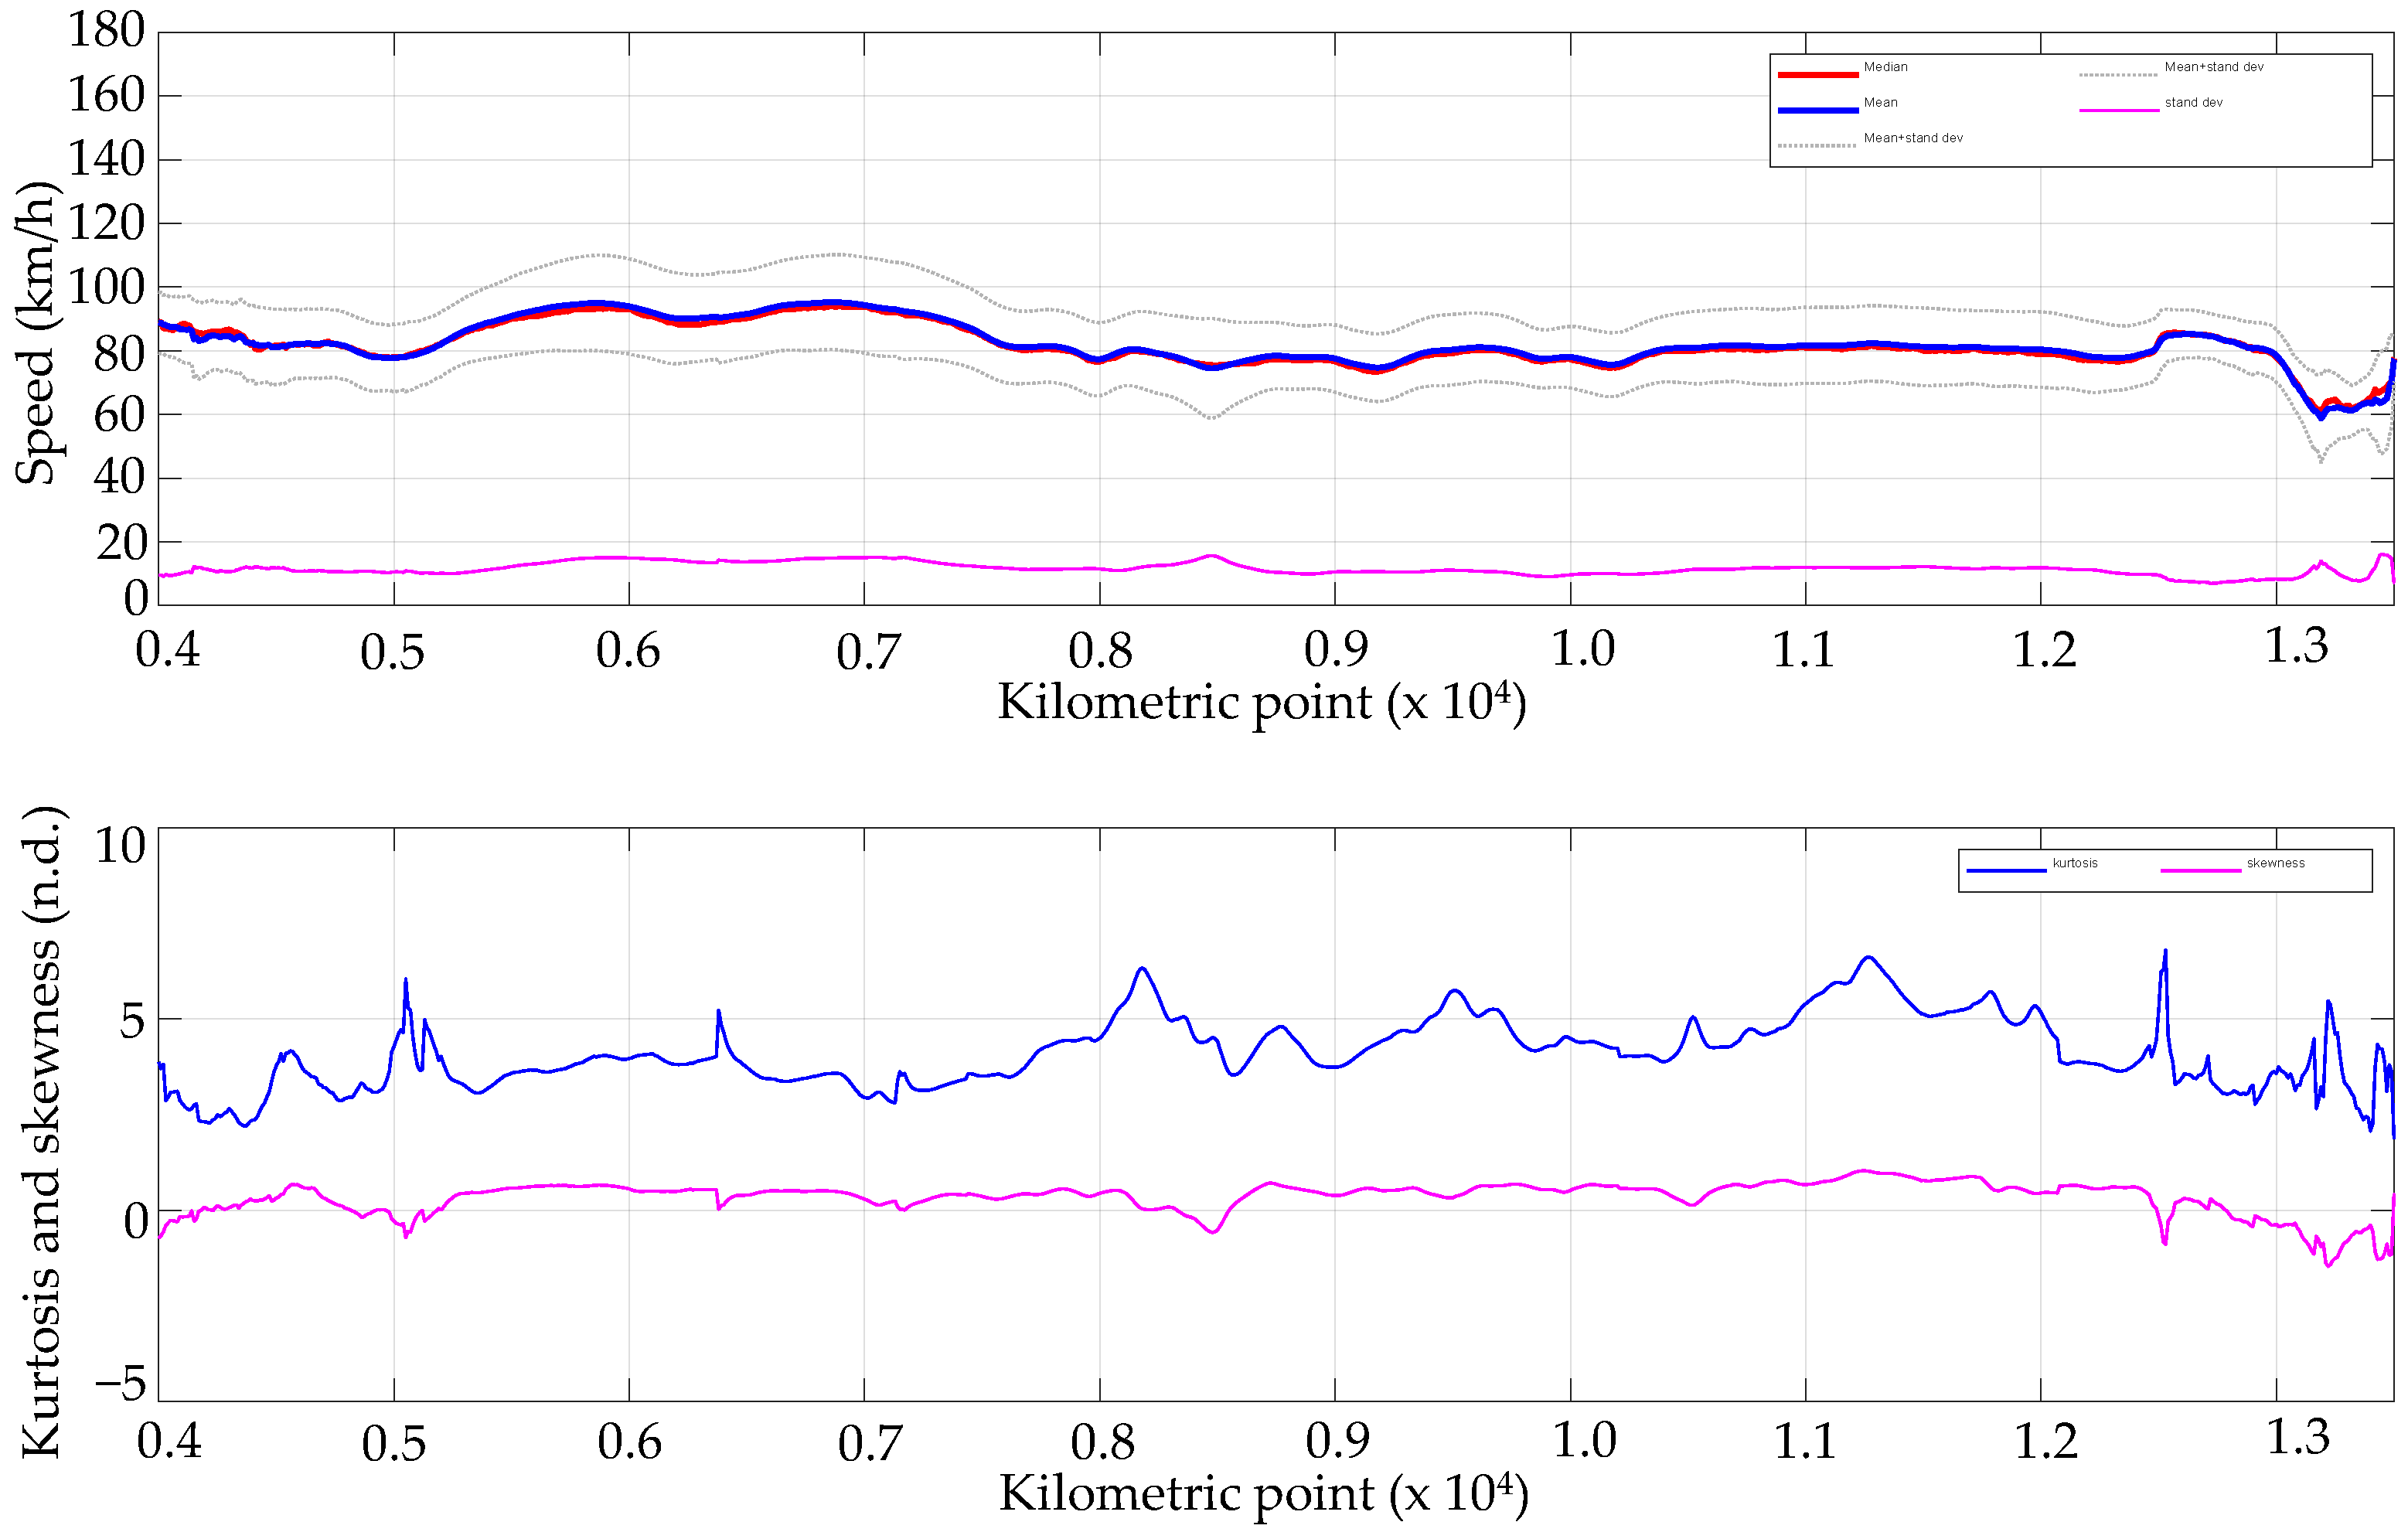
- Box Length: Longer boxes indicate a wider range of speed values, so a variation in the box length suggests a variation in the range of speeds between sections;
- Whisker Length: Longer whiskers show that there are more extreme speed values, so a variation in the whisker length between sections indicates a variation in the extreme speed values between them;
- Position of the Median Line: A median line not centered within the box implies skewness in the data, indicating that the speed distribution is not symmetrical. Therefore, a variation in the position of the median line relative to the box between sections indicates a variation in the symmetry of the distribution among the sections;
- Presence of Outliers: A higher number of outliers suggests more variability and potential anomalies in the speed distribution, so a variation in the outliers, in terms of number and position, indicates a variation in the values identified as anomalies among the different sections.
Future Developments of the Research
6. Conclusions
Author Contributions
Funding
Institutional Review Board Statement
Informed Consent Statement
Data Availability Statement
Conflicts of Interest
References
- Apostoleris, K.A.; Sarma, S.N.; Antonios, T.E.; Basil, P. Traffic speed variability as an indicator of the provided road safety level in two-lane rural highways. Transp. Res. Procedia 2023, 69, 241–248. [Google Scholar] [CrossRef] [Scilit]
- Del Serrone, G.; Cantisani, G.; Peluso, P. Speed data collection methods: A review. Transp. Res. Procedia 2023, 69, 512–519. [Google Scholar] [CrossRef] [Scilit]
- Treiber, M.; Helbing, D. Reconstructing the spatio-temporal traffic dynamics from stationary detector data. Coop. Transp. Dyn. 2002, 1, 3–24. [Google Scholar]
- Herty, M.; Tosin, A.; Visconti, G.; Zanella, M. Reconstruction of traffic speed distributions from kinetic models with uncertainties. In Mathematical Descriptions of Traffic Flow: Micro, Macro and Kinetic Models; Tosin, A., Puppo, G., Eds.; Springer: Berlin/Heidelberg, Germany, 2019. [Google Scholar] [CrossRef] [Scilit]
- Li, J.; Perrine, K.; Wu, L.; Walton, C.M. Cross-validating traffic speed measurements from probe and stationary sensors through state reconstruction. Int. J. Transp. Sci. Technol. 2019, 8, 290–303. [Google Scholar] [CrossRef] [Scilit]
- Cantisani, G.; Del Serrone, G.; Peluso, P. Reliability of Historical Car Data for Operating Speed Analysis along Road Networks. Sci 2022, 4, 18. [Google Scholar] [CrossRef] [Scilit]
- Altintasi, O.; Tuydes-Yaman, H.; Tuncay, K. Quality of floating car data (FCD) as a surrogate measure for urban arterial speed. Can. J. Civ. Eng. 2019, 46, 1187–1198. [Google Scholar] [CrossRef] [Scilit]
- Budimir, D.; Jelušić, N.; Perić, M. Floating Car Data Technology. Pomorstvo 2019, 33, 22–32. [Google Scholar] [CrossRef] [Scilit]
- Ambros, J.; Gogolín, O.; Kubeček, J.; Andrášik, R.; Bíl, M. Proactive identification of risk road locations using vehicle fleet data: Exploratory study. In Proceedings of the 28th ICTCT Workshop, Ashod, Israel, 29–30 October 2015; pp. 29–30. [Google Scholar]
- Fabrizi, V.; Ragona, R. A pattern matching approach to speed forecasting of traffic networks. Eur. Transp. Res. Rev. 2014, 6, 333–342. [Google Scholar] [CrossRef] [Scilit]
- Zhang, J.B.; Song, G.H.; Yu, L.; Guo, J.F.; Lu, H.Y. Identification and characteristics analysis of bottlenecks on urban expressways based on floating car data. J. Cent. South Univ. 2018, 25, 2014–2024. [Google Scholar] [CrossRef] [Scilit]
- Mehrabani, B.B.; Mirbaha, B. Evaluating the relationship between operating speed and collision frequency of rural multilane highways based on geometric and roadside features. Civ. Eng. J. 2018, 4, 609. [Google Scholar] [CrossRef] [Scilit]
- Gheorghiu, R.A.; Iordache, V.; Stan, V.A. Urban traffic detectors—Comparison between inductive loop and magnetic sensors. In Proceedings of the International Conference on Electronics, Computers and Artificial Intelligence (ECAI), Pitesti, Romania, 29–30 June 2021. [Google Scholar] [CrossRef] [Scilit]
- Agresti, A.; Franklin, C.; Klingenberg, B. Statistics: The Art and Science of Learning from Data, Global Edition, 4th ed.; Pearson Education: London, UK, 2023; ISBN 9781292442464. [Google Scholar]
- Nahm, F.S. Nonparametric statistical tests for the continuous data: The basic concept and the practical use. Korean J. Anesthesiol. 2016, 69, 8–14. [Google Scholar] [CrossRef] [Scilit]
- Provost, F.; Fawcett, T. Data Science for Business: What You Need to Know about Data Mining and Data-Analytic Thinking; O’Reilly Media: Sebastopol, CA, USA, 2013; ISBN 978-1-449-36132-7. [Google Scholar]
- Hastie, T.; Tibshirani, R.; Friedman, J. The Elements of Statistical Learning: Data Mining, Inference, and Prediction, 2nd ed.; Springer: New York, NY, USA, 2008. [Google Scholar]
- Murphy, K.P. Introduction. In Machine Learning a Probabilistic Perspective, 1st ed.; MIT Press: London, UK, 2012; pp. 1–2. [Google Scholar]
- Mathisen, B.M.; Aamodt, A.; Bach, K.; Langseth, H. Learning similarity measures from data. Prog. Artif. Intell. 2020, 9, 129–143. [Google Scholar] [CrossRef] [Scilit]
- Sammut, C.; Webb, G.I. Encyclopedia of Machine Learning and Data Mining; Springer Publishing Company, Incorporated: Berlin/Heidelberg, Germany, 2017. [Google Scholar]
- Bishop, C.M. Pattern Recognition and Machine Learning (Information Science and Statistics); Springer: Berlin/Heidelberg, Germany, 2006. [Google Scholar]
- Aggarwal, C.C.; Reddy, C.K. Data Clustering Algorithms and Applications, 1st ed.; CRC Press: Boca Raton, FL, USA, 2013; pp. 65–210. [Google Scholar]
- Balzanella, A.; Irpino, A. Spatial prediction and spatial dependence monitoring on georeferenced data streams. Stat. Methods Appl. 2020, 29, 101–128. [Google Scholar] [CrossRef] [Scilit]
- Sulewski, P. Equal-bin-width histogram versus equal-bin-count histogram. J. Appl. Stat. 2021, 48, 2092–2111. [Google Scholar] [CrossRef] [Scilit]
- Qian, X.; Cabanes, G.; Rastin, P.; Guidani, M.A.; Marrakchi, G.; Clausel, M.; Grozavu, N. An Innovative Framework for Static and Dynamic Clustering Using Histogram Models and Wasserstein Distance Over Sliding Windows. SSRN 2023. Available online: https://ssrn.com/abstract=4573414 (accessed on 1 July 2024).
- Billard, L.; Diday, E. From the statistics of data to the statistics of knowledge: Symbolic data analysis. J. Am. Stat. Assoc. 2003, 98, 470–487. [Google Scholar] [CrossRef] [Scilit]
- Silverman, B.W. Density Estimation for Statistics and Data Analysis; Monographs on Statistics and Applied Probability; Chapman and Hall: London, UK, 1986; Includes Bibliographical References; pp. 59–165. [Google Scholar] [CrossRef] [Scilit]
- Dekking, F.; Kraaikamp, C.; Lopuhaä, H. A Modern Introduction to Probability and Statistics: Understanding Why and How; Springer: London, UK, 2005. [Google Scholar]
- Pearson, K. Contributions to the mathematical theory of evolution. Philos. Trans. R. Soc. Lond. A 1894, 185, 71–110. [Google Scholar] [CrossRef] [Scilit]
- Scott, D.W. On Optimal and Data-Based Histograms. Biometrika 1979, 66, 605–610. [Google Scholar] [CrossRef]
- Freedman, D.; Diaconis, P. On the histogram as a density estimator: L2 theory. Z. FüR Wahrscheinlichkeitstheorie Und Verwandte Geb. 1981, 57, 453–476. [Google Scholar] [CrossRef] [Scilit]
- Mosteller, F.; Tukey, J. Data Analysis and Regression: A Second Course in Statistics, 1st ed.; Pearson: Reading, MA, USA, 1977; ISBN 978-0-201-04854-4. [Google Scholar]
- Arroyo, J.; Maté, C. Forecasting histogram time series with k-nearest neighbours methods. Int. J. Forecast. 2009, 25, 192–207. [Google Scholar] [CrossRef] [Scilit]
- Billard, L.; Diday, E. Symbolic Data Analysis: Conceptual Statistics and Data Mining; John Wiley & Sons, Ltd.: Hoboken, NJ, USA, 2007. [Google Scholar]
- Strelkov, V.V. A new similarity measure for histogram comparison and its application in time series analysis. Pattern Recognit. Lett. 2008, 29, 1768–1774. [Google Scholar] [CrossRef] [Scilit]
- Shnoll, S.E.; Kolombet, V.A.; Pozharskii, E.V.; Zenchenko, T.A.; Zvereva, I.M.; Konradov, A.A. On discrete states due to macroscopic fluctuations. Uspekhi Fizicheskikh Nauk 1998, 168, 1129–1140. [Google Scholar] [CrossRef] [Scilit]
- Shnoll, S.E.; Pozharski, E.V.; Zenchenko, T.A.; Kolombet, V.A.; Zvereva, I.M.; Konradov, A.A. Fine structure of distributions in measurements of different processes as affected by geophysical and cosmophysical factors. Phys. Chem. Earth Part A Solid Earth Geod. 1999, 24, 711–714. [Google Scholar] [CrossRef] [Scilit]
- Fedorov, M.V.; Belousov, L.V.; Voeikov, V.L.; Zenchenko, T.A.; Zenchenko, K.I.; Pozharskii, E.V.; Konradov, A.A.; Shnoll, S.E. Synchronous changes in dark current fluctuations in two separate photomultipliers in relation to Earth rotation. Astrophys. Space Sci. 2003, 283, 3–10. [Google Scholar] [CrossRef] [Scilit]
- Magyar, J.C.; Sambridge, M. Hydrological objective functions and ensemble averaging with the Wasserstein distance. Hydrol. Earth Syst. Sci. 2023, 27, 991–1010. [Google Scholar] [CrossRef] [Scilit]
- Lee, T.; Xiao, Y.; Meng, X.; Duling, D. Clustering Time Series Based on Forecast Distributions Using Kullback-Leibler Divergence. International Institute of Forecasters (IIF). 2014. Available online: https://forecasters.org/wp-content/uploads/gravity_forms/7-2a51b93047891f1ec3608bdbd77ca58d/2013/06/ISF2013_LEE_TSClustering.pdf (accessed on 1 July 2024).
- Ma, Y.; Gu, X.; Wang, Y. Histogram similarity measure using variable bin size distance. Comput. Vis. Image Underst. 2010, 114, 981–989. [Google Scholar] [CrossRef] [Scilit]
- Rubner, Y.; Tomasi, C.; Guibas, L.J. The Earth Mover’s Distance as a metric for image retrieval. Int. J. Comput. Vis. 2000, 40, 99–121. [Google Scholar] [CrossRef] [Scilit]
- Bazan, E.; Dokládal, P.; Dokladalova, E. Quantitative analysis of similarity measures of distributions. In Proceedings of the British Machine Vision Conference, Cardiff, UK, 9–12 September 2019; p. 187. [Google Scholar]
- Bellemare, M.G.; Danihelka, I.; Dabney, W.; Mohamed, S.; Lakshminarayanan, B.; Hoyer, S.; Munos, R. The Cramer distance as a solution to biased Wasserstein gradients. arXiv. 2017. Available online: https://arxiv.org/abs/1705.10743 (accessed on 1 July 2024).
- Khamsi, M.A. Generalized metric spaces: A survey. J. Fixed Point Theory Appl. 2015, 17, 455–475. [Google Scholar] [CrossRef] [Scilit]
- Kantorovich, L.V. On the translocation of masses. Dokl. Akad. Nauk 1942, 37, 227–229. [Google Scholar] [CrossRef] [Scilit]
- Dobrushin, R.L. Prescribing a System of Random Variables by Conditional Distributions. Theory Probab. Its Appl. 1970, 15, 458–486. [Google Scholar] [CrossRef] [Scilit]
- Vaseršteĭn, L.N. Markov processes over denumerable products of spaces, describing large systems of automata. Probl. Peredači Inf. 1969, 5, 64–72. [Google Scholar]
- Monge, G. Mémoire sur la théorie des déblais et des remblais. In Histoire de l’Académie Royale des Sciences de Paris; De l’Imprimerie Royale: Paris, France, 1781. [Google Scholar]
- Panaretos, V.M.; Zemel, Y. Statistical aspects of Wasserstein distances. Annu. Rev. Stat. Appl. 2019, 6, 405–431. [Google Scholar] [CrossRef] [Scilit]
- Dall’Aglio, G. Sugli estremi dei momenti delle funzioni di ripartizione doppia. Ann. Della Sc. Norm. Super. Pisa Cl. Sci. 1956, 10, 35–74. [Google Scholar]
- Ramdas, A.; Trillos, N.G.; Cuturi, M. On Wasserstein two-sample testing and related families of nonparametric tests. Entropy 2017, 19, 47. [Google Scholar] [CrossRef] [Scilit]
- Levina, E.; Bickel, P.J. The earth mover’s distance is the Mallows distance: Some insights from statistics. In Proceedings of the Eighth IEEE International Conference on Computer Vision, ICCV 2001, Vancouver, BC, Canada, 7–14 July 2001; Volume 2, pp. 251–256. [Google Scholar]
- Santambrogio, F. Optimal transport for applied mathematicians. Birkäuser 2015, 55, 94. [Google Scholar] [CrossRef] [Scilit]
- Andrieu, C.; Saint Pierre, G.; Bressaud, X. Estimation of Space-Speed Profiles: A Functional Approach Using Smoothing Splines. In Proceedings of the 2013 IEEE Intelligent Vehicles Symposium (IV), Gold Coast, Australia, 23–26 June 2013; pp. 982–987. [Google Scholar]
- Cantisani, G.; Del Serrone, G. Procedure for the identification of existing roads alignment from georeferenced points database. Infrastructures 2021, 6, 2. [Google Scholar] [CrossRef] [Scilit]
- Del Serrone, G.; Cantisani, G.; Peluso, P.; Coppa, I.; Mancinetti, M.; Bianchini, B. Road infrastructure safety management: Proactive safety tools to evaluate potential conditions of risk. Transp. Res. Procedia 2023, 69, 711–718. [Google Scholar] [CrossRef] [Scilit]
- Irpino, A.; Romano, E. Optimal histogram representation of large data sets: Fisher vs piecewise linear approximations. Rev. Des Nouv. Technol. De L’information 2007, 1, 99–110. [Google Scholar]
- Košmelj, K.; Billard, L. Mallows’ L2 distance in some multivariate methods and its application to histogram-type data. J. Adv. Stat. 2012, 9, 107–118. [Google Scholar] [CrossRef] [Scilit]

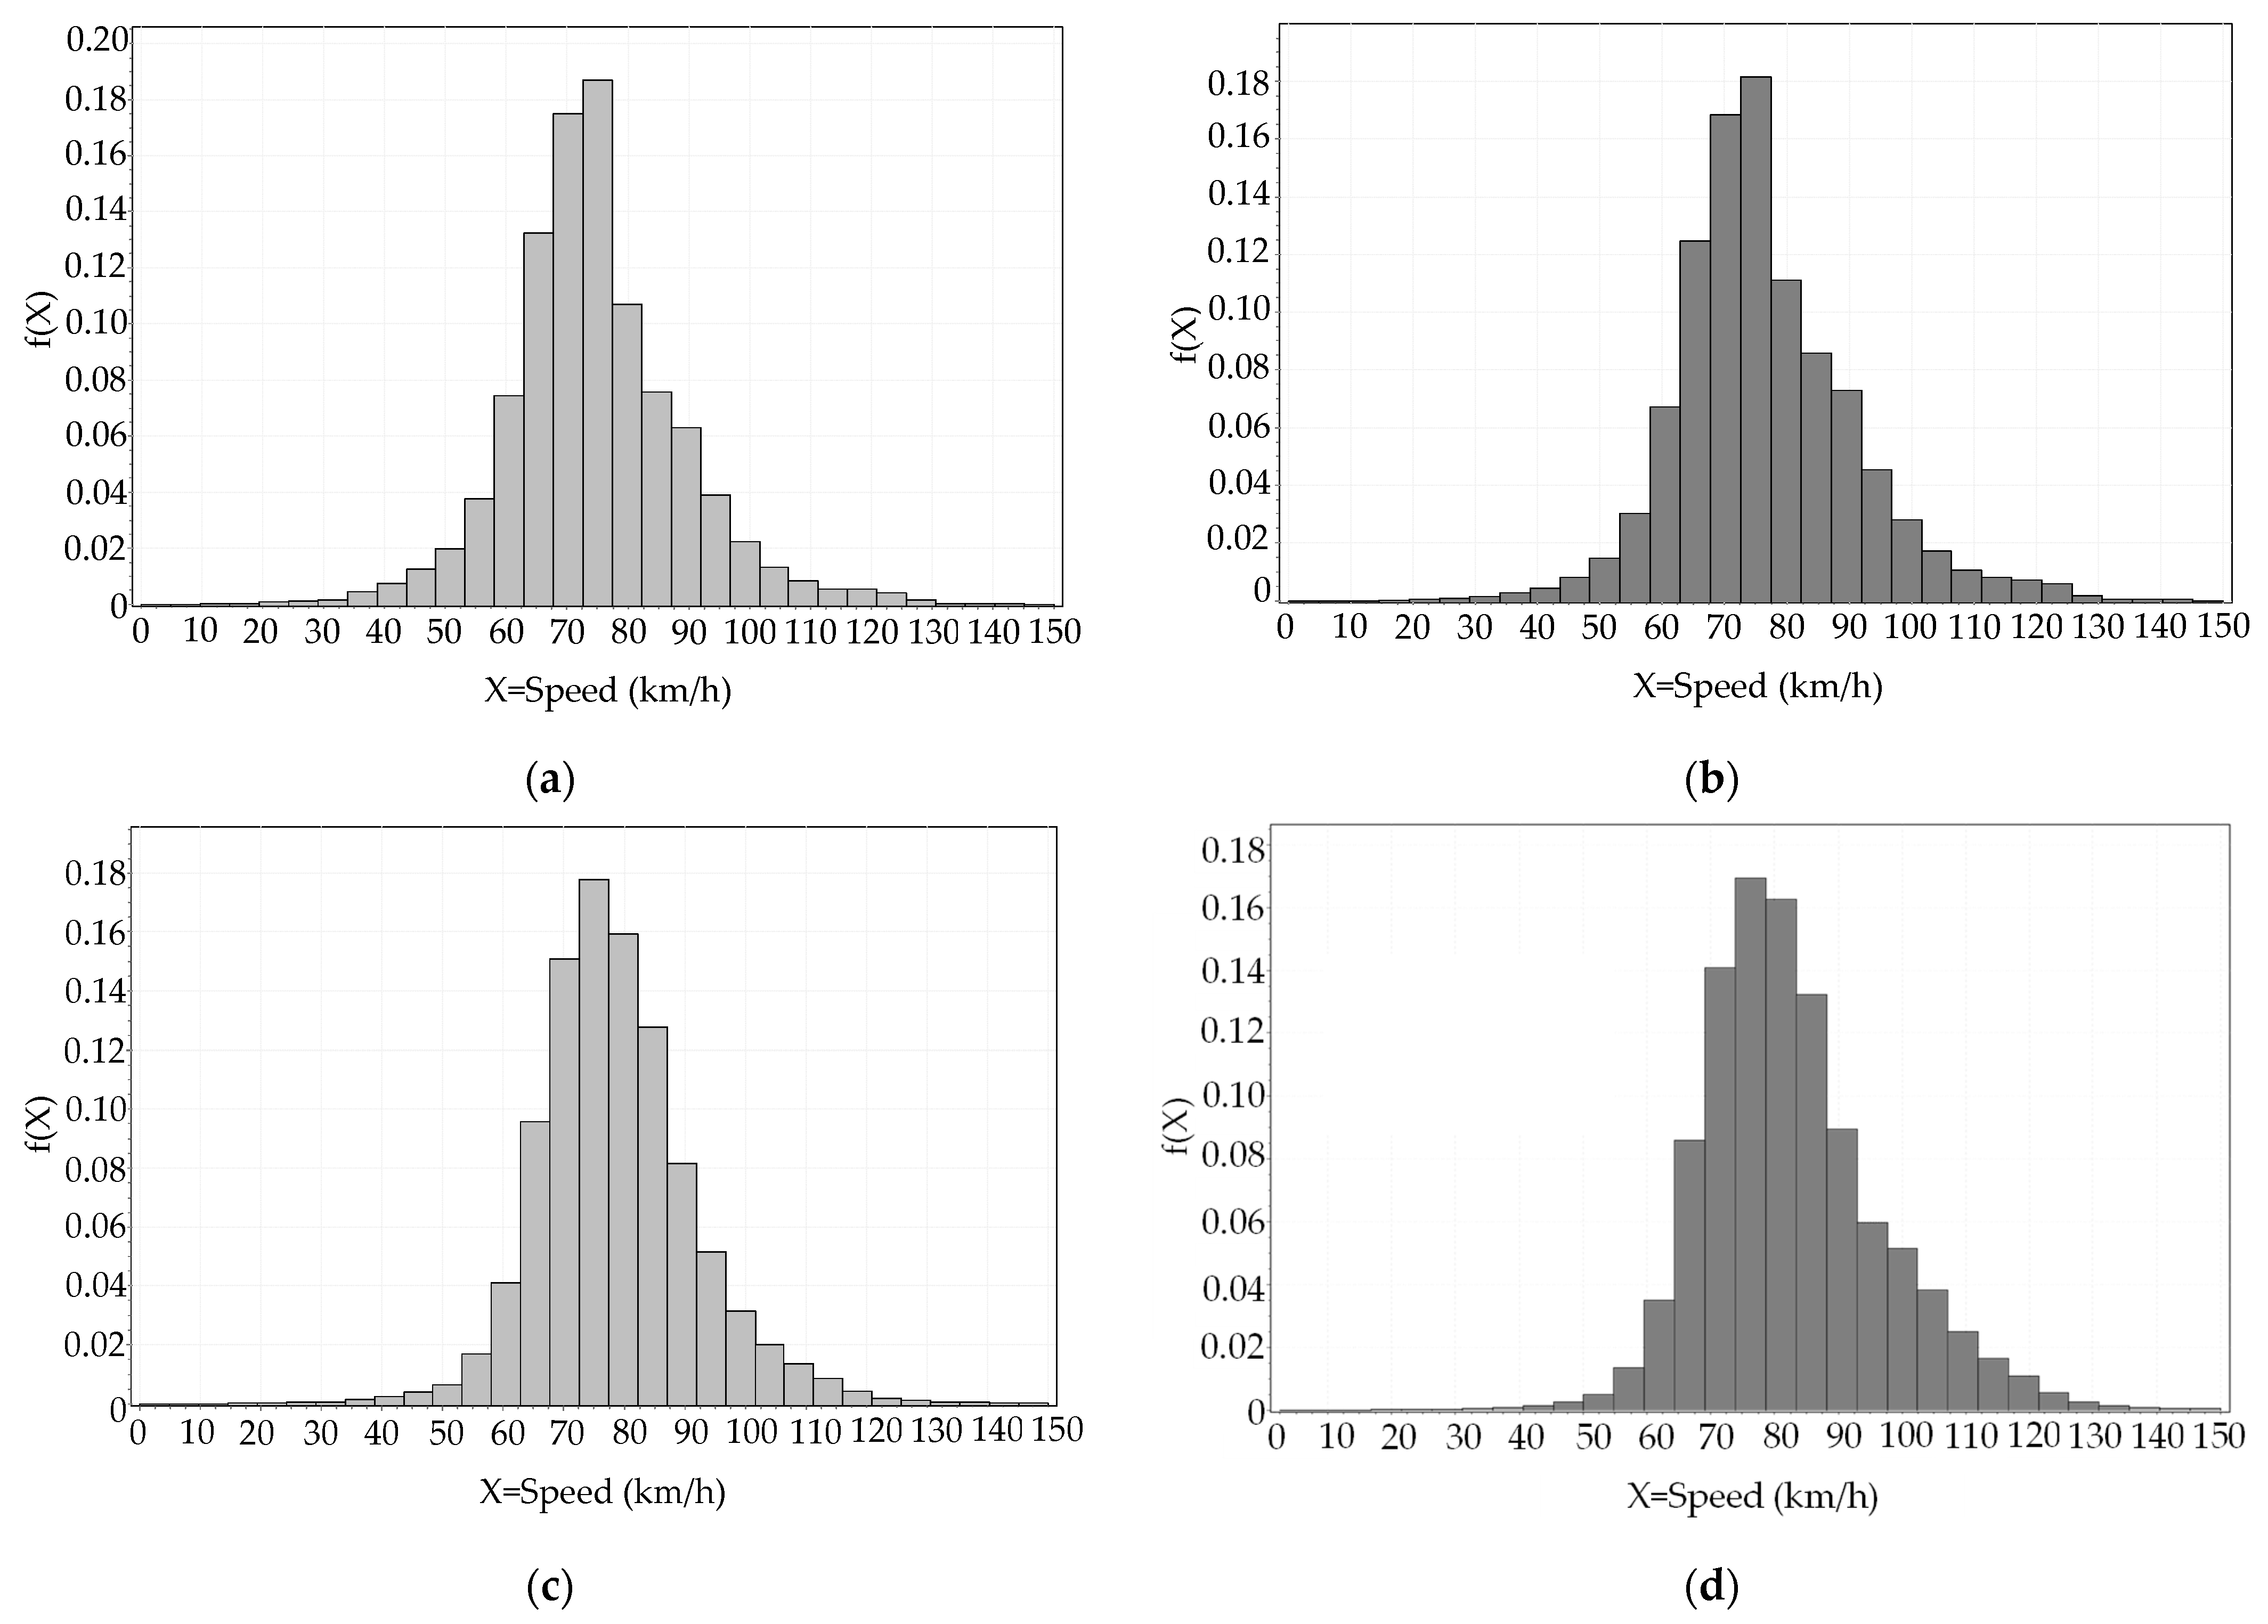
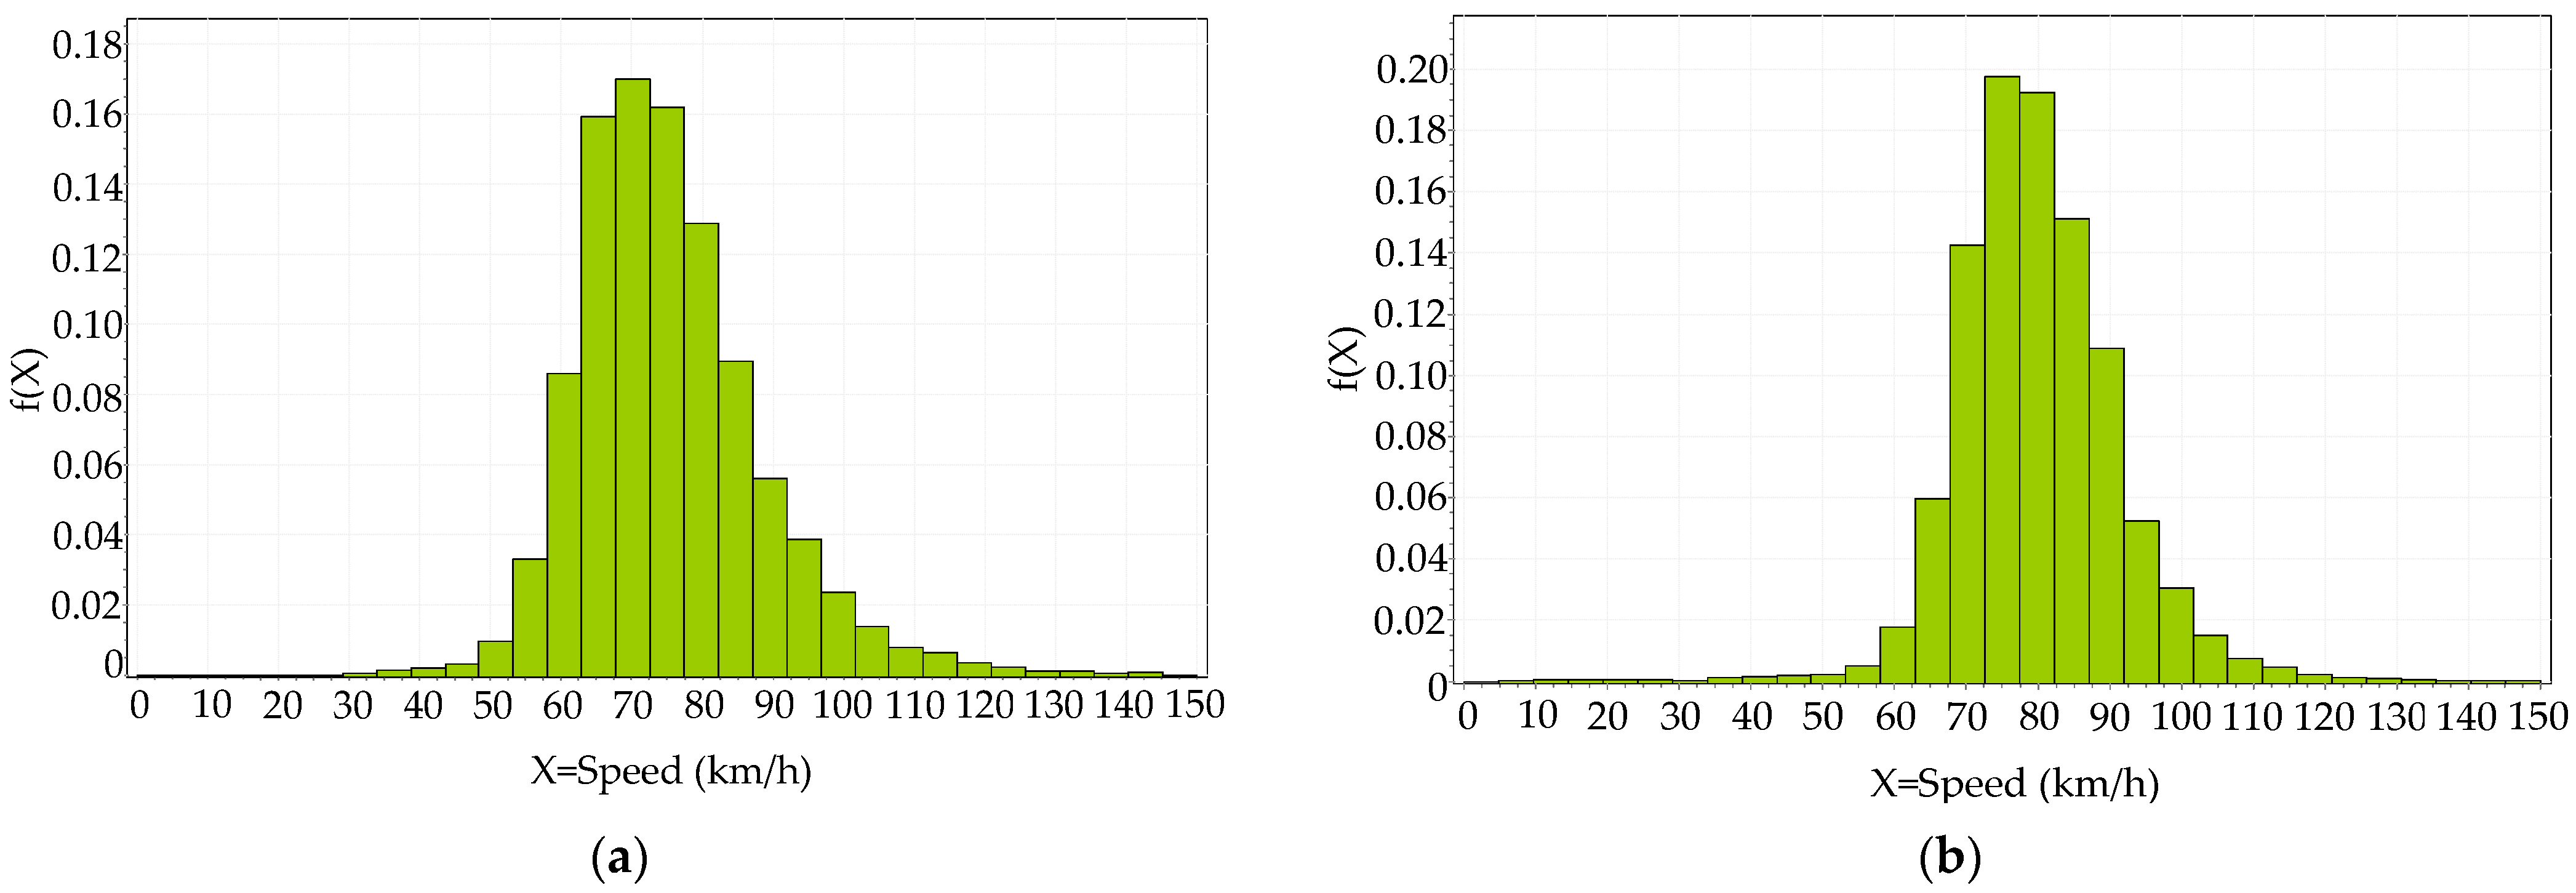

| Segment | 218 | 3191 | ||
|---|---|---|---|---|
| Direction | DESC | ASC | ||
| Sample | FCD | VSs | FCD | VSs |
| Sample Size (n.d.) | 58,941 | 138,878 | 187,968 | 468,665 |
| Mean (km/h) | 76.487 | 78.924 | 80.813 | 82.781 |
| Variance (km/h)2 | 210.92 | 217.46 | 174.74 | 180.57 |
| Std. Deviation (km/h) | 14.523 | 14.747 | 13.219 | 13.438 |
| Coef. of Variation (n.d.) | 0.18988 | 0.18684 | 0.16357 | 0.16233 |
| Std. Error (km/h) | 0.05982 | 0.03957 | 0.03049 | 0.01963 |
| Skewness (n.d.) | 0.43131 | 0.62375 | 0.48972 | 0.61522 |
| Excess Kurtosis (n.d.) | 1.8243 | 1.6188 | 1.6291 | 1.4615 |
| 25% (Q1) (km/h) | 68 | 69.917 | 72 | 73.968 |
| 50% (Median) (km/h) | 75 | 76.994 | 80 | 81.352 |
| 75% (Q3) (km/h) | 84 | 86.814 | 88 | 90.011 |
| Min (km/h) | 10 | 12.962 | 10 | 15.893 |
| Max (km/h) | 153 | 151.93 | 167 | 167.3 |
| Segment | 218 | 3191 |
|---|---|---|
| Direction | DESC | ASC |
| Sample | CU | CU |
| Sample Size (n.d.) | 390,740 | 865,733 |
| Mean (km/h) | 78.209 | 77.008 |
| Variance (km/h)2 | 179.3 | 134.84 |
| Std. Deviation (km/h) | 13.39 | 11.612 |
| Coef. of Variation (n.d.) | 0.1712 | 0.1508 |
| Std. Error (km/h) | 0.0214 | 0.0125 |
| Skewness (n.d.) | 0.8509 | 0.1187 |
| Excess Kurtosis (n.d.) | 2.4549 | 3.8557 |
| 25% (Q1) (km/h) | 69 | 70 |
| 50% (Median) (km/h) | 77 | 76 |
| 75% (Q3) (km/h) | 85 | 83 |
| Min (km/h) | 1 | 0 |
| Max (km/h) | 196 | 185 |
| Segment | 218 | 3191 | ||
|---|---|---|---|---|
| Direction | DESC | ASC | ||
| Histogram | P = P1 | P = P2 | P = P1 | P = P2 |
| 0.005 | 0.008 | 0.011 | 0.008 | |
| Segment | 218 | 3191 | ||||
|---|---|---|---|---|---|---|
| Direction | DESC | ASC | ||||
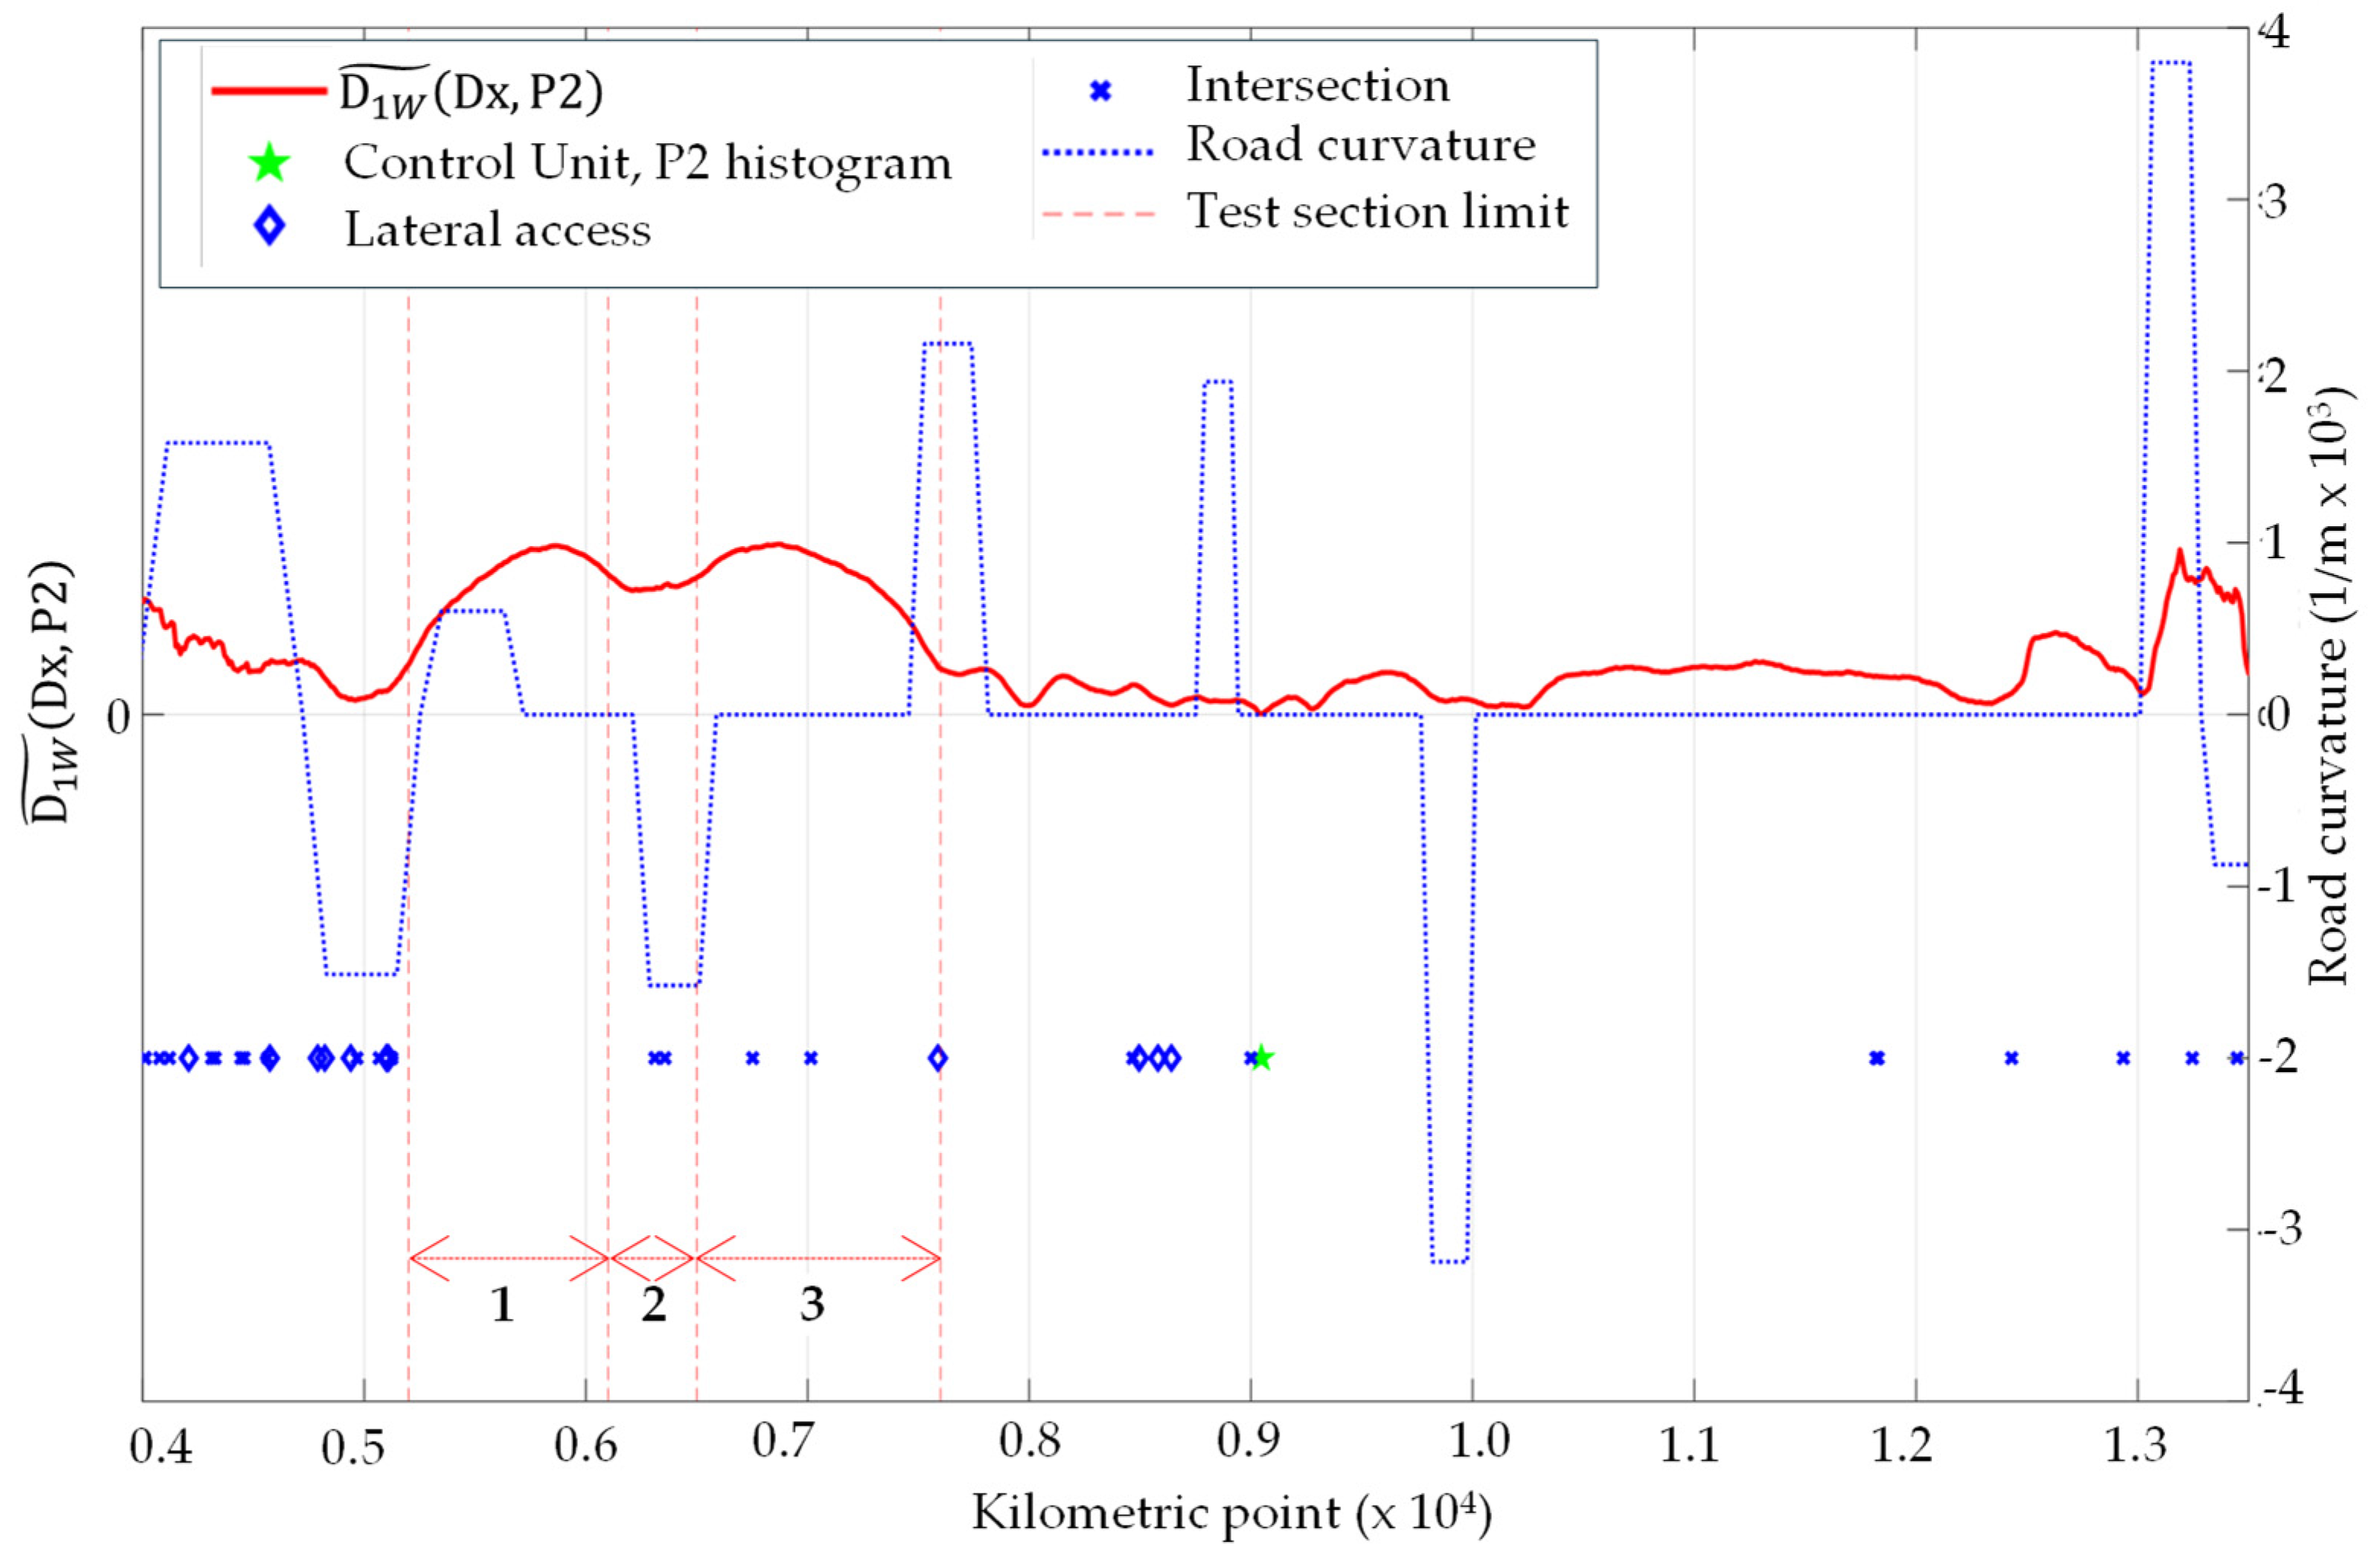
| Histogram Km Points | D = D1 13.20|13.60 | D = D2 17.67|17.74 | D = D3 18.27|18.32 | D = D1 5.20|6.10 | D = D2 6.10|6.500 | D = D3 6.50|7.60 |
| 0.14 | 0.05 | 0.024 | 0.10 | 0.09 | 0.11 | |
Disclaimer/Publisher’s Note: The statements, opinions and data contained in all publications are solely those of the individual author(s) and contributor(s) and not of MDPI and/or the editor(s). MDPI and/or the editor(s) disclaim responsibility for any injury to people or property resulting from any ideas, methods, instructions or products referred to in the content. |
© 2024 by the authors. Licensee MDPI, Basel, Switzerland. This article is an open access article distributed under the terms and conditions of the Creative Commons Attribution (CC BY) license (https://creativecommons.org/licenses/by/4.0/).
Share and Cite
Cantisani, G.; Del Serrone, G.; Mauro, R.; Peluso, P.; Pompigna, A. From Radar Sensor to Floating Car Data: Evaluating Speed Distribution Heterogeneity on Rural Road Segments Using Non-Parametric Similarity Measures. Sci 2024, 6, 52. https://doi.org/10.3390/sci6030052
Cantisani G, Del Serrone G, Mauro R, Peluso P, Pompigna A. From Radar Sensor to Floating Car Data: Evaluating Speed Distribution Heterogeneity on Rural Road Segments Using Non-Parametric Similarity Measures. Sci. 2024; 6(3):52. https://doi.org/10.3390/sci6030052
Chicago/Turabian StyleCantisani, Giuseppe, Giulia Del Serrone, Raffaele Mauro, Paolo Peluso, and Andrea Pompigna. 2024. "From Radar Sensor to Floating Car Data: Evaluating Speed Distribution Heterogeneity on Rural Road Segments Using Non-Parametric Similarity Measures" Sci 6, no. 3: 52. https://doi.org/10.3390/sci6030052
APA StyleCantisani, G., Del Serrone, G., Mauro, R., Peluso, P., & Pompigna, A. (2024). From Radar Sensor to Floating Car Data: Evaluating Speed Distribution Heterogeneity on Rural Road Segments Using Non-Parametric Similarity Measures. Sci, 6(3), 52. https://doi.org/10.3390/sci6030052