Abstract
The aim of this research is to present the effects of acupuncture treatment on morning blood glucose level (BGL) in type 2 diabetes mellitus (T2DM) patients, and to describe them by a predictive model. The morning BGL is measured after overnight fasting during a three-month long acupuncture treatment for two persons diagnosed with T2DM and is compared with the BGL of two persons in similar health conditions taking only metformin-based drugs. It is shown that the morning BGL is highly affected by each single acupuncture treatment and by the number of the already applied treatments. Significant lowering of BGL after each treatment is observed, as well as an overall BGL lowering effect, which is the result of the repeated acupuncture. The observed BGL reduction was found to be maintained during a follow-up performed a year after the acupuncture. The measured BGL dynamics curves are analyzed and described by a model. This model describes well all of the key features of the measured BGL dynamics and provides personal parameters that describe the BGL regulation. The model is used to simulate BGL regulation by acupuncture performed with different frequencies. It can be used generally to predict the effects of acupuncture on BGL and to optimize the time between two treatments. The results will enable a better understanding of acupuncture application in diabetes, and a prediction of its effects in diabetes treatment.
1. Introduction
Type 2 diabetes mellitus (T2DM) is a chronic metabolic disorder characterized by elevated blood glucose levels (BGL) resulting from peripheral insulin resistance and progressive defective insulin secretion [1] and currently affects around 537 million adults (20–79 years old) worldwide. In addition, another 541 million adults have been diagnosed with impaired glucose tolerance or prediabetes—a state in which blood glucose levels are higher than normal but not high enough to be classified as diabetes—the majority of whom will eventually develop T2DM [2,3]. Elevated and poorly regulated BGLs affect multiple organ systems, resulting in the development of complex comorbidities, including coronary disease, cerebrovascular incidents, kidney failure, and blindness, ultimately contributing to higher mortality rates. The burden on public health systems and healthcare spending associated with treating these conditions is significant and amounted to US$237 billion in 2017 in the US alone [4].
In the past years there has been a growing interest in the study of the potential benefits of acupuncture and electroacupuncture—a technique that involves the application of electrical stimulation to acupuncture points—in the management of diabetes and prediabetes, techniques which have shown promising results as complementary treatment options. These have been demonstrated to be effective when correcting multiple metabolic disorders such as hyperlipidemia, obesity, hyperglycemia, inflammation, and insulin signaling defects, contributing a to decrease in insulin resistance, lowering blood glucose levels (BGLs) and improving impaired lipid metabolisms in both humans and animals [5,6,7,8,9,10,11,12,13,14,15,16,17,18,19,20,21,22,23]. Furthermore, it has been shown that, in patients already receiving therapy for T2DM, acupuncture combined with pharmacological therapy is more effective than pharmacological therapy alone in glycemic control [13,19]. Therefore, non-insulin-dependent diabetes mellitus is on a World Health Organization (WHO) list of diseases for which the therapeutic effect of acupuncture has been shown but for which further proof is needed [24]. Although the results are promising, the effects of acupuncture on diabetes are still not completely understood and further research is ongoing.
Mathematical modelling of blood glucose levels is helpful in the prevention, diagnosis and treatment of diabetes mellitus due to its predictive nature and its ability to improve our understanding the underlying processes. Numerous models have been developed for distinct aspects of BGL and diabetes, including a description of BGL dynamics using whole-body models, developed under a pharmacokinetic–pharmacodynamic approach, or physiology-based models, which describe the physiological interactions between different subsystems of the human body [25,26,27]. There are also models for the prediction of various parameters of diabetes based on machine learning methods or on a convolutional neural network, as well as many others [28,29]. However, models for predicting the acupuncture effects on BGL in patients with diabetes, or for understanding its mechanisms, are entirely missing.
In this paper the dynamics of morning blood glucose levels (BGL) during a multiple acupuncture treatment are examined for two patients recently diagnosed with T2DM, and are described by a predictive mathematical model. The obtained BGL properties are compared with the BGL values of two persons with similar health conditions, who are each undergoing only a metformin-based drug treatment. Significant differences in the treatment’s effects on BGL are noticed and explained. We further provide a predictive mathematical model to describe the morning BGL dynamics caused by acupuncture treatments. The model clearly describes all main features of the experimentally measured BGL. The fitting of the measured BGL using the model enables the determination of several important parameters, including time response of the body to the acupuncture treatment, the level of the body’s response, and the predicted time to achieve normalization of BGL.
The manuscript is organized as follows. The introduction is followed by Section 2, which describes the patients who participated in the research, and the description of the acupuncture protocol and drugs they received. The main results are given in Section 3, which is divided into four subsections presenting the (i) obtained measurements of the glucose levels and their qualitative analysis, (ii) modelling and mathematical description of the measured glucose levels, (iii) simulations and the predictions of the glucose levels based on the model and (iv) analysis of the measured glucose levels using the proposed model. The discussion of the obtained results and their importance is given in Section 4, while the main findings are summarized in Section 5.
2. Materials and Methods
Four patients diagnosed with T2DM but with different backgrounds volunteered for this case study and signed informed consents were obtained from all. Two of them received acupuncture treatment, while the other two were treated only by drugs for diabetes. The BGL was measured each morning after an overnight fasting using a Bionime GM550 device. All measurements in this paper refer to the morning BGL, measured after overnight fasting, so the term BGL will be used in the rest of the text.
All patients were chosen for their motivation to participate in a complementary, non-standard treatment of T2 DM, and readiness to adhere to treatment for the planned three-month research. However, the two patients who received acupuncture were chosen explicitly for their different lifestyles in order to determine the effects of acupuncture on BGLs and to exclude the possible effects of lifestyle and administered drugs. Patient 1 was chosen for her normal body mass index (BMI) and lack of antidiabetic drug therapy, and was encouraged to continue taking care of proper diet and exercising. Patient 2 was chosen for being overweight, not following the recommended healthy lifestyle for T2DM patients and for already taking metformin-based drugs. All patients agreed not to receive additional acupuncture treatments during the time of this research.
Patient 1 is a 52-year-old female, with no prior chronic diseases and unremarkable personal history, normal BMI (21.3 kg/m2), healthy lifestyle and positive family history of T2DM in a first-degree relative (father). The elevated BGLs were first noticed during a routine doctor’s examination 7 months prior to the first acupuncture session. The BGL at the time of diagnosis was 9.3 mmol/L, indicative of T2DM. Extensive diabetes self-management education and a trial of individualized medical nutrition therapy were each pursued for three months, resulting in significant lowering of BGLs to an average of 7.2 mmol/L, without achieving prediabetes or normal BGL values. After she was reluctant to begin the suggested therapy with metformin, the preferred initial glucose-lowering medication, a trial period of two weeks of acupuncture was initiated with very good results, which encouraged her to continue in our study without pharmacological therapy.
Control 1 is 68-year-old female with a comparable lifestyle to Patient 1. She has no chronic diseases and an unremarkable personal history, a healthy lifestyle and a positive family history of T2DM in a first-degree relative (father). She is overweight (BMI 27.19 kg/m2) and was diagnosed with T2DM several years ago, with an initial blood glucose value of 9 mmol/L. Since then, she has been taking metformin 1000 mg/day, exercising on a regular basis and strictly adhering to nutrition advice provided by medical counselor. Blood glucose levels have since become stable, averaging around 6 mmol/L with moderate variability.
Patient 2 is a 53-year-old male, who was first diagnosed with T2DM during hospitalization for urgent cholecystectomy, where his initial BGL had a value of 30 mmol/L. He was immediately started on metformin 1000 mg/day, which resulted in a rapid fall of fasting BGL to an average of 9 mmol/L, two months prior to the first acupuncture treatment. Patient 2 is overweight (BMI 27.61 kg/m2) and changed neither his nutritional nor his life habits. His family history for T2DM is negative.
Control 2 is 73-year-old male, in similar health condition as Patient 2. He is obese (BMI 31.7 kg/m2), does not perform physical exercise and is following neither the instructions for a healthy diet nor for healthy life habits. He was diagnosed with diabetes several years ago, with initially very high BGL values (larger than 30 mmol/L) and has since been taking metformin with vildagliptin 1000 mg/day. The BGL stabilized at an average of about 9 mmol/L after starting with drug therapy, with periodic larger fluctuations. His family history for T2DM is also negative.
The acupuncture treatments were performed on Patient 1 and Patient 2 mostly twice a week, on every first and third or every first and fourth day, as this frequency ensured the patients’ best adherence to the foreseen three-month protocol, due to their life and work schedule The session duration was limited to 25 min, which was precisely timed, in order to keep the treatment duration and treatment frequency variations between participants to a minimum. The point selection for acupuncture was identical for both patients and has been made according to [21,22], as these were demonstrated to have a significant impact on lowering fasting BGL. The following points were selected: BL13 Feishu, BL20 Pishu, BL23 Shenshu, BL43 Gaohuangshu, Yishu, SP6 Sanyinjiao, ST36 Zusanli, LiV3 Taichong, LU5 Chize, LU10 Yuji, LI4 Hegu, CV4 Guanyuan, CV6 Quai, CV12 Zhongwan, CV23 Lianquan, and KI3 Taixi. All the points were located in accordance with the WHO standard acupuncture point locations. Electroacupuncture was applied to points ST36 bilaterally and CV4-CV12, with frequency of 2Hz in duration of 20 min. The acupuncture treatment was not personalized, i.e., it was not tailored and modified according to the patient’s individual needs and symptoms at the specific time. Rather the chosen protocol was applied in full throughout the planned three month time frame in both patients, without any additional stimulation through additional acupuncture. Both patients received 20 treatments in total. The applied treatment of acupuncture was considered successful upon the achievement of a target fasting BGL below 7 mmol/L, the critical value for diabetes diagnosis [30].
After 12 treatments, Patient 1 contracted COVID-19, so the treatment was interrupted for 3 weeks. A similar break of 2 weeks was made accordingly in the treatment of Patient 2. After the break, 8 further treatments were performed, 20 in total, which was enough to achieve glycemic target in both patients. The control of the achieved results for both patients was performed 1 year after the acupuncture. It consisted of the BGL measurements using the same procedure as during the acupuncture, of course without the acupuncture treatment.
The patients Control 1 and Control 2 are taking only daily medication without acupuncture. In each of these cases, the drugs caused fast lowering of the initially high BGL, after which it stabilized at the mentioned levels. Both of the patients are continuously measuring their morning BGL values.
3. Results
3.1. Measurement and Analysis of the Glucose Level
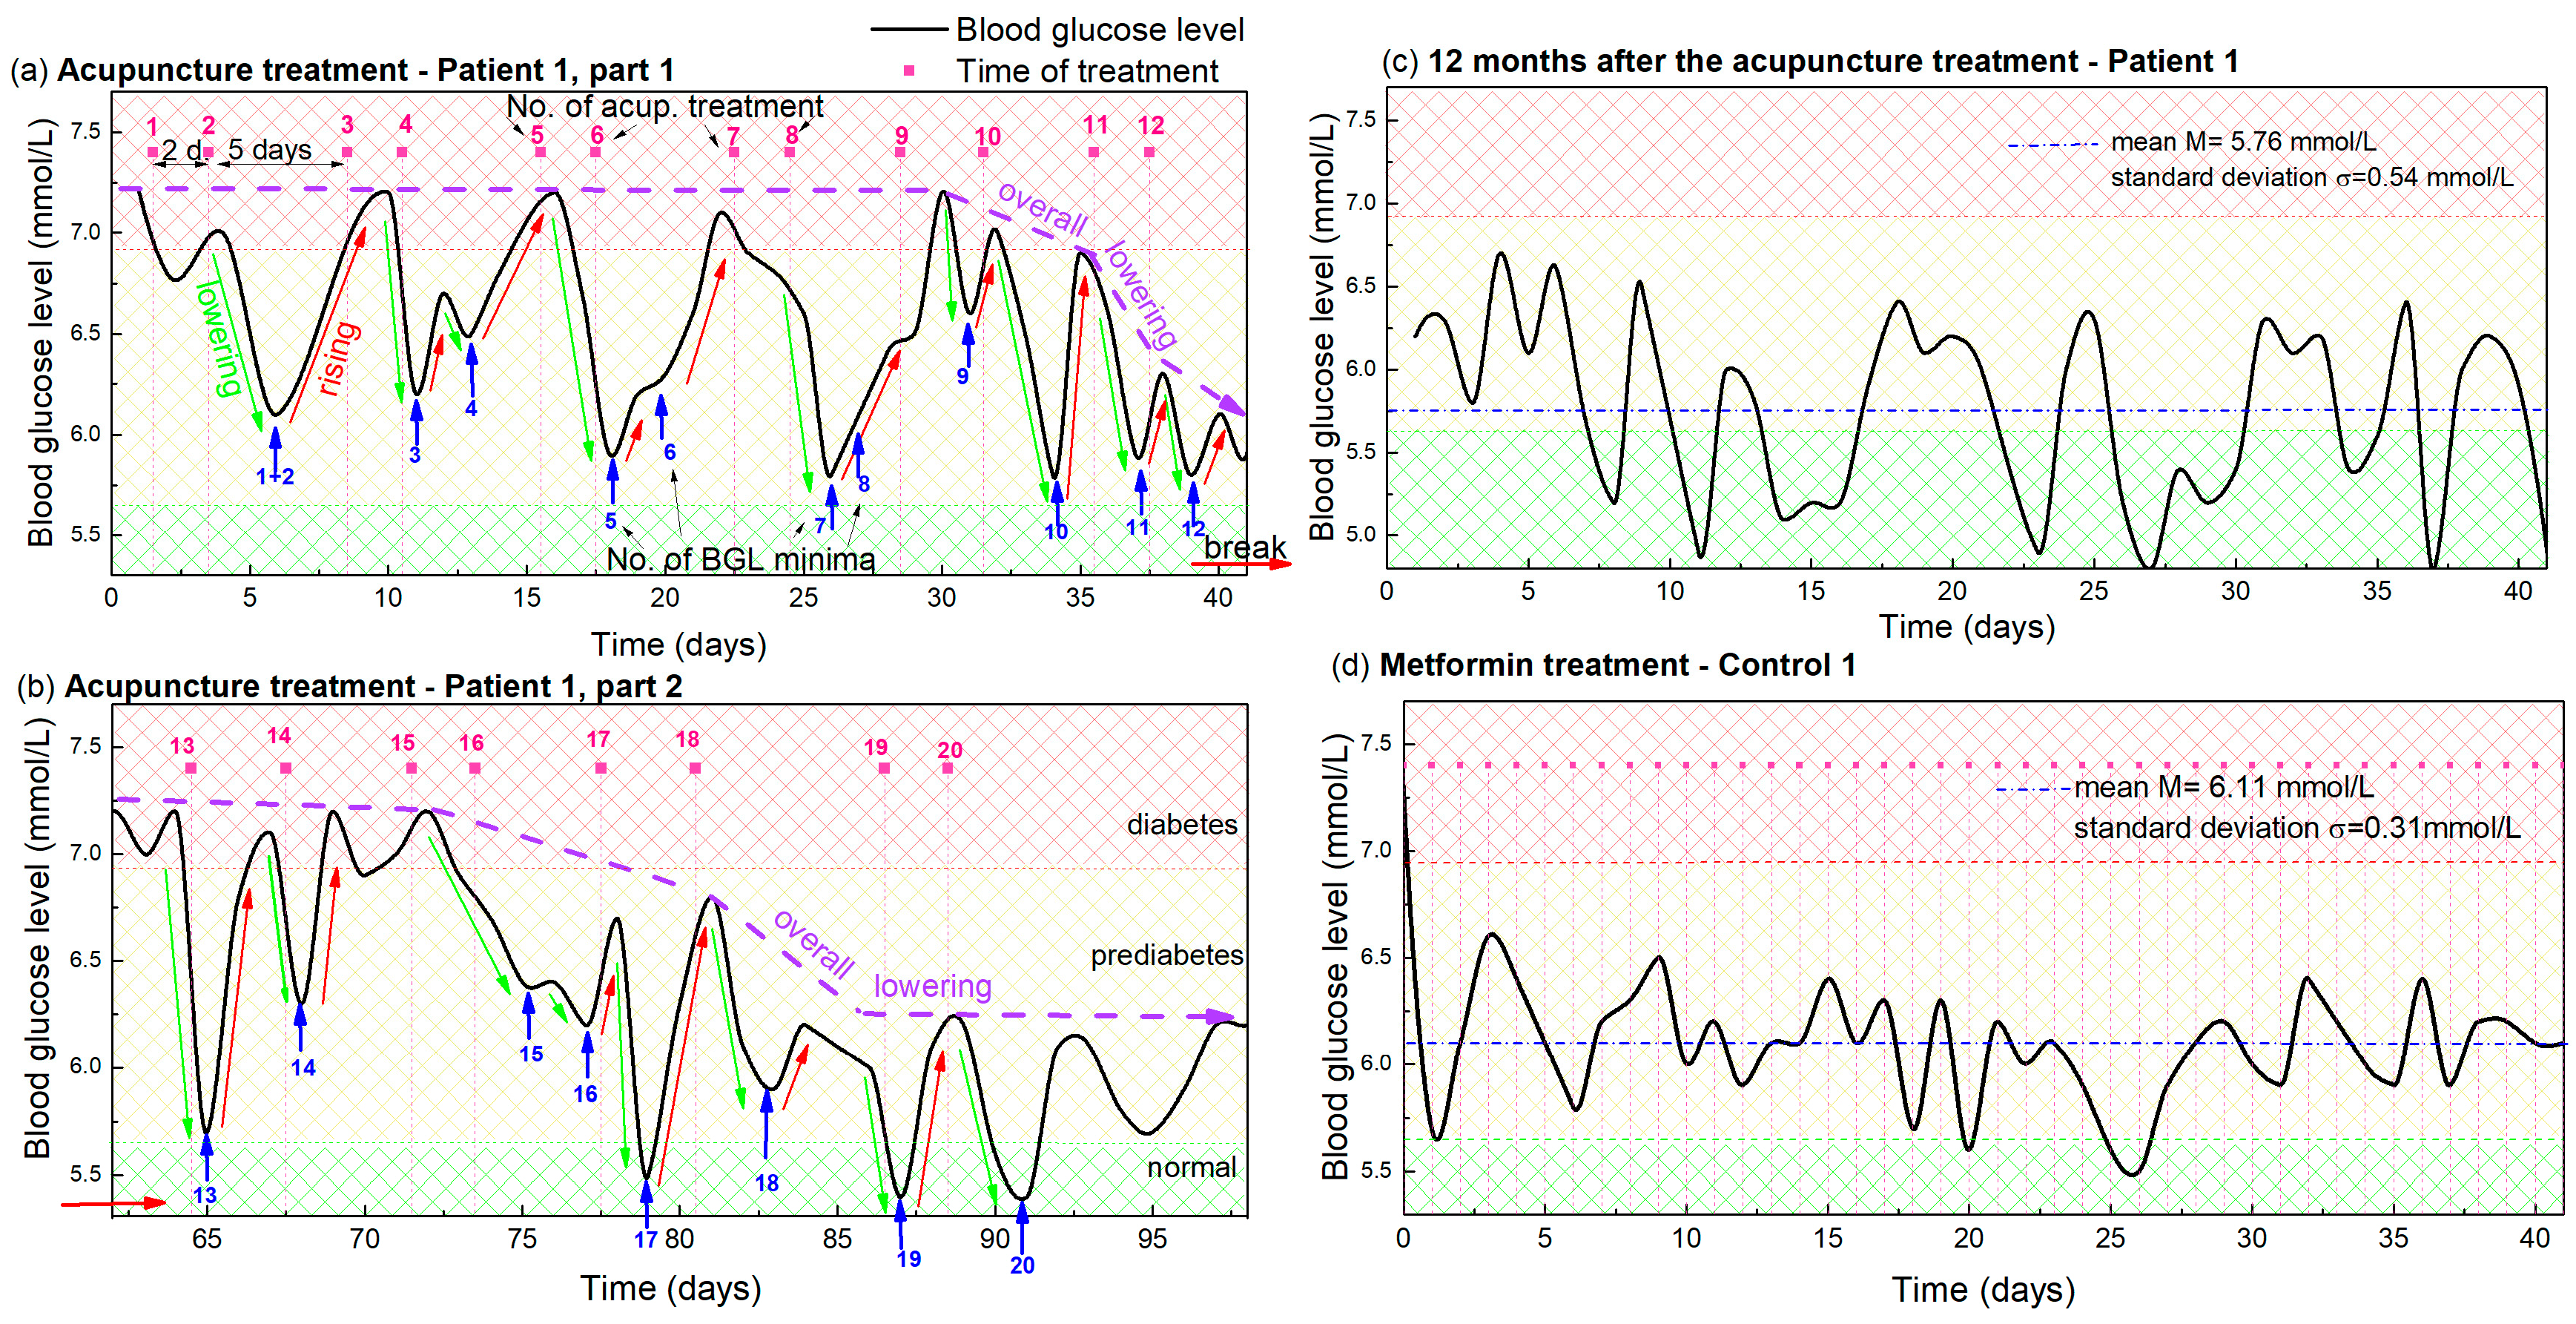
The dynamics of the morning BGL during the acupuncture treatment of Patient 1 is shown in Figure 1. Figure 1a shows the glucose level during the first 12 acupuncture treatments after which the patient contracted COVID-19, interrupting the acupuncture for 3 weeks. After that break, eight additional treatments were performed, and the glucose level measured for that period is shown in Figure 1b. Both curves show clear oscillations, with the peaks determined by the time of applied acupuncture treatment, so the following text is focused on their description and analysis.
Figure 1.
(a,b) Blood glucose levels during acupuncture as function of time for Patient 1. The days in which the acupuncture was received are indicated by vertical pink dashed lines, while the pink numbers above them indicate the number of the already applied treatments. Blue arrows and numbers indicate the minima of the glucose level that appear after each acupuncture treatment and the number of the applied treatments. The lowering and rising effects are denoted by green and red arrows. The overall lowering effect is indicated by dashed violet arrows. The small, red horizontal arrow indicates the break in the acupuncture due to COVID-19. Normal, prediabetes and diabetes BGL are indicated by green-yellow and red patterns (color areas). (c) BGL for Patient 1 controlled 1 year after the acupuncture treatment. (d) BGL during metformin-based treatment of Control 1 with a similar disease history. The average BGL value is indicated by horizontal blue line.
The time of each acupuncture treatment is indicated by vertical pink dashed lines in Figure 1 and numerated by pink numbers above each dashed line. Thus, the treatments were performed twice a week. Usually, two treatments were applied with two days separation, followed by a five day acupuncture-free period, as described previously.
The BGL (black curve in Figure 1a) has an initial value of 7.2 mmol/L before the acupuncture. This significantly lowers after each treatment, followed by an increase back to the high value in the acupuncture-free period, causing its oscillatory behavior, as visible from Figure 1a. The minima of the BGL oscillations are indicated by blue arrows and numerated by blue numbers. Thus, each minimum (i.e., the blue number) can be easily related to the corresponding number of the applied treatment (pink number). It is clearly visible that each treatment causes a significant lowering of the BGL (indicated by green arrows), however, the lowering effect does not appear immediately after the acupuncture, but is shifted for 2–3 days. Thus, each treatment and its corresponding minimum, having the same order numbers, are always shifted for 2–3 days.
The lowering effect is especially strong after the 2 closer treatments (2 day separation). Therefore, we can observe the strong lowering effect in the graph after the 2 closer treatments (1 and 2, 3 and 4, 5 and 6 …) with the 2 minima corresponding to the 2 treatments. After each strong lowering effect, the glucose level raises back to the initial high level (7.2 mmol/L) during the longer acupuncture free period (5 days) for the first 9 treatments. The increase is emphasized by red arrows in Figure 1. Finally, an overall lowering effect, indicated by violet arrows, is observed after the 10th treatment. In that case the glucose level does not increase back to the initial level of 7.2 mmol/L, but starts to lower as well. The maximal increase of about 6.2 mmol/L was observed after the 12th treatment. After that, Patient 1 contracted COVID-19, so the acupuncture and measurements were interrupted for three weeks.
Three important features can be resolved from the measured BGL shown in Figure 1a and they are used for the predictive modelling of the BGL during acupuncture (next section):
- (i)
- Lowering effect. The glucose level significantly lowers after each single acupuncture treatment (green arrows); the reduction is especially strong after 2 treatments that are closer together in time (2 days separation). A delay in the response of the body of about 2–3 days is evident.
- (ii)
- Rising effect. The glucose level rises back to the initial high value during the 5 day acupuncture-free period for the first 9 acupuncture treatments (red arrows).
- (iii)
- Overall lowering effect. An overall lowering effect, i.e., BGL normalization, was observed after the 10th treatment, so the glucose level dropped below 6.2 mmol/L after the 12 treatments (violet dashed-line arrow).
Figure 1b shows the BGL measurements after the illness. First, we notice that the glucose level increased to the initial level of about 7.2 mmol/L during disease. However, the same pattern of glucose level behavior can be observed as in Figure 1a. More precisely, the measurements again show the characteristic lowering and rising effects after each treatment, but the measurements are much noisier than those from Figure 1a. We attribute the noise directly to SARS-CoV2 and its effect on glucose metabolism [31,32,33]. Another important finding is that the overall lowering effect was achieved after only four treatments, and the glucose level of about 5.7 mmol/L generally remained constant after the acupuncture treatment is stopped. The same (average) level is kept for one year after the treatment, and is shown in Figure 1c. The average (mean) value is 5.76 mmol/L, with a standard deviation of 0.54 mmol/L, which is almost the normal BGL value. This is achieved only by acupuncture and a healthy lifestyle.
The presented BGL measurements are compared with those taken from Control 1, who has a similar disease history and similar nutrition and exercise habits. They are shown in Figure 1d. The BGL measurements are taken after the initial rapid reduction from 9 mmol/L caused by the drugs. The mean value is 6.11 mmol/L and standard deviation 0.31 mmol/L. This BGL curve is similar to the measurements shown in Figure 1c, taken for Patient 1 one year after the acupuncture. However, it shows significantly different properties than the BGL measured during the acupuncture treatment, shown in Figure 1a,b. The first difference refers to the BGL fluctuations which are more rapid and random. No correlation with the day of treatment is visible as for the case of acupuncture treatment (lowering and rising effects). The overall lowering happened immediately after the therapy was started and since then the BGL fluctuate slightly around the value of about 6 mmol/L.
Thus, both treatment methods produced similar final results, lowering the BGL from about 9 mmol/L to near 6 mmol/L for both patients (Patient 1 and Control 1). The main differences are: (i) the targeted BGL value was achieved only by acupuncture treatment for Patient 1 (no drugs included); (ii) the normalization of BGL was much faster for the metformin-based therapy (Control 1), but constant therapy is necessary, which is not the case for Patient 1; and (iii) the oscillations related to the day of treatment are absent for the drug-based therapy (Control 1), which shows only standard BGL fluctuations.
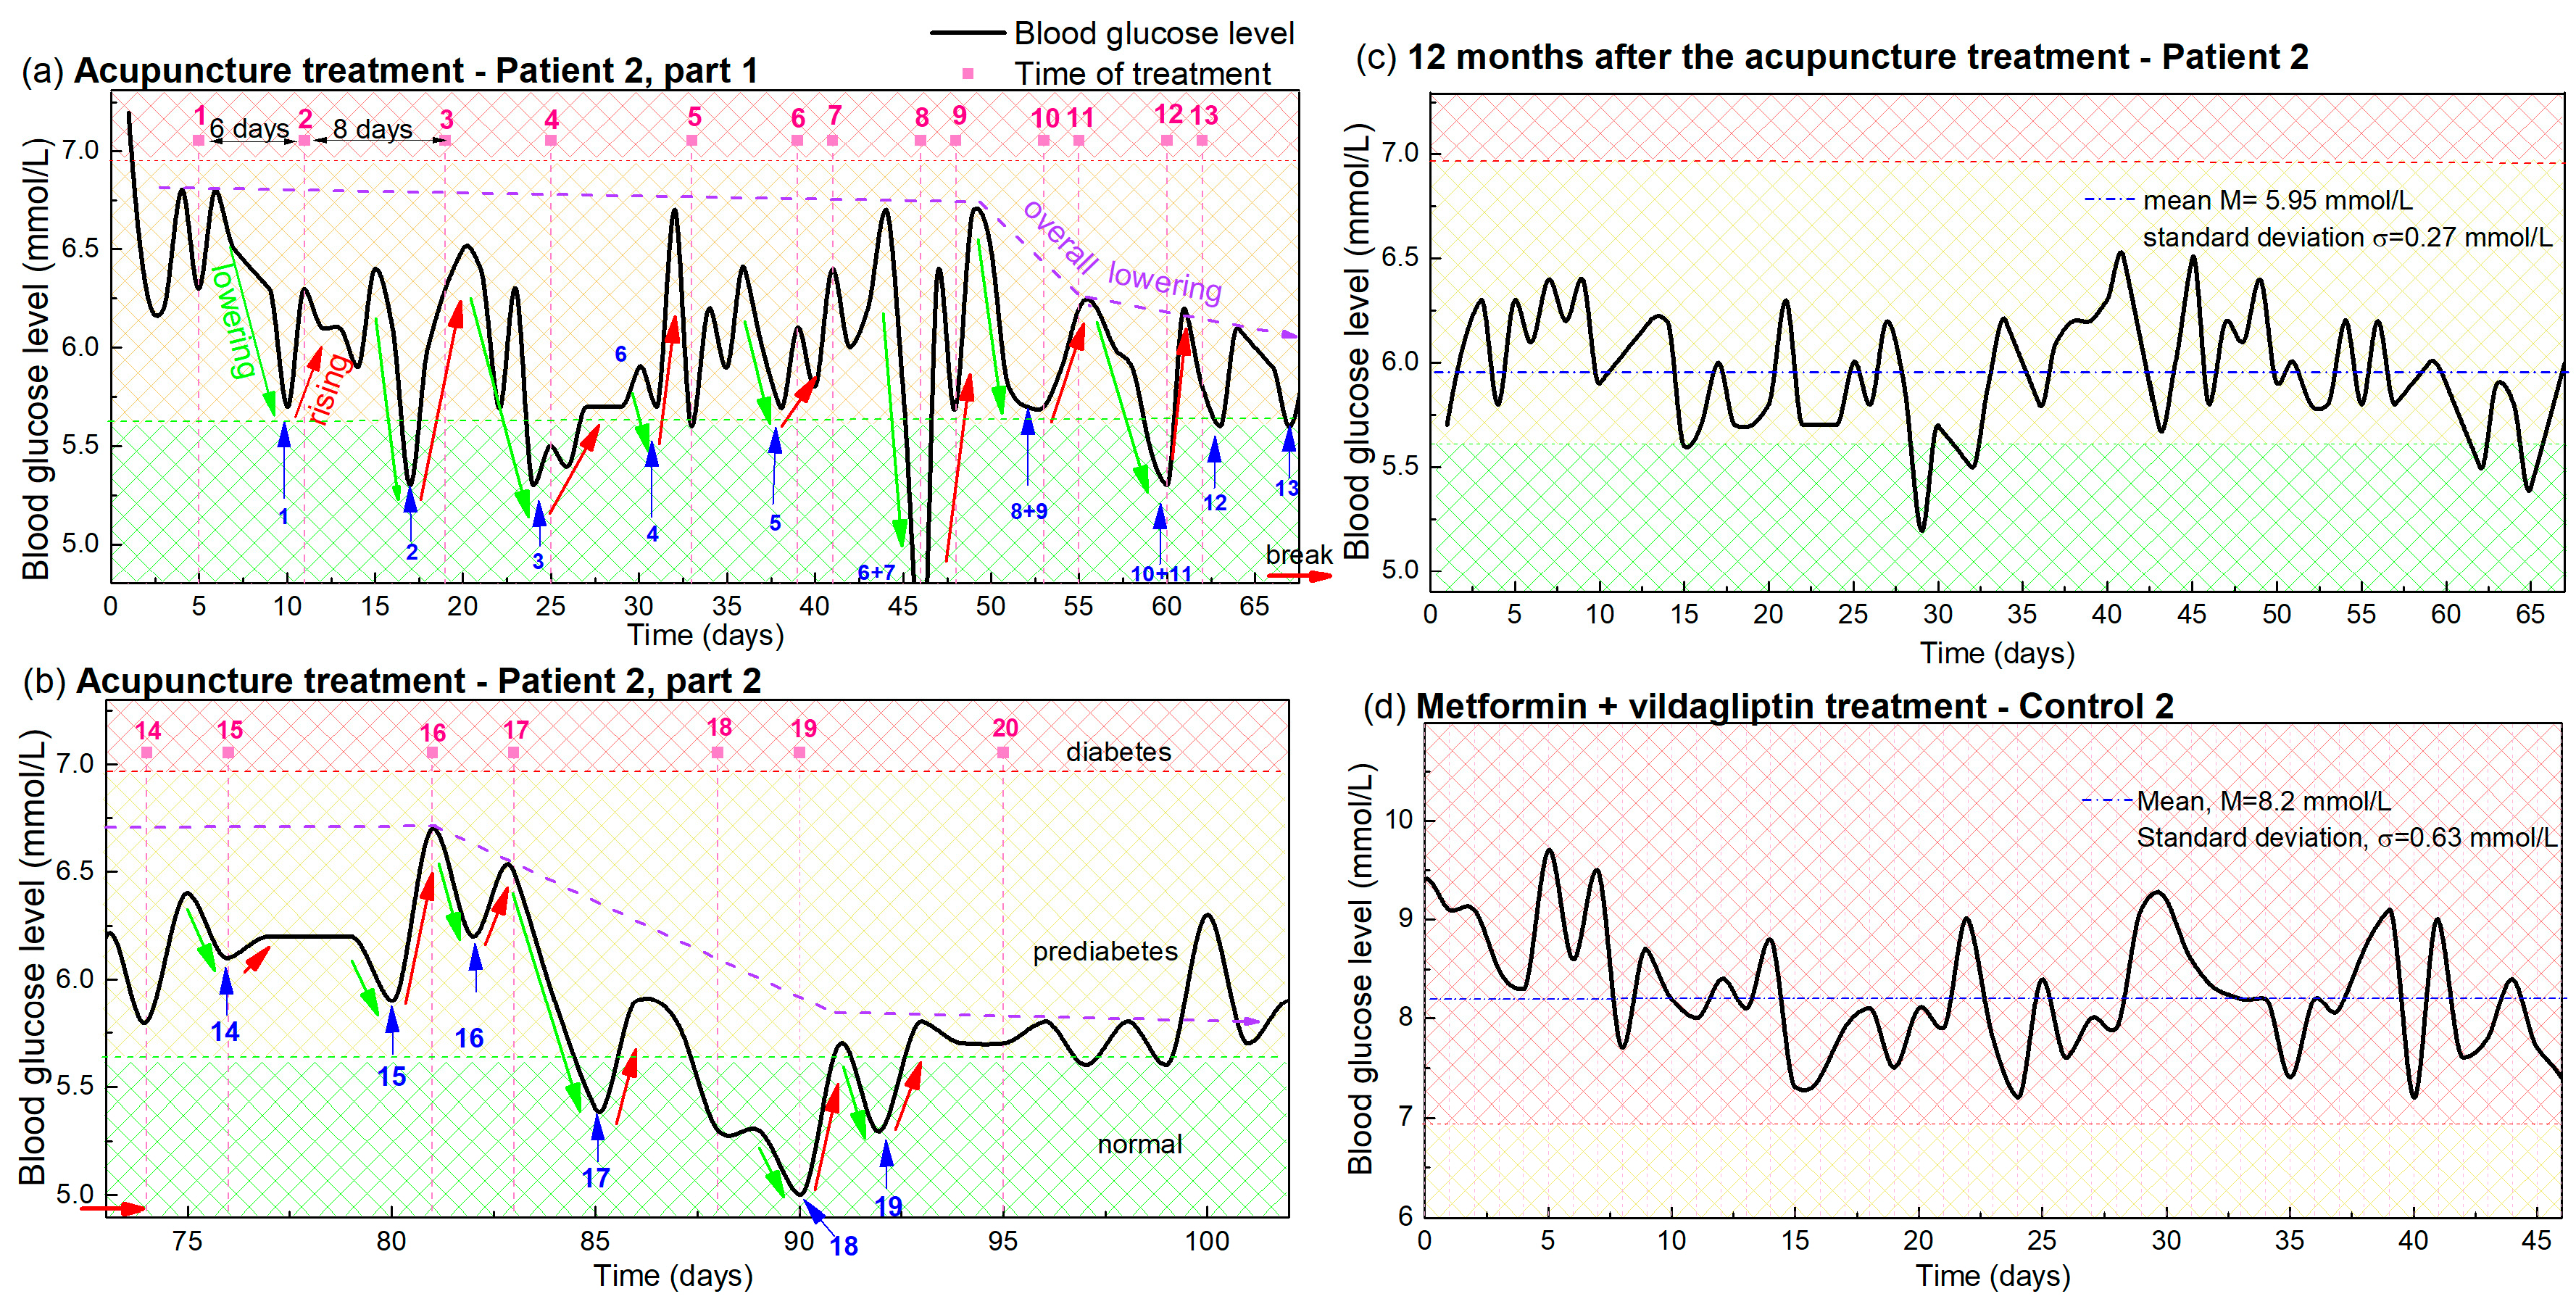
The same procedure is applied to the BGL levels of Patient 2, and Control 2. The measurements are shown in Figure 2. The main differences in the experimental conditions with respect to Figure 1, are: (i) the frequency of the acupuncture therapy changed slightly for Patient 2. It started with 1 therapy per week (6- and 8-day separation), and continued with 2 per week (2- and 5-day separation); (ii) Patient 2 and Control 2 do not have as healthy a lifestyle as Patient 1 and Control 1, including their adherence to diet and exercise; and (iii) Patient 2 has been undergoing a metformin-based therapy in addition to the acupuncture, while Patient 1 received only acupuncture. Due to the larger separation of treatments the overall time for 12 treatments was longer for Patient 2 (67 days) than for Patient 1 (43 days).
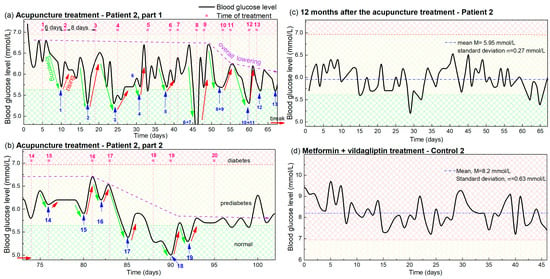
Figure 2.
(a,b) Blood glucose levels during acupuncture as a function of time for Patient 2. The days in which the acupuncture was received are indicated by vertical pink dashed lines, while the pink numbers above them indicate the number of the treatment. Blue arrows and numbers indicate the minima of the glucose levels that appear after each acupuncture treatment, and the number of the treatment. The lowering and rising effects are denoted by green and red lines. The overall lowering effect is indicated by dashed violet arrows. Small red horizontal arrows indicate the break in the acupuncture treatment. Normal, prediabetes and diabetes BGL are indicated by green-yellow and red patterns (color areas). (c) BGL of Patient 2 controlled 1 year after the acupuncture treatment. (d) BGL during metformin-based treatment of Control 2, with a similar disease history.
The BGL measurements of Patient 2 during the acupuncture treatments before and after the break are shown in Figure 2a and Figure 2b, respectively. First, we can note that the lowering, rising and overall lowering effects are also clearly visible for Patient 2 (indicated by green, red and violet arrows respectively) as was the case for Patient 1. The effect again follows the frequency of the acupuncture, although it is different than for Patient 1 and changes during the treatment. The effect of the overall lowering also begins after the 10 therapies, as it does for Patient 1 (Figure 2a), and the BGL increased to the elevated value during the break. The overall lowering was also achieved after the four therapies after the break (Figure 2b) as is the case in Figure 1b. Finally, the reduced BGL value was also present at the check performed one year after the treatment as visible in Figure 2c. The mean value of 5.95 mmol/L and the standard deviation of 0.27 mmol/L show that the values are kept close to normal. Thus, all of the main effects of the acupuncture treatments are the same for both patients, though they have different backgrounds and different acupuncture frequencies.
The main difference in the results is that the measurements of Patient 2 are noisier, which we can attribute to the non-healthy lifestyle affecting the BGL variation, as will be explained in Section 4. The measurements for Control 2, with similar habits and undergoing only drug therapy, are shown in Figure 2d. In this case, the mean BGL value is 8.2 mmol/L with a standard deviation of 0.63 mmol/L. Patient 2 had a similar mean BGL value before the acupuncture treatment, when undergoing only a metformin-based therapy as Control 2.
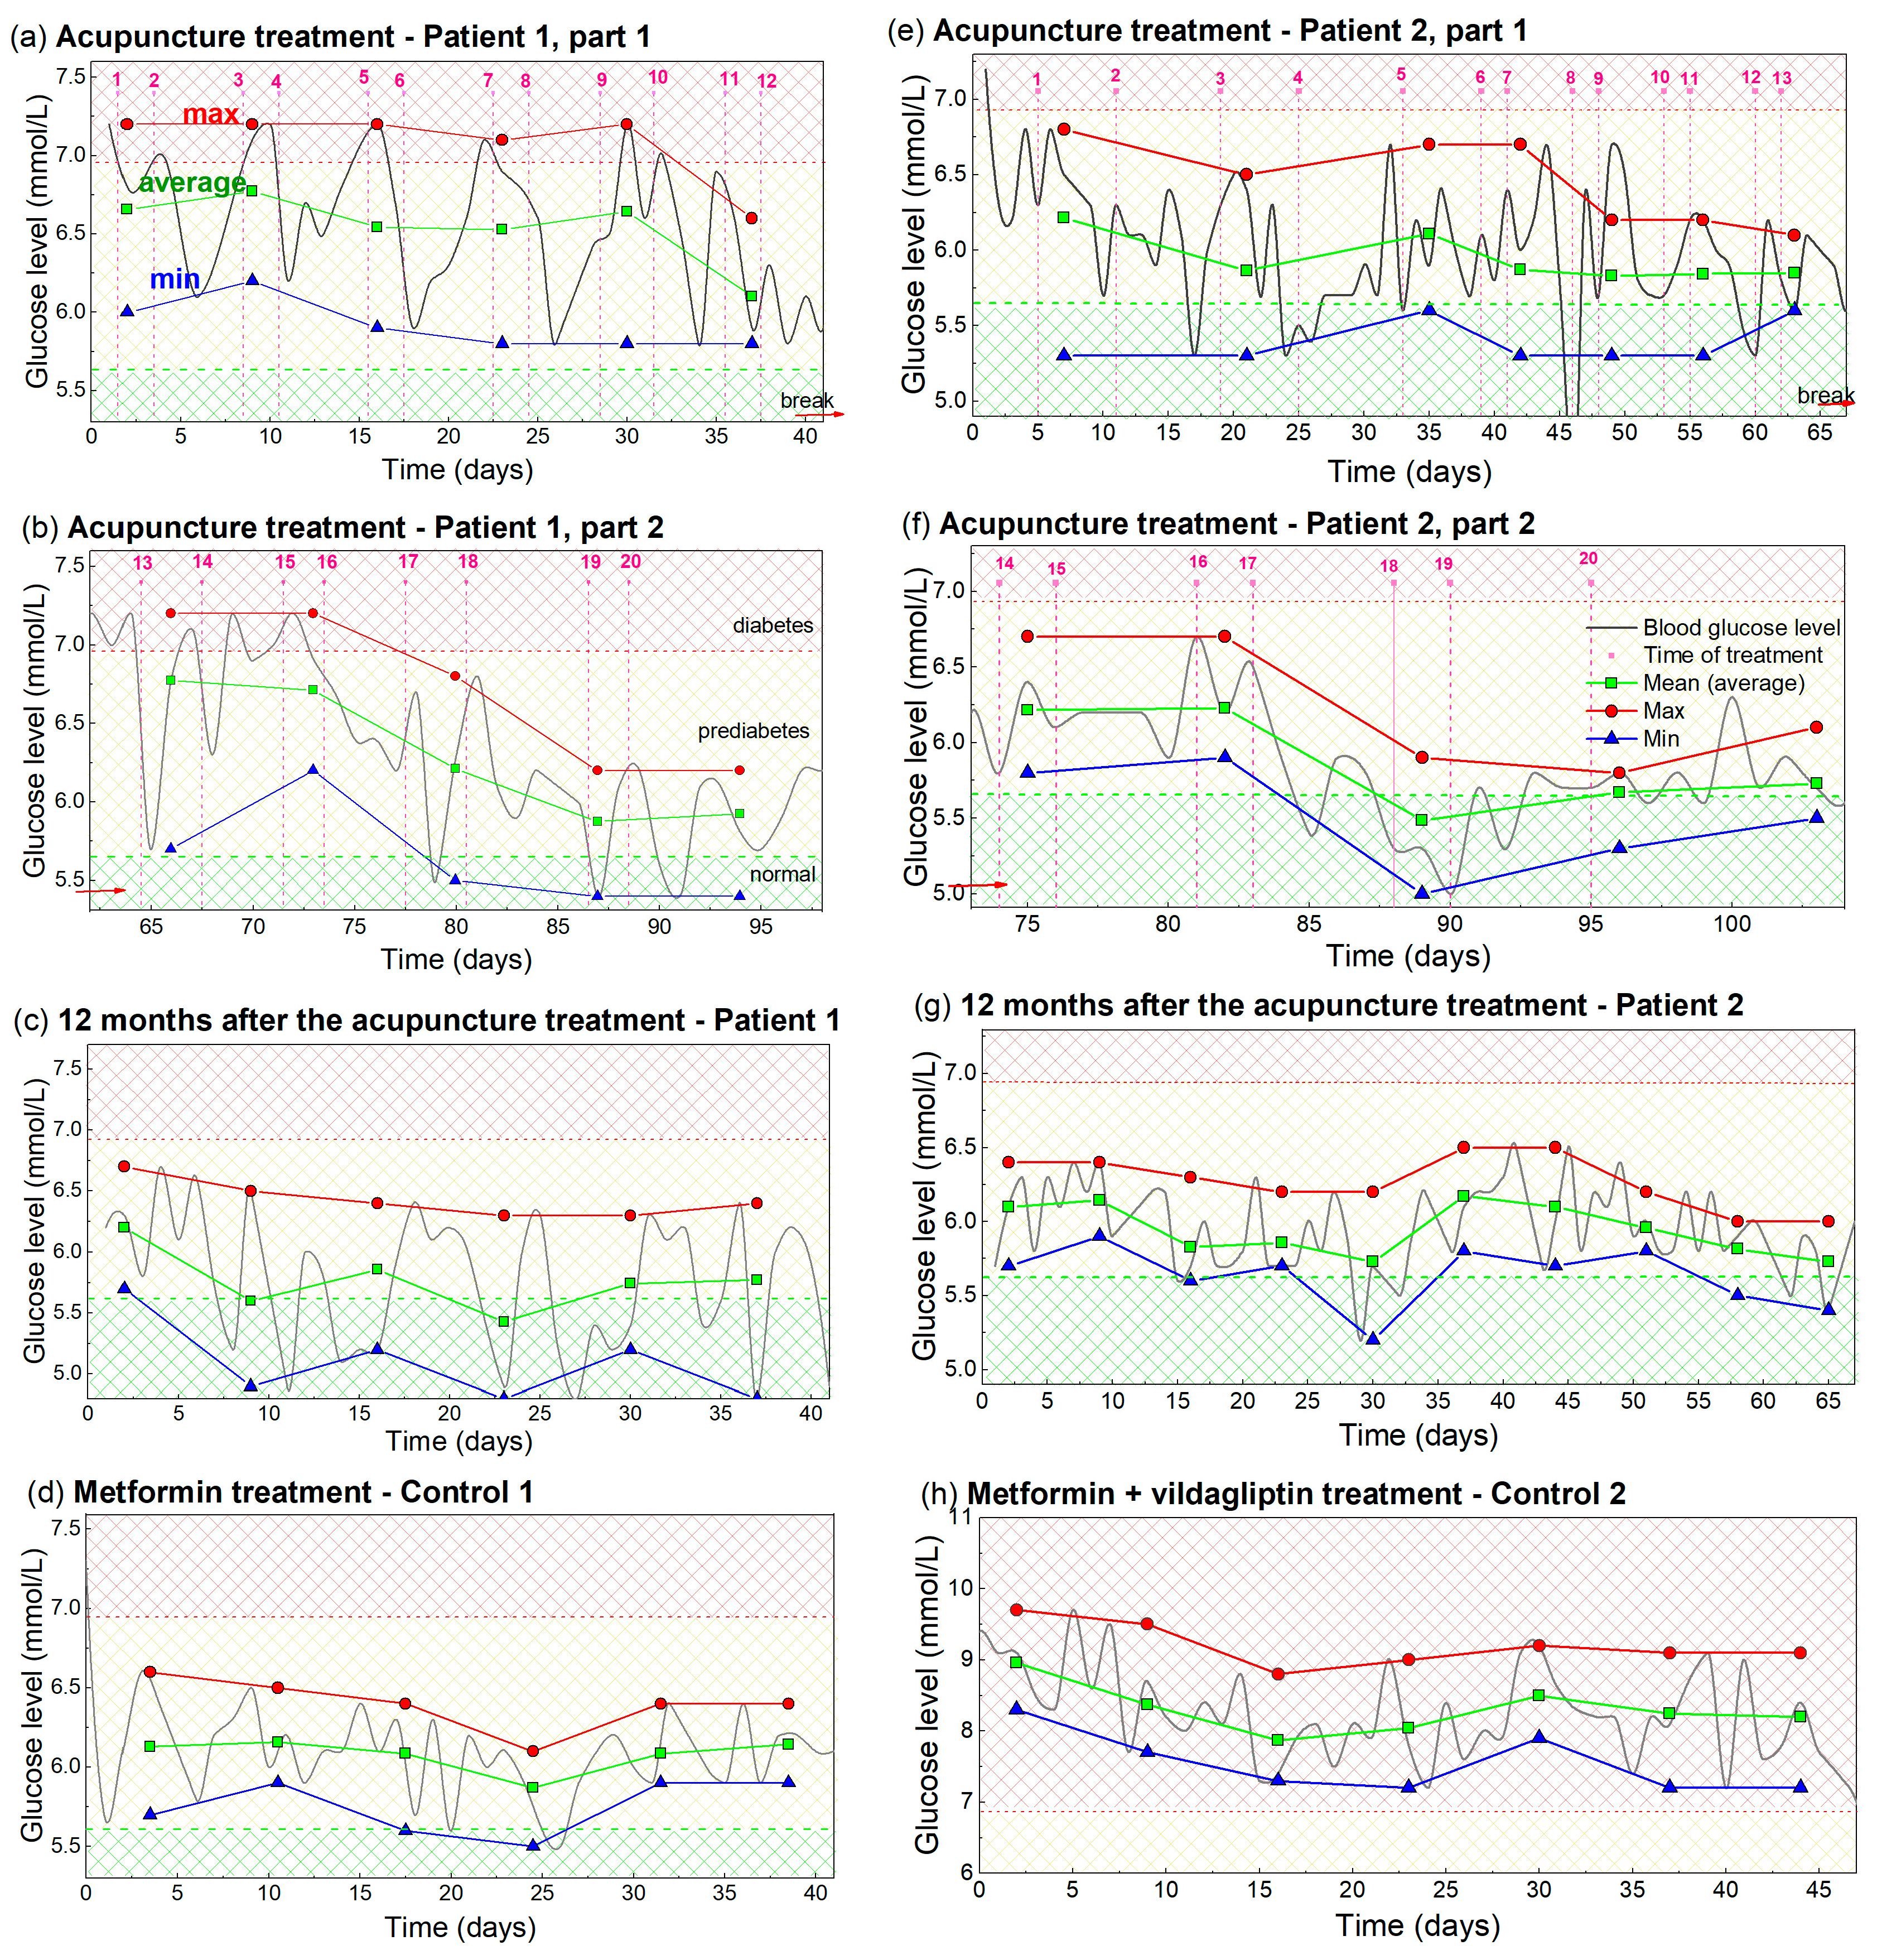
A detailed analysis of the BGL measurements from Figure 1 and Figure 2 was performed to enable better visibility and understanding of the observed effects. It includes a determination of the maximal, minimal and averaged (main) values of the measured BGL during each week of the treatments. These are shown in Figure 3. The measurements from Figure 1 and Figure 2 are indicated by light gray lines.
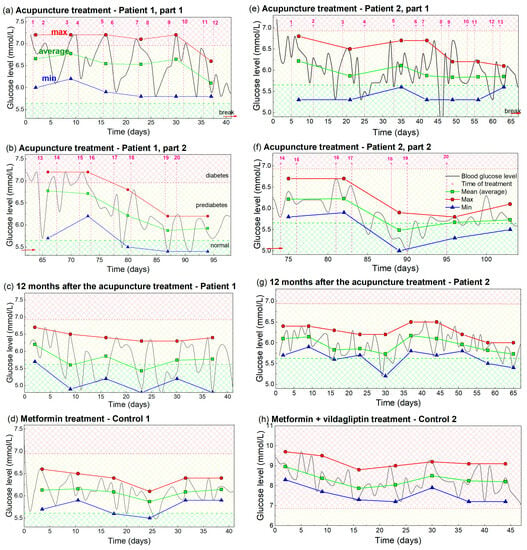
Figure 3.
Analysis of the measured BGL, including maximal, average and minimal values of BGL during the acupuncture or drug treatment. (a–d) Patient 1 and Control 1, i.e., analysis of the measurements from Figure 1. (e–h) Analysis of the BGL values for Patient 2 and Control 2, i.e., the measurements from Figure 2. The measurements taken for the analysis are indicated by light gray lines. Maximal value is indicated by red, average by green, and minimal value by the blue line and symbols. The averaging and determination of the maximal and minimal glucose levels are performed over a time interval that included two acupuncture treatments or seven days of taking the drug-therapy. The time of acupuncture treatment is indicated by vertical dashed pink lines. Normal, prediabetes and diabetes BGL are indicated by green-yellow and red patterns (color areas).
The maximal BGL values, shown by the red line and symbols in Figure 3a, show the maximal values of BGL for Patient 1 during each of the 1 week periods (two treatments). It has an approximately constant value of 7.2 mmol/L, until the 10th treatment. This fact shows that the BGL rises back to its initial (high value), after each reduction by acupuncture in that period. After the 10th treatment, the maximal value dropped to the lower value of about 6.9 mmol/L, showing the beginning of the overall lowering effect. The average BGL value, denoted by the green line and symbols, shows that the average BGL lowers with each new acupuncture treatment, as early as the second treatment. This drop is larger after the 10th treatment when the overall lowering is observed. The minimal values of the BGL are shown by the blue line and symbol. This curve shows a similar lowering effect as the average value curve, and drops in the normal BGL range after the 10th treatment.
The same properties, but with a more obvious BGL drop for all values (maximal, average and minimal) are visible in Figure 3b. This shows the properties of the eight treatments performed for Patient 1 after contracting COVID-19 (measurements from Figure 1b). The maximal values start to lower after the four treatments (16th treatment) as well as the average and minimal values. All values are below the diabetes BGL limit (6.9 mmol/L). The values stabilized after the 18th treatment and stayed nearly constant even one year after the acupuncture, as is visible in Figure 3c. The minimal and most of the average values are in the regime of normal BGL, while the maximal values are very slightly above the normal value. The values for Control 1, shown in Figure 3d, are also nearly constant and slightly above the normal values.
The analogue analysis for Patient 2 and Control 2 are shown in Figure 3e–h. They all show the same main properties, including overall reduction (Figure 3e,f), achieving an almost normal BGL value which was kept for at least 1 year after the treatments (Figure 3g). The main difference is the smaller BGL variability of the achieved BGL for Patient 2, which is probably the consequence of the metformin therapy. Another difference is the much higher BGL values for Control 2 (Figure 3h), which are all still in diabetes range. We believe this fact is the consequence of a nonhealthy lifestyle and probably to some extent to differences in their age.
In summary, each acupuncture treatment lowers the blood glucose level, and the lowering effect is maximal approximately 2–3 days after the acupuncture. However, the glucose level rises back to the initial high value in the acupuncture-free period. These oscillations in the BGL curve occur until some critical treatment, after which it starts to lower as well, so an overall lowering is visible. The critical treatment, i.e., the overall lowering, is achieved after the 10th treatment in the first acupuncture cycle, and after the 4th treatment in the second acupuncture cycle. The drug-based therapy causes fast overall lowering, but no oscillations related to the time of treatment are visible. Another relevant feature is that all of the important effects of the acupuncture are the same for both treated patients, although they are very different in their lifestyle and the way in which they are taking drugs for diabetes. This eliminated many alternative possible reasons beyond acupuncture that might cause BGL normalization.
3.2. Modelling of the Glucose Levels
Based on the presented measurements, a model is proposed that mathematically describes the BGL over time during the acupuncture treatment. The function that describes the BGL dependence on time (t) is denoted by Gl (t), and the total number of applied acupuncture treatments is denoted by NA. Gl (t) has a constant value equal to the elevated BGL named Ghigh, before the first treatment (i = 0), where i is the number of the already applied acupuncture treatments. For details, please see the Equations (A1) and (A2) given in Appendix A.
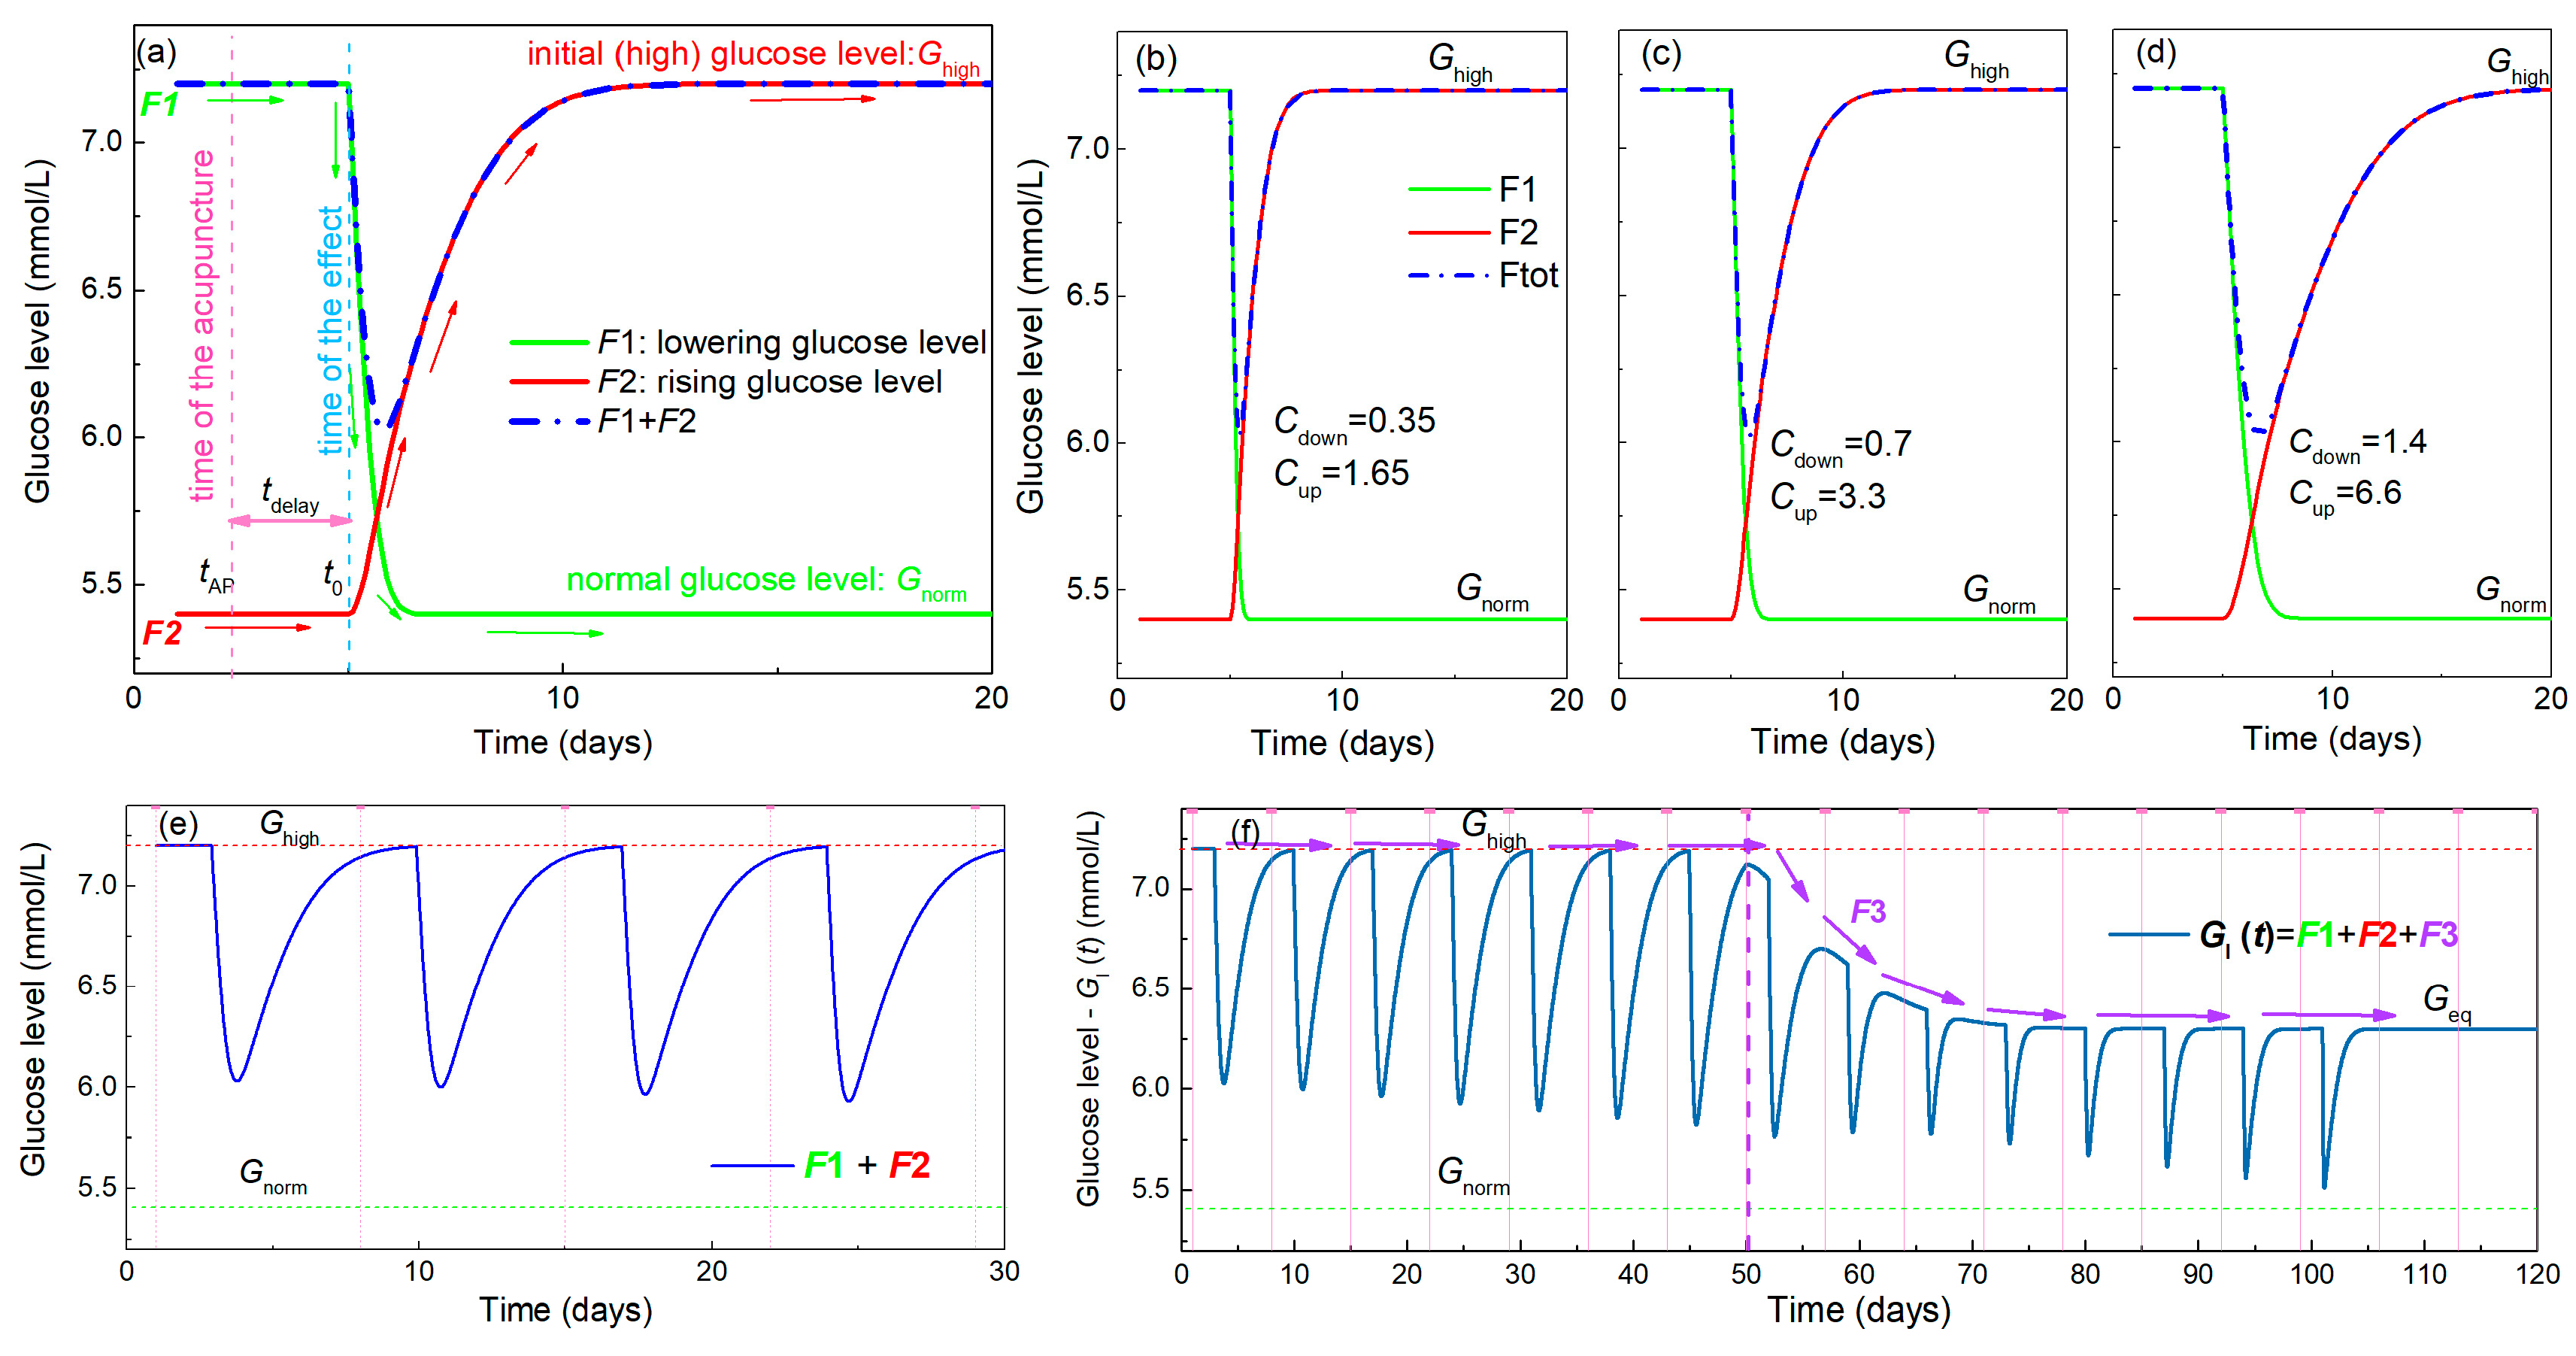
Gl (t) assumes the existence of three main effects, as was observed in the experiment presented in the previous section. Thus, it actually consists of three sub-functions (named F1–F3), each of which describe one of the observed effects. Their main features are shown in Figure 4 and include:
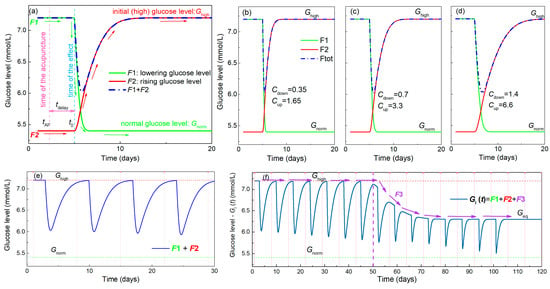
Figure 4.
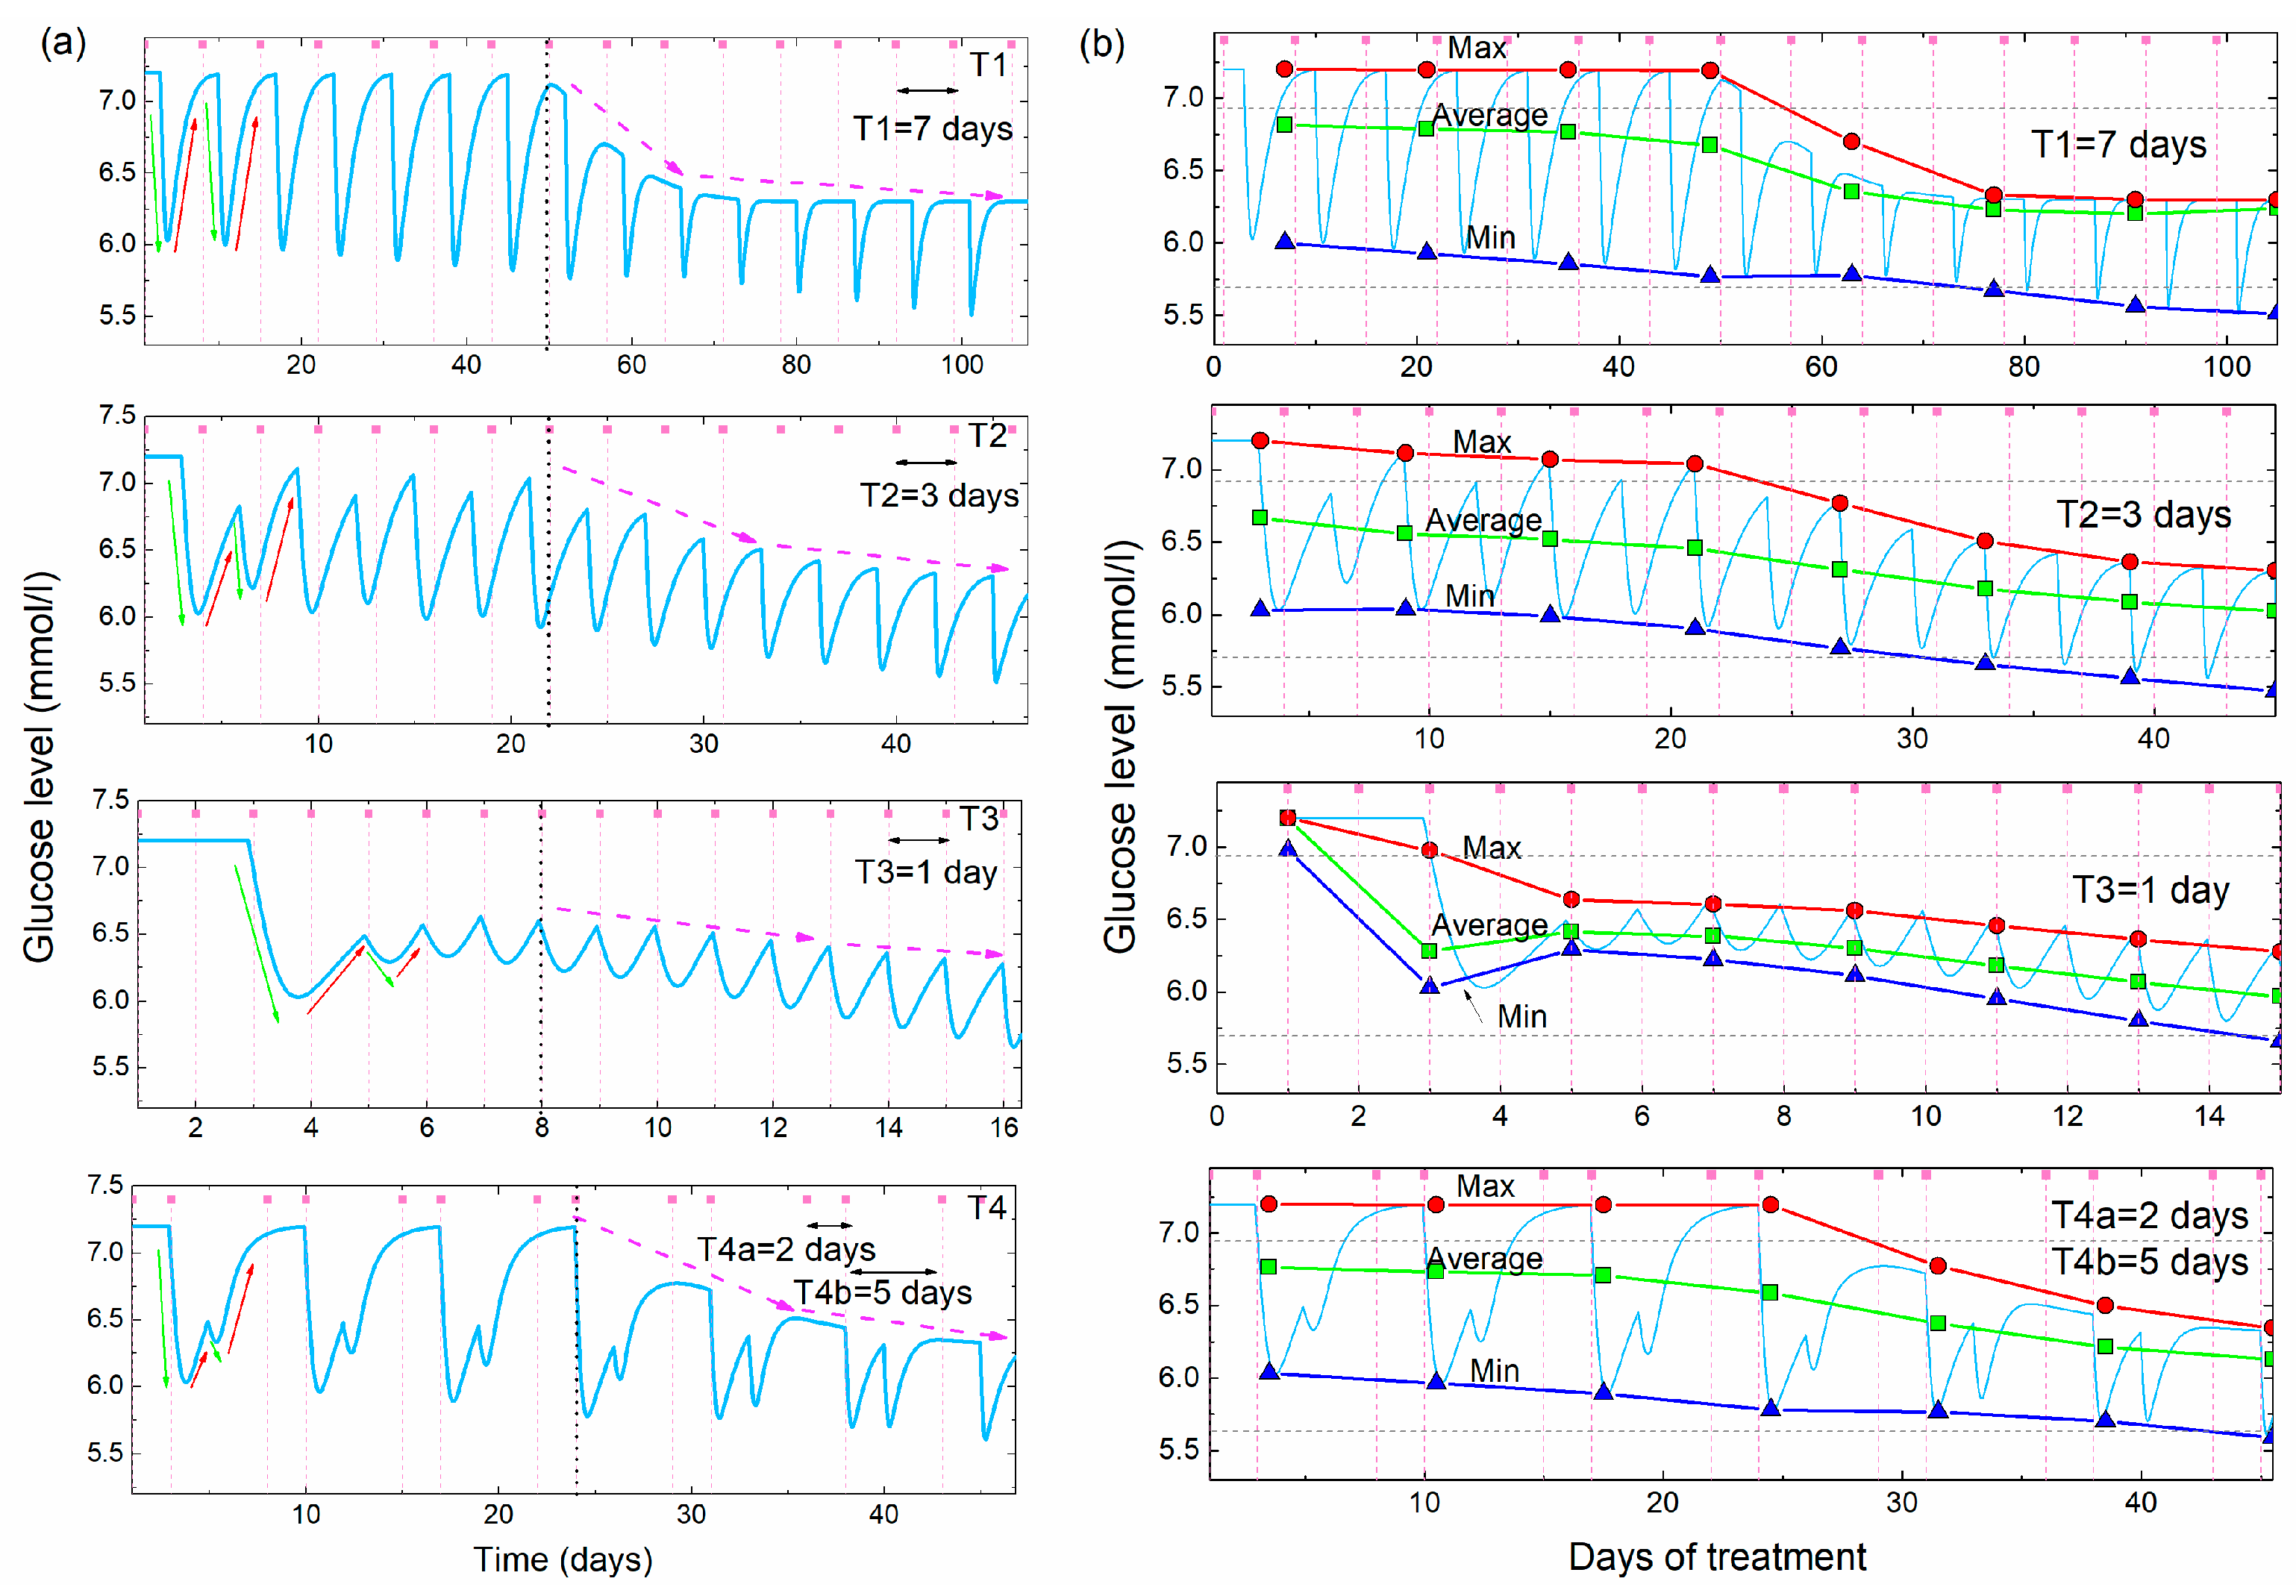
Properties of the functions used for modelling of BGL during acupuncture. (a) Function F1 shown by the green line describes the lowering of the BGL by acupuncture towards a normal value Gnorm, while F2 (red line) represents its rising back to the elevated value Ghigh. The resulting function shown by the blue line is the sum of F1 and F2. The time of the acupuncture (tAP) is denoted by the vertical pink dashed line, while the time when its effect starts to be visible (t0) is denoted by the vertical blue dashed line. This means that there is a delay in the body’s response named tdelay. (b–d) Simulations of F1 and F2, and their sum using three different function parameters Cdown for F1 and Cup for F2 corresponding to faster and slower body responses. (e) Simulation of the BGL for the multiple acupuncture treatment using functions F1 and F2 only. This describes only the oscillatory nature of the measured curves caused by acupuncture. The time of the acupuncture is shown by the pink dashed line. (f) The effect of the addition of function F3, corresponding to the overall lowering, to F1 and F2 on the BGL. This lowers the value of Ghigh towards Gnorm during the treatment which then stabilizes at the value Geq, which may be different from Gnorm. The effect is illustrated by violet arrows, while its beginning is denoted by vertical violet dashed line.
1. Establishment of the normal glucose level by a single acupuncture treatment—lowering effect. This is described by the function F1 (t) (for details see Appendix A, Equations (A3)–(A6)), which defines the lowering of the glucose level over time from the elevated level Ghigh towards the normal level Gnorm. The function is illustrated in Figure 4a by the green line. The time of the acupuncture is denoted by tAP, and the time when the effect of the acupuncture starts to be measurable is ta. Thus, a delay in the body’s response to the acupuncture exists as was observed in the experiment, and that time is denoted by tdelay.
2. Raising the glucose level from the normal value back to the elevated value Ghigh after a single acupuncture treatment—rising effect. This function, named by F2 (t) is plotted by the red line in Figure 4a, and its details are given in Appendix A, Equations (A7)–(A10). The same delay time of the response (tdelay) is assumed as that for the F1.
The sum of these two effects is illustrated by the blue dash-dot line in Figure 4a, and corresponds to the oscillations of the glucose level observed in the experiment after each acupuncture treatment (Figure 1). The functions F1 and F2 are described by parameters Cdown and Cup, respectively, which determine the slope of lowering and rising. Simulations of the functions F1 and F2 using different values of the parameters Cdown and Cup are shown in Figure 4b–d. Clearly, the increase of the parameters Cdown and Cup causes the slower lowering and rising effects, respectively. These actually describe the level of the body response to the treatment. We additionally assume that the constants Cdown and Cup in functions F1 and F2 depend linearly on the number of the already applied treatments. This effect is described by the two constants a1 and a2 (Appendix A, Equations (A6) and (A10)). Thus, their values associated with BGL lowering and rising may change during the multiple acupuncture treatments.
The simulation of the BGL in a multiple acupuncture treatment using only functions F1 and F2 is shown in Figure 4e. Although the functions clearly describe the oscillations visible in the experiment, the glucose level always rises back to its initial value Ghigh after the acupuncture treatment. The overall lowering effect that is observed experimentally cannot be described using those functions alone. Therefore, a third function F3 is needed to obtain the complete description, as it is described in the following text.
3. Lowering the value of Ghigh over time towards a normal level Gnorm—overall lowering effect. This function describes the lowering of the maximal elevated sugar level after several acupuncture treatments. It was observed experimentally after the 10 and 4 acupuncture treatments in Figure 1a,b and Figure 2a,b, respectively. This actually represents the long-term effect of the acupuncture treatment. It is named F3 (t) and is shown in Figure 4f. This function is needed in addition to F1, because F2 always raises the glucose level back to the Ghigh value after the treatment is stopped. F3 is described by parameters Cslow and a3, defining the strength of the lowering effect. Formula and all details of F3 are given in the Appendix A Equations (A11)–(A13). In the simulation shown in Figure 4f, this function has no effect until the eighth acupuncture treatment (indicated by violet vertical dashed line). After that, the function slowly lowers the Ghigh value to some equilibrium level Geq at which it again stays constant. In an ideal case, Geq is equal to the Gnorm; however, this may be different depending on the specific case. This function has similar properties to fracture healing vs. time after the fracture [31]. The healing shows a nearly constant value several days after the fracture, then starts rising toward the completely healed bone, and then again has a constant value. The final function Gl (t) used for the simulations and for the fitting of the experimental data consists of all three of the functions F1–F3. The formula for this final function for the simulation of BGL, obtained after NA treatments is given in Appendix A, Equations (A14) and (A15).
3.3. Simulations and the Predictions of the Glucose Levels
The proposed model is used to simulate and predict the effects of acupuncture on BGL normalization. The simulations of the BGL during acupuncture, obtained using the model (Equation (A15) given in the Appendix A), and their main properties are shown in Figure 5. The simulations are performed for different times between two acupuncture treatments (acupuncture periods), assuming the same initial, high value of BGL Ghigh = 7.2 mmol/L. Figure 4a shows the simulated glucose levels as a function of time for three separations (periods) between the treatments, T1 = 7 days, T2 = 3 days and T3 = 1 day, and for one two-period separation (T4a = 2 days, T4b = 5 days). The last case means that the acupuncture was performed on the 2nd and 7th day each week.
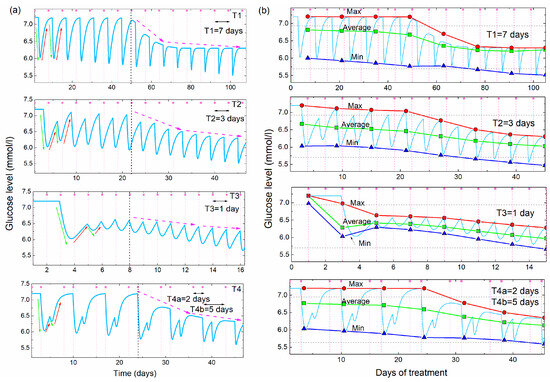
Figure 5.
(a) Simulations of the glucose level vs. time for four different frequencies of the acupuncture (T1 = 7days, T2 = 3 days, T3 = 1 day, T4 = 2 and 5 days, Cup = 3.3, Cdown = 0.7, Cslow = 14.0, tdelay = 3 days, iD = 8, a1 = a2 = 0, a3 = 1). Green and red arrows demonstrate the lowering and rising effects, while the violet dashed arrows show the overall lowering effect. (b) Maximal, average and minimal values of the BGL simulations shown in (a) as function of the days of the acupuncture treatment. The determination of the maximal and minimal glucose levels is performed over two acupuncture treatments (14 days for T1, 6 days for T2, 2 days for T3 and 7 days for T4). The horizontal dashed lines show the boundaries between normal, prediabetes and diabetes BGL values.
The first period (T1) is longer than the time needed for the glucose level to rise back to the initial Ghigh value, while the other two periods (T2 and T3) are shorter than that time. Therefore, the glucose level rises back to the initial value between two acupuncture treatments for the T1, while it stays lower for the T2 and T3. The fourth simulation in Figure 5a is calculated for two different separations between the treatments, as was the case in the experiment (shown in Figure 1), so it shows mixed behavior as will be explained.
All simulations show regular oscillatory behavior with periodic lowering and rising effects. However, the shape of the simulated curves depends strongly on the time between the two treatments. The simulation with a long time between the two treatments (T1) shows deep oscillations because the BGL rises back to the initial high value between the two treatments, which is not the case for the shorter period (T2 and T3). The unequally spaced treatments (T4) show the characteristically deep double-minima that occurs after the two closer treatments (separated by 2 days), followed by a rising of the BGL back to the initial high value after the longer acupuncture-free period (separated by 5 days), as was observed in the experiment shown in Figure 1.
All simulations assume a delay in the body’s response tdelay = 3 days. The other parameters describing body response (Cdown = 0.7, Cslow = 14.0), and their dependence on the number of already applied treatments (a1 = a2 = 0), and strength of the lowering effect (a3 = 1) are taken to be the same for all four simulations. The function F3 is assumed to lower Ghigh after the eighth (iD = 8) acupuncture treatment for all cases. This is clearly visible in the simulations from Figure 5a. The glucose level rises completely to its initial Ghigh value for the period T1. For the other two cases the next acupuncture occurs before the glucose levels raise back to the initial value, so the maximal glucose levels are smaller than the initial Ghigh value. The function F3 lowers their values as well after the eighth treatment, but its effect is not so obvious as for the T1.
The main properties of the different periods are more visible in Figure 5b, where the maximal, average and minimal values of the simulated glucose levels are shown. The simulated values are shown by the light blue line. The averaging and the determination of the maxima and minima are performed over the time of two acupuncture periods (14 days for T1, 6 days for T2, 2 days for T3 and 7 days for T4).
For the largest separation between the acupuncture (T1), the maximal value is constant and equal to Ghigh before the characteristic 8th treatment (indicated by the vertical black dashed line in Figure 5b), and lowers after it. Minimal and average values lower slowly before the 8th treatment and more rapidly after it, due to the effect of F3. For the other two equal periods (T2 and T1) the lowering effect is visible from the beginning of the treatment and increases with the decrease of the period between the treatments. This is expected because the time between the treatments is shorter than the time needed for the glucose level to rise to the Ghigh value, so each new treatment starts lowering from the smaller BGL maximal value. Therefore, the average value of the BGL is smaller for the shorter periods. The effect of F3 is not so obvious as for the case of T1, but the function F3 is still needed to fully describe the BGL normalization.
From this consideration it seems that the most efficient period of acupuncture treatments is the one that is shorter than the time in which the BGL raises back to the initial high value. That time is characteristic of the body’s response, and it differs for different people. Of course, each person reacts differently, so the real numbers of parameters used for the simulation should be introduced to the model to obtain a simulation for each particular case. These numbers of parameters can be estimated after several acupuncture treatments.
At the end we conclude that the simulations clearly describe all of the main experimentally observed features of the BGL during the multiple acupuncture treatments. First, the lowering and rising effects are clearly visible and their values depend on the time between the two treatments. If that time is short (such as a 2 day separation in the experiment) the glucose level stays low, while it raises back to the high value during the longer (5 day) acupuncture-free time. The delay in the response of the body is included in the model as was observed experimentally. Finally, the overall lowering effect which lowers the maximal values of the blood sugar towards the normal value is taken into account.
3.4. Analysis of the Measured Glucose Using the Proposed Model
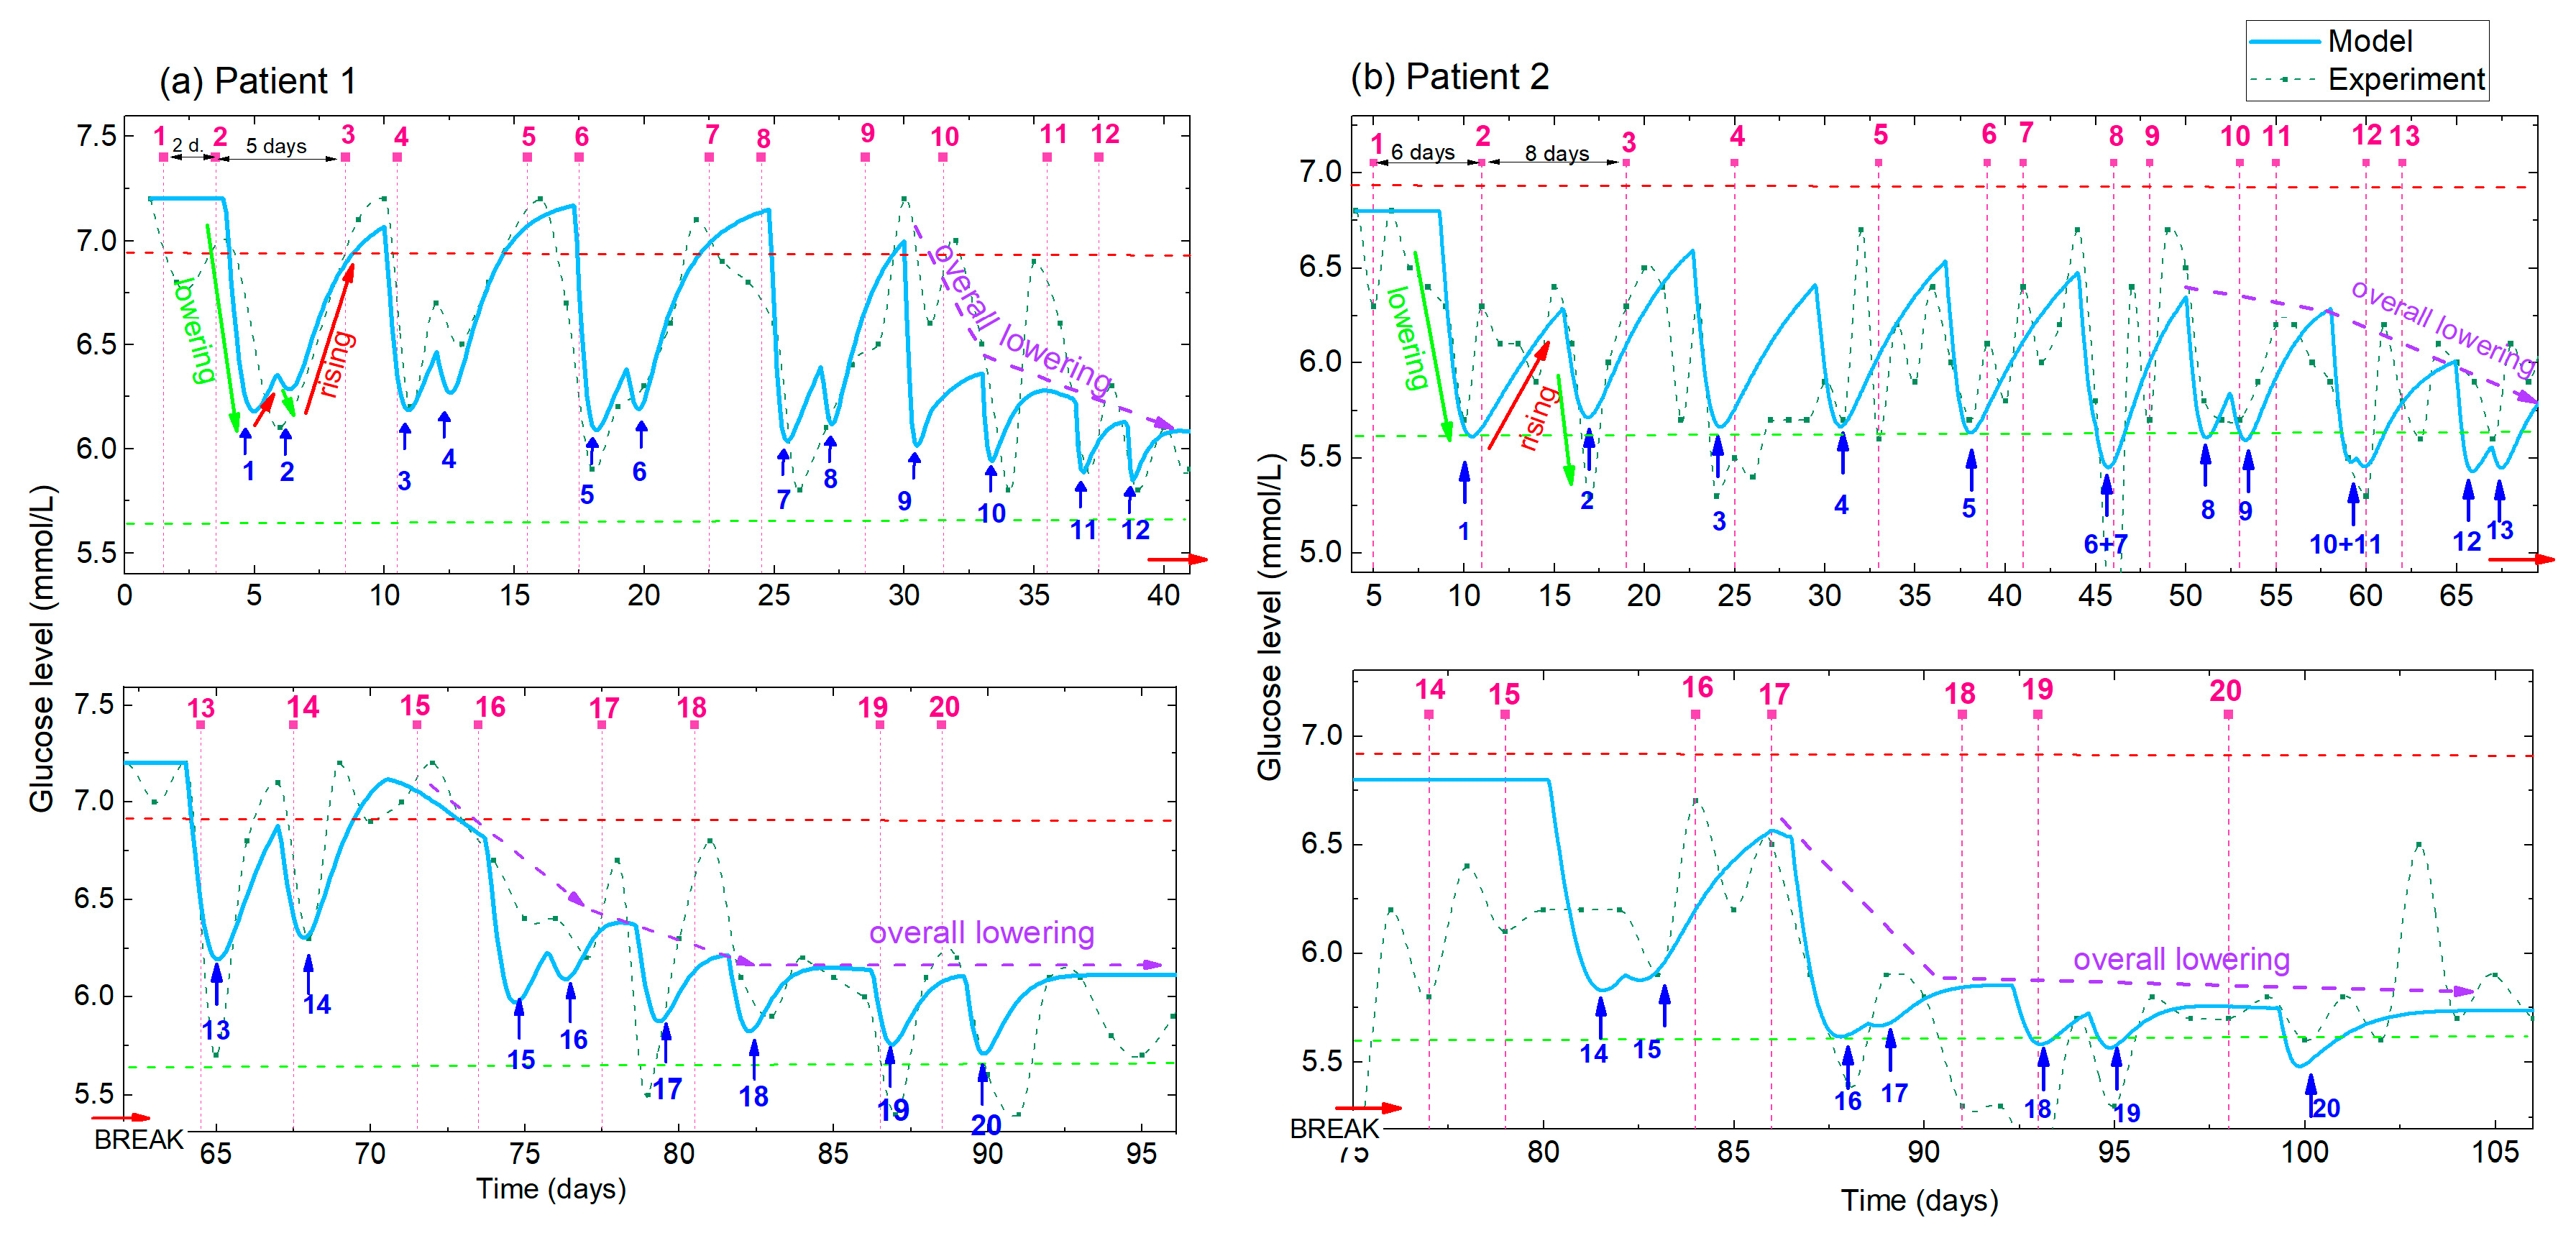
In this section we apply the above given model to the analysis of the measured BGL shown in Figure 1 (Patient 1), and to those measured under similar conditions for Patient 2. The experimentally measured data are fitted to the model and the best-fit parameters are determined. The experimental data and the best-fit simulated BGL curves for both patients are shown in Figure 6. The parameters of the model are determined to best fit the experimental data, using the function Gl (t), given in Appendix A, Equation (A15). The results of the fitting for Patient 1 and Patient 2 are shown in Figure 6a and 6b, respectively. The experimental data are shown by the green line and symbols while the fit is shown by the light-blue full line. First, we note that the acupuncture periods (the time between the treatments) for Patients 1 and 2 are slightly different for the first several treatments. Patient 1 has two close treatments (2 day separation) followed by a 5 day acupuncture-free period. The separations for Patient 2 are longer (6 and 8 days). This strongly affects the shape of the BGL curves, as well as the fitted curves. In the first case the curve shows deep double-peaks (similar to the simulation for T4 in Figure 4), while the oscillations for Patient 2 are more regular due to the similar and longer times between the treatments (similar to T1 in Figure 5).
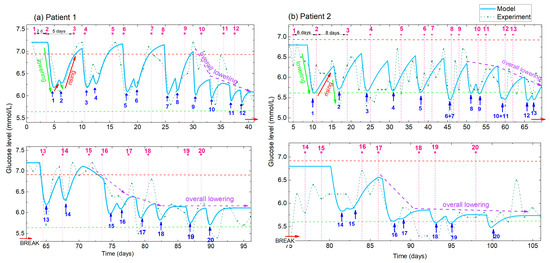
Figure 6.
(a,b) Measured and simulated BGL for Patient 1 and Patient 2, respectively. Experimental data (green line with symbol) and simulations obtained using the best-fit parameters (full light blue line). Pink numbers and vertical dashed lines indicate the order number of the applied treatment, while the blue numbers and arrows indicate the corresponding number of the BGL minima. Different times between the two treatments are applied for Patient 1 and Patient 2 (indicated for the first three treatments), resulting in different shapes of the BGL curves. The lowering, rising and overall lowering effects (indicated by green, red and violet arrows respectively) are clearly visible in both the experimental and modelled curves.
From the comparison of the experimental and model curves, we can see that the model curve well describes the experimental data. All of the main features (BGL lowering, rising and overall lowering) are visible in the fitted curves. They also well follow the shape of the oscillations caused by different times between the treatments. Patient 1 was very disciplined in the application of diet and exercise proposed for diabetics, so the measured BGL level is practically noise-free, especially before the break. Therefore, the experimental and the modelled curves are very similar. So, the BGL is mainly affected by the acupuncture, and not by improper eating or body activity. However, the measurements of Patient 2, and the measurements of Patient 1 after the break caused by COVID-19 contains additional ‘noise’ that originates from the non-ideal diet and exercise application, and from the recovery of the illness in the case of Patient 1. Of course, even in ideal conditions, the BGL oscillates slightly due to the normal body functions. Therefore, the data for Patient 2 are much noisier, causing larger differences between the experimental and the modelled curves. However, all of the main effects mentioned above are clearly visible for both patients.
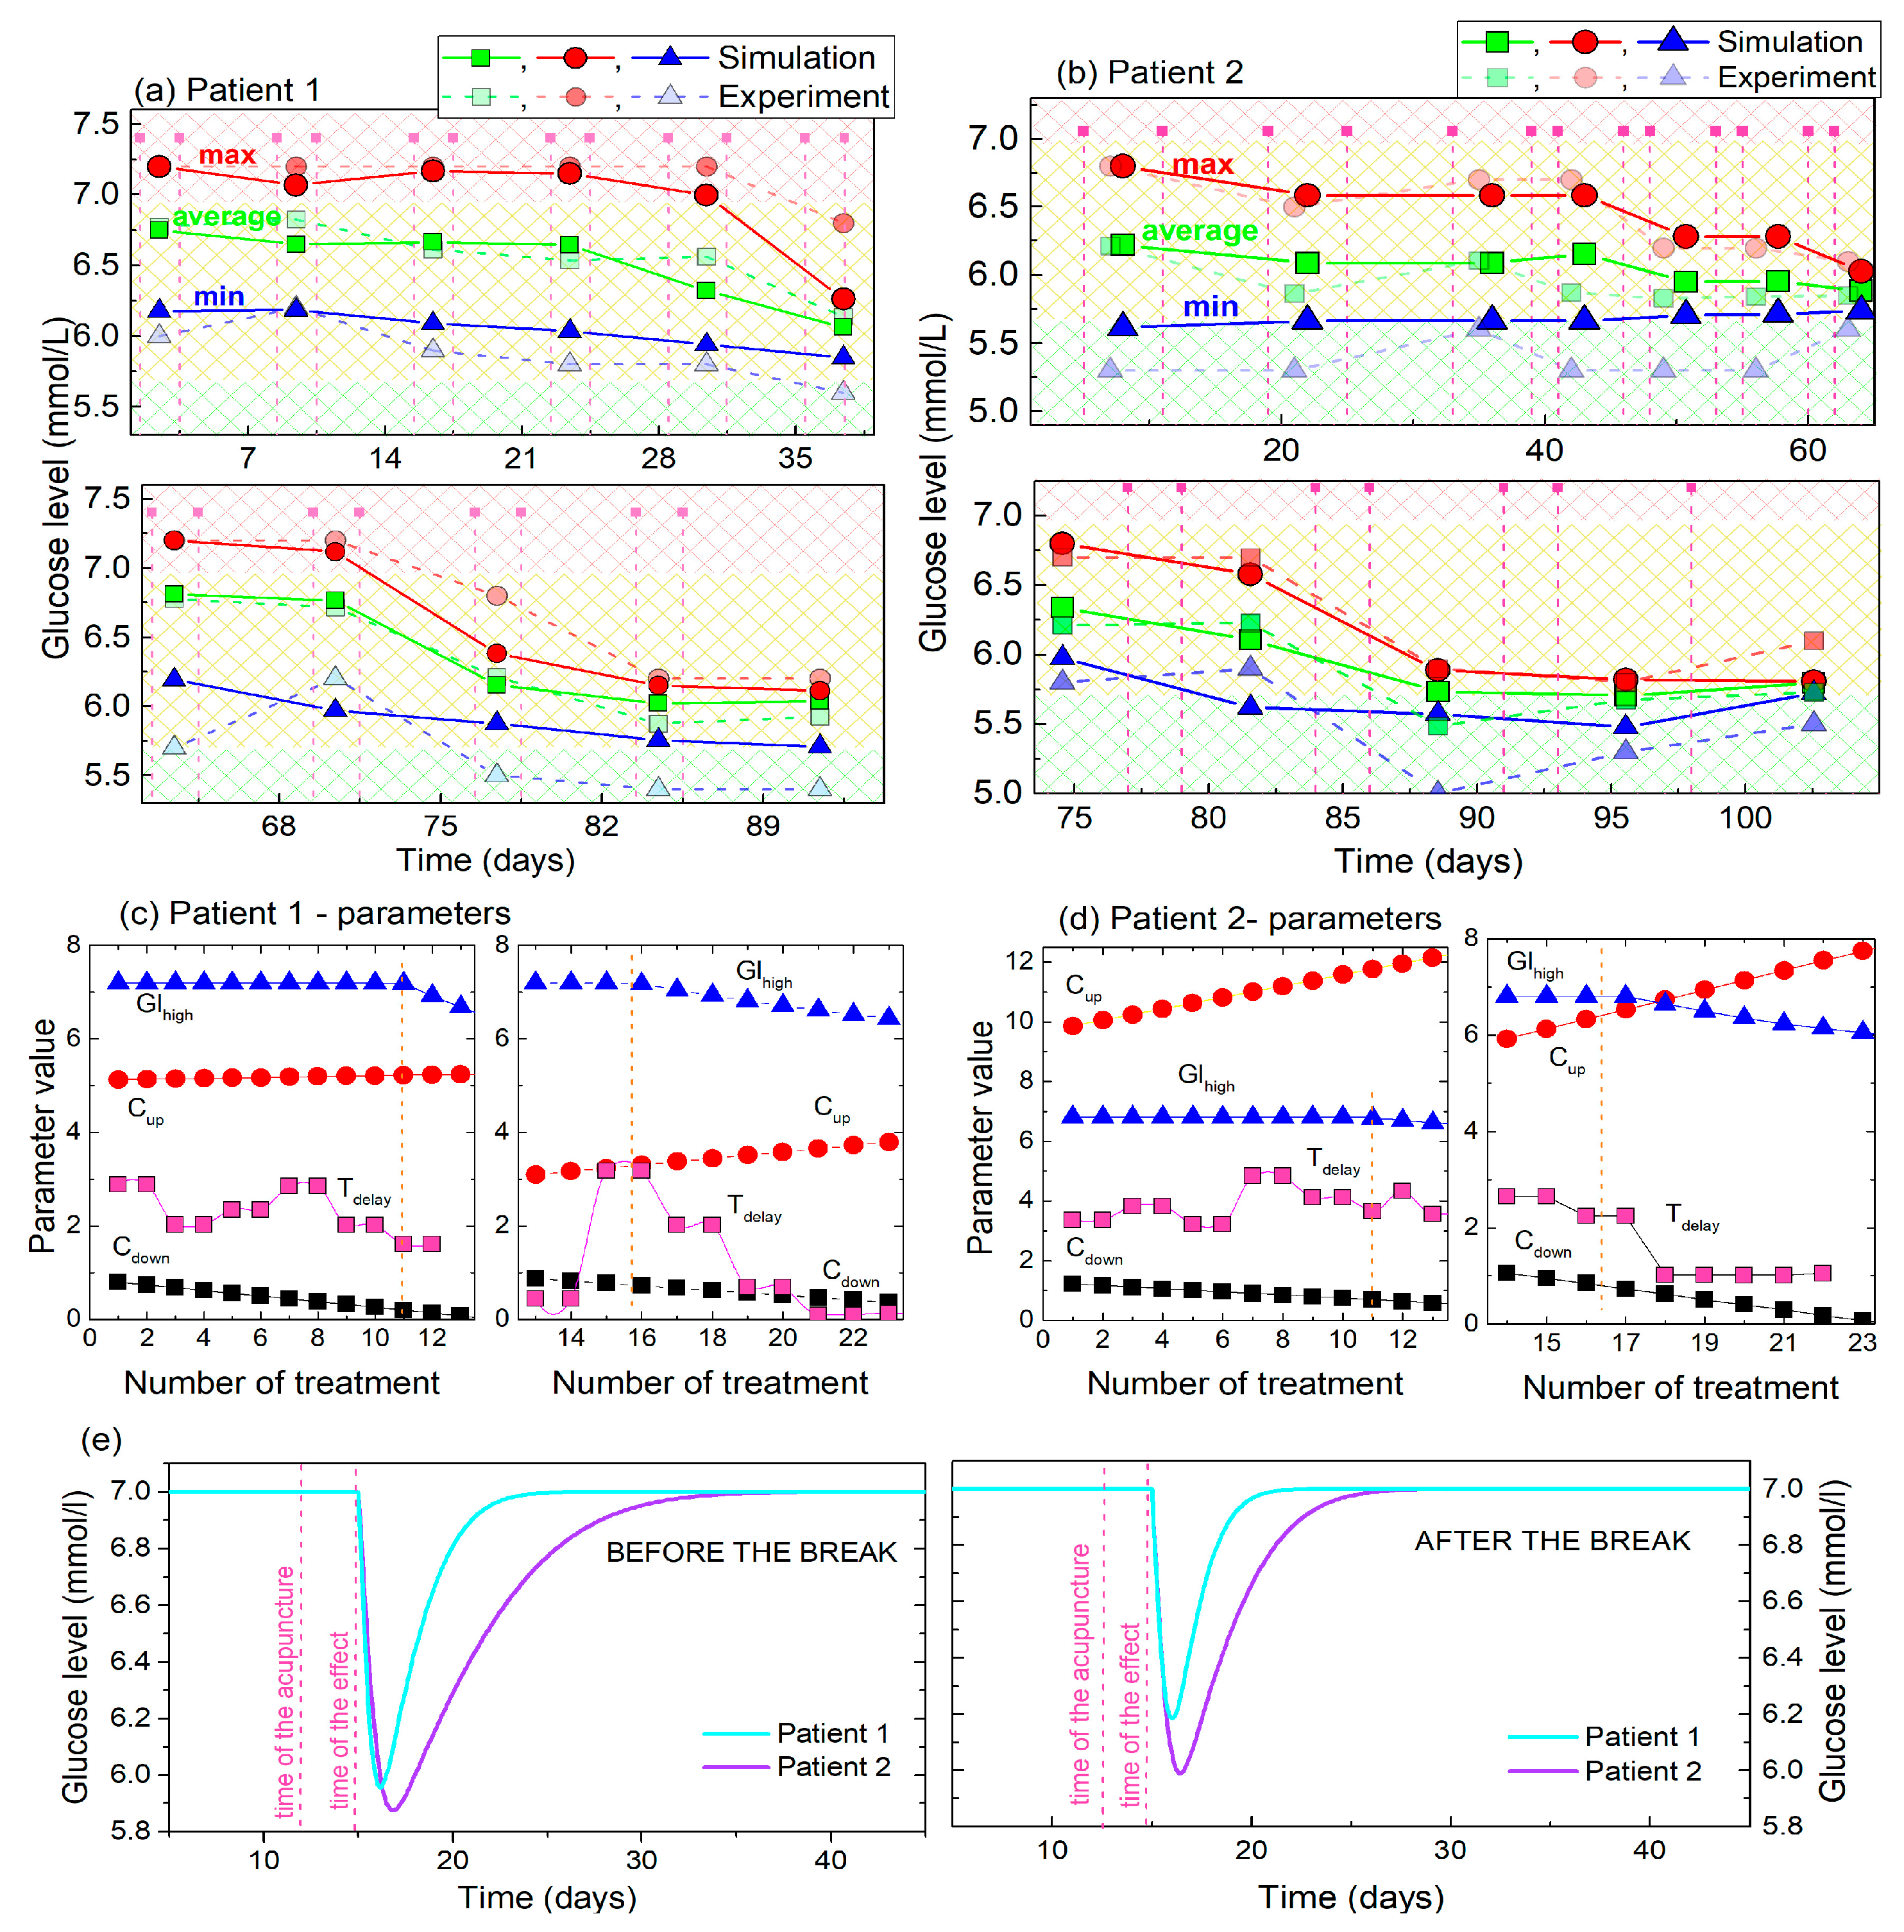
The main properties (maxima, average, minima) of the experimental and simulated BGL curves for Patients 1 and 2, as well as the parameters obtained by the fits are given in Figure 7. The maximal, minimal and average values for Patients 1 and 2 are compared in Figure 7a and b, respectively. It follows that the main properties of the simulated curves are very similar to the experimental curves, especially the maximal and average values, for both patients. The minima of the simulated curves are slightly higher than the experimental, probably due to the limitations of the functions used for the description. We intentionally use simple functions that can be easily used by non-experts. In addition, it is important to note that the maximal and minimal values are strongly affected by the random fluctuations of the experimentally measured BGL, while they are not included in the model. Therefore, for example, the last maximal value of the experimental curve deviates from the modelled one in Figure 7b. Interestingly, for both patients the overall lowering effects starts after the 10th treatment, and becomes obvious after the 14th treatment what will be discussed later in the text.
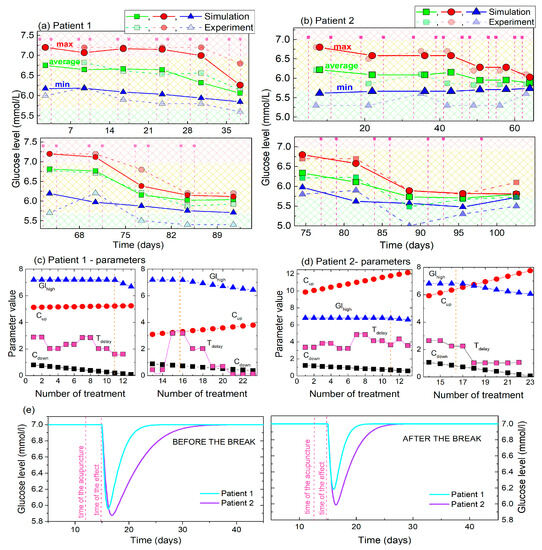
Figure 7.
(a,b) Maximal, minimal and average (main) values of the experimental BGL values and their simulations for Patient 1 and Patient 2. The values are determined for the time period of 2 acupuncture treatments. (c,d) The parameters obtained by fitting of the BGL curves of Patient 1 and Patient 2 to the model. (e) Body response to single acupuncture treatment calculated using the fitting parameters for Patient 1 and Patient 2. The initial values (i = 0) for the values of Cup and Cdown are taken for the simulation.
The parameters of the fits that describe the simulations, and their dependencies on the number of treatments are shown in Figure 7c,d for Patients 1 and 2 respectively. Four parameters are fitted: Ghigh, Cup, Cdown and tdelay. The value of the Ghigh (shown by the blue line and symbols) is constant until the 10th and 14th treatments in the first and second sets of the measurements, respectively, as was experimentally observed for both patients. It then lowers toward the normal BGL. The constant Cdown (black line and symbols) has smaller values than the Cup (red line and symbols), also for both patients, showing that the glucose level drops faster towards the normal level after each single treatment than it rises back to the high value. Another important feature of these two constants is that Cdown increases with the number of treatments, while Cup decreases, also for both patients. This shows that the glucose level lowering effect becomes faster with each new treatment, while its rising back to the high value becomes slower. Finally, we have determined that the time of the body response to the acupuncture is between 2 and 3 days for the first set of the acupuncture treatments. This shows similar values at the beginning of the second set of treatments, but drops toward a value of 1 after 8th treatment of the second set.
The main difference between the response of the two patients is the value of the constant Cup. However, this constant shows the same type of behavior as just described, with Patient 1 having significantly lower values (about two-times lower). Its influence on the BGL lowering and rising is shown in Figure 7e, where the effects of a single treatment of acupuncture on BGL are compared for Patients 1 and 2. Patient 1 shows significantly faster rising of the BGL after the acupuncture before and after the break, (i.e., the smaller values of the constants) than Patient 2. This effect may be attributed to the metformin, which is taken only by Patient 2, as will be discussed later.
In summary, the results of the BGL modelling show that both patients have very similar types of reaction to acupuncture. They both show similar effects of BGL lowering and rising, similar response time to acupuncture, and practically the same overall lowering of BGL after the 10th and 14th treatments. The main difference is the level of the body’s response which is slightly stronger for Patient 2, and the time of the BGL rising to the elevated (high) value, which is also longer for Patient 2.
4. Discussion
In this study we have compared and analyzed the time-dependence of morning BGL, measured after an overnight fasting, during multiple acupuncture treatments in type 2 diabetes mellitus in two diabetic patients and constructed a mathematical model to describe them. The BGL morning level during the three-month long treatment was analyzed, and it is shown that the BGL is highly affected by each single acupuncture treatment, and by the number of already applied treatments. It shows oscillatory-like behavior. The same effects of BGL dependence on single and multiple treatments were observed in both patients.
Thus, each single treatment lowers the BGL; however, the BGL rises back to the initial high value, making oscillations in the BGL dynamic curve. This happens until the approximately 10th treatment, after which an overall BGL lowering effect starts. Thus, the BGL is significantly reduced by repeated acupuncture, with no rises back to the high values, even without any additional medication. This BGL reduction was retained in the check performed a year after the acupuncture treatments. All of the parameters depend on the number of already applied acupuncture treatments.
Patient 1 and Patient 2 both achieved their glycemic target (average of 5.8 mmol/L and 5.9 mmol/L respectively) which is well below the proposed cut-off value of 7 mmol/L for fasting glucose level, representing the separation between the diagnosis prediabetes and diabetes [30].
The same effects of BGL dependence on single and multiple treatments were observed in both patients. The numeric values of the achieved glucose concentrations at the end of the study are very similar for both patients, despite their differences concerning the time and circumstances of the diagnosis, comorbidities, lifestyle and family history. What does differ is the prolonged time dependence in which the BGL lowers in relation to single and multiple acupuncture treatments in Patient 2. We believe that this time shift can be readily explained by the fact that Patient 2 is receiving pharmacological therapy with metformin in addition to acupuncture. Because obesity is one of the risk factors for T2DM, we believe that the fact that Patient 2 is overweight also changes the BGL dynamics. A further contributory factor might be that he is still recovering from the cholecystectomy he had two months prior to our study, which in itself represents a higher risk for metabolic syndrome and altered glucose homeostasis [32]. All three factors together are responsible for the somewhat more erratic appearance of the glucose lowering curve in Patient 2, however the overall effect of treatment in both patients is similar and comparable.
Since obesity posed an issue in our patients, special attention was paid to the weight progression in all participants. The BMI of all tested persons (Patient 1, 2 and Control 1, 2) did not change significantly during the acupuncture, and stayed at the same value during the next 12 months when the control BGL measurement is performed. We believe that this is because all of the major effects of the acupuncture are the same for both treated patients, although their lifestyle and diabetes drug intake differ. This increases the likelihood that the acupuncture is indeed the cause of BGL normalization.
The possible significance of this study is emphasized as it seems the impact of diabetes in global public healthcare is increasing from year to year. The increase in numbers of patients is largely due to the transgenerational global obesity pandemic [33], and the aging of the global population, which both increase the risk for T2DM. It is also known that T2DM plays a large role in increasing the risk for dementia and Alzheimer’s disease (AD) [34,35]. T2DM is strongly associated with AD, including at the genetic level [36], to the extent that some authors have begun to classify it as type 3 diabetes (T3DM) [35]. In AD, impaired insulin signaling [37], insulin resistance and disturbed intracellular glucose metabolism [38,39] have been detected in parts of the brain associated with cognition, resulting in defective intraneuronal glucose transport and thus strongly affecting brain metabolism and performances [40,41,42,43,44,45].
Diabetes is relevant in the light of the recent and ongoing SARS-CoV-2 pandemic, as it has been described among post COVID-19 sequelae, both in adult and pediatric population [46,47,48]. Patients with diabetes have an increased risk of developing severe COVID-19 and thus a higher possibility of complications and higher mortality, but it has further been demonstrated that SARS-CoV-2 can induce the onset of diabetes in previously healthy patients. How the pandemic will influence the prevalence of diabetic patients remains to be seen. The extent of the problem of global prevalence is growing when regarding the steady increase from an estimated 537 million adults (20–79 years) affected patients worldwide in year 2021, to a predicted 643 million by 2030 and 784 million by 2045, respectively, if no adequate intervention in prevention is undertaken [3].
Because acupuncture does not interfere with any other aspect of the treatment of diabetic patients, it generally has no irreversible contraindications and is safe, low-cost and can be targeted with relative temporal precision; thus, it holds the promise of providing a more powerful and selective way to influence glucose control than a conventional pharmacologic approach alone. We believe further research is needed in the establishment and evaluation of acupuncture’s role in the treatment of not only diabetes, but also other metabolic disorders, including Alzheimer’s disease and post COVID-19 complications in the adult and pediatric populations.
The presented results are important for a better understanding of acupuncture application in prediabetes and diabetes. The parameters obtained by modelling can be used for estimation of the efficiency of pharmacologic therapy and also of the reaction to acupuncture. Further analysis should be applied for investigation of overall BGL lowering effects and its dependence on other factors. The model can be applied generally to make predictions regarding the treatment of prediabetes and diabetes, for planning and optimizing the intervention in normalization of BGL by acupuncture and optimization of the acupuncture frequencies.
5. Conclusions
In summary, the dynamics of morning glucose level during the acupuncture treatment are presented and described by a predictive model. It is shown that the blood glucose level changes strongly due to acupuncture and that this depends on the number of the already performed acupuncture treatments. The glucose level lowers significantly with each acupuncture treatment; however, it raises back to the initial high value in the absence of the acupuncture for the first 10 treatments. After that critical treatment, the maximal (high) blood glucose level lowers, so the overall lowering effect is observed. Finally, this leads to the normalization of the body’s glucose level. A time delay of the body’s response to the acupuncture of 2–3 days is observed.
A mathematical model is provided to describe the observed dynamics of the blood glucose level during the acupuncture. The model is relatively simple, consisting of a function which is defined by five parameters. These parameters describe the properties of the glucose lowering and rising, the time of the body’s response to the acupuncture and the critical number of treatments needed to achieve the healing.
The measured blood glucose level is analyzed and modelled by this function. The model describes well all key features of the measured glucose level dynamics. It provides personal parameters that describe the blood glucose level regulation by acupuncture. In addition, the model is used to simulate the glucose level regulation by acupuncture performed with different frequencies.
The presented results are important for a better understanding of the effects of acupuncture on diabetes treatment and for the prediction of blood glucose levels during the acupuncture treatment. More generally, the results are important for diabetes treatment with minimal or no drugs and for its prevention. Although the results obtained are very promising for the treatment of T2DM in general, bigger studies are generally needed before making some general conclusions. Future research should also be focused on the underlying mechanism of the treatment of diabetes with acupuncture, including changes in the functionality of individual organs that are important for the regulation of blood glucose level.
Author Contributions
M.Š., M.J.M. and M.M. designed the experiment. M.M. performed data analysis and mathematical modelling. M.Š. and M.J.M. wrote all of the medicine-related parts of the text. All authors have read and agreed to the published version of the manuscript.
Funding
This research was funded by the Croatian Science Foundation (No. IP-2018-01-3633) and the Center of Excellence for Advanced Materials and Sensing Devices (Grant KK.01.1.1.01.0001).
Institutional Review Board Statement
The study was conducted in accordance with the Declaration of Helsinki, and approved by the Institutional Review Board (or Ethics Committee) of University Hospital Center Zagreb, and the Bioethical committee of the Ruđer Bošković Institute (Approval numbers 02/013 AG and BEP-3967/2-2022.lu, respectively).
Informed Consent Statement
Informed consent was obtained from all subjects involved in the study.
Data Availability Statement
Mičetić, Maja (2022), “Time Evolution of Fasting Blood Glucose Level During Multiple Acupuncture Treatments in Type 2 Diabetes Mellitus: Experiment and Modelling”, Mendeley Data, V1, https://doi.org/10.17632/g7r7jrrdfs.1 (accessed on 20 June 2023).
Acknowledgments
The authors acknowledge Ranko Stojković for help in document preparation and all volunteers that participated in the research.
Conflicts of Interest
The authors declare no conflict of interest.
Appendix A. Functions for Description of BGL Time Evolution during the Multiple Acupuncture Treatment
The time evolution of BGL is described by three main functions, F1–F3. The first two (F1, F2) describe the effect of a single acupuncture treatment on BGL (short-time effect), while F3 describes the time evolution of overall (initially elevated) glucose level (long-time effect). All functions are chosen to have simple formulas that can be easily used by non-experts.
The function that describes the BGL time (t) evolution is denoted by Gl (t). The total number of applied acupuncture treatments is denoted by NA. Gl has a constant value equal to the elevated BGL named Ghigh, before the first treatment (i = 0), where i is the number of the acupuncture treatment, as given in Equation (A1).
The time (ta(i)) when the ith acupuncture treatment starts to produce an effect on Gl (t) is given by:
where tAP(i) is the day of the ith treatment, and tdelay(i) is the time of the effect of the ith treatment delay.
- BGL lowering effect:
BGL lowering effect in time is described by the follows:
where t denotes the time (in days), Cdown(i) is the parameter that describes the function drop for the ith acupuncture treatment. This linearly depends on the number of the already applied treatments as given by Equation (A6), where a1 is the parameter describing its dependence on the number of the applied treatments. The parameter defining the normal BGL is named Gnorm. The multiplication is indicated by × sign to avoid confusion with functions.
- 2.
- BGL rising effect:
BGL rising effect is described by a very similar function as its lowering, but with different signs and constants.
where is the parameter that describes the function rise for the ith acupuncture treatment. This depends on the number of the already applied treatments (i) as given by Equation (A10), with the constant a2.
- 3.
- Overall BGL lowering effect:
The overall lowering of BGL by multiple acupuncture treatment (F3) is described by the following equations:
where tD is the day of the acupuncture treatment (iDth) after which the overall BGL starts to reduce (iD ≤ NA), and Cslow defines the slope of the overall BGL drop (slower or faster drop), and a3 is the constant that describes the value of the final BGL decrease towards a normal BGL.
To obtain the BGL time evolution for NA acupuncture treatments we apply the following procedure for each acupuncture treatment (i = 1 … NA):
References
- DeFronzo, R.A. Lilly lecture 1987. The triumvirate: Beta-cell, muscle, liver. A collusion responsible for NIDDM. Diabetes 1988, 37, 667–687. [Google Scholar] [CrossRef] [PubMed]
- World Health Organization [Homepage on the Internet]. Updated 9 December 2020. The Top 10 Causes of Death. Available online: https://www.who.int/news-room/fact-sheets/detail/the-top-10-causes-of-death (accessed on 20 June 2023).
- Sun, H.; Saeedi, P.; Karuranga, S.; Pinkepank, M.; Ogurtsova, K.; Duncan, B.B.; Stein, C.; Basit, A.; Chan, J.C.; Mbanya, J.C.; et al. IDF Diabetes Atlas: Global, regional and country-level diabetes prevalence estimates for 2021 and projections for 2045. Diabetes Res. Clin. Pract. 2022, 183, 109119. [Google Scholar] [CrossRef] [PubMed]
- Riddle, M.C.; Herman, W.H. The cost of diabetes care—An elephant in the room. Diabetes Care 2018, 41, 929–932. [Google Scholar] [CrossRef] [PubMed]
- Guo, Y.; Xing, M.; Sun, W.; Yuan, X.; Dai, H.; Ding, H. Plasma Nesfatin-1 Level in Obese Patients after Acupuncture: A Randomised Controlled Trial. Acupunct. Med. 2014, 32, 313–317. [Google Scholar] [CrossRef] [PubMed]
- Belivani, M.; Lundeberg, T.; Cummings, M.; Dimitroula, C.; Belivani, N.; Vasilakos, D.; Hatzitolios, A. Immediate Effect of Three Different Electroacupuncture Protocols on Fasting Blood Glucose in Obese Patients: A Pilot Study. Acupunct. Med. 2015, 33, 110–114. [Google Scholar] [CrossRef]
- Yin, J.; Kuang, J.; Chandalia, M.; Tuvdendorj, D.; Tumurbaatar, B.; Abate, N.; Chen, J.D.Z. Hypoglycemic effects and mechanisms of electroacupuncture on insulin resistance. Am. J. Physiol. Regul. Integr. Comp. Physiol. 2014, 307, R332–R339. [Google Scholar] [CrossRef]
- Tomina, A.; Ishizaki, N.; Naruse, Y.; Kitakoji, H.; Yamamura, Y. Repeated application of low-frequency electroacupuncture improves high-fructose diet-induced insulin resistance in rats. Acupunct. Med. 2011, 29, 276–283. [Google Scholar] [CrossRef]
- Yu, Z.; Xia, Y.; Ju, C.; Mao, Z.; Gu, Y.; Xu, B. Electroacupuncture regulates glucose-inhibited neurons in treatment of simple obesity. Neural Regen. Res. 2013, 8, 809–816. [Google Scholar]
- Tzeng, C.Y.; Lee, Y.C.; Ho, T.Y.; Chen, Y.I.; Hsu, T.H.; Lin, J.G.; Lee, K.R.; Chang, S.L. Intracellular signalling pathways associated with the glucose-lowering effect of ST36 electroacupuncture in streptozotocin-induced diabetic rats. Acupunct. Med. 2015, 33, 395–399. [Google Scholar] [CrossRef]
- Lee, Y.C.; Li, T.M.; Tzeng, C.Y.; Cheng, Y.W.; Chen, Y.I.; Ho, W.J.; Lin, J.G.; Chang, S.L. Electroacupuncture-induced cholinergic nerve activation enhances the hypoglycemic effect of exogenous insulin in a rat model of streptozotocin-induced diabetes. Exp. Diabetes Res. 2011, 2011, 947138. [Google Scholar] [CrossRef]
- Lin, R.T.; Tzeng, C.Y.; Lee, Y.C.; Ho, W.J.; Cheng, J.T.; Lin, J.G.; Chang, S.L. Acute effect of electroacupuncture at the Zusanli acupoints on decreasing insulin resistance as shown by lowering plasma free fatty acid levels in steroid-background male rats. BMC Complement. Altern. Med. 2009, 9, 26. [Google Scholar] [CrossRef]
- Liao, H.Y.; Sun, M.F.; Lin, J.G.; Chang, S.L.; Lee, Y.C. Electroacupuncture plus metformin lowers glucose levels and facilitates insulin sensitivity by activating MAPK in steroid-induced insulin-resistant rats. Acupunct. Med. 2015, 33, 388–394. [Google Scholar] [CrossRef] [PubMed]
- Benrick, A.; Maliqueo, M.; Johansson, J.; Sun, M.; Wu, X.; Mannerås-Holm, L.; Stener-Victorin, E. Enhanced insulin sensitivity and acute regulation of metabolic genes and signaling pathways after a single electrical or manual acupuncture session in female insulin-resistant rats. Acta Diabetol. 2014, 51, 963–972. [Google Scholar] [CrossRef] [PubMed]
- Peplow, P.V. Electroacupuncture treatment of insulin resistance in diabetes mellitus. Acupunct. Med. 2015, 33, 347–349. [Google Scholar] [CrossRef] [PubMed]
- Liang, F.; Koya, D. Acupuncture: Is it effective for treatment of insulin resistance? Diabetes Obes. Metab. 2010, 12, 555–569. [Google Scholar] [CrossRef] [PubMed]
- Xu, J.; Chen, L.; Tang, L.; Chang, L.; Liu, S.; Tan, J.; Chen, Y.; Ren, Y.; Liang, F.; Cui, J. Electroacupuncture inhibits weight gain in diet-induced obese rats by activating hypothalamic LKB1-AMPK signaling. BMC Complement. Altern. Med. 2015, 15, 147. [Google Scholar] [CrossRef] [PubMed]
- Liang, F.; Chen, R.; Nakagawa, A.; Nishizawa, M.; Tsuda, S.; Wang, H.; Koya, D. Low-frequency electroacupuncture improves insulin sensitivity in obese diabetic mice through activation of SIRT1/PGC-1α in skeletal muscle. Evid. Based Complement. Altern. Med. 2011, 2011, 735297. [Google Scholar] [CrossRef]
- Firouzjaei, A.; Li, G.C.; Wang, N.; Liu, W.X.; Zhu, B.M. Comparative evaluation of the therapeutic effect of metformin monotherapy with metformin and acupuncture combined therapy on weight loss and insulin sensitivity in diabetic patients. Nutr. Diabetes 2016, 6, e209. [Google Scholar] [CrossRef]
- Ma, F.Q.; Sun, C.J.; Wei, J.J.; Wang, Y.D.; Shen, J.C.; Chang, J.J. Electro-acupuncture regulates glucose metabolism in chronic stress model rats. Sci. Rep. 2020, 10, 11281. [Google Scholar] [CrossRef]
- Martinez, B.; Peplow, P.V. Treatment of insulin resistance by acupuncture: A review of human and animal studies. Acupunct. Med. 2016, 34, 310–319. [Google Scholar] [CrossRef]
- Choate, C.J. Modern Medicine and Traditional Chinese Medicine: Diabetes Mellitus, Part two. J. Chin. Med. 1999, 59, 1. [Google Scholar]
- Zhang, H.; Han, G.; Litscher, G. Traditional Acupuncture Meets Modern Nanotechnology: Opportunities and Perspectives. Evid. Based Complement. Altern. Med. 2019, 2019, 2146167. [Google Scholar] [CrossRef] [PubMed]
- World Health Organization. Acupuncture: Review and Analysis of Reports on Controlled Clinical Trials; World Health Organization: Geneva, Switzerland, 2002. [Google Scholar]
- López-Palau, N.E.; Olais-Govea, J.M. Mathematical model of blood glucose dynamics by emulating the pathophysiology of glucose metabolism in type 2 diabetes mellitus. Sci. Rep. 2020, 10, 12697. [Google Scholar] [CrossRef] [PubMed]
- Vasquez-Muñoz, M.; Arce-Alvarez, A.; von Igel, M.; Veliz, C.; Ruiz-Esquide, G.; Ramirez-Campillo, R.; Alvarez, C.; Ramirez-Velez, R.; Crespo, F.A.; Izquierdo, M.; et al. Oscillatory pattern of glycemic control in patients with diabetes mellitus. Sci. Rep. 2021, 11, 5789. [Google Scholar] [CrossRef] [PubMed]
- Cedersund, G.; Strålfors, P. Putting the pieces together in diabetes research: Towards a hierarchical model of whole-body glucose homeostasis. Eur. J. Pharm. Sci. 2009, 36, 91–104. [Google Scholar] [CrossRef]
- Seo, W.; Park, S.W.; Kim, N.; Jin, S.M.; Park, S.M. A personalized blood glucose level prediction model with a fine-tuning strategy: A proof-of-concept study. Comput. Methods Programs Biomed. 2021, 211, 106424. [Google Scholar] [CrossRef]
- Chou, C.-Y.; Hsu, D.-Y.; Chou, C.-H. Predicting the Onset of Diabetes with Machine Learning Methods. J. Pers. Med. 2023, 13, 406. [Google Scholar] [CrossRef]
- World Health Organization [Homepage on the Internet]. Updated 10 July 2023. Mean Fasting Blood Glucose. Available online: https://www.who.int/data/gho/indicator-metadata-registry/imr-details/2380 (accessed on 20 June 2023).
- Cosman, F.; Lindsay, R. Chapter 85—Parathyroid Hormone Treatment for Osteoporosis, In Osteoporosis, 4th ed.; Marcus, R., Feldman, D., Dempster, D.W., Luckey, M., Cauley, J.A., Eds.; Academic Press: Cambridge, MA, USA, 2013; pp. 1949–1961. ISBN 9780124158535. [Google Scholar]
- Chen, Y.; Wu, S.; Tian, Y. Cholecystectomy as a risk factor of metabolic syndrome: From epidemiologic clues to biochemical mechanisms. Lab. Investig. 2018, 98, 7–14. [Google Scholar] [CrossRef]
- Oestreich, A.K.; Moley, K.H. Developmental and Transmittable Origins of Obesity-Associated Health Disorders. Trends Genet. 2017, 33, 399–407. [Google Scholar] [CrossRef]
- Rivera, E.J.; Goldin, A.; Fulmer, N.; Tavares, R.; Wands, J.R.; de la Monte, S.M. Insulin and insulin-like growth factor expression and function deteriorate with progression of Alzheimer’s disease: Link to brain reductions in acetylcholine. J. Alzheimer’s Dis. 2005, 8, 247–268. [Google Scholar] [CrossRef]
- Gudala, K.; Bansal, D.; Schifano, F.; Bhansali, A. Diabetes mellitus and risk of dementia: A meta-analysis of prospective observational studies. J. Diabetes Investig. 2013, 4, 640–650. [Google Scholar] [CrossRef] [PubMed]
- Hu, Z.; Jiao, R.; Wang, P.; Zhu, Y.; Zhao, J.; De Jager, P.; Bennett, D.A.; Jin, L.; Xiong, M. Shared Causal Paths underlying Alzheimer’s dementia and Type 2 Diabetes. Sci. Rep. 2020, 10, 4107. [Google Scholar] [CrossRef] [PubMed]
- Moloney, A.M.; Griffin, R.J.; Timmons, S.; O’Connor, R.; Ravid, R.; O’Neill, C. Defects in IGF-1 receptor, insulin receptor and IRS-1/2 in Alzheimer’s disease indicate possible resistance to IGF-1 and insulin signalling. Neurobiol. Aging 2010, 31, 224–243. [Google Scholar] [CrossRef] [PubMed]
- Steen, E.; Terry, B.M.; Rivera, E.J.; Cannon, J.L.; Neely, T.R.; Tavares, R.; Xu, X.J.; Wands, J.R.; de La Monte, S.M. Impaired insulin and insulin-like growth factor expression and signaling mechanisms in Alzheimer’s disease-is this type 3 diabetes? J. Alzheimer’s Dis. 2005, 7, 63–80. [Google Scholar] [CrossRef]
- Hoyer, S.; Nitsch, R. Cerebral excess release of neurotransmitter amino acids subsequent to reduced cerebral glucose metabolism in early-onset dementia of Alzheimer type. J. Neural Transm. 1989, 75, 227–232. [Google Scholar] [CrossRef]
- Talbot, K.; Wang, H.Y.; Kazi, H.; Han, L.Y.; Bakshi, K.P.; Stucky, A.; Fuino, R.L.; Kawaguchi, K.R.; Samoyedny, A.J.; Wilson, R.S.; et al. Demonstrated brain insulin resistance in Alzheimer’s disease patients is associated with IGF-1 resistance, IRS-1 dysregulation, and cognitive decline. J. Clin. Investig. 2012, 122, 1316–1338. [Google Scholar] [CrossRef]
- Correia, S.C.; Santos, R.X.; Carvalho, C.; Cardoso, S.; Candeias, E.; Santos, M.S.; Oliveira, C.R.; Moreira, P.I. Insulin signaling, glucose metabolism and mitochondria: Major players in Alzheimer’s disease and diabetes interrelation. Brain Res. 2012, 1441, 64–78. [Google Scholar] [CrossRef]
- Nguyen, T.T.; Ta, Q.T.H.; Nguyen, T.K.O.; Nguyen, T.T.D.; Giau, V.V. Type 3 Diabetes and Its Role Implications in Alzheimer’s Disease. Int. J. Mol. Sci. 2020, 21, 3165. [Google Scholar] [CrossRef]
- Baker, L.D.; Cross, D.J.; Minoshima, S.; Belongia, D.; Watson, G.S.; Craft, S. Insulin resistance and Alzheimer-like reductions in regional cerebral glucose metabolism for cognitively normal adults with prediabetes or early type 2 diabetes. Arch. Neurol. 2011, 68, 51–57. [Google Scholar] [CrossRef]
- Samuraki, M.; Matsunari, I.; Chen, W.P.; Yajima, K.; Yanase, D.; Fujikawa, A.; Takeda, N.; Nishimura, S.; Matsuda, H.; Yamada, M. Partial volume effect-corrected FDG PET and grey matter volume loss in patients with mild Alzheimer’s disease. Eur. J. Nucl. Med. Mol. Imaging 2007, 34, 1658–1669. [Google Scholar] [CrossRef]
- Dukart, J.; Kherif, F.; Mueller, K.; Adaszewski, S.; Schroeter, M.L.; Frackowiak, R.S.; Draganski, B.; Alzheimer’s Disease Neuroimaging Initiative. Generative FDG-PET and MRI model of aging and disease progression in Alzheimer’s disease. PLoS Comput. Biol. 2013, 9, e1002987. [Google Scholar] [CrossRef] [PubMed]
- Barrett, C.E.; Koyama, A.K.; Alvarez, P.; Chow, W.; Lundeen, E.A.; Perrine, C.G.; Pavkov, M.E.; Rolka, D.B.; Wiltz, J.L.; Bull-Otterson, L.; et al. Risk for Newly Diagnosed Diabetes >30 Days After SARS-CoV-2 Infection Among Persons Aged <18 Years—United States, 1 March 2020-28 June 2021. MMWR Morb. Mortal. Wkly. Rep. 2022, 71, 59–65. [Google Scholar] [PubMed]
- Al-Aly, Z.; Xie, Y.; Bowe, B. High-dimensional characterization of post-acute sequelae of COVID-19. Nature 2021, 594, 259–264. [Google Scholar] [CrossRef] [PubMed]
- Ayoubkhani, D.; Khunti, K.; Nafilyan, V.; Maddox, T.; Humberstone, B.; Diamond, I.; Banerjee, A. Post-COVID syndrome in individuals admitted to hospital with COVID-19: Retrospective cohort study. BMJ 2021, 372, 693. [Google Scholar] [CrossRef]
Disclaimer/Publisher’s Note: The statements, opinions and data contained in all publications are solely those of the individual author(s) and contributor(s) and not of MDPI and/or the editor(s). MDPI and/or the editor(s) disclaim responsibility for any injury to people or property resulting from any ideas, methods, instructions or products referred to in the content. |
© 2023 by the authors. Licensee MDPI, Basel, Switzerland. This article is an open access article distributed under the terms and conditions of the Creative Commons Attribution (CC BY) license (https://creativecommons.org/licenses/by/4.0/).

