
Progress in Life Cycle Impact Assessment: Water Vapor Emissions and Respiratory Inorganics


Looking Ahead Science, 17160 Solna, Sweden
Sci 2021, 3(3), 33; https://doi.org/10.3390/sci3030033
Submission received: 27 June 2021
/
Revised: 28 July 2021
/
Accepted: 4 August 2021
/
Published: 12 August 2021
(This article belongs to the Special Issue Feature Papers 2021 Editors Collection)
Abstract
:Life cycle assessment (LCA) is being included formally in EcoDesign regulations. Especially product carbon footprint will be mandatory in Europe. However, life cycle impact assessment, including global warming potential (GWP) in LCA, is hampered by several challenges. One of these is a lack of water vapor characterization indexes for GWP. A life cycle inventory profile for air transport fuel, including water vapor emissions, is evaluated with state-of-the-art practice, i.e., Environmental Footprint (EF) Method and International Life Cycle Data (ILCD) 2011 Mid-point+, neglecting water vapor’s high altitude GWP compared to carbon dioxide. Then, the characterization factor in GWP over 100 years (GWP100) for water vapor and alternate normalization for particulates are introduced. The results are compared. The main findings are that the previous EF method and ILCD both generate rather realistic results for Particulate Matter and Respiratory Inorganics mid-point indicators, respectively, but the number of premature deaths should be better allocated to different specific emissions, and that water vapor may dominate the GWP100 result over the usual carbon dioxide. Respiratory inorganics may need one impact category, each starting with particles smaller than 2.5 µm. LCIA mid-points need measurable and understandable bases. The common knowledge of water vapor’s GWP100 should not be neglected in LCIA for air transport and beyond where relevant.
1. Introduction
Life cycle assessment (LCA) has turned out to be a preferred tool to measure, especially product sustainability progress [1]. LCA is being included formally in EcoDesign regulations. Especially product carbon footprint will be mandatory in Europe. However, the sustainability assessment is rather scattered, and no uniform accepted metric exists. Even the rather straightforward mid-point categories have methodological and measurement problems. In truth, ensuring repeated measurement is one of the largest problems. It is important to agree on how repeatability and accountability can be achieved for all mainstream impact mid-point categories such as climate change and Particulate Matter/Respiratory Inorganics. These are allegedly two of the most robust of all mid-point categories. This is why the present research is important. The main purpose is to improve the climate change mid-point category, Global Warming Potential over 100 years (GWP100) mid-point indicator, by adding a relative characterization index for water vapor. Further, the characterization and normalization procedures for the Respiratory Inorganics mid-point impact category used in the Environmental Footprint (EF) Method [2] (p. 208) are discussed in comparison to the Particulate Matter impact category of International Life Cycle Data (ILCD) 2011 Mid-point+ [3].
For particulate matter, ILCD attempts to quantify the impact that premature death and disability—caused by Particulate Matter and respiratory inorganics—have on the global population in comparison to Particulate Matter of size less than 2.5 µm (PM2.5) [4]. The normalization is done per emitted PM2.5 and not per “total” emitted Particulate Matter and Respiratory Inorganics. The EF method estimates the number of disease incidents per kg of similar Particulate Matter and Respiratory Inorganics as ILCD [5]. The normalization is done per global disease incidents caused by Particulate Matter and Respiratory Inorganics. The normalization does not include the latest data for disease incidents.
Water vapor is a very common emission—e.g., from air conditioning, airplanes, irrigation and volcanos—and its characterization factors compared to carbon dioxide are known rather well (0.001 at Earth Surface [6] but are around four times higher than carbon dioxide [7] (p. 2 Figure 1) in the atmosphere). Moreover, stratospheric and tropospheric water vapor effects have been recognized earlier [8]. Still, characterization factors for water vapor in GWP indicators are not used so far. This is similar to nitrous oxide, which is excluded from the mid-point ozone depletion practice in both [2] and [3], despite that it has a known characterization factor [9]. The conflicting hypotheses in the present research are to which degree water vapor should and could be included in the GWP100 indicator—especially for evaluation of aircraft operation stage—and what are reliable ways to characterize PM2.5 (Particulate Matter <2.5 µm) equivalents or single Respiratory Inorganic emissions at the mid-point. This research will show the effect of adding 4 kg CO2-equivalents/kg water vapor to emissions from airplanes. The differences between Particulate Matter [3] and Respiratory Inorganics [2] indicator results with alternate normalization factors per person for ILCD [3] are also investigated. The present normalization methods for Particulate Matter in ILCD and Respiratory Inorganics in EF both give reasonable results for particulate emissions compared to other impact categories. However, the new GWP100-index for water vapor is suggesting that it is an important greenhouse gas to be considered in LCA, at least for airplanes. Water vapor emissions dominate carbon dioxide for airplane greenhouse gases.
2. Materials and Methods
The hypothesis in this research is: including anthropogenic water vapor characterization factor gives new perspectives in global warming potential (GWP) indicator evaluations wherever water vapor is emitted. The research concerns the LCA elements characterization factors [10] (p. 32, Equation (3)) normalization [10] (p. 33, Equation (5)) and weighting [10] (p. 33, Equation (6)), for Particulate Matter and climate change.
Global emissions of air pollutants black carbon, carbon monoxide, nitrogen oxides, sulfur oxide, organic carbon, PM10 and PM2.5, all belonging to Particulate Matter in ILCD [3], were around 944 billion kg in 2015 [11]. As a baseline, ILCD uses the value for just global emissions of PM2.5 to arrive at the global normalization factor per person. Here is proposed to use the sum of “all” air pollutants instead, similar to the sum of all global greenhouse gas emissions used for person normalization for climate change, 57,400 billion kg.
The relative contributions to the present-day global greenhouse effect are water vapor 50%, clouds 25% and carbon dioxide 20% [12].
The characterization factor for the GWP100 indicator for water vapor emitted near the earth’s surface is assumed to be 0.001 kg CO2eq/kg [6]. The impact of water vapor emissions is very sensitive to the altitude of emission, so for aircraft emissions, the GWP-index will be much higher [6]. For the operation of aircraft at high altitudes, ≈4 kg CO2eq/kg water vapor is assumed based on the relation between the absorption of thermal radiation of water vapor and carbon dioxide [7] (p. 2, Figure 1). It is judged that the integral area (representing absorption and scattering) of water vapor is around four times larger than for carbon dioxide. However, both negative and positive forcings (e.g., from water vapor) may occur due to aircraft emissions in different parts of the year in northern mid-latitudes [13]. It can be argued that a smaller value than 4 kg shall be used even for high altitudes due to the cooling effects of water vapor in the troposphere. This will be checked in a sensitivity analysis.
2.1. Inventory of Emissions from Air Transport at High Altitudes in the Atmosphere
Table 1 shows a rather aged inventory which is still useful for the present research, which deals with methodological principles.
In Table 1, Soot is assumed to be Particulate Matter <2.5µm (PM2.5) for the sake of simplicity and that the points to be made do not require new measured data. Some of the substances emitted listed in Table 1 contribute to the ILCD impact categories “Photochemical ozone formation”, “Acidification”, “Terrestrial eutrophication” and “Marine eutrophication”. The normalization and weighting and comparison to “Particulate Matter” and “Climate Change” is out of our scope but will be commented on shortly. The same applies to the corresponding impact categories of the EF Method [2].
2.2. State-of-the-Art and Proposed Normalization and Characterization Factors
Table 2 shows the different characterization indexes used for water vapor and normalization factors for Particulate Matter in ILCD.
Table 3 shows the characterization indices for Particulate Matter and Respiratory Inorganics used in the present research.
3. Results
Here follow the results for baseline and alternate normalization and characterization applied to airplane emissions.
Table 4 shows the equally weighted results of the inventory in Table 1 using data from [3] for ILCD for the characterization (Table 3) of all substances and normalization factors for both impact categories, particle matter and climate change. Those impacts categories have an equal weight of 6.66.
Table 5 shows the unevenly weighted results of the inventory in Table 1 using data from [3] for ILCD for the characterization factors per kg of all substances except water vapor. The normalization factor used for Particulate Matter in Table 5 is 7.83 × 10⁻³ capita/kg PM2.5eq. (corresponds to 127.6 kg PM2.5eq./capita) instead of 0.263, which is applied in Table 4. For Climate Change, 1.28 × 10⁻⁴ capita/kg CO2eq. [2] (corresponds to 7760 kg CO2eq./capita) is used instead of 1.08 × 10⁻⁴ [3]. While 9.54 and 22.19 [2] are used as weighting factors for Particulate Matter and Climate Change, respectively.
As shown in Figure 1, the difference between Table 4 and Table 5 is that normalizing the emissions belonging to the Particulate Matter impact category by the total amount (944.3 million tonnes per 7.4 billion people, i.e., 7.83 × 10⁻³ capita/kg) decreases the importance of this category in ILCD evaluations. No weighting in Figure 1 means equal weighting of all impact categories.
Table 6 shows the unevenly weighted results of the inventory in Table 1 using data from [2,15] for the EF Method for the characterization factors per kg of all substances. As weighting factors, 9.54 and 22.19 [2] are used for Respiratory Inorganics and Climate Change, respectively. The weighted result for carbon dioxide (0.4 in Table 6) is identical with Table 5, in which carbon dioxide is 0.4 of 1.05 mPts.
Table 7 shows the unevenly weighted results of the inventory in Table 1 using data from [1] for the EF Method for the characterization factors per kg of all substances except water vapor. As weighting factors, 9.54 and 22.19 [1] are used for Respiratory Inorganics and Climate Change, respectively. The weighted result for Climate change (1.05 in Table 7) is identical with Table 5, in which water vapor is 0.65 of 1.05 mPts.
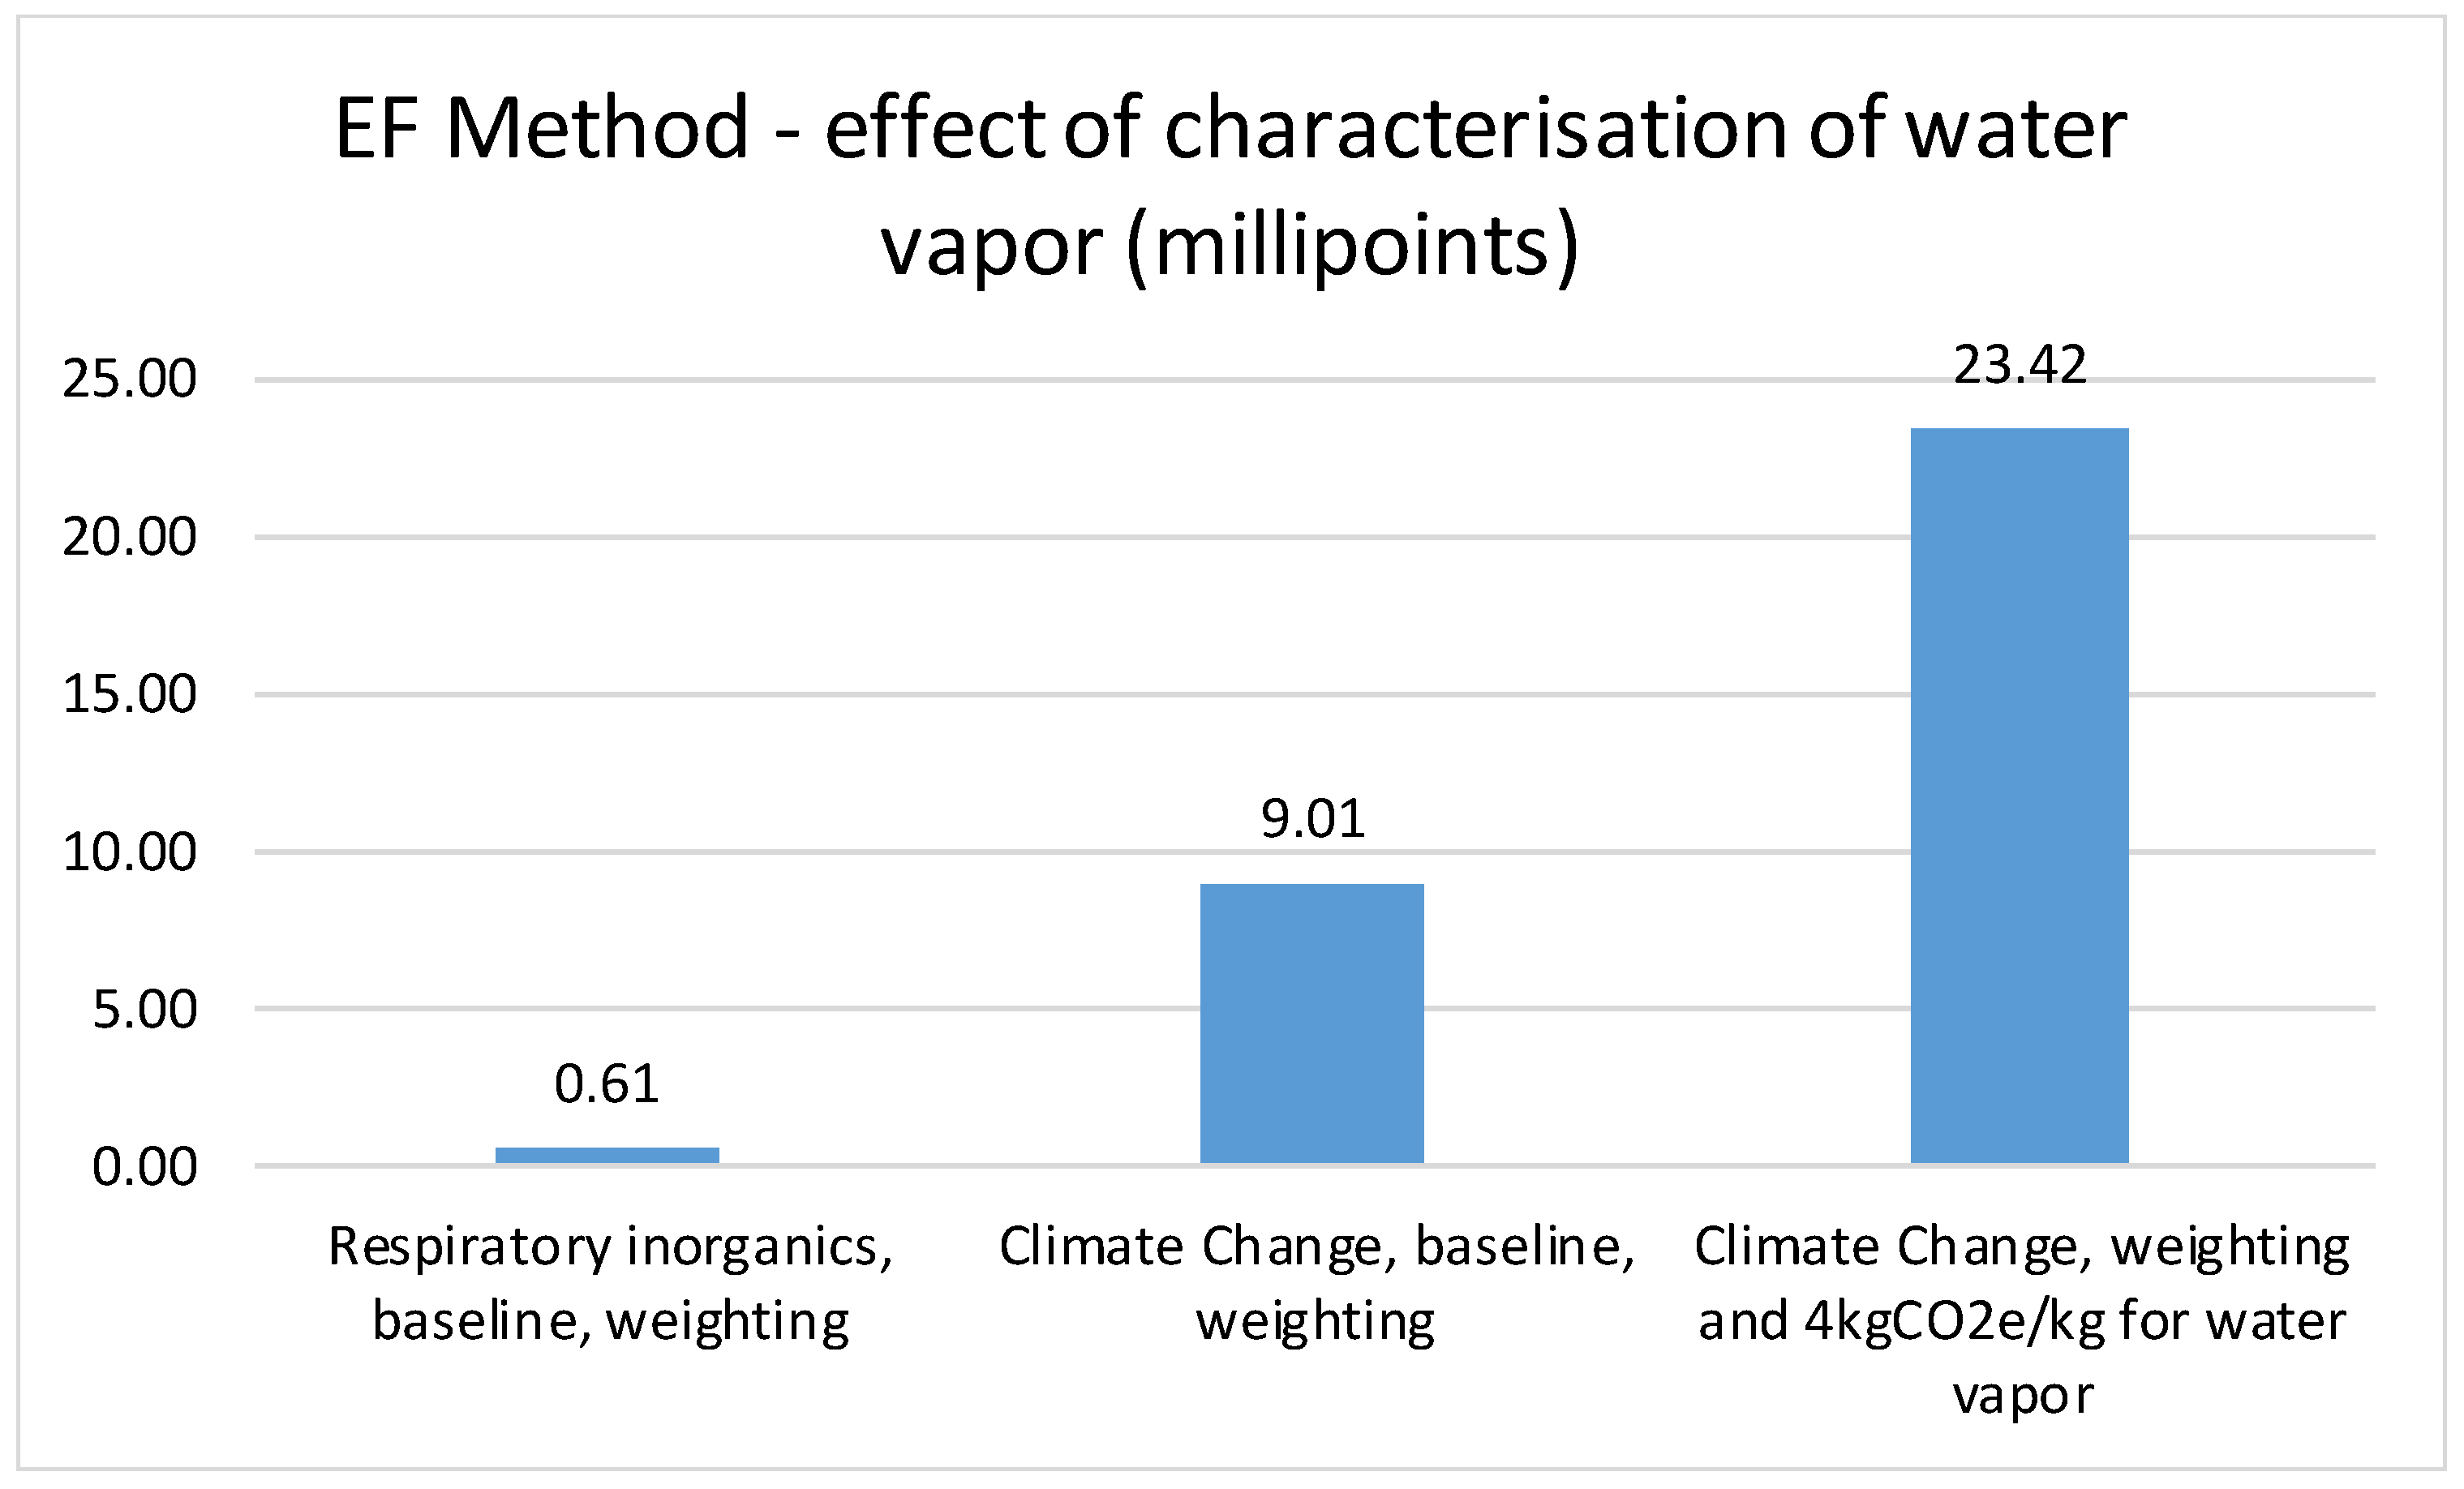
As shown by Figure 2, the difference between Table 6 and Table 7 shows the effect of water vapor characterization, increasing the result by 160%. The weighted result for Respiratory Inorganics seems more reasonable than for Particulate Matter in Table 5. However, the amount of globally generated disease incidents from PM2.5 may be underestimated in the EF Method.
4. Discussion
Water vapor is emitted in a large number of processes used in Life Cycle Assessment (LCA), such as transports, material production and certain power production. This is rooted in the combustion of hydrocarbons but also in cooling. The effect of water vapor on GWP100 mid-point indicator results and weighted results should be investigated more in LCA and LCIA. Likely, water vapor’s share of most processes is similar to nitrous oxide when using 0.001 kgCO2eq/kg [6]. Then it may be ignored for ground-level processes emitting water vapor. This may include future water emissions from fuel cells [16,17]. Air traffic stratospheric emissions is another story as far as the preliminary findings herein.
The weighted result for climate change (23.4 mPts in Table 7 and Figure 2) for the EF method will decline to 12.6 mPts if 1 kgCO2eq/kg (same as carbon dioxide) is used instead of 4 kgCO2eq/kg for water vapor. Still, this is a 40% increase compared to the baseline (9.01 mPts) in Table 6 and Figure 2.
Earth’s atmosphere consists of around 0.25% water vapor [18] (Table 1.3) and 0.04% carbon dioxide, i.e., there is on average around six times more water vapor than carbon dioxide. Water vapor and clouds contribute to around 75% of the total greenhouse effect and carbon dioxide around 20% [12]. Arithmetically, this suggests that water vapors’ (including clouds) global warming potential per kg in the atmosphere is some 0.6 kgCO2eq/kg. If the GWP100 characterization factor for water vapor is reduced to 0.6 and 0.1 kgCO2eq/kg, respectively, 24% and 4% increases compared to the baseline millipoint score are obtained. Despite the fact that water vapors’ GWP compared to carbon dioxide depends on several factors—such as point of emission, concentration in the atmosphere and physical state—the contribution to GWP100 seems noticeable in specific LCIA studies involving emissions at high altitudes.
Opposite to carbon dioxide, water vapor has very different GWP depending on the point of emission. Therefore, scaled characterization indexes for the mid-point indicator GWP100 should be developed and used. This is similar to particulates emitted near the ground from automobiles or trucks, which (should) have other characterization indexes (disease incident/kg) than particles emitted from a very high chimney outside the city centers. This is reflected in [15].
The EF method for Respiratory Inorganics—proposing disease incidents/kg factors for each substance belonging to Respiratory Inorganics—is similar to acidification in which the proton release potential of each acidifying substance is estimated [19]. There is a trend away from PM2.5-equivalents and SO2-equivalents moving towards measures without scaling on one substance.
Several issues remain to be discussed regarding characterization and normalization. PM2.5 is much analyzed for health and premature death consequences [20]. Other Respiratory Inorganics have similar properties as PM2.5. Is it then better to have one impact category each for every Respiratory Inorganic substance (nitrogen oxides, carbon monoxide, etc.) instead of merging them all into one impact category, Particulate Matter or Respiratory Inorganics? If the premature deaths due to PM2.5 can be isolated from deaths caused by other sources, why merge? ILCD Particulate Matter refers to health consequences and deaths of other substances compared to PM2.5. Still, the normalization considers only the global emissions of PM2.5 (≈38.22 billion kg or 26.22 billion kg) and not “all” air pollutants, which are included in the ILCD Particulate Matter mid-point category (944 billion kg per year). Normalizing with the total emitted amount of all substances in the Particulate Matter category underestimates the impact category, as shown in Table 4 and Table 5. As shown by Table 4 and Table 6, the baseline normalization scores for ILCD and the EF Method are similar (0.36 and 0.6 millipoints). For Respiratory Inorganics in the EF Method, the normalization is based on “all” global disease incidents per year caused by “all” air pollutants, ≈4.39 million.
However, this value is less than half of recently estimated [20] global premature deaths due to one compound PM2.5, ≈10.2 million. Using 7.4 billion people and 10.2 million disease incidents in Table 6 and Table 7 would decrease the weighted scores for Respiratory Inorganics from 0.6 to 0.28 millipoints. This is counterintuitive as more deaths should lead to higher importance.
For a more transparent normalization in ILCD and EF method both, it would be appropriate to focus on one air pollutant at a time as far as health impacts of Respiratory Inorganics.
Regarding the mid-point indicators ILCD Particulate Matter and EF Method Respiratory Inorganics, a particular instance is that the mid-point is defined as a disease incident which is usually more toward the end-point.
Another issue is that the normalization for Particulate Matter in ILCD 2011 Mid-point+ is based on the emissions of PM2.5 alone. More fair is to add several (black carbon, carbon monoxide, nitrogen oxides, sulfur dioxide, organic carbon, PM2.5 and PM10 monitored in [11]) which belong to particulate emissions.
Perhaps it is more robust to estimate the disease incidents’ potential per particle type per kg (EF Method) than relate each particle’s disease incidents’ potential compared to PM.2.5 (ILCD). Nevertheless, as shown by Table 3, both methods (ILCD and EF Method) have a similar relative scoring, e.g., for nitrogen oxides compared to PM2.5, 0.00722 for ILCD and 0.00672 for the EF Method. In fact, Particulate Matter in ILCD is based on the quantification of the impact of premature death or disability that particles and Respiratory Inorganics have on the global population in comparison to PM2.5 [4]. This is close to the disease incidents principle. The total global disease incidents due to smog and particles is monitored, e.g., in cities. That is why disease incidents may be regarded as a mid-point, albeit caused by different kinds of particles and substances.
For Respiratory Inorganics, disease incidents for individual emissions are explained as “the indicator is calculated applying the average slope between the Emission Response Function (ERF) working point and the theoretical minimum risk-level” [5]. These disease incidents are used instead of kg PM2.5-equivalents. The previous EF method and ILCD both generate rather realistic results for Particulate Matter and Respiratory Inorganics, respectively. The relation to other mid-point categories is currently reasonable in [2] and [3] despite improvement potentials. Regardless, the number of premature deaths should be better allocated to different specific emissions.
5. Conclusions
Water vapor may significantly increase the GWP100 indicator scores of air transport. However, below 0.1 kgCO2eq./kg, water vapor seems insignificant for air transport. Air pollutants, such as Respiratory Inorganics including particles, are rather well handled at the mid-point, but more specific data for normalization would improve the mid-point indicators. For a more transparent normalization, it would be appropriate to focus on one air pollutant at a time as far as the health impacts of Respiratory Inorganics. The number of premature deaths should be better allocated to different specific emissions. Respiratory Inorganics may need one impact category, each starting with PM2.5.
6. Outlook
Several issues in LCIA seem to face challenges when it comes to the actual measurement or exactly which statistics to be used. Each mid-point indicator and beyond in the EF Method should be reviewed, checking how repeated global measurements can be facilitated. If present indicators are problematic or incomprehensive, new ones that can in full be based on research and measurements need to be developed. LCA needs to use better measurements done in other disciplines where relevant. It is recommended to analyze one compound at a time and then look for the big picture.
Funding
This research received no external funding.
Institutional Review Board Statement
Not applicable.
Informed Consent Statement
Not applicable.
Data Availability Statement
Not applicable.
Conflicts of Interest
The author declares no conflict of interest.
References
- Hauschild, M.Z.; Goedkoop, M.; Guinée, J.; Heijungs, R.; Huijbregts, M.; Jolliet, O.; Pant, R. Identifying best existing practice for characterization modeling in life cycle impact assessment. Int. J. Life Cycle Assess. 2013, 18, 683–697. [Google Scholar] [CrossRef]
- European Commission. Single Market for Green Products Initiative. Available online: https://ec.europa.eu/environment/eussd/smgp/pdf/PEFCR_guidance_v6.3.pdf (accessed on 26 June 2021).
- European Platform on Life Cycle Assessment. Available online: https://eplca.jrc.ec.europa.eu/LCDN/developerILCD.xhtml (accessed on 5 August 2021).
- Spadaro, J.V.; Rabl, A. Air pollution damage estimates: The cost per kilogram of pollutant. Int. J. Risk Assess. Manag. 2002, 3, 75–98. [Google Scholar] [CrossRef]
- Fantke, P.; McKone, T.E.; Tainio, M.; Jolliet, O.; Apte, J.S.; Stylianou, K.S.; Evans, J.S. Global effect factors for exposure to fine particulate matter. Environ. Sci. Technol. 2019, 53, 6855–6868. [Google Scholar] [CrossRef] [PubMed]
- Sherwood, S.C.; Dixit, V.; Salomez, C. The global warming potential of near-surface emitted water vapour. Environ. Res. Lett. 2018, 13, 104006. [Google Scholar] [CrossRef]
- Wei, P.S.; Chiu, H.H.; Hsieh, Y.C.; Yen, D.L.; Lee, C.; Tsai, Y.C.; Ting, T.C. Absorption coefficient of water vapor across atmospheric troposphere layer. Heliyon 2019, 5, e01145. [Google Scholar] [CrossRef] [PubMed] [Green Version]
- Shindell, D.T. Climate and ozone response to increased stratospheric water vapor. Geophys. Res. Lett. 2001, 28, 1551–1554. [Google Scholar] [CrossRef]
- Ravishankara, A.R.; Daniel, J.S.; Portmann, R.W. Nitrous oxide (N2O): The dominant ozone-depleting substance emitted in the 21st century. Science 2009, 326, 123–125. [Google Scholar] [CrossRef] [PubMed] [Green Version]
- Takahashi, K.; Dodbiba, G.; Takeda, T.; Furuyama, T.; Fujita, T. Assessing different recycling options for plastic wastes from discarded mobile phones in the context of LCA. Res. Process. 2007, 54, 29–34. [Google Scholar] [CrossRef] [Green Version]
- European Commission-EDGAR-Emissions Database for Global Atmospheric Research. Available online: https://edgar.jrc.ec.europa.eu/air_pollutants (accessed on 26 June 2021).
- Schmidt, G.A.; Ruedy, R.A.; Miller, R.L.; Lacis, A.A. Attribution of the present-day total greenhouse effect. J. Geophys. Res. Atmosph. 2010, 115. [Google Scholar] [CrossRef]
- Fortuin, J.P.F.; van Dorland, R.; Wauben, W.M.F.; Kelder, H. Greenhouse effects of aircraft emissions as calculated by a radiative transfer model. Ann. Geophys. 1995, 13, 413–418. [Google Scholar] [CrossRef]
- Schumann, U. On the effect of emissions from aircraft engines on the state of the atmosphere. Ann. Geophys. 1994, 12, 265–384. [Google Scholar] [CrossRef]
- European Platform on Life Cycle Assessment. Available online: https://eplca.jrc.ec.europa.eu/permalink/EF-LCIAMethod_CF(EF-v3.0).xlsx (accessed on 26 June 2021).
- Gencoglu, M.T.; Ural, Z. Design of a PE.M fuel cell system for residential application. Int. J. Hydrog. Energy 2009, 34, 5242–5248. [Google Scholar] [CrossRef]
- Liu, X.; Reddi, K.; Elgowainy, A.; Lohse-Busch, H.; Wang, M.; Rustagi, N. Comparison of well-to-wheels energy use and emissions of a hydrogen fuel cell electric vehicle relative to a conventional gasoline-powered internal combustion engine vehicle. Int. J. Hydrogon Energy 2020, 45, 972–983. [Google Scholar] [CrossRef]
- Speight, J.G. Inorganic chemicals in the environment. In Environmental Organic Chemistry for Engineers; Butterworth-Heinemann: Oxford, UK, 2017; pp. 1–49. [Google Scholar] [CrossRef]
- Huijbregts, M.A.; Schöpp, W.; Verkuijlen, E.; Heijungs, R.; Reijnders, L. Spatially explicit characterization of acidifying and eutrophying air pollution in life-cycle assessment. J. Ind. Ecol. 2000, 4, 75–92. [Google Scholar] [CrossRef]
- Vohra, K.; Vodonos, A.; Schwartz, J.; Marais, E.A.; Sulprizio, M.P.; Mickley, L.J. Global mortality from outdoor fine particle pollution generated by fossil fuel combustion: Results from GEOS-Chem. Environ. Res. 2021, 195, 110754. [Google Scholar] [CrossRef] [PubMed]
Figure 1.
ILCD 2011 Mid-point+ results per kg fuel for air transport.
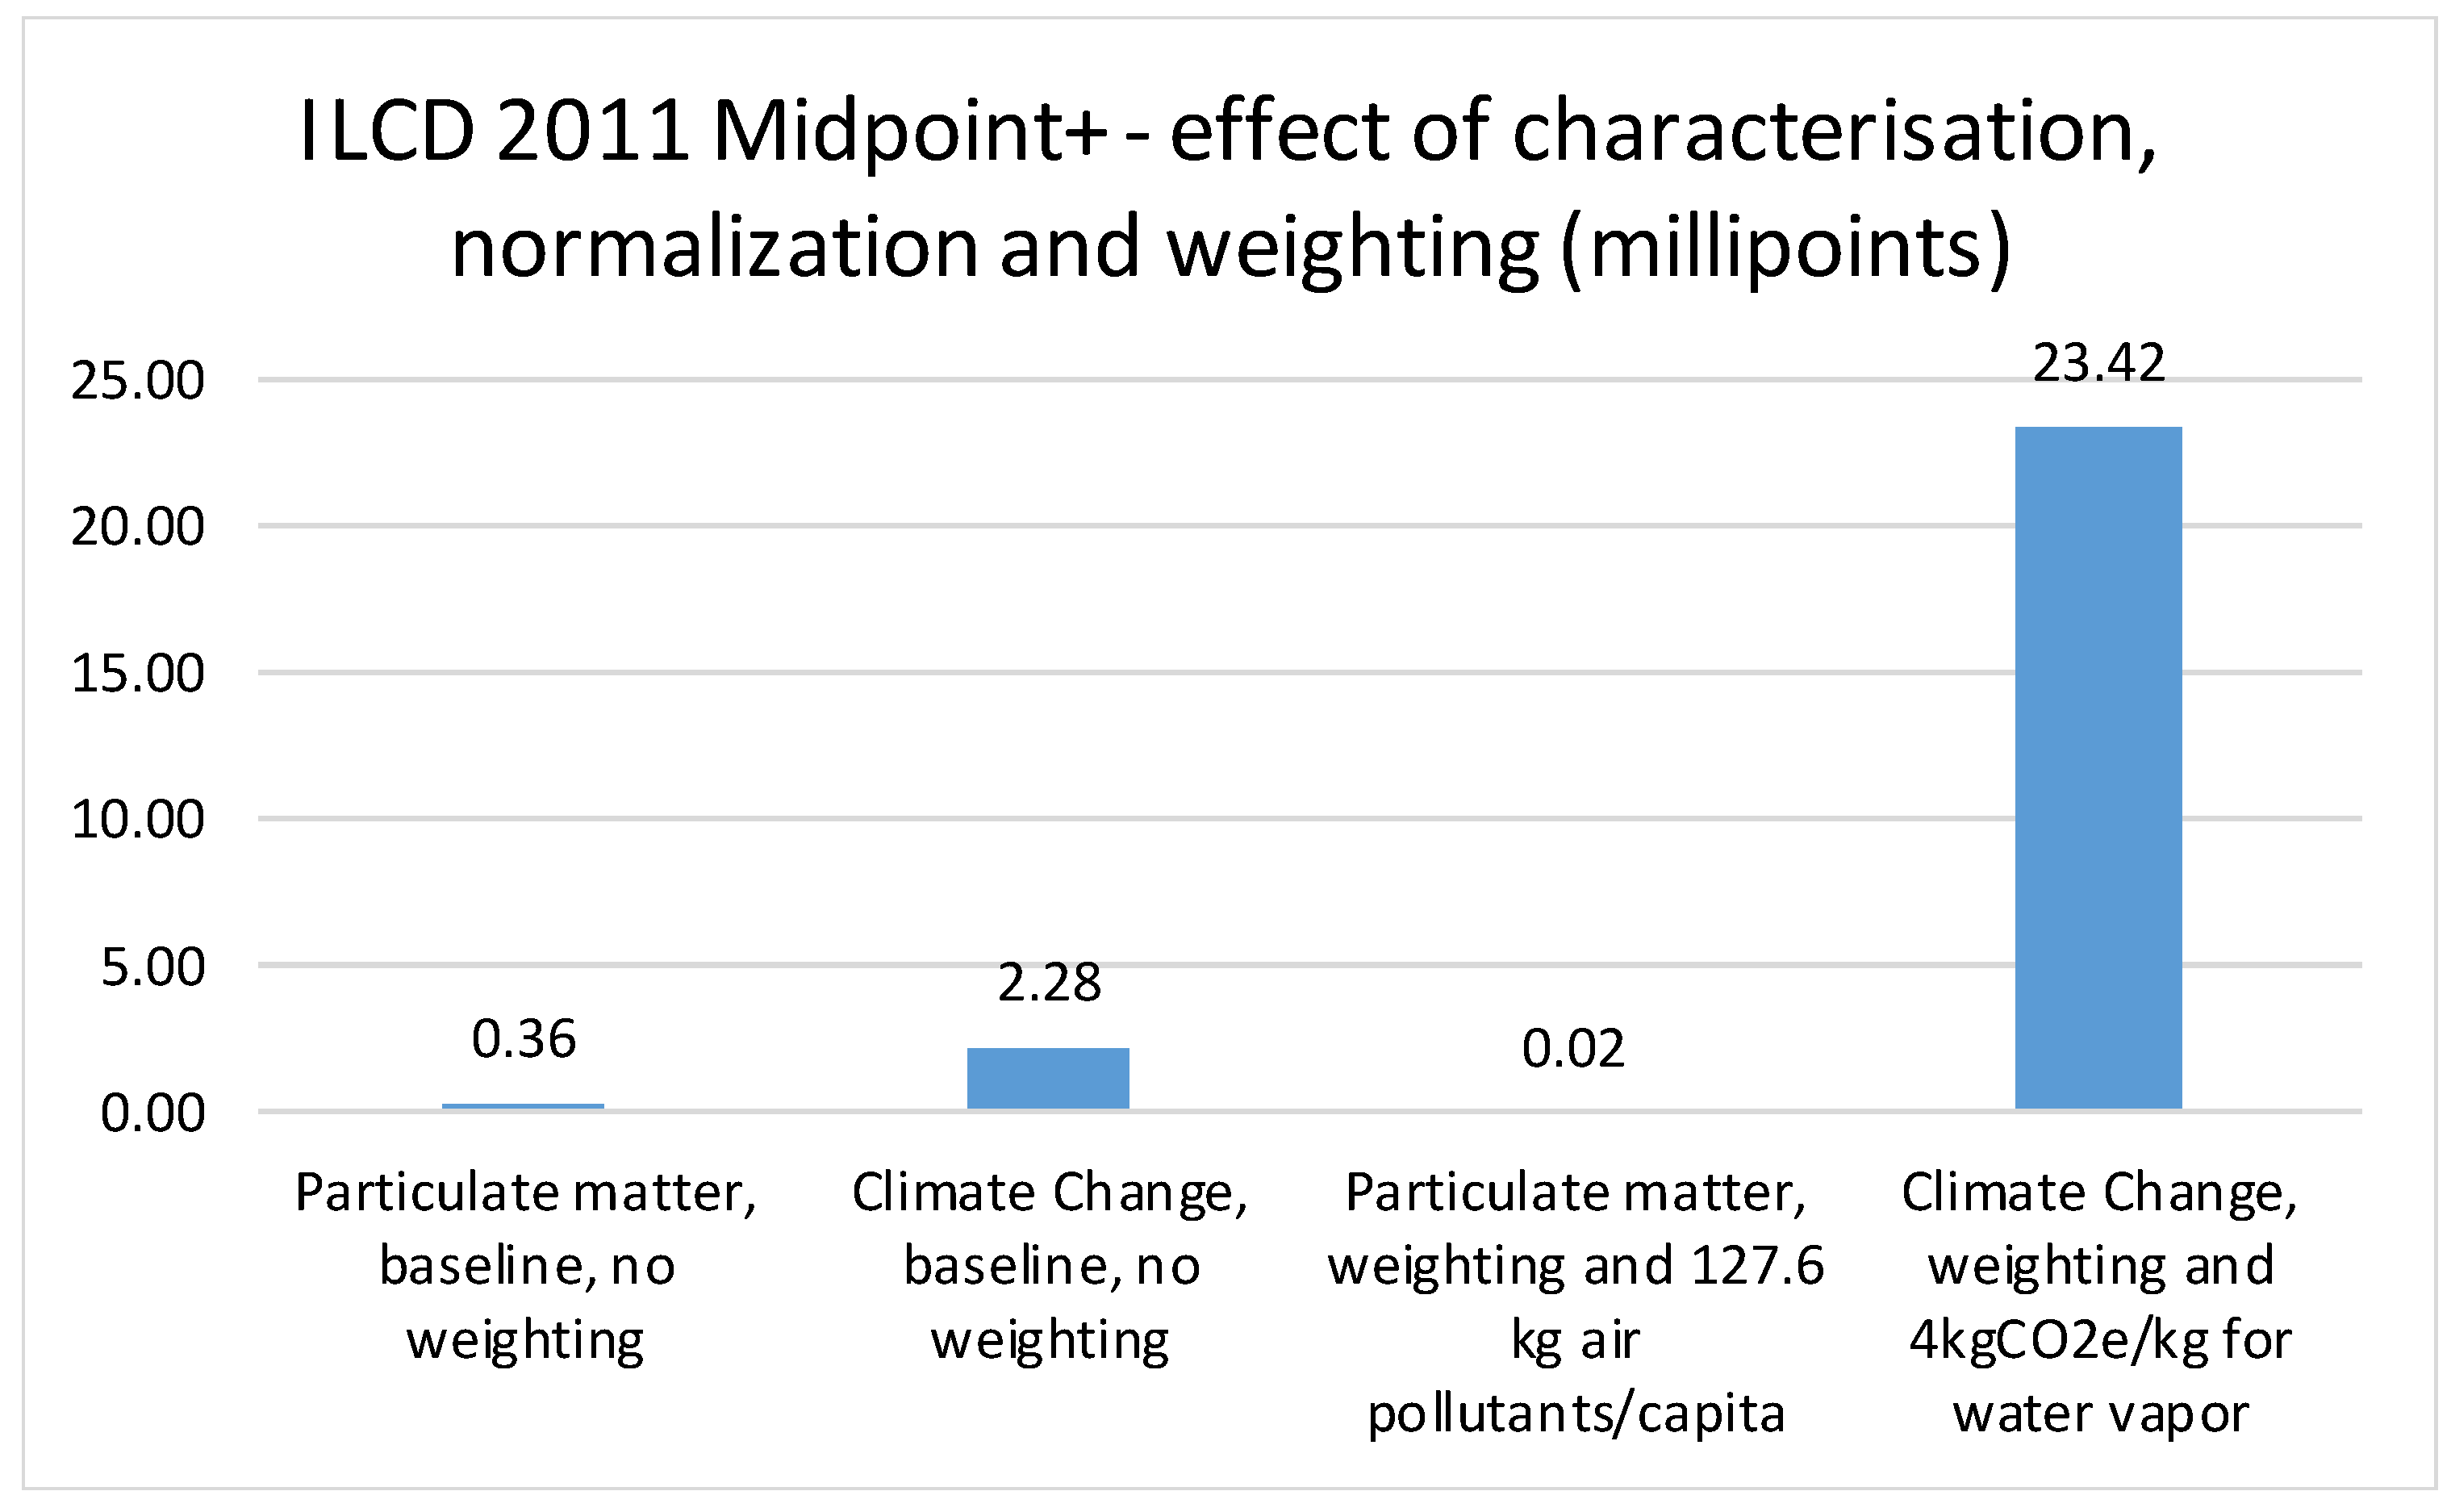
Figure 2.
EF method results per kg fuel for air transport.


Table 1.
Typical emissions per kg fuel for air transport.
| Emission | Emission Index (g Emission per kg Fuel) | Reference |
|---|---|---|
| Soot | 0.015 | [14] (p. 370, Table 1) |
| Nitrogen oxides | 18 | |
| Sulfur dioxide | 1 | |
| Carbon monoxide | 1.5 | |
| Carbon dioxide | 3150 | |
| Water vapor | 1260 |
Table 2.
Characterization factors for water vapor and normalization factors particulate matter.
| Category | Value | Proposed |
|---|---|---|
| GWP100 | 0 kg CO2eq/kg for water vapor emissions characterization factor, 7760 kg CO2eq/capita per year, normalization factor per person [2] | 4 kg CO2eq/kg for water vapor, 7760 kg CO2eq/capita per year |
| Particulate matter | 3.8 kg PM2.5/capita per year, normalization factor per person [3], (26.22 billion kg/6.9 billion people) | 127.6 kg particles and air pollutants/capita per year (person global normalization, 944.3 billion kg [11]/7.4 billion people). |
Table 3.
Characterization indices for emissions per kg fuel for air transport related to Particulate Matter and Respiratory Inorganics impact categories.
Table 3.
Characterization indices for emissions per kg fuel for air transport related to Particulate Matter and Respiratory Inorganics impact categories.
| Emission | Characterization Index (kg PM2.5-eq. per kg) [3] | Characterization Index (Disease Incidents per kg) [15] |
|---|---|---|
| Soot | 1 | 0.000238 |
| Nitrogen oxides | 0.00722 | 0.0000016 |
| Sulfur dioxide | 0.0611 | 0.000008 |
| Carbon monoxide | 0.000356 | 0 |
Table 4.
Baseline approach ILCD 2011 Mid-point+.
| Baseline GWP100 (kgCO2eq) | Baseline Particulate Matter (kgPM2.5eq) | Normalization Baseline (mPts) Sum | Weighting Baseline (mPts) | |
|---|---|---|---|---|
| Soot | ≈0 | 1.5 × 10⁻⁵ | 2.07 × 10−4 × 0.263 = 0.0543 | 0.0543 × 6.66 = 0.36 for Particulate Matter |
| Nitrogen oxides | ≈0 | 0.018 × 0.00722 = 1.3 × 10⁻⁴ | ||
| Sulfur dioxide | ≈0 | 6.1 × 10⁻⁵ | ||
| Carbon monoxide | ≈0 | 5.3 × 10⁻⁷ | ||
| Carbon dioxide | 3.15 | 3.15 × 1.08 × 10−4 × 1000 = 0.34 | 0.34 × 6.66 = 2.27 for Climate Change | |
| Water vapor | 0 |
Table 5.
Proposed approach for ILCD 2011 Mid-point+.
| Modified GWP100 (kgCO2eq) | Baseline PM (kgPM2.5eq) | Normalization Proposed (mPts) Sum | Weighting Proposed (mPts) | |
|---|---|---|---|---|
| Soot | ≈0 | 1.5 × 10⁻⁵ | 2.07 × 10−4 × 7.83 × 10−3 = 0.00154 | 0.00154 × 9.54 = 0.015 for Particulate Matter |
| Nitrogen oxides | ≈0 | 1.3 × 10⁻⁴ | ||
| Sulfur dioxide | ≈0 | 6.1 × 10⁻⁵ | ||
| Carbon monoxide | ≈0 | 5.3 × 10⁻⁷ | ||
| Carbon dioxide | 3.15 | 1.05 | 1.05 × 22.19 = 23.4 for Climate Change | |
| Water vapor | 1.26 × 4 = 5.04 |
Table 6.
Baseline approach EF Method.
| Baseline GWP100 (kgCO2eq) | Baseline Respiratory Inorganics (Disease Incidents, d.i.) | Normalization Baseline (d.i.) Sum | Weighting Baseline (mPts) | |
|---|---|---|---|---|
| Soot | ≈0 | 1.5 × 10−5 × 2.38 × 10−4 = 3.57 × 10⁻⁹ | 4.037 × 10−8 × 6.9 billion people/4.39 million d.i. = 0.063 | 0.063 × 9.54 = 0.6 for Respiratory Inorganics |
| Nitrogen oxides | ≈0 | 2.88 × 10⁻⁸ | ||
| Sulfur dioxide | ≈0 | 8 × 10⁻⁹ | ||
| Carbon monoxide | ≈0 | 0 | ||
| Carbon dioxide | 3.15 | 0.4 | 0.4 × 22.19 = 9 for Climate Change | |
| Water vapor | 0 |
Table 7.
Proposed approach EF Method.
| Baseline GWP100 (kgCO2eq) | Baseline Respiratory Inorganics (Disease Incidents, d.i.) | Normalization Baseline (d.i.) Sum | Weighting Baseline (mPts) | |
|---|---|---|---|---|
| Soot | ≈0 | 3.57 × 10⁻⁹ | 0.063 | 0.6 for Respiratory Inorganics |
| Nitrogen oxides | ≈0 | 2.88 × 10⁻⁸ | ||
| Sulfur dioxide | ≈0 | 8 × 10⁻⁹ | ||
| Carbon monoxide | ≈0 | 0 | ||
| Carbon dioxide | 3.15 | 1.05 | 23.4 for Climate Change | |
| Water vapor | 5.04 |
Publisher’s Note: MDPI stays neutral with regard to jurisdictional claims in published maps and institutional affiliations. |
© 2021 by the author. Licensee MDPI, Basel, Switzerland. This article is an open access article distributed under the terms and conditions of the Creative Commons Attribution (CC BY) license (https://creativecommons.org/licenses/by/4.0/).
Share and Cite
MDPI and ACS Style
Andrae, A. Progress in Life Cycle Impact Assessment: Water Vapor Emissions and Respiratory Inorganics. Sci 2021, 3, 33. https://doi.org/10.3390/sci3030033
AMA Style
Andrae A. Progress in Life Cycle Impact Assessment: Water Vapor Emissions and Respiratory Inorganics. Sci. 2021; 3(3):33. https://doi.org/10.3390/sci3030033
Chicago/Turabian StyleAndrae, Anders. 2021. "Progress in Life Cycle Impact Assessment: Water Vapor Emissions and Respiratory Inorganics" Sci 3, no. 3: 33. https://doi.org/10.3390/sci3030033